Gold Prices Forecast: US Dollar Strength Pressures XAU/USD to Weekly Low

Gold Prices Forecast: US Dollar Strength Pressures XAU/USD to Weekly Low

Rising Dollar and Bond Yields

Gold (XAU/USD) prices took a dip to their lowest in a week as the U.S. dollar neared its six-month pinnacle and U.S. Treasury yields saw an upswing. These moves were spurred by expectations of persistently high-interest rates. Particularly, concerns about China and global growth, which have reduced risk appetite, have propelled the dollar to these levels, making gold pricier for holders of other currencies.

Economic Outlook and Oil Price Surge

As markets resumed after Labor Day, U.S. Treasury yields climbed, with the focal point being the economic future amidst rising oil prices due to extended supply curbs. The possibility of oil hitting the $100 mark is back on the table, causing worries on Wall Street about stocks struggling to outperform Treasuries.

Trading Derivatives carries a high level of risk to your capital and you should only trade with money you can afford to lose. Trading Derivatives may not be suitable for all investors, so please ensure that you fully understand the risks involved, and seek independent advice if necessary. A Product Disclosure Statement (PDS) can be obtained either from this website or on request from our offices and should be considered before entering into a transaction with us. Raw Spread accounts offer spreads from 0.0 pips with a commission charge of USD $3.50 per 100k traded. Standard account offer spreads from 1 pips with no additional commission charges. Spreads on CFD indices start at 0.4 points. The information on this site is not directed at residents in any country or jurisdiction where such distribution or use would be contrary to local law or regulation.

Federal Reserve’s Stance

After a concerning nonfarm payrolls report and evidence of a cooling labor market, the spotlight is now on the upcoming Federal Reserve policy meeting. Despite recent data suggesting the possibility of another interest rate hike, markets anticipate that the Federal Reserve, supported by Governor Christopher Waller’s comments, might keep rates unchanged. Current market sentiment, based on the CME FedWatch tool, places a 93% bet on this steady stance.

Gold’s Diminishing Appeal Amid Global Business Slowdown

Global business activities have reportedly seen a deceleration, driving investors towards the U.S. dollar as a safer bet over gold. This shift is evident as the SPDR Gold Trust, the foremost gold-backed exchange-traded fund, witnessed a 0.1% decline in its holdings.

Short-term Forecast: Bearish

The combination of rising U.S. interest rates and Treasury bond yields has increased the opportunity cost of holding non-yielding gold. Coupled with the strengthened dollar and anticipated policy decisions, the outlook for gold remains bearish in the near term.

Technical Analysis
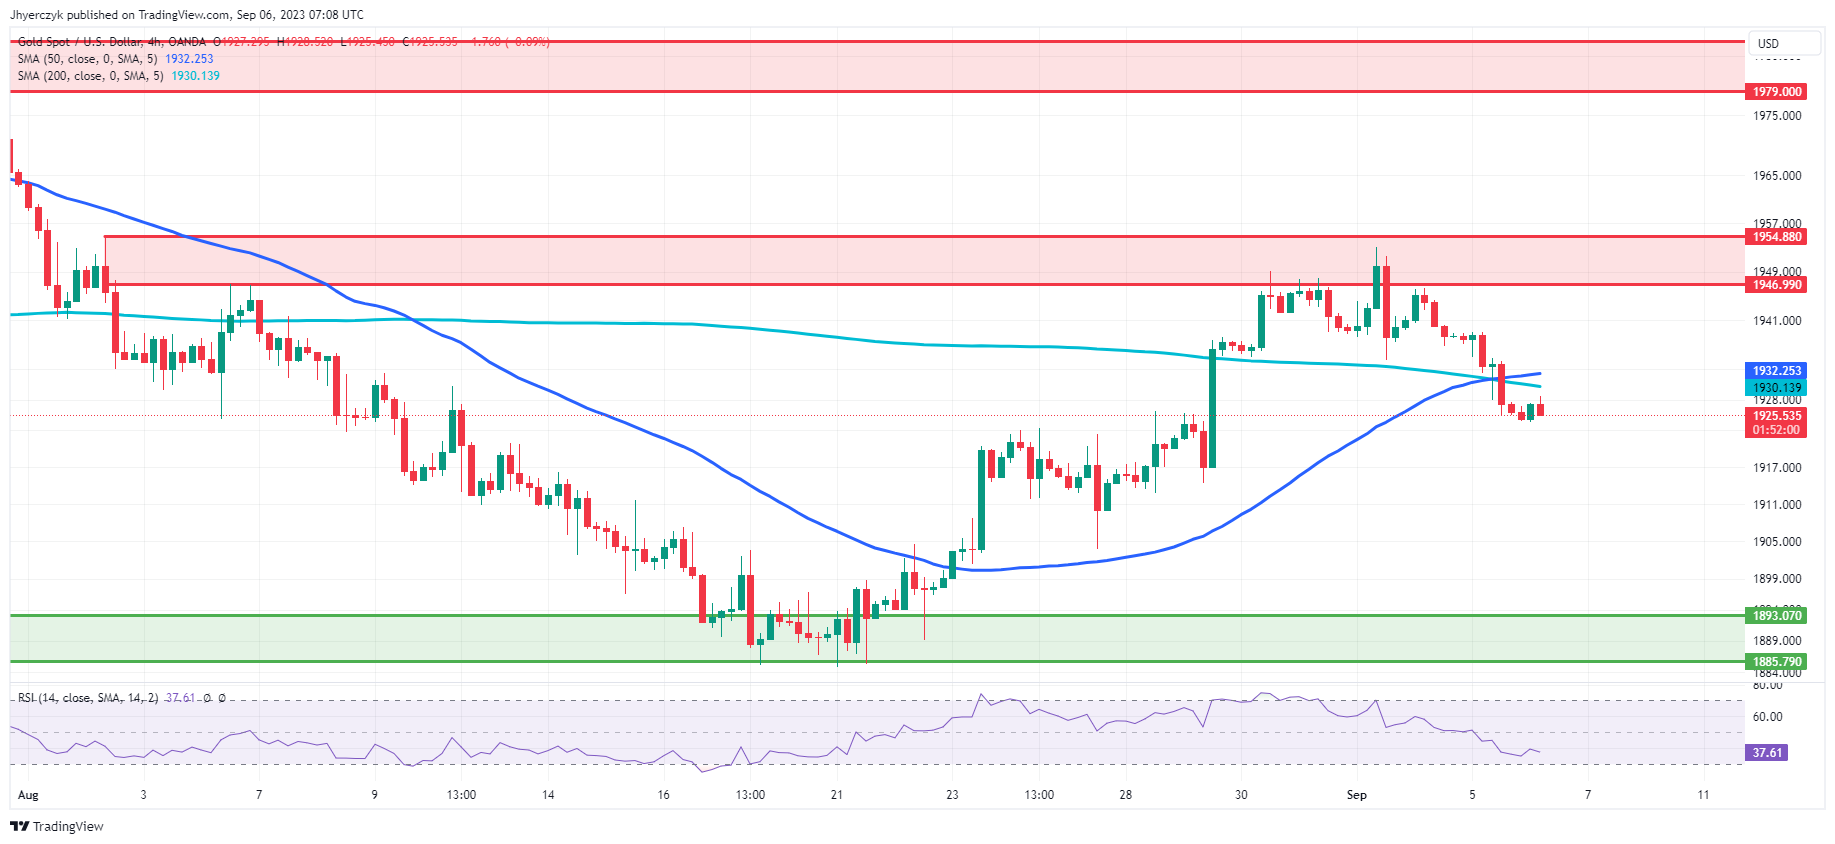
4-Hour Gold (XAUUSD)Gold’s current 4-hour price of 1925.51 sits below both the 200-4H moving average (1930.14) and the 50-4H moving average (1932.25), suggesting a bearish trend. The 14-4H RSI reading at 37.56 indicates weakening momentum but isn’t yet in the oversold territory.

Price-wise, Gold is hovering closer to the main support area (1893.07 to 1885.79) rather than the main resistance area (1946.99 to 1954.88). Given these indicators, current market sentiment for Gold on a 4-hour chart leans bearish.

German Factory Orders Tumbled by 11.7% in July

German Factory Orders Tumbled by 11.7% in July

German Factory Orders

German factory orders were in focus this morning. After an unexpected 7.6% surge in factory orders in June, the weak demand environment suggested a sharp decline in July.

Factory orders slid by 11.7% in July. Economists forecast a 4% decline.

According to Destatis,

  • Orders for the manufacture of other transport equipment slumped by 54.5% (June: +72.4%).
  • Manufacture of computer, electronic, and optical products orders slid by 23.6%.
  • There were also marked declines in orders for machinery (-8.7%), electrical equipment (-16.7%), and fabricated metal products (excl. machinery and equipment) (-14.2%).
  • Orders for the manufacture of motor vehicles, trailers, and semi-trailers increased by 2.7%.
  • Foreign orders declined by 12.9%, while orders from the euro area slumped by 24.4%.
  • There were also falls in orders from the rest of the world (-4.1%) and domestic (-9.7%).

The latest numbers from Germany support rising expectations of a German economic recession. While bets on a September ECB interest rate hike have eased, ECB President Lagarde continues to raise concerns about high inflation.

Declines in the service and manufacturing sectors, combined with reduced factory orders, may prompt ECB hawks to reconsider rate hikes. Increased ECB interest rates would elevate borrowing costs, impacting firms’ margins, investment, and hiring targets.

EUR/USD Reaction to German Factory Orders

Before the factory order report, the EUR/USD fell to a pre-stat low of $1.07131 before rising to a high of $1.07386.

However, in response to the German factory orders, the EUR/USD fell from $1.07380 to a post-stat low of $1.07275.

This morning, the EUR/USD was up 0.08% to $1.07307.

Next Up

Eurozone retail sales will garner interest later today. Economists forecast retail sales to decline by 0.1%. A downward trend in retail sales would ease demand-driven inflationary pressures and ease pressure on the ECB to lift rates higher.

Given current inflation and interest rates, a weaker labor market could lead consumers to spend less, affecting consumption.

Following the latest euro area economic indicators, we expect ECB commentary to also influence ECB policy expectations. ECB Executive Board Member Elizabeth McCaul speaks today.

US ISM Non-Manufacturing PMI to Have the Final Say

The US ISM Non-Manufacturing PMI, crucial for market sentiment, follows PMIs from China and the euro area. A significant slowdown in the US service sector, which comprises over 70% of the economy, could unsettle markets. Economists predict the PMI to drop from 52.7 to 52.5 in August.

While other stats like the finalized S&P Global service, composite PMIs, and trade data are relevant, the ISM Non-Manufacturing PMI is expected to overshadow them.

US Dollar Soars as Yen Sinks on Burgeoning Yield Differential. Higher USD/JPY?

US Dollar Soars as Yen Sinks on Burgeoning Yield Differential. Higher USD/JPY?

The US Dollar roared across the board overnight with Treasury yields taking flight along the curve.

USD/JPY ran to its highest level since November last year in the New York session, topping out at 148.80.

It recoiled lower in early Wednesday trade after comments from Masato Kanda, Japan’s Vice Minister of Finance for International Affairs, the title is colloquially known as Japan’s chief of currency.

On speculative moves in foreign exchange, he said, “if these moves continue, the government will deal with them appropriately.”

The framing of the language has been viewed by the market as softer than that used when the Bank of Japan (BoJ) intervened in USD/JPY late last year.

Most apparent is that the jawboning has begun and may seem likely to get stronger should USD/JPY approach last year’s peak of 151.95.

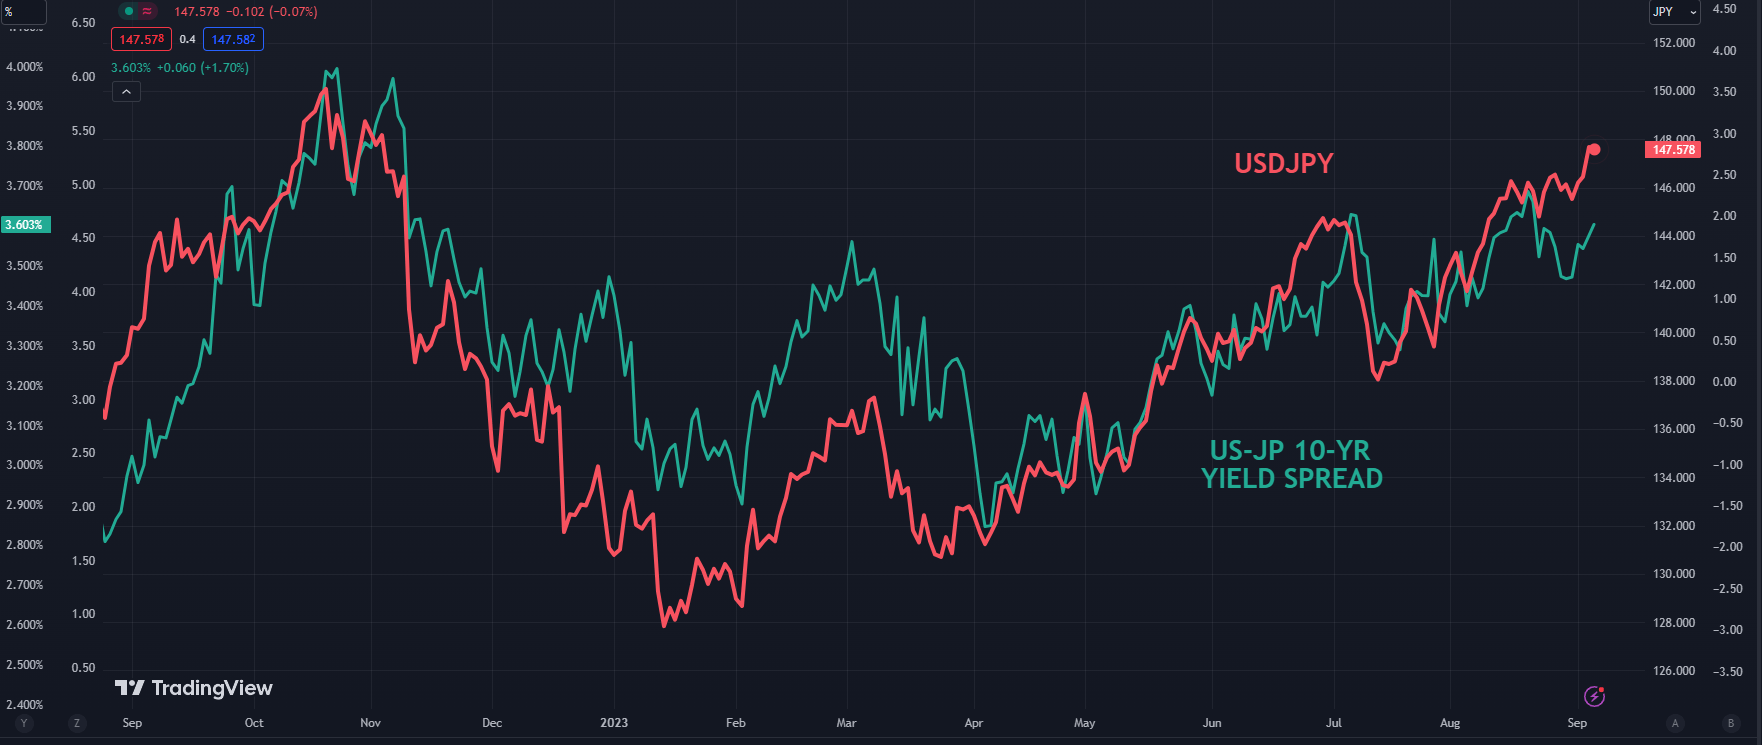
In the meantime, the spread between Treasuries and Japanese Government Bonds (JGB) has been widening but not to the same extent that occurred when USD/JPY hit its peak.

While the 10-year Treasury note is close to where it was in November last year, the JGB yield has been allowed to creep higher.

It is currently near 0.65%, above the 0.50% yield it had previously been anchored to by the BoJ’s yield curve control (YCC) program.

The change in YCC policy was not a directive to adjust the +/- 50 basis points band around zero percent for JGBs out to 10 years, but rather to allow flexibility in the implementation.

Today’s comments from Kanda san might be reflective of an overall tilt in the way Japanese officials are seeking to avoid sudden and excessive volatility toward Yen depreciation.

BoJ board member Hajime Takata also spoke on Wednesday but did little to move the dial in regards to monetary policy.

To learn more about trading USD/JPY, click on the banner above.

Elsewhere currencies exposed to global growth and risk sentiment saw the largest losses overnight with the Australian Dollar leading the way lower in the aftermath of the RBA leaving rates on hold yesterday at 4.10%.

Compounding the outlook for such currencies, the outlook for China continues to be mired in uncertainty around the prospects of the property sector there being able to make a recovery.

The Caixin services PMI missed forecasts yesterday, coming in at 51.8 for August, rather than the 53.5 anticipated and 54.1 previously. The composite PMI was 51.7 against 51.9 prior.

USD/JPY AND YIELD SPREAD BETWEEN 10-YEAR TREASURIES AND JGBS

image1.png


Euro Technical Forecast: EUR/USD and EUR/GBP Drop to Key Support Levels

Euro Technical Forecast: EUR/USD and EUR/GBP Drop to Key Support Levels

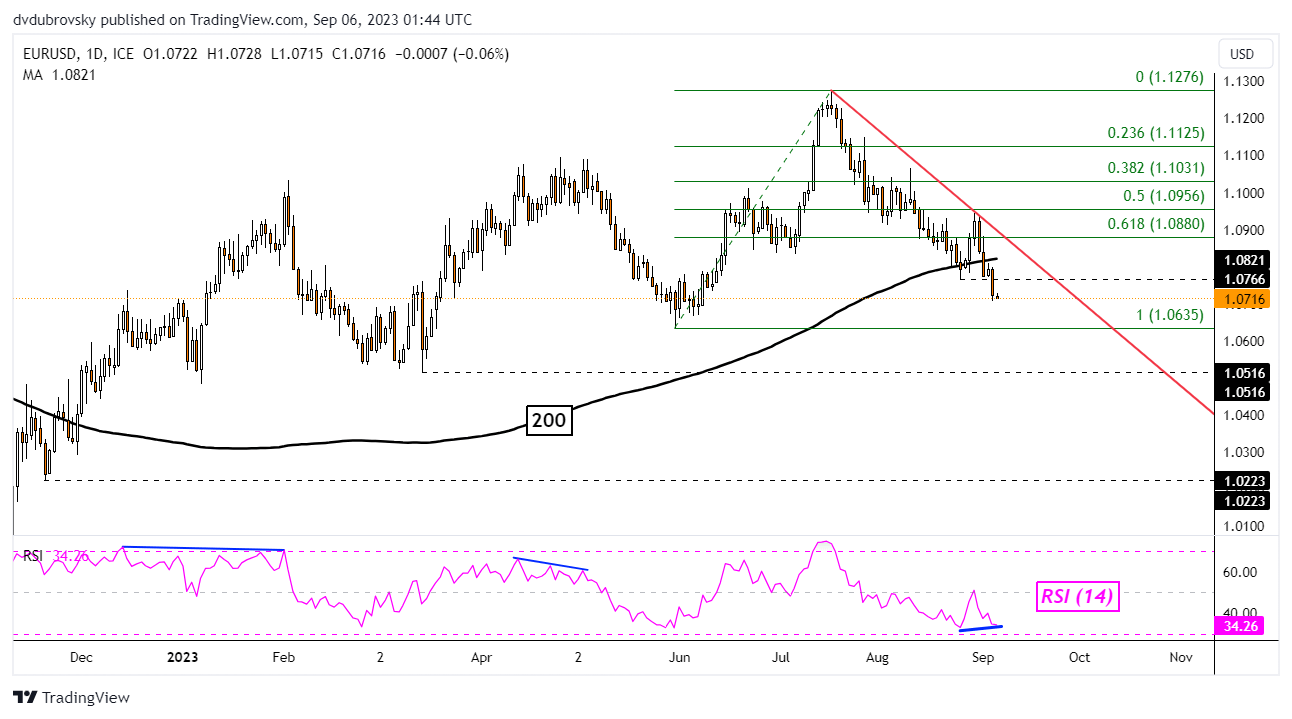
The Euro closed at its lowest against the US Dollar in almost 3 months, extending the downtrend since July. In fact, EUR/USD confirmed a breakout under the 200-day Moving Average. That is offering a stronger bearish technical conviction. Still, the dominant uptrend since late 2022 remains in play. Immediate support from here is 1.0635.

The latter is the May low. If the single currency breaks below this price and confirms the breakout, EUR/USD will effectively end the dominant uptrend since the end of last year, ending the strings of higher highs and higher lows. That would open the door to revisiting the March low of 1.0516. Otherwise, a turn higher from here places the focus on the falling trendline from July.

image1.png

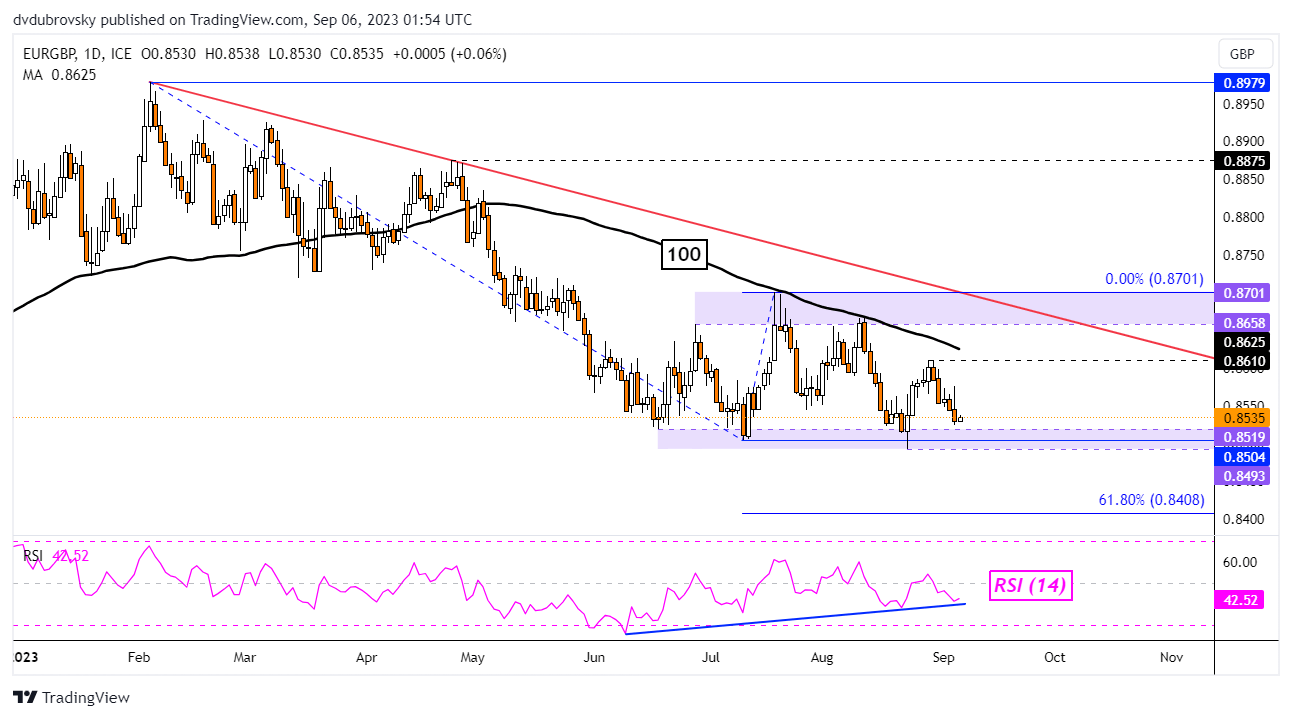
hile, the Euro is also struggling against the British Pound. After establishing new resistance at 0.861, EUR/GBP has been falling towards the key zone of support between 0.8493 and 0.8519. The latter has been holding since June, establishing a zone of consolidation with key resistance as the 0.8658 – 0.8701 range.

With positive RSI divergence brewing, fading downside momentum could open the door to a bounce off support. That would place the focus on the 100-day Moving Average, which can hold as resistance maintaining the broader downside focus since February. Otherwise, clearing through support places the focus on the 61.8% Fibonacci extension level of 0.8408.

image2.png


Australian Dollar Falls as GDP Slows; How Much More Downside for AUD/USD?

Australian Dollar Falls as GDP Slows; How Much More Downside for AUD/USD?

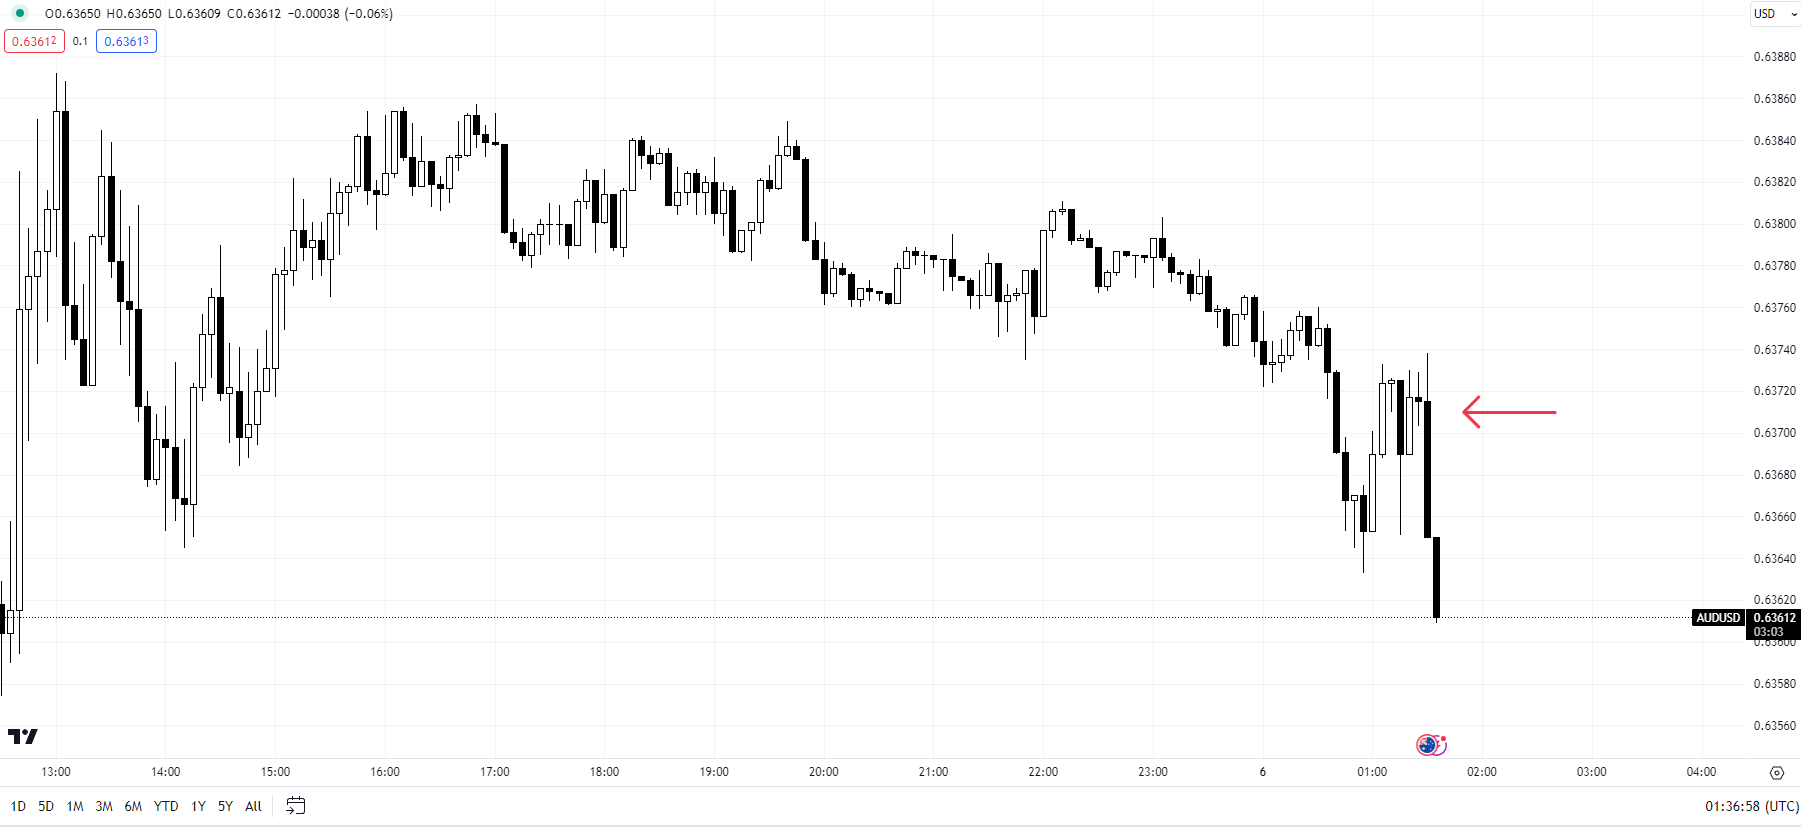
The Australian dollar fell against the US dollar after the Australian economy slowed in the second quarter of the year, reinforcing the growing view that the Reserve Bank of Australia (RBA) is done with hiking interest rates.

The economy grew 2.1% on-year in the April-June quarter from 2.3% in the January-March quarter, compared with 1.8% expected, and 2.7% in the last quarter of 2022. GDP grew 0.4% on-quarter, in line with expectations, after net export volumes expanded more than twice analysts’ expectations as the government spent big on infrastructure during the quarter, offsetting the softness in household consumption.

AUD/USD 5-minute Chart

image1.png

The data trajectory is likely to further strengthen the belief that the RBA will keep interest rates on hold for the rest of the year. At its meeting on Tuesday, the RBA kept interest rates on hold, saying recent data were consistent with inflation returning to the 2-3% target range by 2025, boosting hopes that the tightening cycle was over.

However, the central bank reiterated that further tightening may still be required, though it would depend on the outlook for inflation and the labour market. Australia’s CPI eased more than expected in July, coinciding with the RBA’s view that the worst is probably over for inflation. Markets see a small probability of one last hike before the end of 2023.

Much would depend on the outlook with regard to the Chinese economy, as the RBA noted on Tuesday while keeping the cash rate steady at 4.1%. Chinese policymakers have responded with a spate of support/stimulus measures in recent months, but those measures have yet to have a meaningful impact on sentiment. China is Australia’s largest export destination.

AUD/USD Daily Chart

image2.png

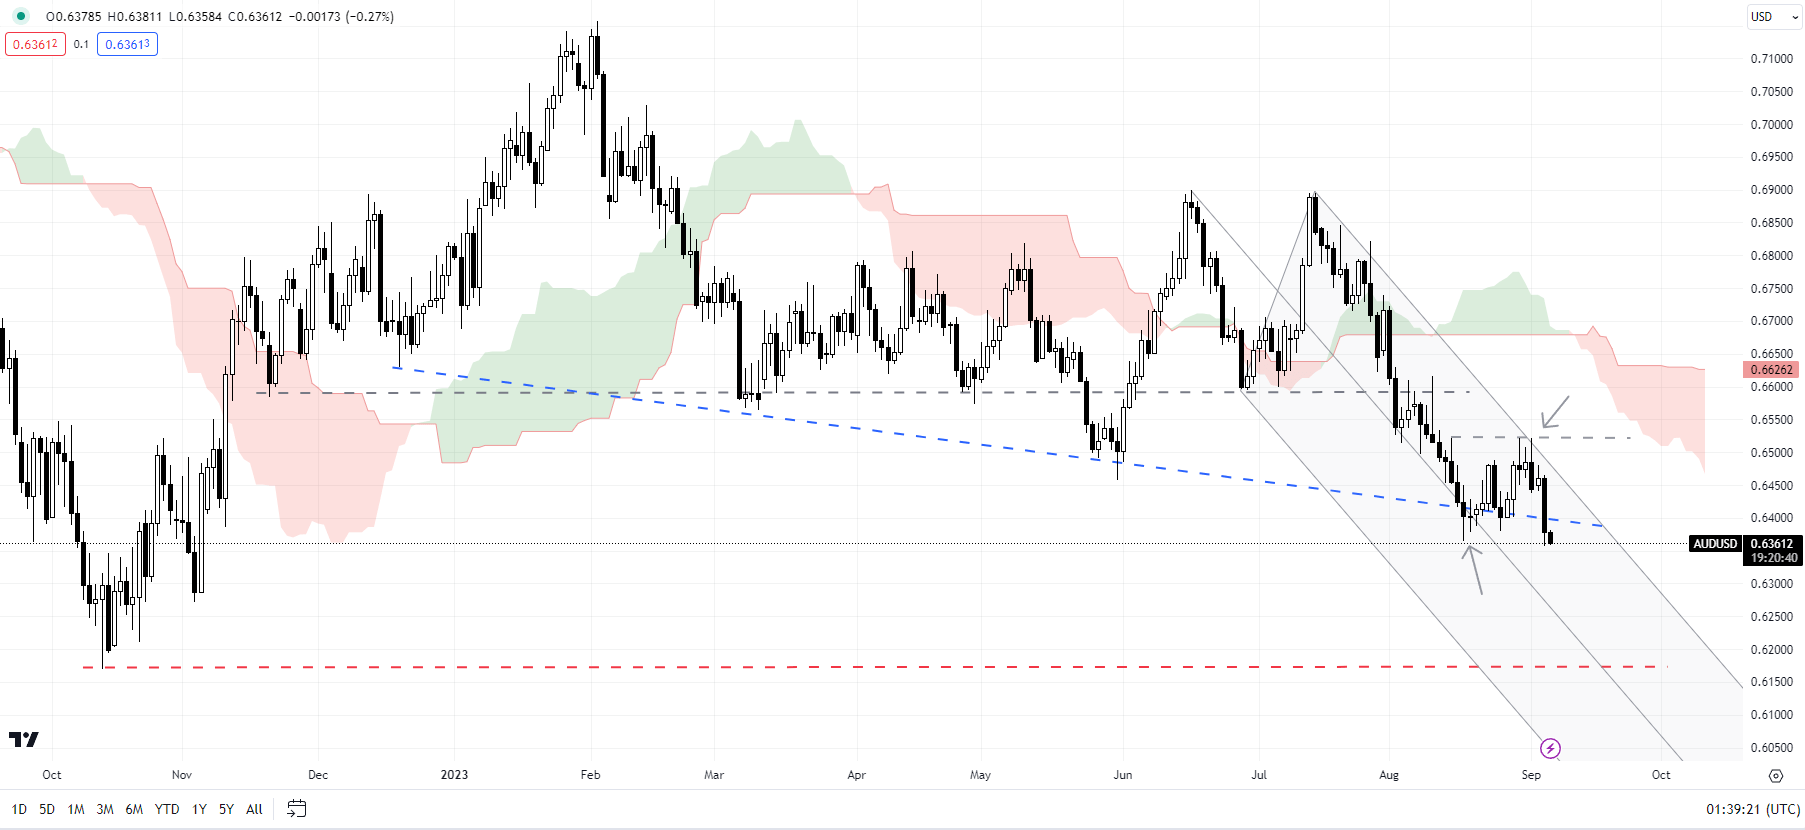
On technical charts, after a brief reprieve, AUD/USD is retesting the multi-month low of 0.6360 hit in August. Any decisive break below could initially pave the way toward the early November 2022 low of 0.6270, with major support at the October 2022 low of 0.6170. On the upside, the pair would need to rise above immediate resistance at last week’s high of 0.6525 for the imminent downward pressure to fade.

Asia Day Ahead: Australia’s GDP Outperforms, Nikkei Eyeing Break of Bullish Flag

Asia Day Ahead: Australia’s GDP Outperforms, Nikkei Eyeing Break of Bullish Flag

US indices started the week on a more subdued tone, with a jump in oil prices to a new 10-month high not providing much reassurances for the global inflation outlook. This follows after major oil producers, Russia and Saudi Arabia, announced to extend voluntary oil cuts to the end of the year, which is a longer timeline than what was initially expected.

The move seems set to widen the current deficit in the oil market further, amid declining inventories in the US and underproduction among some OPEC+ members, with a break in oil prices above its months-long ranging pattern potentially pointing to further upside.

US Treasury yields reacted higher as investors positioned for a high-for-longer rate outlook, with the US dollar rising in-tandem to a new ten-month high. Recent US inflation and jobs data still leave a rate hold from the Federal Reserve (Fed) as the wide consensus for the September meeting, but the Fed’s guidance for policymaking to be on a meeting-by-meeting basis has kept bets of additional tightening in November/December alive.

Ahead, focus will be on the US Institute for Supply Management (ISM) services purchasing managers index (PMI) data today. A softer read from the previous month (est 52.5 versus previous 52.7) may be preferred in showing more tamed demand from US consumers, given the prevailing worries of a resurgence in inflation.

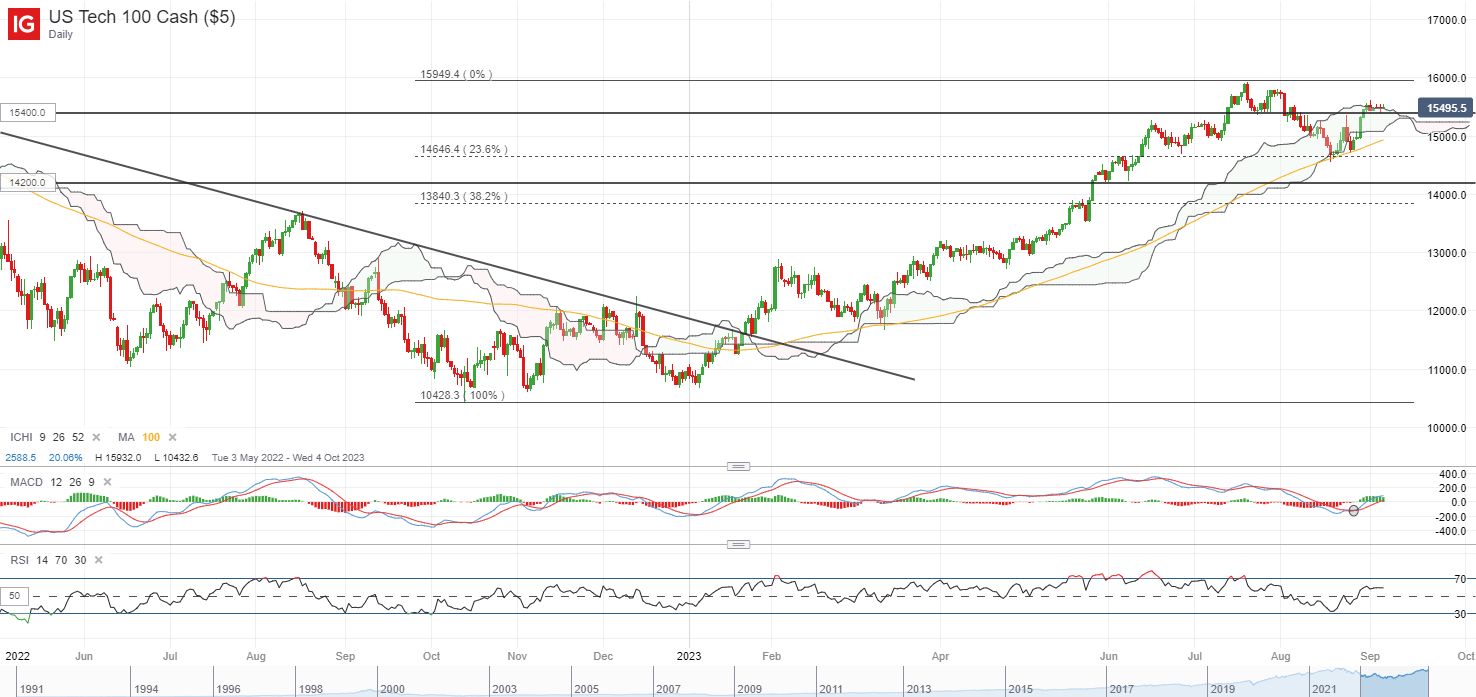
One to watch may be the Nasdaq 100 index, which continues to trade above last Thursday’s high and may still leave odds of a continuation of the upward trend in place. The upper edge of its Ichimoku cloud on the daily chart is providing some near-term resistance to overcome for now, with any break above its current consolidation phase likely to pave the way to retest its year-to-date high at the 15,940 level.

image1.png

Source: IG charts

Asia Open

Asian stocks look set for a mixed open, with Nikkei +0.75%, ASX -0.27% and KOSPI -0.06% at the time of writing. Along with the more downbeat tone from Wall Street overnight, sentiments continue to reel in from the downside surprise in China’s Caixin services PMI (51.8 versus 53.6 forecast) yesterday, with the quicker-than-expected tapering in reopening momentum offsetting earlier optimism around the resilience in manufacturing activities. The Hang Seng Index gave back its Monday’s gains, closing 2.3% lower yesterday.

This morning, Australia’s 2Q gross domestic product (GDP) growth rate outperformed expectations at 2.1% year-on-year (1.8% consensus). Quarter-on-quarter, it is up 0.4%, above the 0.3% consensus. The confluence of declining 2Q prices but more resilient growth conditions may allow the Reserve Bank of Australia (RBA) to deliver more wait-and-see, validating earlier expectations for an end to its tightening process but for rates to be kept high for longer through mid-2024.

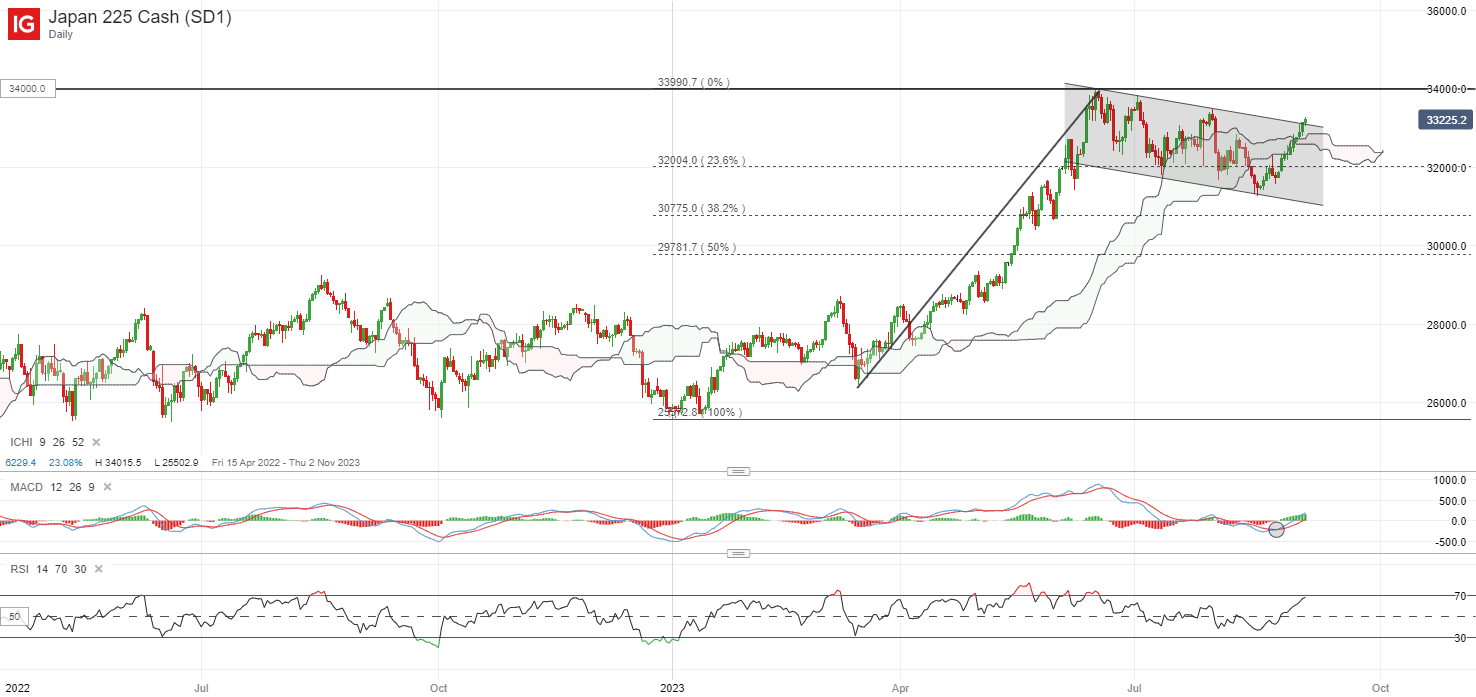
Aside, one to watch may be the Nikkei 225 index. The index has displayed a bullish flag formation on the daily chart since the start of the year, with recent upmove attempting for a break above the downward-sloping consolidation channel. That may leave the year-to-date high at the 34,000 level on watch for a retest over coming weeks, with the price projection based on the flag pole leaving its 1990 high in focus over the longer term.

Equities Forecast

Equities Forecast
Recommended by Jun Rong Yeap
Get Your Free Equities Forecast
Get My Guide

image2.png

Source: IG charts

On the watchlist: Gold prices retracing from resistance confluence

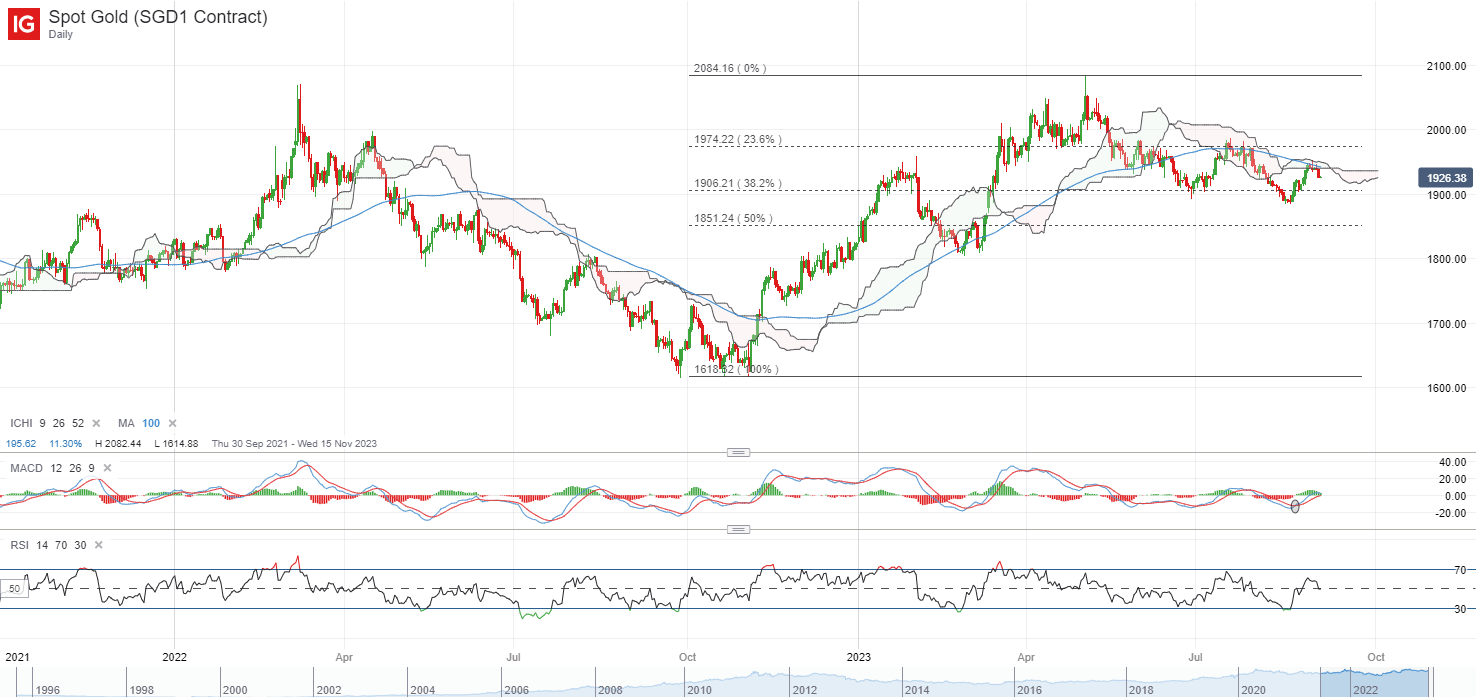
A jump in US Treasury real yields for the second straight day and a stronger US dollar at its four-month high have kept the pressure on gold prices overnight, with prices retracing off a resistance confluence at the US$1,950 level. This level is where its 100-day moving average (MA) stands in line with the upper band of its Ichimoku cloud on the daily chart. Failure to trade above the cloud may still keep a downward trend in place, with greater conviction for buyers potentially coming from a move above the US$1,950 level.

For now, its weekly relative strength index (RSI) is back to retest its 50 level, following a dip below the level last month. Any further downside in prices could leave the US$1,895 level on watch as immediate support, where dip-buyers had held up prices at this level on two previous occasions since June this year.

How to Trade Gold

How to Trade Gold
Recommended by Jun Rong Yeap
How to Trade Gold
Get My Guide

image3.png

Source: IG charts

Euro Slides as US Dollar Dominates Again on Lofty Treasury Yields. Lower EUR/USD?

Euro Slides as US Dollar Dominates Again on Lofty Treasury Yields. Lower EUR/USD?

The Euro is wallowing near the 4 month low seen overnight as the US Dollar strides forward after Treasury yields soared.

US$ 36 billion of corporate issuance flooded the market this week in the US, sinking debt markets and lifting yields across the Treasury curve.

The benchmark 10-year bond nudged 4.27% in the US session and remains near there going into Wednesday’s trading day after having looked at 4.06% last Friday.

The Japanese Yen clawed back some gains today after comments from Masato Kanda, Japan’s Vice Minister of Finance for International Affairs.

On speculative moves in foreign exchange, he said, “if these moves continue, the government will deal with them appropriately.”

Not long after his remark, BoJ board member Hajime Takata also spoke on Wednesday but did little to move the dial in regard to monetary policy. However he did reaffirm that the bank will be patient with any adjustment to monetary policy.

The Aussie Dollar has been a laggard over the last 24 hours even though GDP data there was slightly better than expected.

2Q quarter-on-quarter GDP came in at 0.4% in line with forecasts but the annual read was 2.1% to the end of June, above the anticipated 1.8%, revealing an upward revision to prior releases.

Crude oil has hit new highs after Saudi Arabia and Russia committed to maintain their production cuts through to the end of the year.

The WTI futures contract is above US$ 86.60 bbl while the Brent contract is near US$ 90 bbl. Spot gold is steady just below US$ 1,930 at the time of going to print.

The higher cost of borrowing and energy prices appeared to dent sentiment in the Wall Street session and APAC indices mostly followed the lead.

The notable exception has been Japan’s Nikkei 225 index which saw modest gains that have been attributed to the weaker Yen. Chinese indices remain under pressure despite massive gains from the property sector there today.

The Bank of Canada will be making a rates decision later today and the interest rate market and economists are looking for no change.

The full economic calendar can be viewed here.

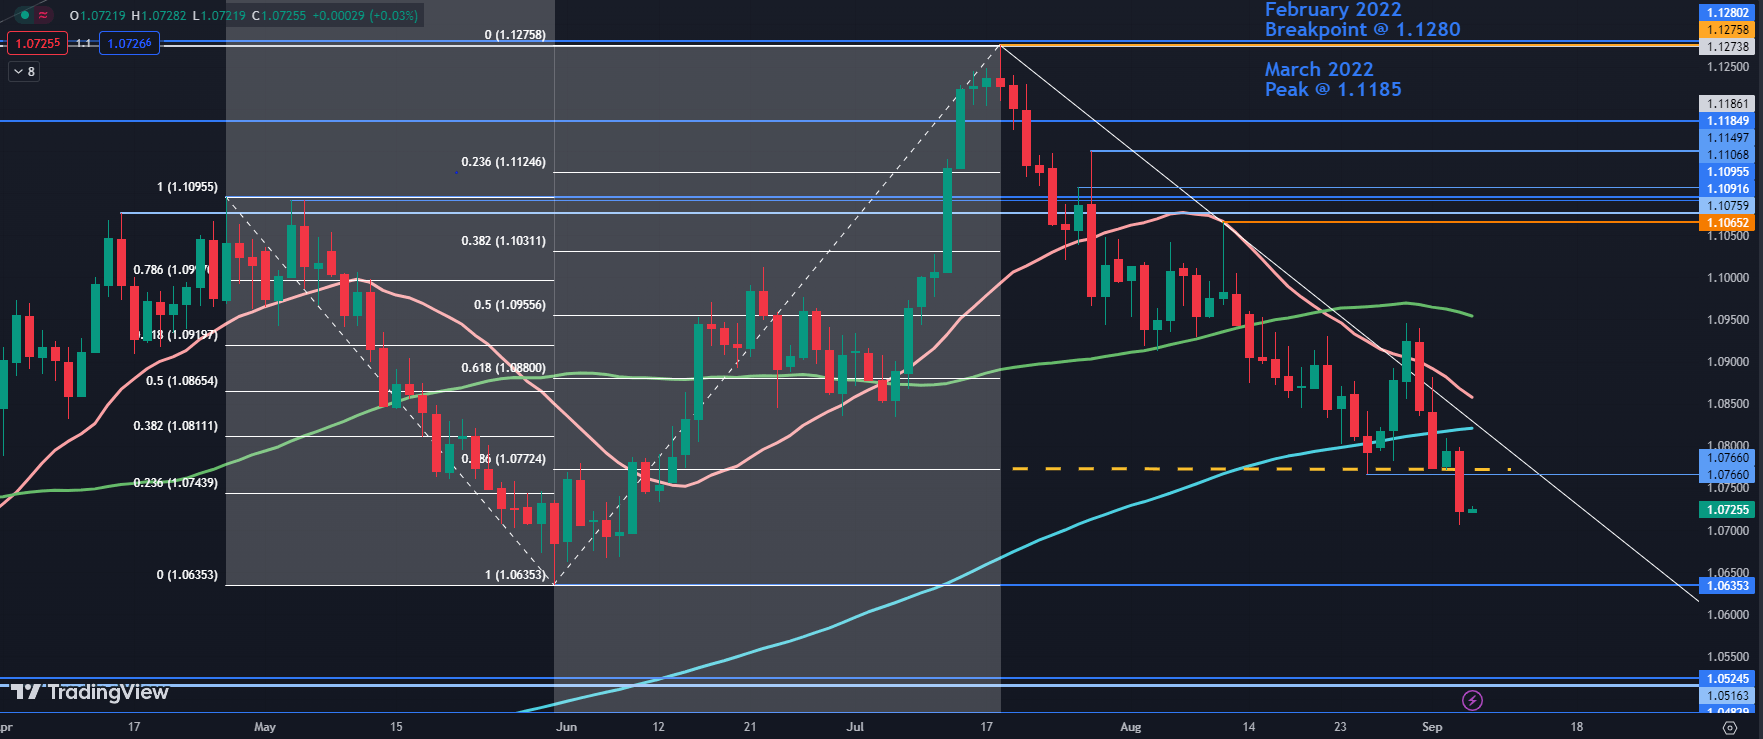
EUR/USD TECHNICAL ANALYSIS SNAPSHOT

EUR/USD broke below several support levels yesterday and those levels might offer resistance in the 1.0665 – 1.0670 area. Further up, resistance could be ahead of the prior peaks near 1.0950.

If it weres to break above there, it may see a test of potential resistance in the 1.1075 – 1.1095 area where several historical breakpoints reside and just ahead of the psychological level at 1.1100.

Further up, resistance could be at the breakpoint from the March 2022 high at 1.1185 or the recent peak at 1.1275, which coincides with two historical breakpoints.

Above those levels, resistance might be at the Fibonacci Extension of the move from 1.1095 to 1.0635 at 1.1380. Just above there are some more breakpoints in the 1.1385 – 95 area.

On the downside, support may lie near the previous lows at 1.0635 and 1.0520.

EUR/USD DAILY CHART

Chart Created in TradingView

XAU/USD Price Forecast: Gold On the Cusp of Another Breakdown

XAU/USD Price Forecast: Gold On the Cusp of Another Breakdown

XAU/USD FUNDAMENTAL FORECAST

Gold prices are under threat of another collapse as reflation fears have been stoked by OPEC+ whereby Saudi Arabia and Russia are expected to maintain production cuts through to the end of the year. While extending supply cuts were somewhat anticipated, the duration was not. This should keep the US dollar elevated with China and European growth concerns adding fuel to USD upside.

Later today, the US ISM services PMI report will be released. Being a primarily services driven economy, this report carries a lot more weight than the manufacturing metric. Estimates are projected slightly lower than the prior figure but should not deter from a buoyant greenback unless there is a significant miss.

Fed speakers will be scattered throughout the trading day and could stoke some short-term volatility for both the USD and gold respectively.

GOLD ECONOMIC CALENDAR

image1.png

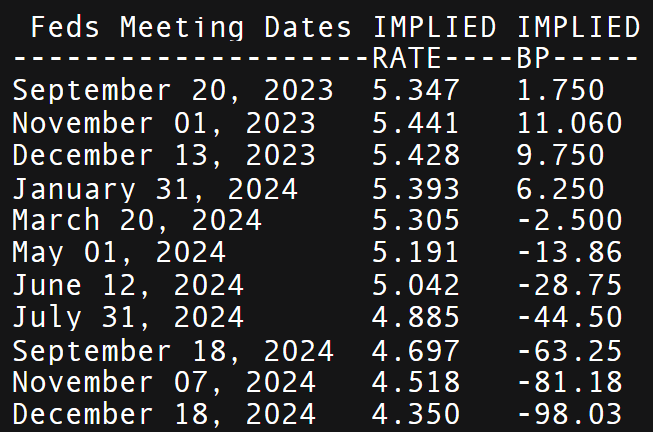
Money market pricing (see below) has been revised lower in terms of cumulative rate cuts by the end of 2024 which was around 110bps a week ago, now 98bps. The threat of additional rate hikes could harm the non-interest bearing yellow metal but further US specific data will be needed to confirm a more hawkish stance – increasing real yields.

IMPLIED FED FUNDS FUTURES

image2.png

TECHNICAL ANALYSIS

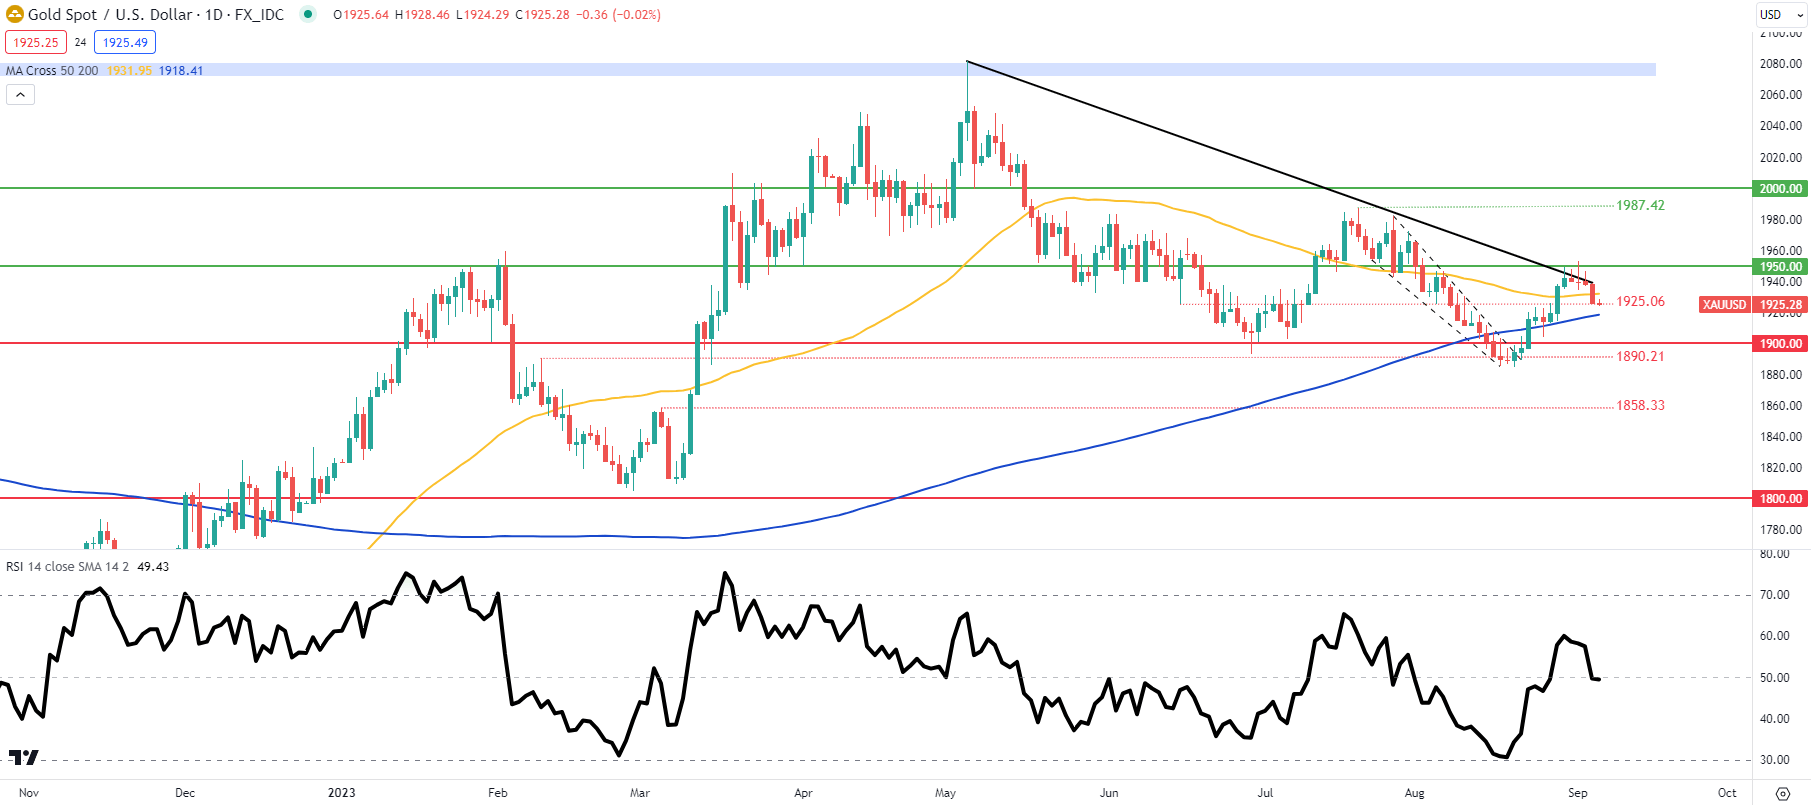
GOLD PRICE DAILY CHART

image3.png

Daily XAU/USD price action above has respected the longer-term trendline resistance (black) and now hovers around the 1925.06 swing support low. The Relative Strength Index (RSI) suggests hesitancy by gold traders with no inclination to the upside nor downside. Fundamental data mentioned above will likely drive directional bias and any additional dollar support could see gold prices re-test the 200-day moving average (blue) once more.

Crude Oil Attempts to Clear a Tough Barrier; Natural Gas Risks Further Losses

Crude Oil Attempts to Clear a Tough Barrier; Natural Gas Risks Further Losses

Crude Oil: Cracks above resistance

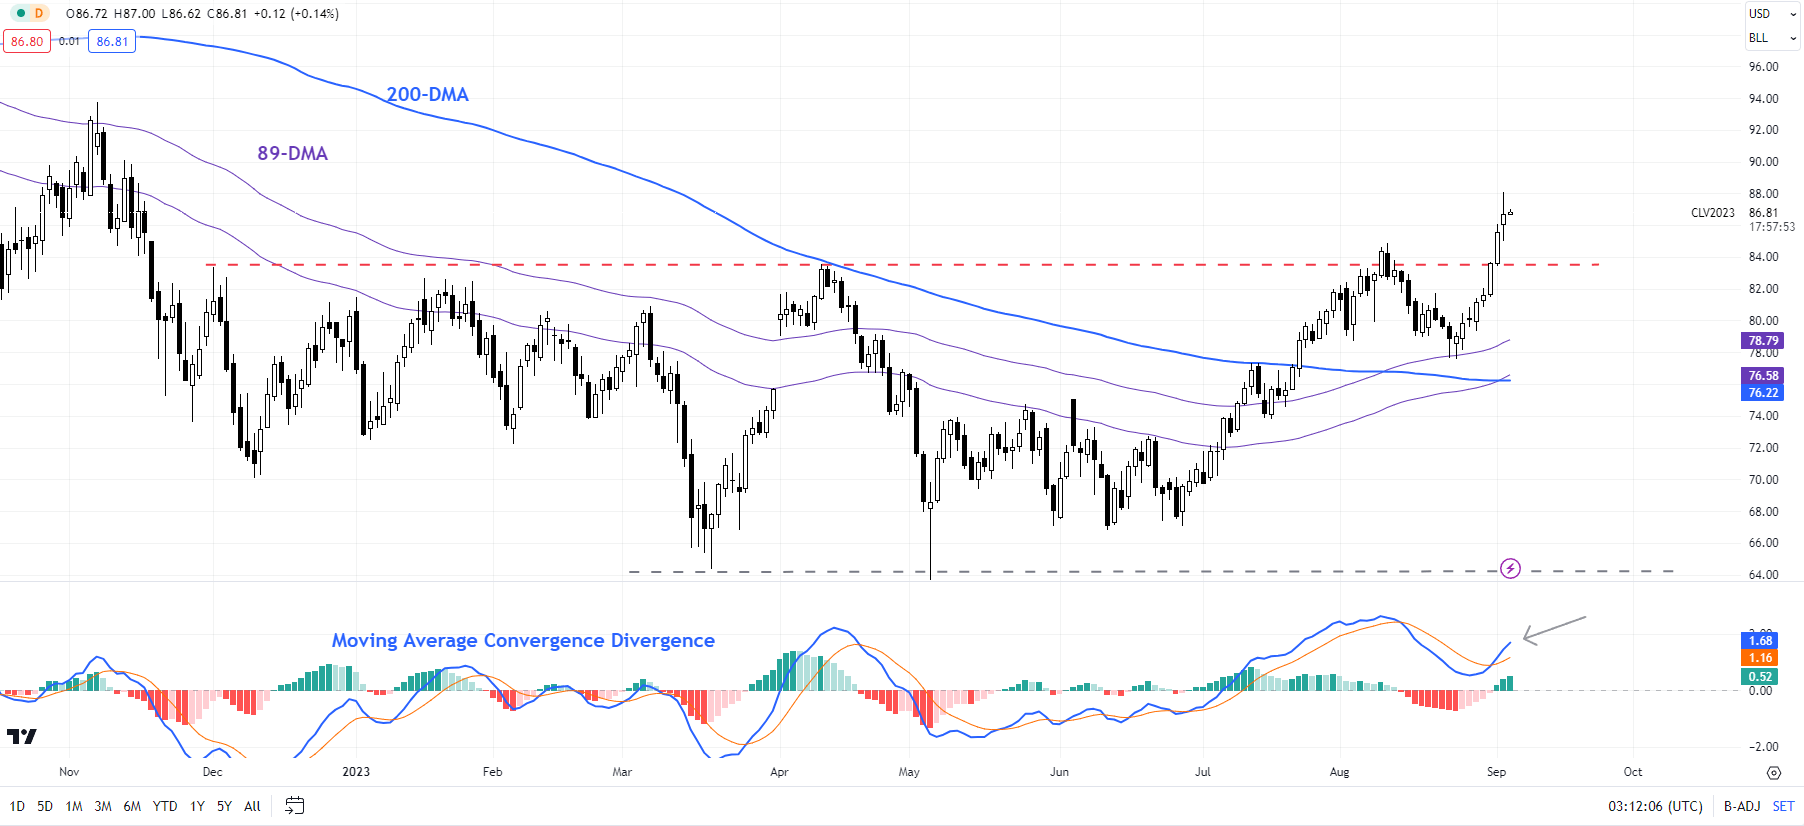
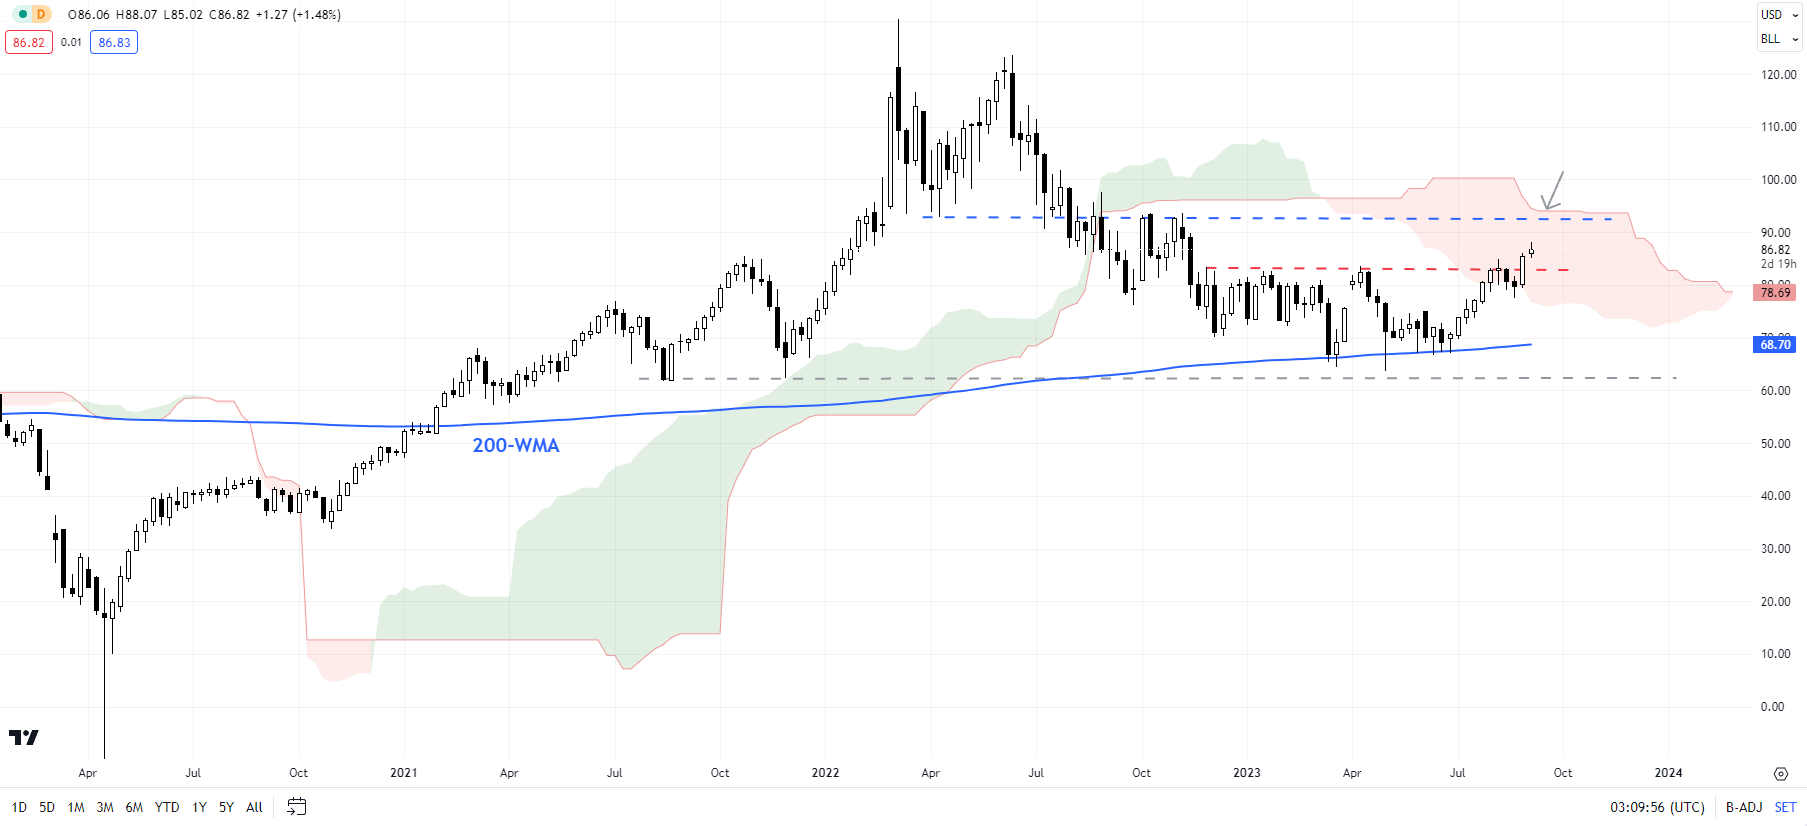
Crude oil’s rise above several times tested resistance on a horizontal trendline since the end of 2022 (at about 83.50) has triggered a breakout from a multi-month sideway zone. The break has opened the way toward the October high of 93.00.

The bullish break follows a rise in July above the Ichimoku cloud on the daily charts, and the 89-day moving average, pointing to renewed upward momentum, as pointed out in the previous update (see “More Pain Ahead for Crude Oil? Is the Rebound Over in Natural Gas?” published August 29) and strong support on the 200-week moving average in recent months (see “Crude Oil Extends Slide in Asia: Is This Capitulation?”, published May 4).

Crude Oil Daily Chart

image1.png

Having said that, the upward momentum associated with the break above 83.50 is feeble compared with price gains. Crude oil needs to sustain gains if the breakout is real. A failure to hold on to the recent gains would raise the odds of a false break higher. In this regard, immediate support is at the resistance-turned-support at 83.50, and stronger support is at the August low of 77.50.

Crude Oil Weekly Chart

image2.png

Natural gas: Risks further losses

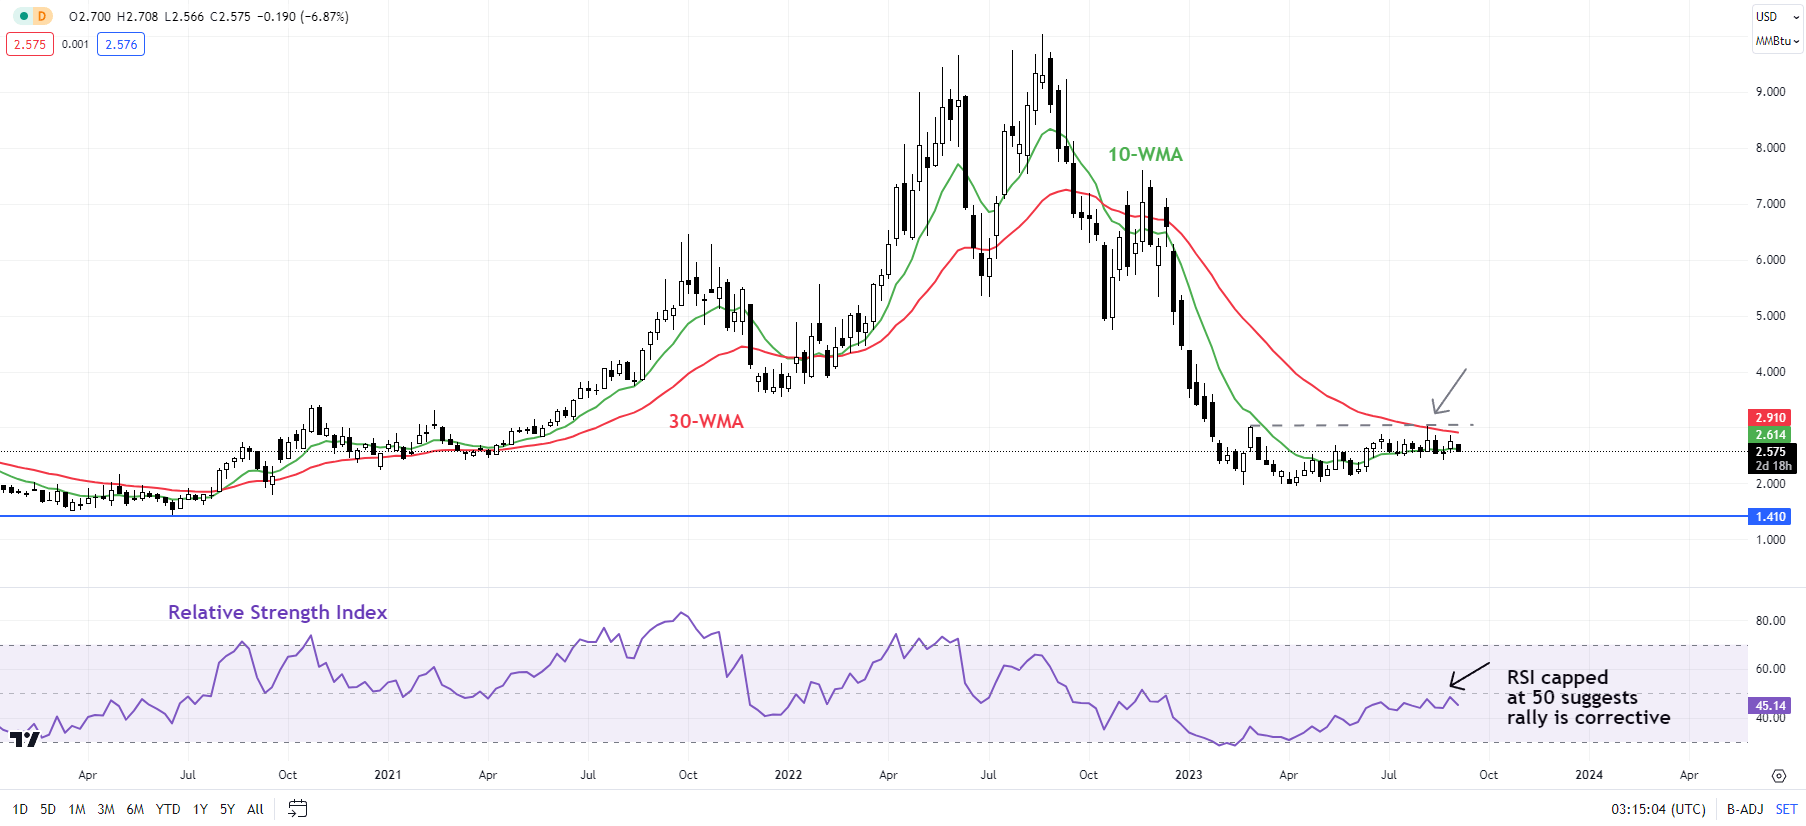
A potential lower top / secondary high created this week in natural raises the odds that the five-month-long rebound is over – a risk pointed out in the past two updates. See “More Pain Ahead for Crude Oil? Is the Rebound Over in Natural Gas?” published August 29, and “How Much More to Go in Crude Oil? Is There More Upside in Natural Gas?”, published August 11.

Natural Gas Weekly Chart

image3.png

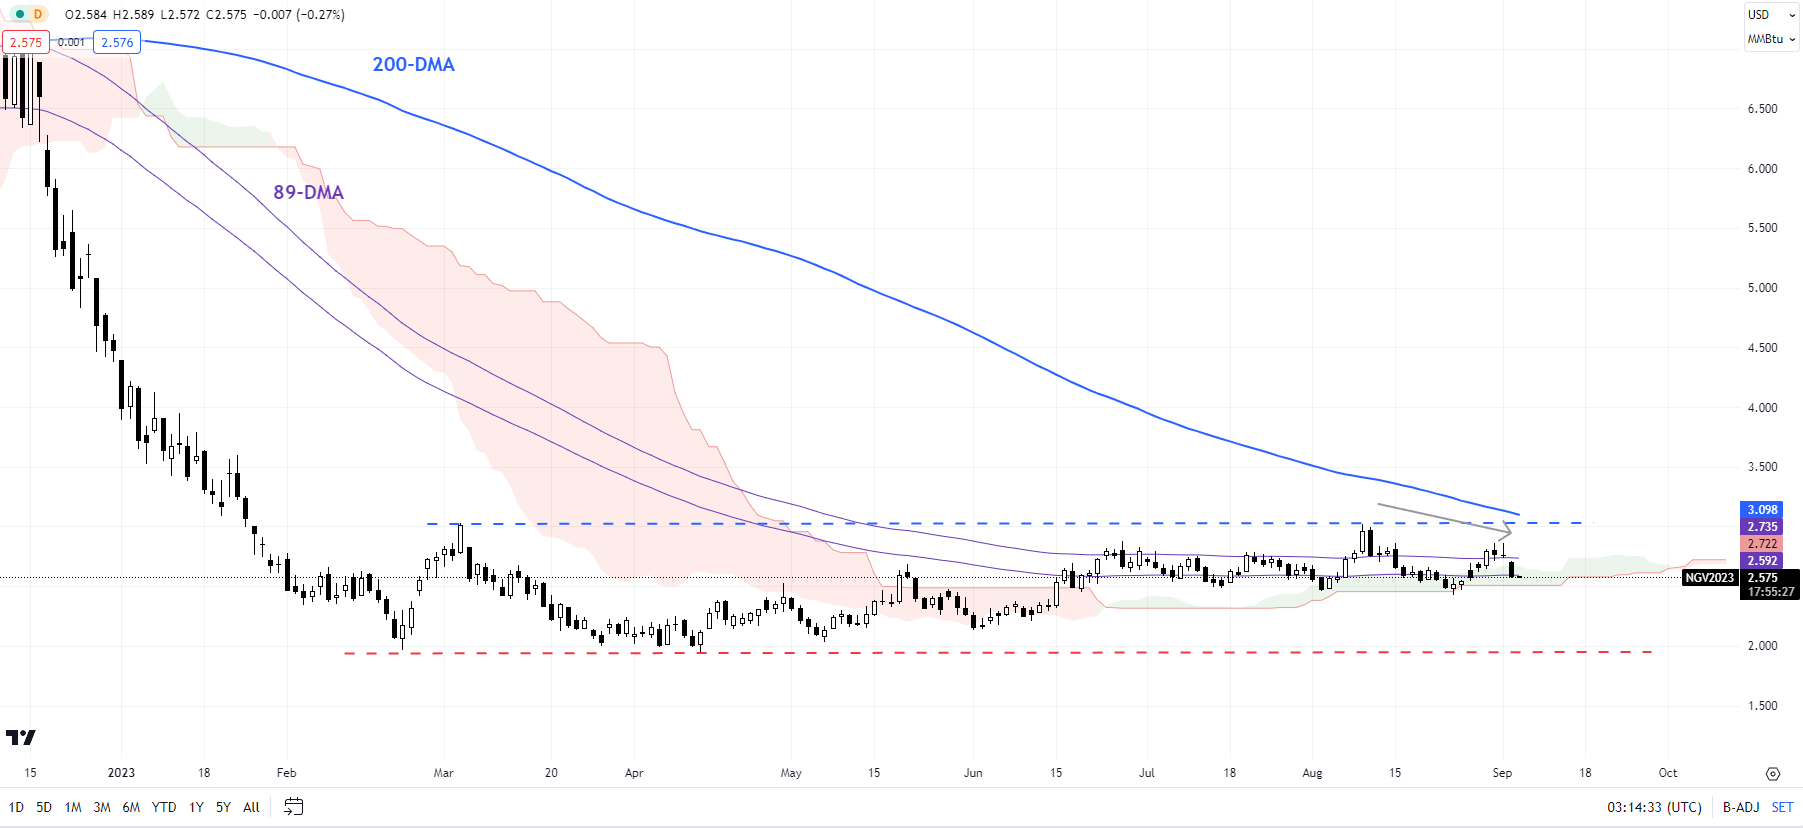
That’s because natural gas has failed to cross above the crucial hurdle at 3.00-3.05 (including the March high and the 30-week moving average). The inability to rise toward the 200-day moving average and the hesistant nature of recovery since early 2023 are signs that natural gas isn’t yet ripe for a renewed bull market. Indeed, natural gas may need to undergo a prolonged period of base building before a sustainable uptrend emerges.

Natural Gas Daily Chart

image4.png

The possibility of natural gas bottoming was first highlighted in early 2023 – see “Natural Gas Price Action Setup: Is the Slide Overdone?”, published February 21, and subsequently “Natural Gas Week Ahead: Base Building May Have Started”, published May 22, and “Natural Gas Price Rebound Could Extend; What’s Next For Crude Oil?”, published May 18.

Natural gas is testing a vital horizontal floor at about 2.45-2.50. Any break below the support would confirm that the upward pressure had truncated, potentially opening the door toward the May low of around 2.00.

Crypto News- XRP Transfers Raise Eyebrows

Crypto News- XRP Transfers Raise Eyebrows

Two sizeable XRP (XRP) transactions reported this week by a leading blockchain tracking service have raised eyebrows within the XRP community and broader crypto market.

Trading Derivatives carries a high level of risk to your capital and you should only trade with money you can afford to lose. Trading Derivatives may not be suitable for all investors, so please ensure that you fully understand the risks involved, and seek independent advice if necessary. A Product Disclosure Statement (PDS) can be obtained either from this website or on request from our offices and should be considered before entering into a transaction with us. Raw Spread accounts offer spreads from 0.0 pips with a commission charge of USD $3.50 per 100k traded. Standard account offer spreads from 1 pips with no additional commission charges. Spreads on CFD indices start at 0.4 points. The information on this site is not directed at residents in any country or jurisdiction where such distribution or use would be contrary to local law or regulation.


Whale Alert flagged the significant transactions Monday involving 29,700,000 and 425,322,309 XRP. Notably, Ripple, the blockchain payments giant behind XRP, moved the first stash with a market value of roughly $15 million to leading European crypto exchange Bitstamp, according to XRP-centric data provider Bithomp. Simultaneously, the second amount with a value of $213,135,940 moved from Bitvavo digital exchange to a wallet labeled “unknown” by Whale Alert. Since the start of August, the tracking service has reported several transactions similar in quantity to the second movement of XRP, with some commentators speculating that they simply involved an internal Bitvavo transfer between wallets.

These transactions come amid a period of heightened volatility for XRP and Ripple. In July, the blockchain payments giant secured a significant legal victory against the U.S. Securities and Exchange Commission (SEC) when a federal judge ruled that the company’s XRP sales on the secondary market were not security sales, a decision that prompted the relisting of XRP on several major exchanges, leading to significant price fluctuations. However, the securities watchdog has responded by filing an appeal on parts of the judgment. Last week, Ripple countered the SEC’s appeal request by submitting an opposition, setting the stage for what promises to be an ongoing legal battle with implications for the broader cryptocurrency industry.

Below, we turn to technical analysis to identify important trading levels in XRP, Bitcoin (BTC), and Ethereum (ETH).

Technical Analysis:  XRP, Bitcoin and Ethereum

XRP

XRP’s price has traded within a narrow trading range on thin volume over the past two weeks. Moreover, the RSI sits in neutral territory, providing little clue on future price direction. A breakout above the range’s upper trendline could see bulls make a run toward the next key level of resistance at $0.61. Conversely, a breakdown below the range could trigger falls to key support around $0.46.

Bitcoin

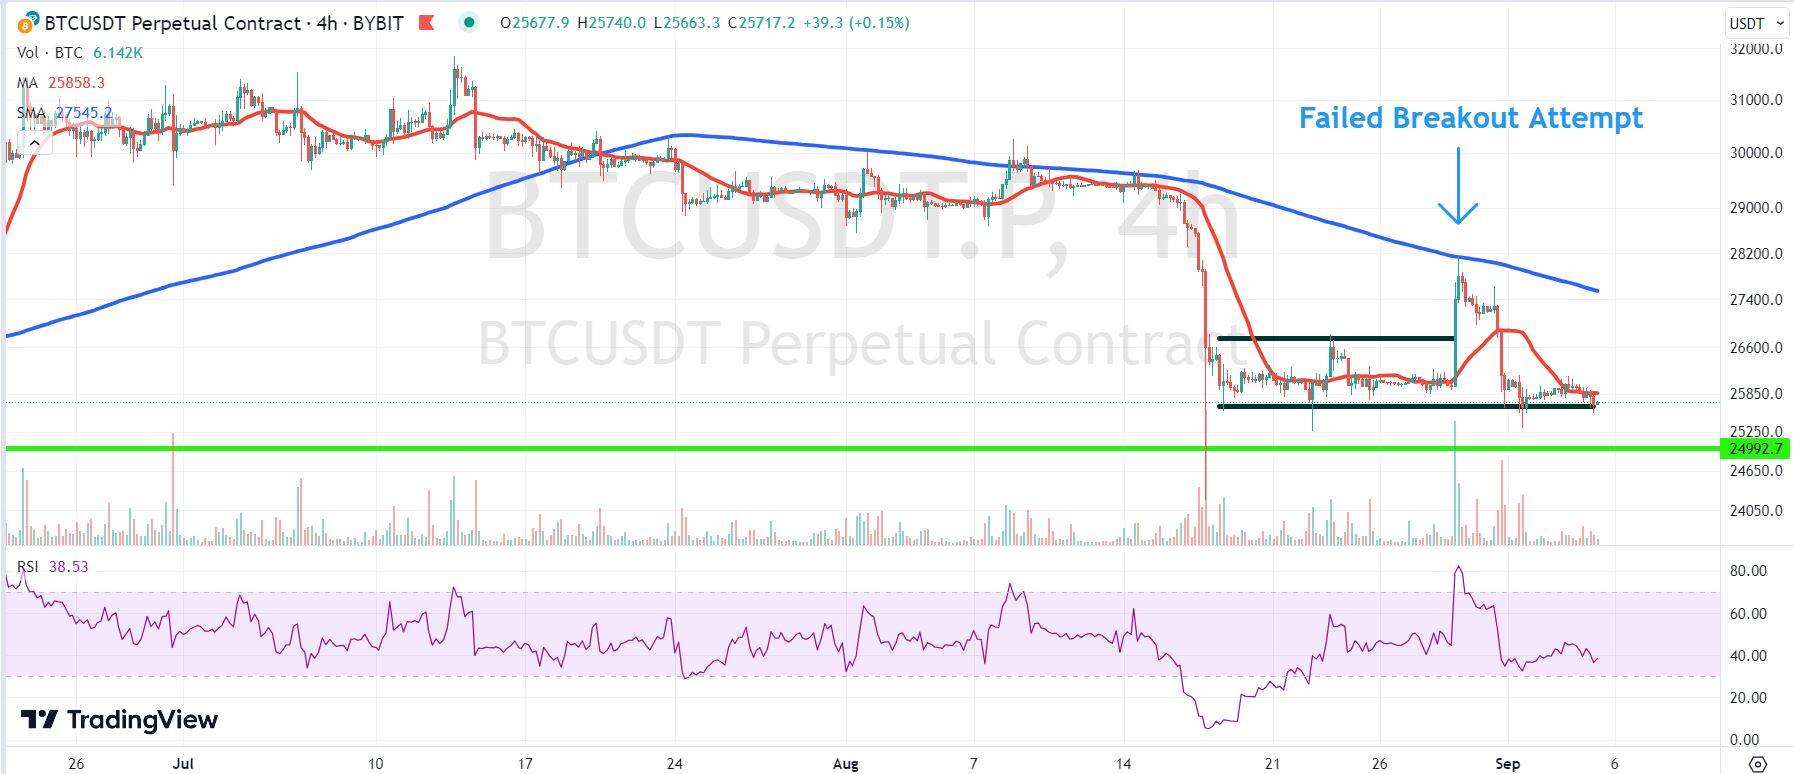
After a failed breakout attempt, Bitcoin has returned to a sideways range that has been in place since the second half of August. The price now trades towards the lower section of the range and looks susceptible to further sell-side pressure. A breakdown at these levels could see bears initiate a move down to crucial support at $25,000. However, a move back above the trading range could give bulls the confidence to test key overhead resistance around $28,800.


Chart depicting the price of BTC

Ethereum

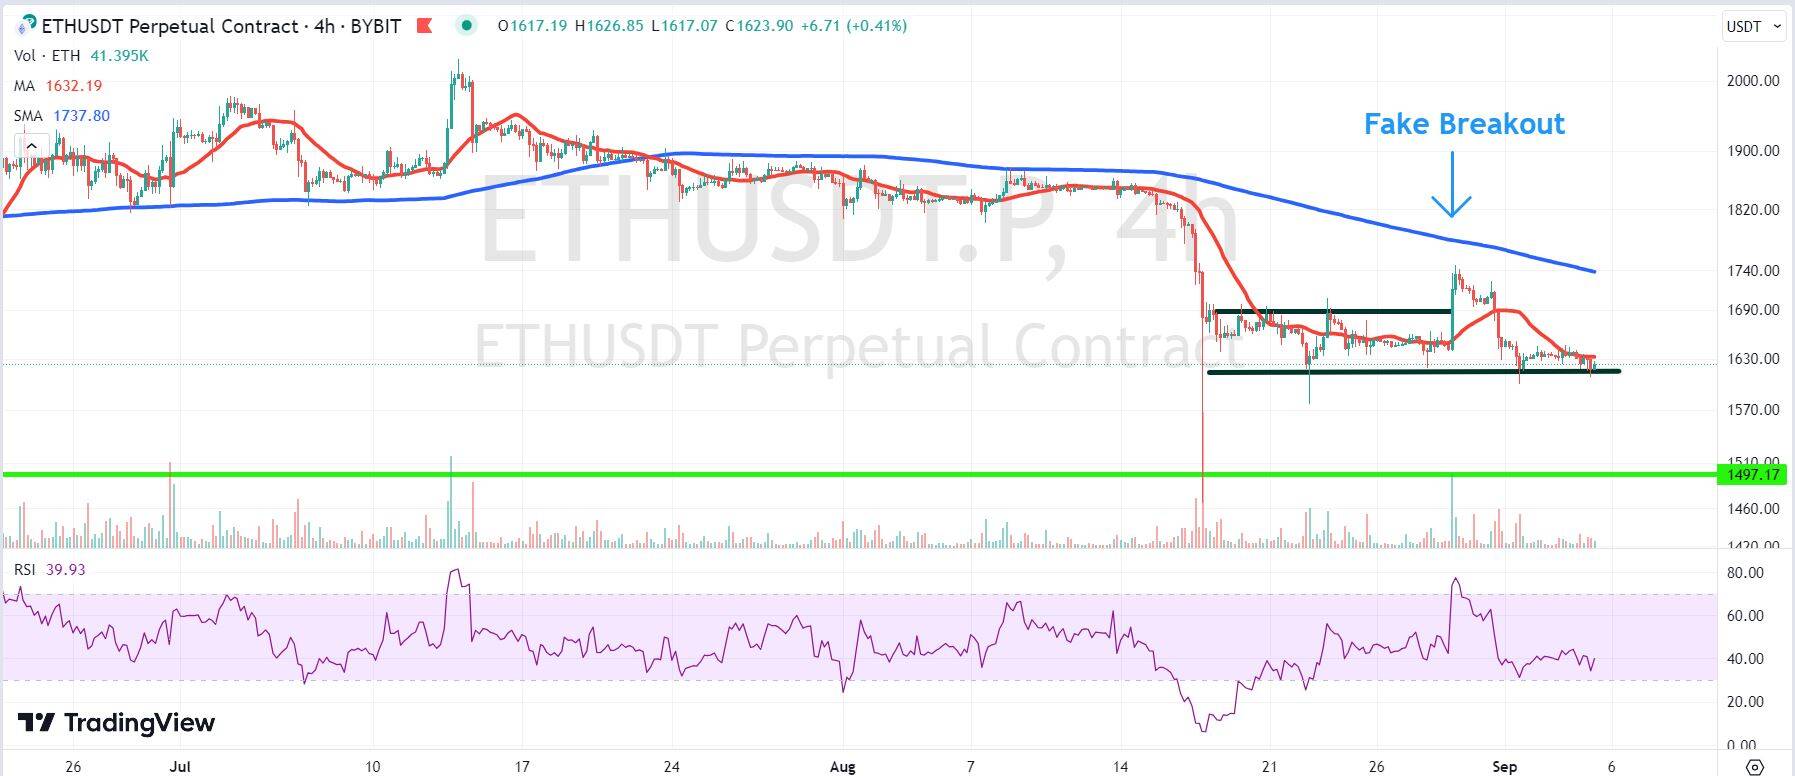
Like Bitcoin, Ethereum staged a fake breakout, with price reversing back toward the bottom of a previous trading range. Moreover, the RSI gives a reading near oversold levels, indicating a lack of buying enthusiasm. A breakdown from these levels could give way to further declines to long-term support around $1,500. Alternatively, a convincing rally from the range’s lower trendline could spark a rally up to chart resistance at $1,820.


Chart depicting the price of ETH.