Real Yields Continue to Cast Shadow Over Gold: XAU/USD Price Action

Real Yields Continue to Cast Shadow Over Gold: XAU/USD Price Action

Gold is restarting to feel the heat of rising US real yields following upbeat US data in the past couple of days.

The yellow metal rebounded mid-August from quite strong support on the 200-day moving average and the June low of 1890. See “Gold, Silver Forecast: It’s Now or Never for XAU/USD, XAG/USD,” published August 13. This was associated with a brief reprieve lower in US real yields, also as data released in the second half of August failed to match up with overly optimistic expectations (the US Economic Surprise Index hit a two-year high at the end of July before cooling off).

With the US Federal Reserve unwilling to commit it is done with hiking rates, there is very little incentive for yields to fall meaningfully amid a resilient economy. Fed Governor Christopher Waller and Boston Fed President Susan Collins’s comments reiterated the data dependency with regard to the path of monetary policy. The path of least resistance for yields remains sideways to up.

XAU/USD Daily Chart
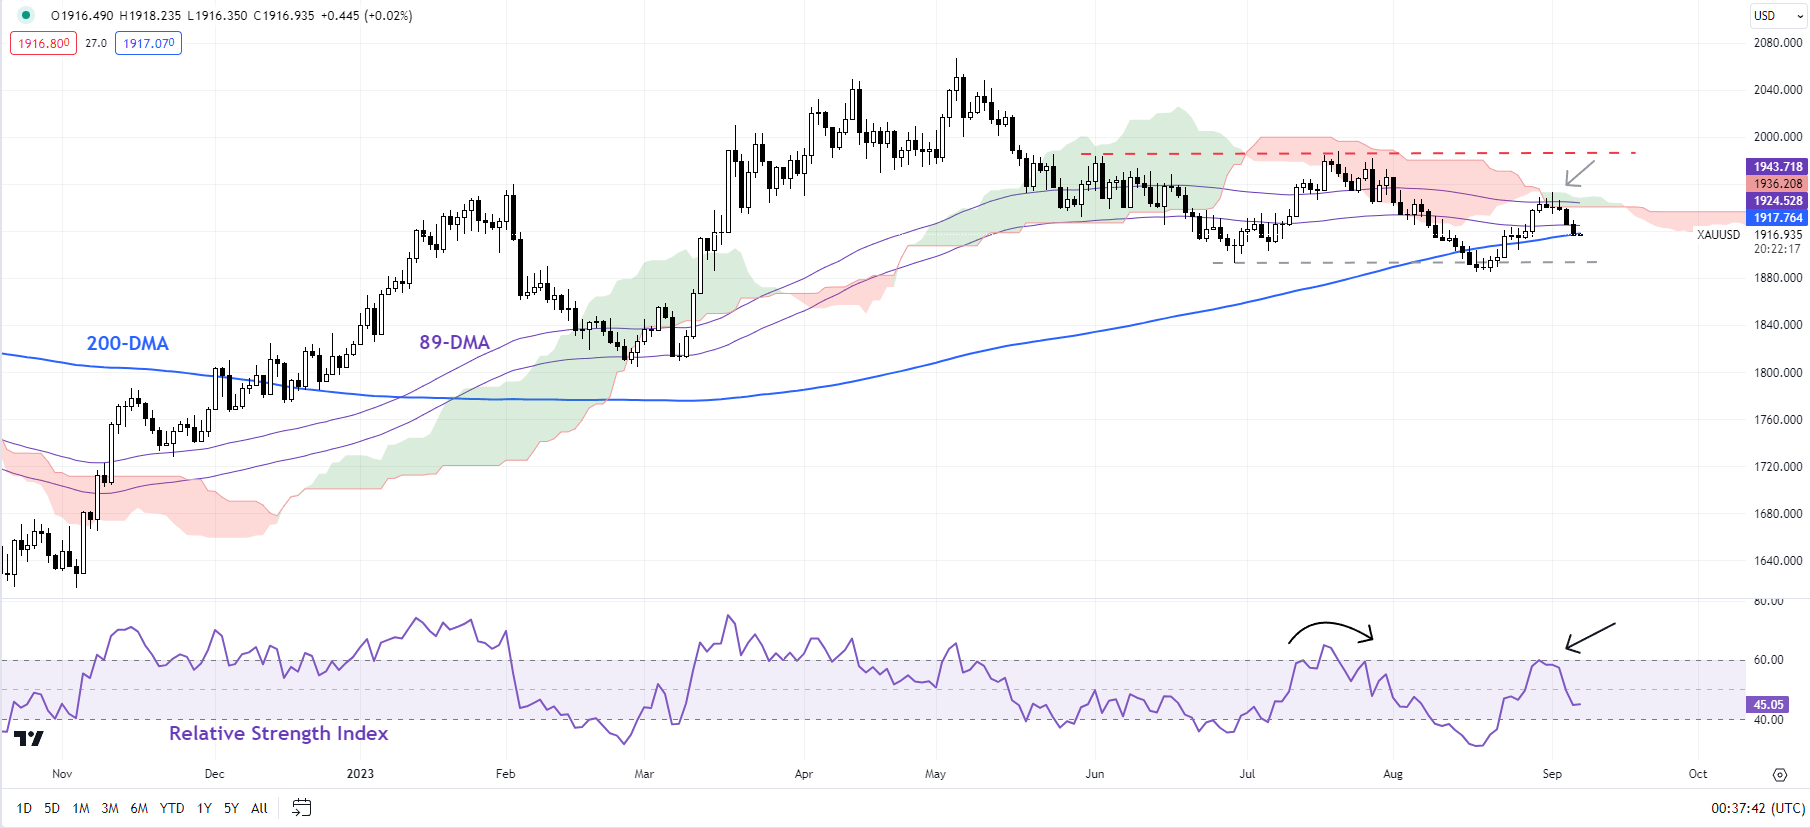
image1.png

US real yields continue to hover around multi-month highs hit in August. Rising nominal interest rates coupled with easing price pressures/inflation expectations have pushed up real rates, raising the opportunity cost of holding the zero-yielding yellow metal. See “High Real Yields Starting to Bite Gold? XAU/USD Price Setup Ahead of US CPI,” published August 10.

On technical charts, after a brief rebound from strong converged support in late August, gold has retreated from vital resistance on the upper edge of the Ichimoku cloud on the daily charts and the 89-day moving average. The recent turn lower has raised the odds of a lower-highs-lower-lows sequence since May. For this bearish pattern to reverse, the yellow metal would need to, at minimum, rise above last week’s high of 1952. In turn, for a rebound to occur gold needs to hold the crucial support on the lower edge of the Ichimoku cloud on the 240-minute chart that it is now testing.

XAU/USD 240-minute Chart
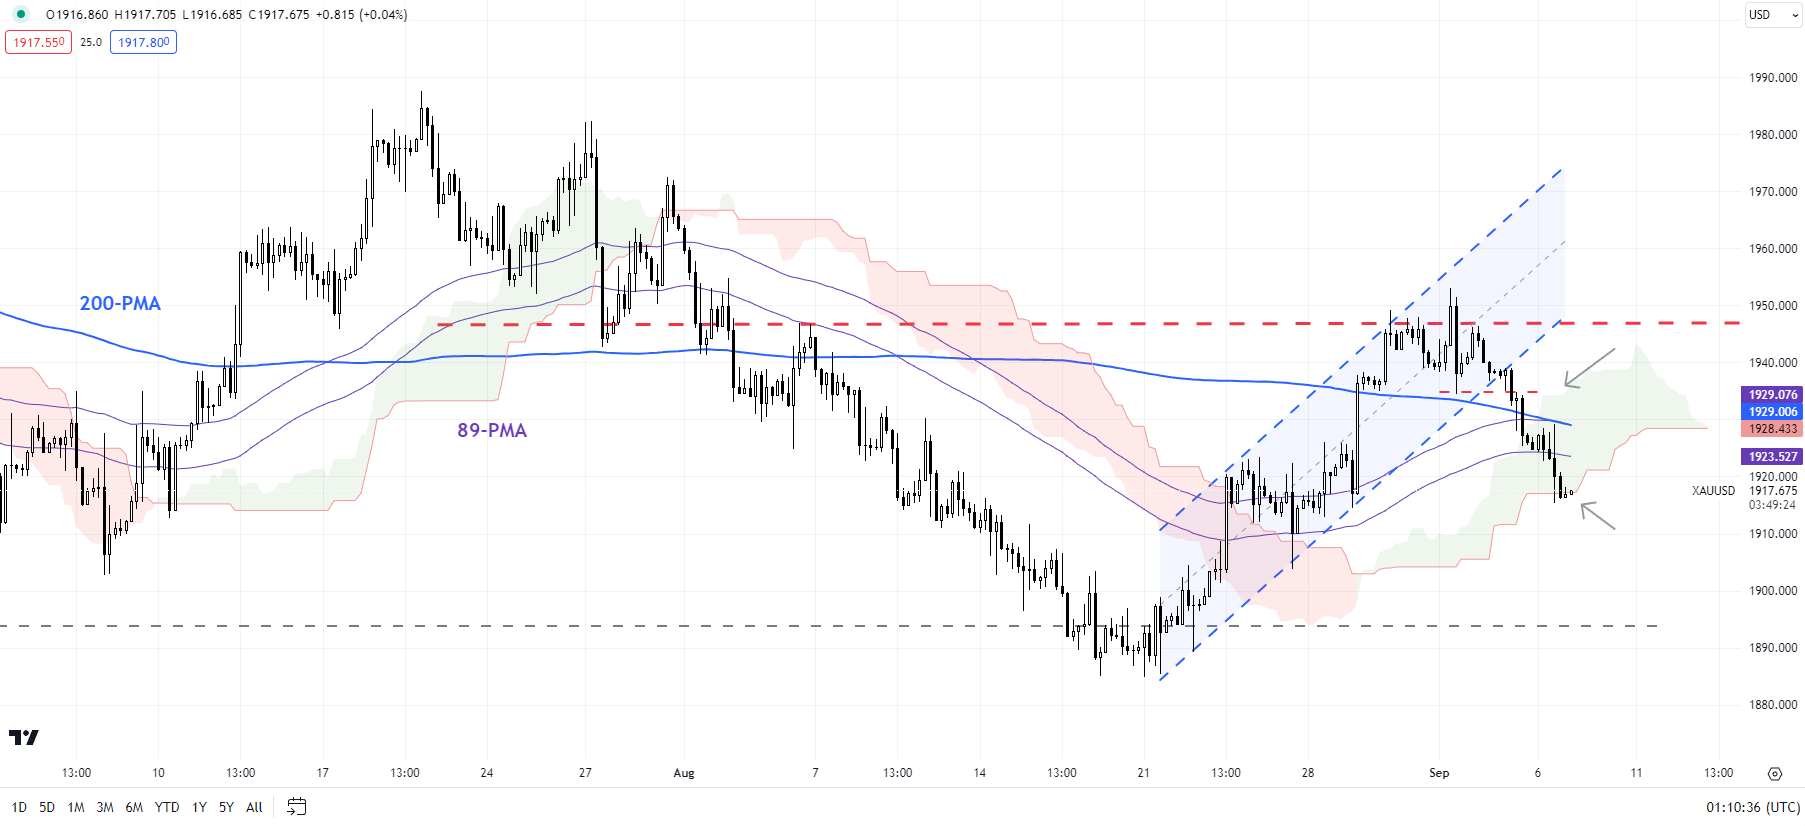
image2.png

A failure to do so could push gold back toward crucial support on the 200-day moving average and the June/August low of 1885-1890. The importance of this support was highlighted in “Gold, Silver Forecast: It’s Now or Never for XAU/USD, XAG/USD,” published on August 13. As noted previously, any break below could pave the way toward the February low of 1805. Importantly, any break below 1885-1890 would truncate the uptrend that began in 2022.

XAU/USD Weekly Chart
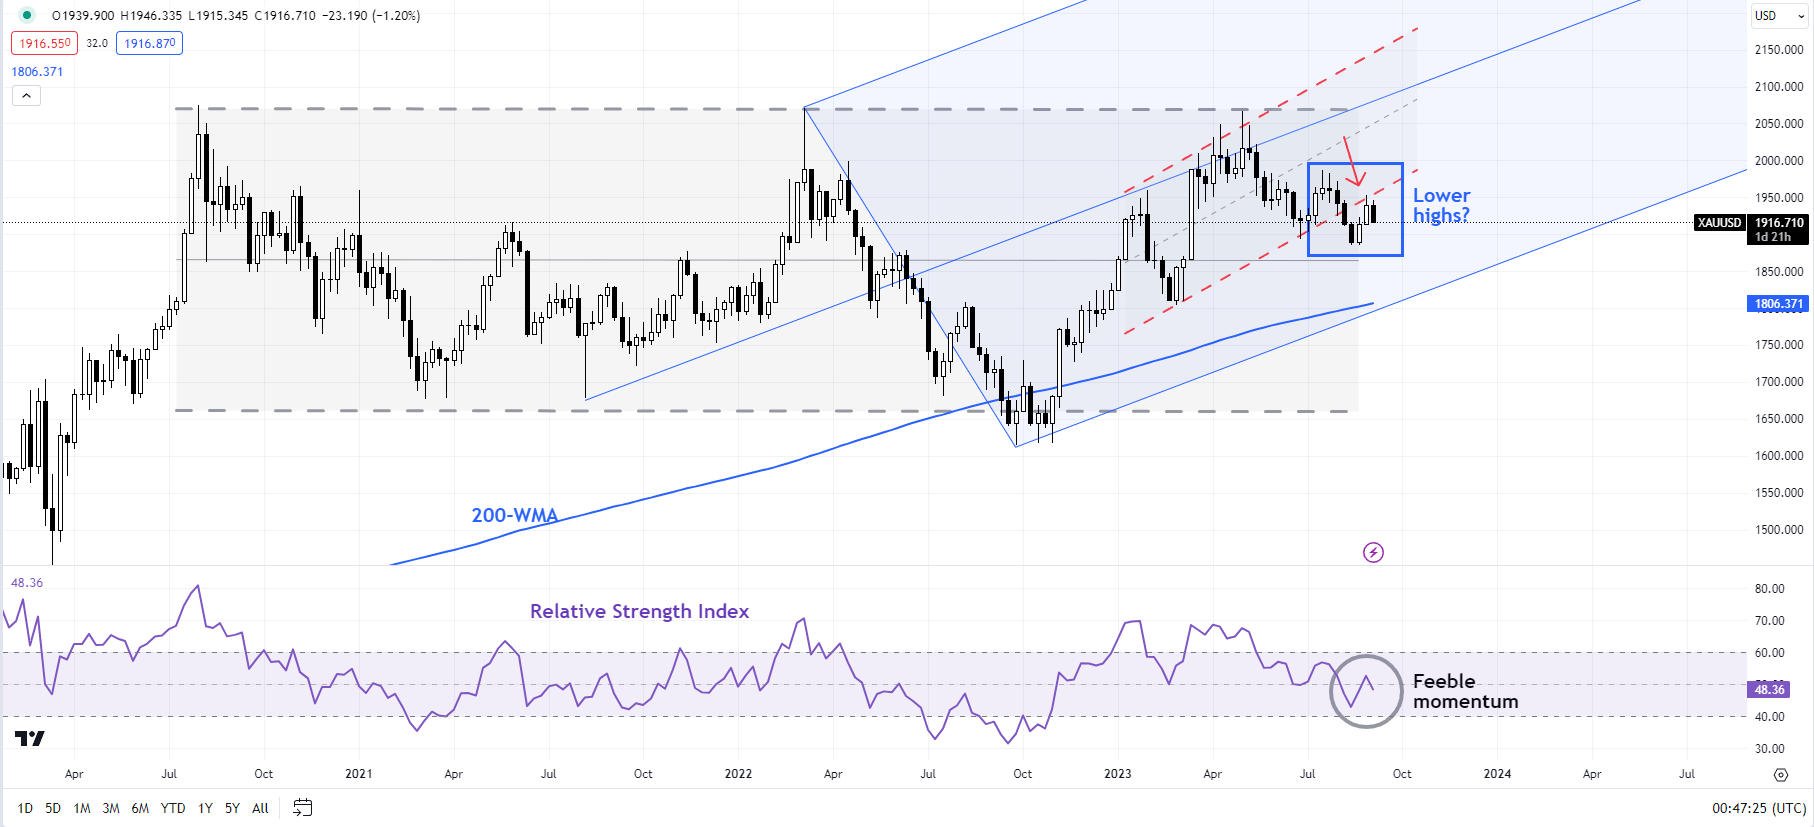
image3.png

Importantly, it would raise the odds that the spectacular multi-month rally was corrective and not the start of a new uptrend – a point highlighted in recent months. See “Gold Could Find It Tough to Crack $2000”,published March 28, and “Gold Weekly Forecast: Is it Time to Turn Cautious on XAU/USD?” published April 16.

Euro Holds Ground Ahead of ECB as US Dollar Flexes. Where to for EUR/USD?

Euro Holds Ground Ahead of ECB as US Dollar Flexes. Where to for EUR/USD?

Euro steadied again going into Thursday’s trading day but remains within a whisker of the 3-month low seen yesterday near 1.0700.

The US Dollar is generally stronger so far today after Treasury yields once again stepped up to loftier levels overnight. The benchmark 10-year note is near 4.30% after having traded at 4.06% a week ago.

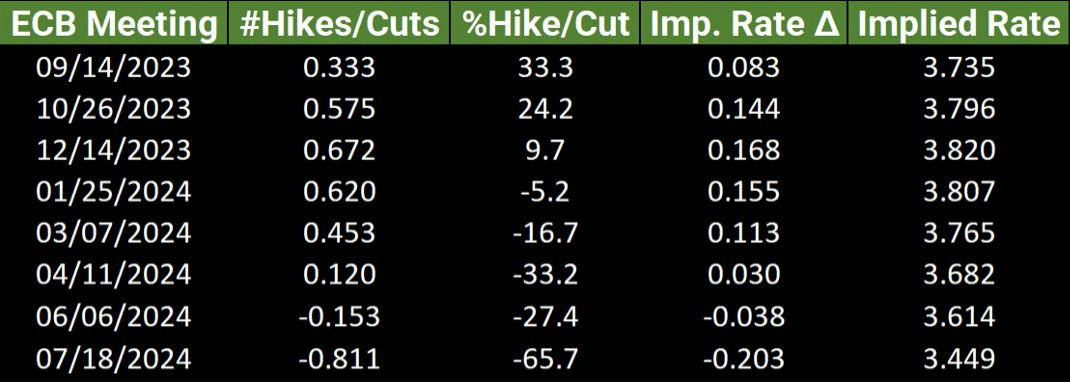
The European Central Bank meets next week, and the market is only subscribing around a 33% probability of a 25 basis-point (bp) hike.

Yesterday, Governing Council member Klaas Knot said that he thought the market was underestimating the chance of a hike. He will be speaking again today alongside several other ECB representatives.

MARKET PRICING OF A 25 BP HIKE BY THE ECB

image1.png

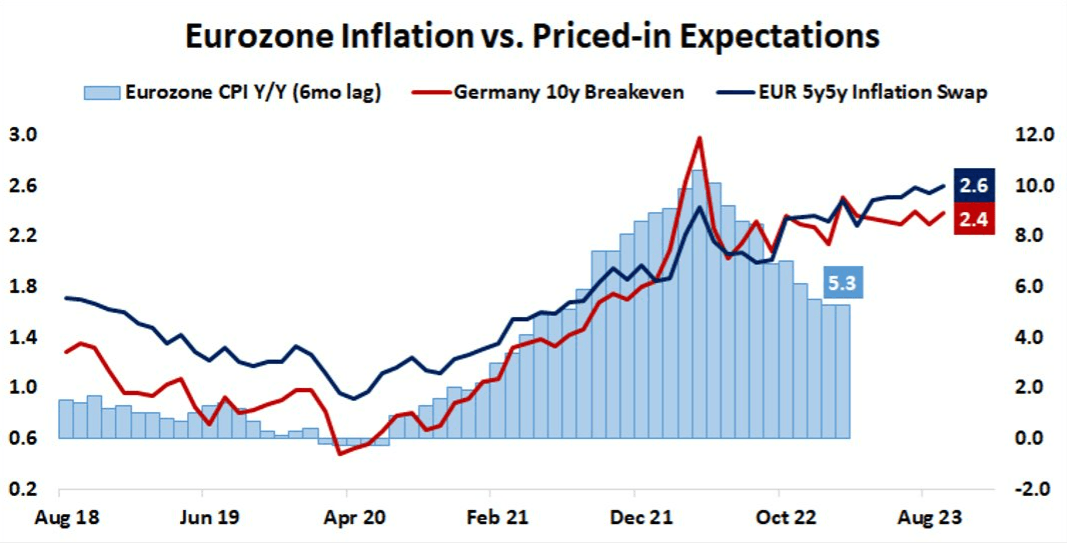
Inflation remains stubbornly high in the Eurozone and market-priced long-term inflation has been inching up of late when looking at the German 10-year breakeven rate and the EUR 5Y/5Y inflation swap.

If the market continues to up the ante on inflation bets, the ECB might need to be more aggressive at some stage.

EU INFLATION AGAINST MARKET-PRICED INFLATION

image2.png

Elsewhere, APAC equities are a sea of red on Thursday and futures are pointing toward a tough cash session for European and North American bourses.

Hong Kong’s Hang Seng Index (HSI) dipped after Chinese trade data increased investor anxiety around the economic outlook there.

China’s trade balance for the month of August missed forecasts, coming in at USD 68.3 billion rather than the 73.9 billion anticipated.

Both exports and imports shrunk significantly, adding to concerns for activity domestically and abroad.

Australia’s trade surplus was also smaller than estimated, printing at AUD 8.04 billion for July, below forecasts of AUD 10 billion. The Aussie continues to languish near 10-month lows under 64 US cents.

For more information on how to trade the news, click on the banner below.

Crude oil has eased slightly today after another stellar rally yesterday on production cuts and depleting stockpiles. Live prices can be found here.

Spot gold is treading water around US$ 1,920 an ounce and volatility on the precious metal is at its lowest level since February 2020 as measured by the GVZ index.

After Eurozone GDP data, the US will see more job numbers hit the wires.

US Indices Hit a Roadblock After Solid Services Print: S&P 500, Nasdaq

US Indices Hit a Roadblock After Solid Services Print: S&P 500, Nasdaq

US indices turned lower on Wednesday after stronger-than-expected services sector data pushed up the odds of a November rate hike, reigniting concerns of higher for longer rates.

Markets are now pricing in about a 44% chance of a November rate hike, up from around 30% at the start of the week, pushing up yields / real yields. The softer data in the second half of August gave the impression that the US economy isn’t resurging. However, this month’s data underscores the outperformance of the world’s largest economy, keeping the upward pressure intact on yields.

As highlighted in a recent update, with real yields rising, valuations well above historical averages, and full-year EPS projections yet to turn materially higher, the bar for equities to outperform some of the other asset classes is now higher. See “US Indices’ Upside Could be Capped: S&P 500, Nasdaq Price Setups,” published August 24, and “US Indices Rally Beginning to Crack? S&P 500, Nasdaq Price Setups,” published August 3.

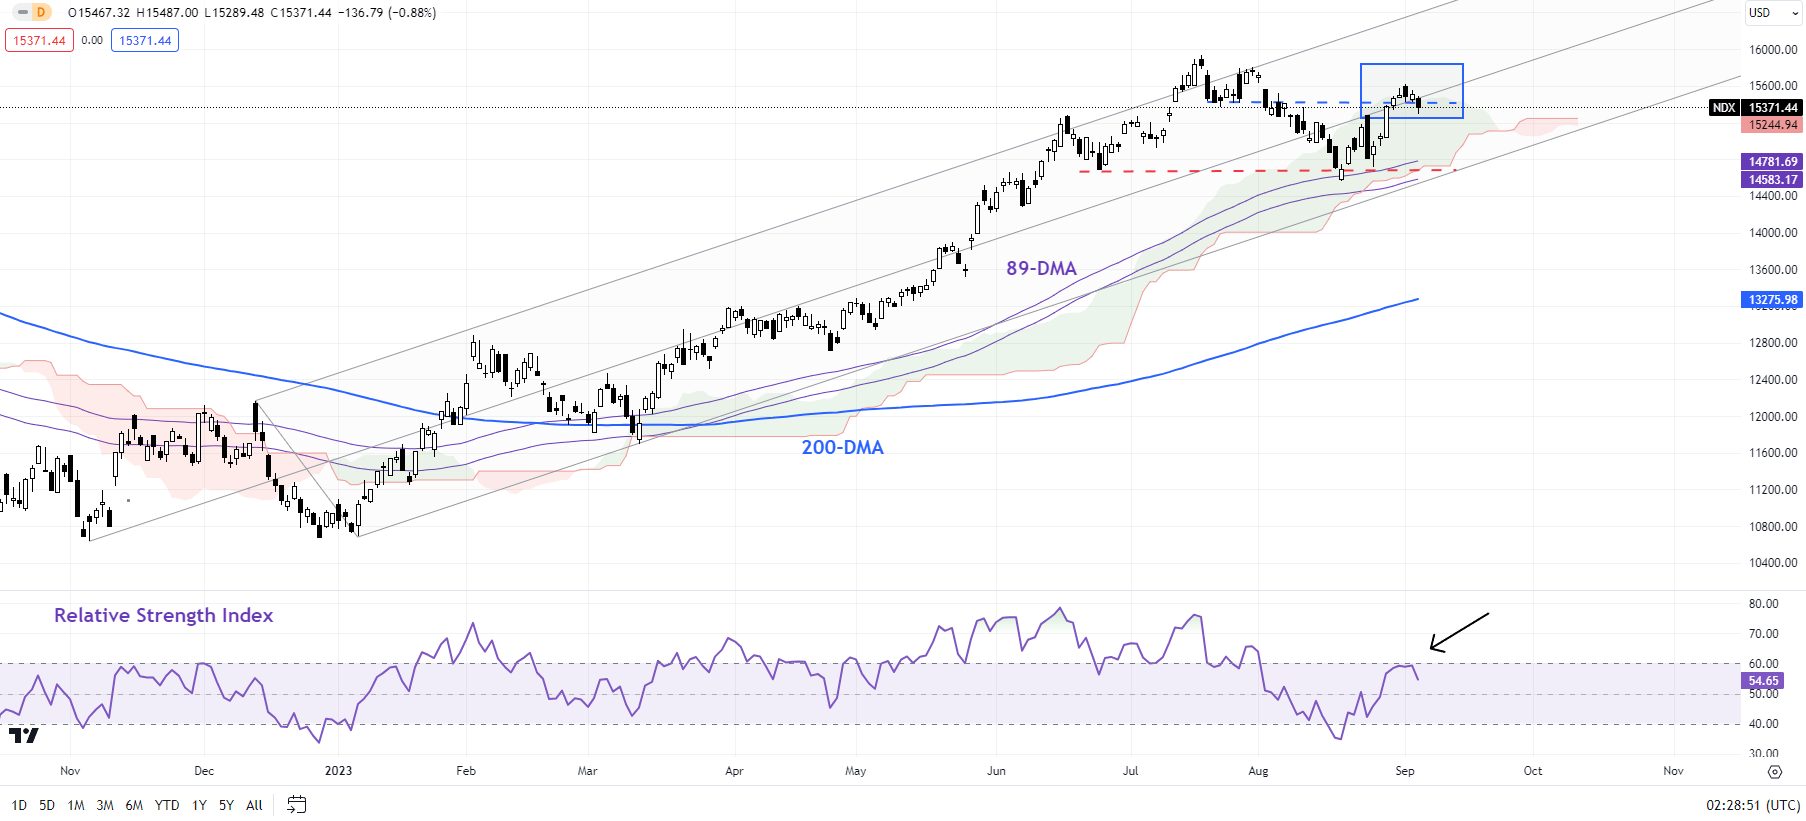
Nasdaq 100 Daily Chart

image1.png

Nasdaq 100: Rally appearing to be running out of fuel

On technical charts, the Nasdaq 100 index has run into stiff resistance: the median line of a pitchfork channel since late 2022, the July 24 low of 15375, and the upper edge of the Ichimoku cloud on the daily charts – a risk highlighted in theprevious update.

The rollover of the 14-day Relative Strength Index rolling from near the 60-level raises the odds that the bounce from late August is corrective. Nasdaq mid-August rebounded from vital cushion area, including the 89-day moving average, the lower edge of the Ichimoku cloud on the daily chart, and the June low of 14700. Any break below immediate support at the late-August high of 15280 would confirm that the upward pressure from August had faded, potentially opening the way toward the August low of 14550.

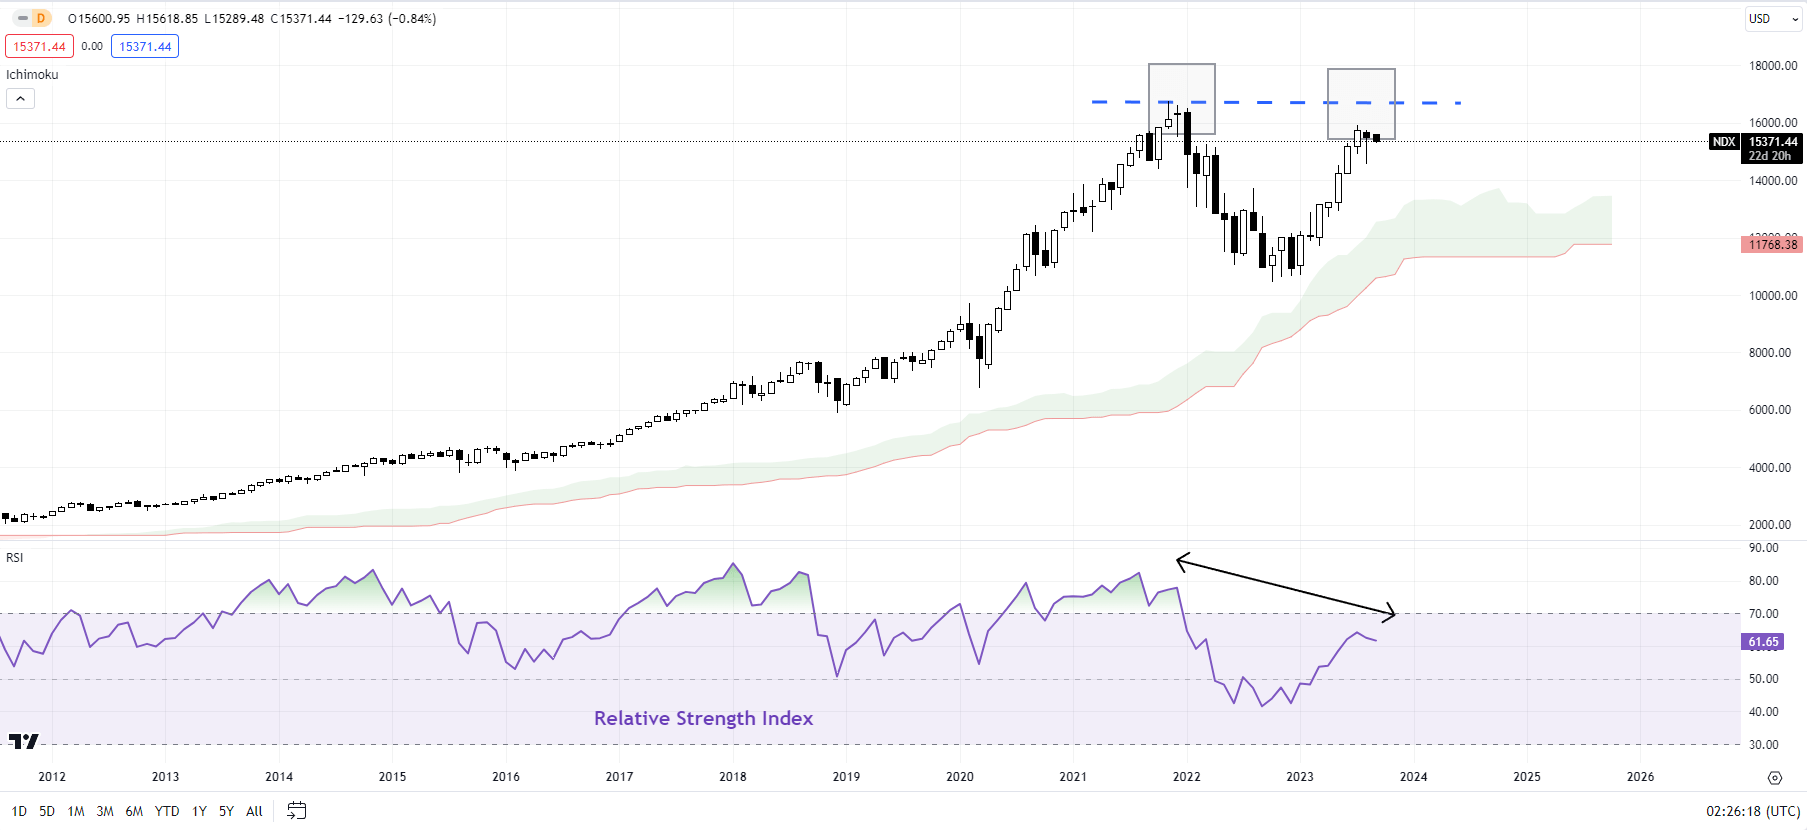
Nasdaq 100 Monthly Chart

image2.png

More broadly, as noted in “S&P 500, Nasdaq 100 Forecast: Overly Optimistic Sentiment Poses a Minor Setback Risk,” published July 23, monthly charts have been feeble compared with the 50% rally since October (see the monthly chart), raising the risk of a gradual weakening pattern in gold in recent months. For more discussion, see “Is Nasdaq Following Gold’s Footsteps? NDX, XAU/USD Price Setups,” published August 14.

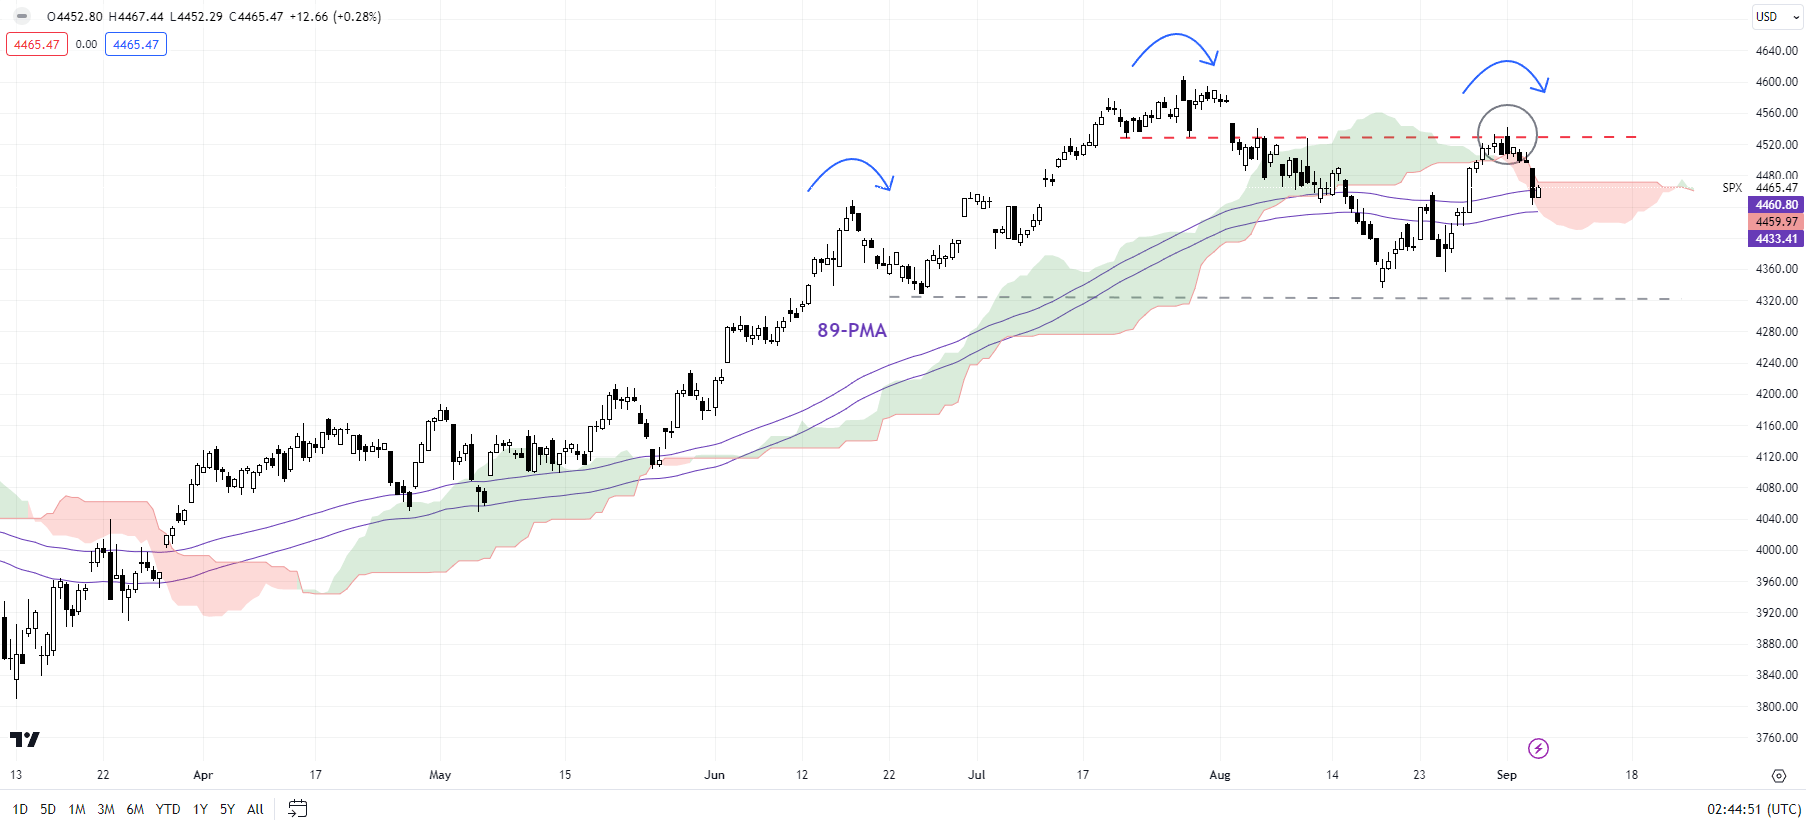
S&P 500 240-Minute Chart

image3.png

S&P 500: Rally stalls for now

The S&P 500 index has surrendered some of its late-August gains as it ran into a tough ceiling on the upper edge of the Ichimoku cloud on the 240-minute charts, coinciding with the end-July low of 4600. Ashighlighted in the previous update, the index could need to clear past the support-turned-resistance at 4550 for the downside risks to dissipate.

S&P 500 Quarterly Chart

image4.png

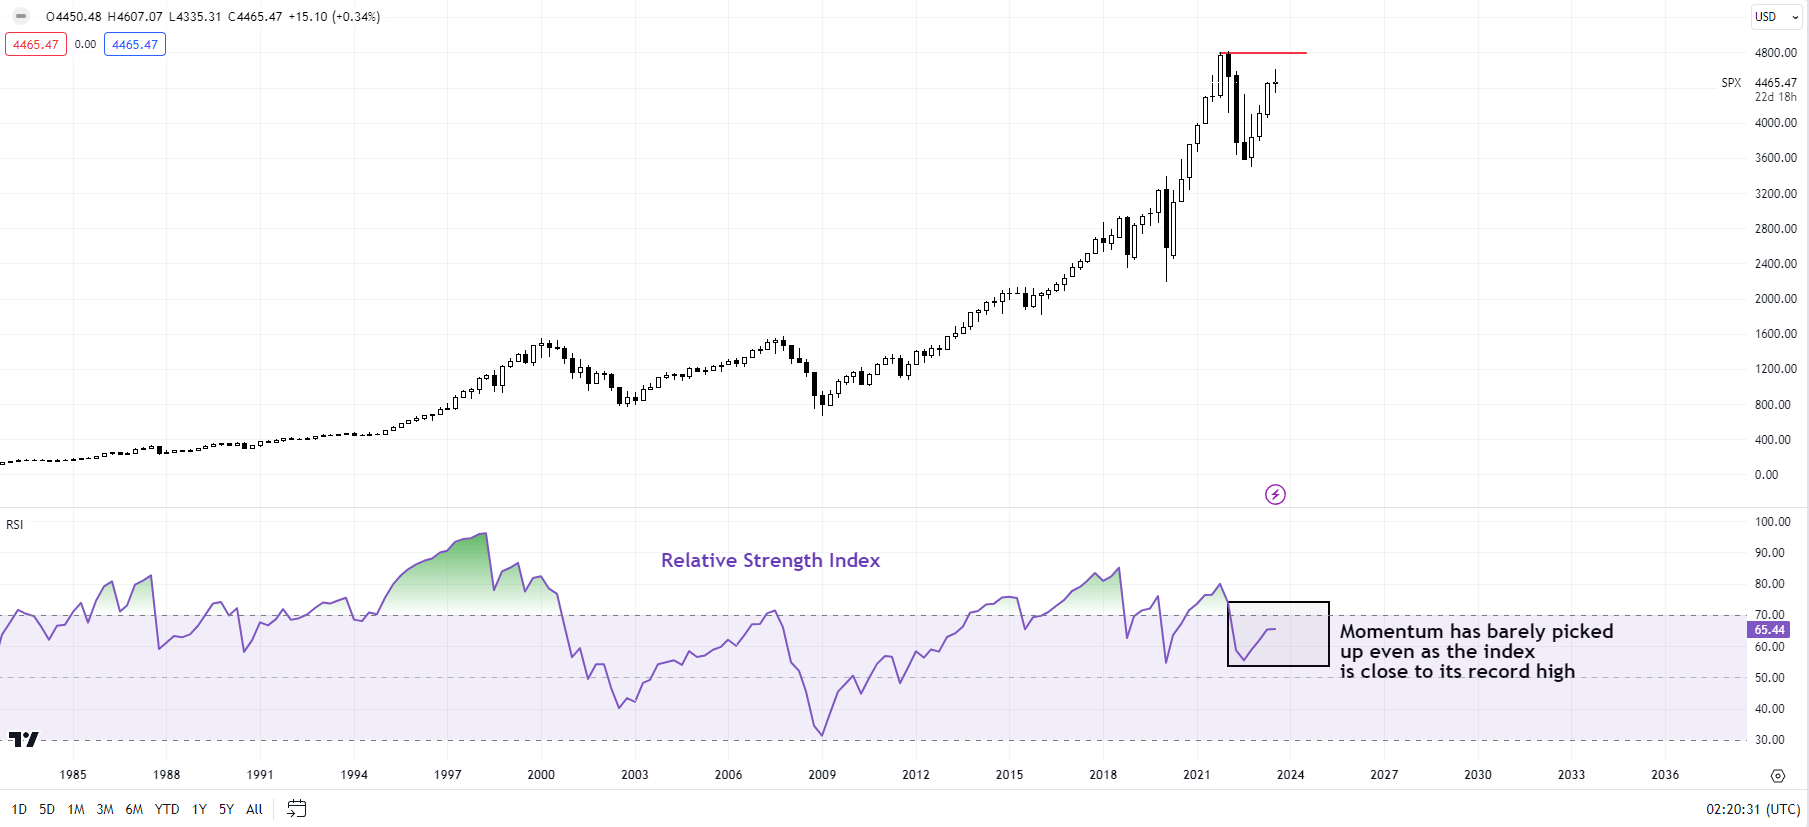
The recent retreat raises the risk of a potential lower high – for the first time since the rally began late last year. Any break below the August low of 4335 would disrupt the higher-top-higher-bottom sequence since late 2022, raising the odds that the ten-month-long rally was corrective, and not the start of a new uptrend. The feeble upward momentum on higher timeframe charts reinforces the corrective nature of the rebound. (See the quarterly chart.)

Silver Price Forecast – Silver Stabilizes on Wednesday

Silver Price Forecast – Silver Stabilizes on Wednesday

Silver Markets Technical Analysis

Silver has stabilized the bit during the trading session on Wednesday, as it looks like the selling is abating a bit in the market. We are sitting between the 50-Day EMA and the 200-Day EMA indicators, typically an area that causes a lot noise. Ultimately, if we can recapture the 50-Day EMA, then it’s possible that we could go looking to the $24.50 level above. That being said, if the market were to break down below the bottom of the candlestick during the session on Wednesday, then it opens up a move down to the 200-Day EMA, which presently sits right around the $23.40 level.

Trading Derivatives carries a high level of risk to your capital and you should only trade with money you can afford to lose. Trading Derivatives may not be suitable for all investors, so please ensure that you fully understand the risks involved, and seek independent advice if necessary. A Product Disclosure Statement (PDS) can be obtained either from this website or on request from our offices and should be considered before entering into a transaction with us. Raw Spread accounts offer spreads from 0.0 pips with a commission charge of USD $3.50 per 100k traded. Standard account offer spreads from 1 pips with no additional commission charges. Spreads on CFD indices start at 0.4 points. The information on this site is not directed at residents in any country or jurisdiction where such distribution or use would be contrary to local law or regulation.

In general, this is a market that I think continues to see a lot of noisy behavior, as silver is typically a very noisy market to begin with. That being said, the market is likely to continue to see a lot of negative correlation to the US dollar, and of course the interest rates coming out of the United States. That being said, silver is also an industrial metal and we will have to pay close attention to the idea of whether or not the market will be seeing more demand coming out of the industrial sector. I suspect that’s probably not the case, but it is always something that you need to pay attention to.

That being said, it looks like the US dollar is turning around and showing a little bit of negativity during the trading session on Wednesday, so that does help out the silver market, but that doesn’t necessarily mean that we are going to see a massive run higher. Keep in mind that we are roughly in the middle of the overall consolidation area, which features the $25.50 level at the top, and the $22.50 level on the bottom. As long as we are in the middle, then it has a situation where there is going to be a lot of hesitation and uncertainty, but we have a couple of levels that were previously mentioned that we can pay attention to in order to glean some type of trade. Furthermore, pay close attention to that negative correlation with the greenback.

ISM Services PMI Highlights Strong Growth In The Services Sector

ISM Services PMI Highlights Strong Growth In The Services Sector

On September 6, the Institute for Supply Management released ISM Services PMI report for August. The report indicated that ISM Services PMI increased from 52.7 in July to 54.5 in August, compared to analyst consensus of 52.5. Numbers above 50 show expansion. The index is in the expansion territory for the eighth month in a row.

New Orders Index improved from 55.0 in July to 57.5 in August, while Business Activity Index increased from 57.1 to 57.3.

The Institute for Supply Management commented: “There has been an increase in the rate of growth for the services sector, reflected by increases in all four subindexes that directly factor into the composite Services PMI and faster supplier deliveries.”

Today, traders also had a chance to take a look at the final reading of the S&P Global Services PMI report, which showed that S&P Global Services PMI declined from 52.3 in July to 50.5 in August, compared to analyst consensus of 51.

The ISM report has materially exceeded analyst expectations, which was a surprise after yesterday’s weak Services PMI reports from various countries.

U.S. Dollar Index tested the 105.00 level after the release of the report. The better-than-expected report boosts chances for a more hawkish Fed as the services sector remains in a good shape.

Gold declined towards the $1920 level, driven by stronger dollar and rising Treasury yields. The yield of 2-year Treasuries moved back above the 5.00% level, which was bearish for precious metals markets.

SP500 tested session lows near the 4470 level as traders reacted to the report. Rising Treasury yields have put material pressure on major indices today. The encouraging report is bearish for stocks as Fed policy outlook remains the key driver for equity markets. Traders sell stocks if they fear that Fed may be more hawkish than previously expected.

Oil Prices Forecast: Inventory Concerns Rise as OPEC+ Extends Output Cuts

Oil Prices Forecast: Inventory Concerns Rise as OPEC+ Extends Output Cuts

Mixed Performance for Crude Oil Amid Supply Concerns

Crude oil prices showcased a varied performance on Wednesday, notably after the previous session’s rise of over 1%. This shift arises from the market’s anxiety regarding a potential supply shortage. The backdrop for these concerns was set when Saudi Arabia and Russia took the unexpected step to prolong their voluntary supply reductions till year-end.

Unexpected Extension of Voluntary Cuts

The market had forecasted that both nations would continue their voluntary curtailments till October. However, the decision to stretch this period by another three months came as a surprise. Such bullish decisions have direct implications on the global oil market, invariably pushing the oil prices upwards. Moreover, Rystad estimates that the global demand for liquids will outstrip supply by about 2.7 million bpd in the upcoming quarter, further intensifying supply concerns.

Trading Derivatives carries a high level of risk to your capital and you should only trade with money you can afford to lose. Trading Derivatives may not be suitable for all investors, so please ensure that you fully understand the risks involved, and seek independent advice if necessary. A Product Disclosure Statement (PDS) can be obtained either from this website or on request from our offices and should be considered before entering into a transaction with us. Raw Spread accounts offer spreads from 0.0 pips with a commission charge of USD $3.50 per 100k traded. Standard account offer spreads from 1 pips with no additional commission charges. Spreads on CFD indices start at 0.4 points. The information on this site is not directed at residents in any country or jurisdiction where such distribution or use would be contrary to local law or regulation.

Impacts on the Western Economy and Inflation

The repercussions of these production cuts on the Western economic landscape and inflation remain uncertain. Yet, an inevitable result of mounting oil prices is an increased chance of stricter fiscal measures, particularly in the U.S., to manage inflationary pressures. Reflecting these supply apprehensions, the front-month Brent futures are nearing 9-month peaks.

Details on the Supply Cut Extensions

Delving into specifics, Saudi Arabia has committed to extending its voluntary oil output curtailment of 1 million bpd for another three months till December 2023. Simultaneously, Russia has declared its intention to diminish its oil exports by 300,000 bpd till year-end. Both these voluntary reductions are additional to the previously agreed cuts by several OPEC+ producers set to last till the end of 2024. Saudi Arabia and Russia have also set provisions to review these decisions monthly to adapt to market dynamics.

Short-Term Forecast: Bullish

With the ongoing refinery maintenance season in the U.S. during September-October, a potential dampening demand for crude could put brakes on the escalating oil prices. Nevertheless, the predominant market sentiment leans bullish, especially with G7 shelving regular reviews of the Russian oil price cap scheme. This move is noteworthy given that most Russian crude is trading above the set limits due to the global crude price rally.

Technical Analysis

4-Hour Light Crude Oil FuturesLight Crude Oil Futures on a 4-hour chart show the current price at $86.53, positioned above both the 200-4H moving average ($81.24) and the 50-4H moving average ($82.97). This suggests a prevailing bullish momentum. This interpretation is further solidified by the 14-4H RSI of 67.94, approaching overbought territory.

Although the market has retreated slightly from the previous 4-hour price of $86.63, it’s still within the main support area of $84.89 to $83.81 and below the main resistance area between $88.68 to $90.10. Overall, the current market sentiment leans bullish.

Dax Index: From China to the Eurozone: Economic Headwinds Buffet DAX Market

Dax Index: From China to the Eurozone: Economic Headwinds Buffet DAX Market

DAX Extends Losing Streak on Economic Woes

On Tuesday, the DAX fell by 0.34%. Following a 0.10% decline on Monday, the DAX ended the day at 15,772. Significantly, the DAX extended the losing streak to three sessions.

Service Sector Activity Contracts at a Faster Rate

Euro area service sector PMIs for August fueled recessionary fears on Tuesday. Unexpected contractions across the Italian and Spanish services sectors weighed on investor sentiment. Poor service sector PMI numbers for France, Germany, and the Eurozone added to the bearish mood.

Trading Derivatives carries a high level of risk to your capital and you should only trade with money you can afford to lose. Trading Derivatives may not be suitable for all investors, so please ensure that you fully understand the risks involved, and seek independent advice if necessary. A Product Disclosure Statement (PDS) can be obtained either from this website or on request from our offices and should be considered before entering into a transaction with us. Raw Spread accounts offer spreads from 0.0 pips with a commission charge of USD $3.50 per 100k traded. Standard account offer spreads from 1 pips with no additional commission charges. Spreads on CFD indices start at 0.4 points. The information on this site is not directed at residents in any country or jurisdiction where such distribution or use would be contrary to local law or regulation.

China Economic Activity Slowed to Set the Tone

Service sector PMI numbers from China have raised questions about the ability of the Chinese government to reboot the economy. The all-important Caixin Services PMI fell from 54.1 to 51.8. Economists forecast a more modest decline to 53.6.

While avoiding sub-50, the first fall in new overseas business since December 2022 warned of a possible contraction.

US Factory Orders Deliver Little Comfort

US factory orders also signaled a gloomy macroeconomic backdrop. Factory orders slid by 2.1% in July (June: +2.3%). Economists forecast a 2.5% decline.

Despite the slide in orders, the figures had a limited impact on Fed interest rate bets. The US manufacturing sector accounts for less than 30% of the US economy, limiting the effect of sector numbers on Fed policy goals. The Fed will focus on service sector activity, employment, wage growth, and inflation.

The Tuesday Market Movers

Commerzbank was the worst performer on the DAX, tumbling by 6.10%. Investors respond to news of Barclays downgrading the stock to underweight. Concerns over non-performing loans have weighed on Commerzbank. The broader banking sector also struggled, with Deutsche Bank ending the day down 2.96%.

Today’s Session

The German economy is in the spotlight again this morning. Factory orders for July will draw interest. After the grim private sector PMIs, investors need some good news. However, economists forecast factory orders to slide by 4%. In June, factory orders unexpectedly surged by 7.0%.

Later in the session, euro area retail sales numbers will provide direction. Economists forecast retail sales across the Eurozone to fall by 0.1%. A continued downward trend in consumer spending would add to the bets on a Eurozone recession. Household spending accounts for about 50% of the euro area economy.

The numbers affect sentiment toward the economy and ECB monetary policy. A downward trend in retail sales would ease demand-driven inflationary pressures.

Away from the numbers, ECB Executive Board Member Elizabeth McCaul is on the calendar to speak. With the markets still betting on a September ECB rate hike, talk of hitting the brakes would provide support.

The DAX Futures was down 10 points this morning.

US ISM Non-Manufacturing PMI a Stern Test

The US ISM Non-Manufacturing PMI will garner more interest. A sharp decline in sector activity would fuel fears of a US hard landing. Notably, the US services sector accounts for more than 70% of the US economy, giving the numbers a significant weighting.

In contrast, hotter-than-expected PMI numbers would raise bets on a final Fed rate hike. Neither scenario is ideal for the DAX. However, better-than-expected numbers would be more supportive of riskier assets.

Short-Term Forecast

Euro area indicators are flashing red, signaling a German recession. The weak demand environment is also impacting service sector activity. Barring measures to boost demand, contradictory to ECB efforts to tame inflation, the DAX will likely remain under pressure.

DAX Technical Indicators

Daily Chart

The DAX pulled back further from the 50-day EMA, sending a bearish near-term price signal. However, the trend line and 15,663 support level limited the downside despite the service sector PMIs.

Another weak set of euro area numbers and steady numbers from the US could see the DAX break below the trend line and support level (15,663). A return to sub-15,600 would bring the 15,459-support level and the 200-day EMA into play. While the euro area numbers will influence, the US ISM Non-Manufacturing PMI will likely have more impact.

The 14-Daily RSI reading of 46.28 gives the DAX room to test sub-15,600 before entering oversold territory.


DAX Daily Chart sends bearish near-term price signals.


4-Hourly Chart

The DAX remains below the 50-day and 200-day EMAs, reaffirming bearish price signals. Another round of weak euro area economic indicators would support a break below the trend line. However, US economic indicators must signal more Fed rate hikes to force an extended sell-off.

Better-than-expected numbers from the euro area and steady US PMI numbers would give the bulls a run at the 50-day EMA. A move through the 50-day EMA would bring the 200-day EMA into play.

The 45.20 RSI reading shows the DAX can break below the trend line before entering oversold territory.

4-Hourly Chart affirms bearish near-term price signals.
DAX 060923 4-Hourly Chart
USD to CAD Prices Forecast: Canadian Dollar Teeters Amid BOC Anticipation

USD to CAD Prices Forecast: Canadian Dollar Teeters Amid BOC Anticipation

USD/CAD Nears Six-Month High

The USD to CAD currency pair is edging closer to a six-month peak on Wednesday as anticipation grows around today’s Bank of Canada (BOC) policy meeting. With the U.S. Treasury yields rising, the U.S. Dollar is gaining traction due to global concerns stemming from China and the implications of global growth.

Federal Reserve and Economic Indicators

Recent comments from Federal Reserve Governor Christopher Waller highlight the flexibility the U.S. central bank has in contemplating future interest rate hikes. Current market predictions lean towards the Fed maintaining the existing rates, evidenced by a 93% likelihood shown in the CME FedWatch tool. These speculations arise amidst escalating oil prices and their potential impact on the economy, causing experts like Ed Moya of Oanda to hint at the possibility of oil prices touching the $100 benchmark.

Trading Derivatives carries a high level of risk to your capital and you should only trade with money you can afford to lose. Trading Derivatives may not be suitable for all investors, so please ensure that you fully understand the risks involved, and seek independent advice if necessary. A Product Disclosure Statement (PDS) can be obtained either from this website or on request from our offices and should be considered before entering into a transaction with us. Raw Spread accounts offer spreads from 0.0 pips with a commission charge of USD $3.50 per 100k traded. Standard account offer spreads from 1 pips with no additional commission charges. Spreads on CFD indices start at 0.4 points. The information on this site is not directed at residents in any country or jurisdiction where such distribution or use would be contrary to local law or regulation.

Canadian Economy and BOC Interest Rate Predictions

A majority of economists, based on a Reuters poll, anticipate the Bank of Canada to maintain its key interest rate at 5.00% until the end of March 2024. Despite this consensus, inflation rates in Canada have surpassed expectations, rising to 3.3% in July. This uptick, coupled with the revival signs in the housing market, suggests the Bank of Canada may have reached its terminal rate.

The Housing Market’s Influence

The Canadian housing market witnessed an approximate 50% surge during the pandemic and has only receded by around 10%. Although home prices are projected to decrease by 5.0% this year, the anticipated decline is milder than earlier forecasts. Experts believe that if the Bank of Canada indicates a rate reduction in the future, the housing market will experience renewed strength.

A Balanced Outlook

Given the current economic indicators and market sentiment, the outlook leans towards a steady stance on interest rates by the Bank of Canada. However, external factors like global growth concerns, inflation rates, and the housing market can tilt the scales, making the financial climate cautiously optimistic.

Short-Term Forecast: Cautious Optimism

Given the intricate interplay of global concerns, rising inflation, and housing market fluctuations, the short-term outlook for the USD/CAD is mixed. While current indicators suggest stability, external pressures could introduce volatility. Traders should approach the pair with cautious optimism in the near term.

Technical Analysis

4-Hour USD to CADBased on the 4-hour chart metrics, the current price of 1.3660 is precisely at the main resistance level, which ranges from 1.3612 to 1.3660. This could indicate a critical decision point for traders.

The 14-4H RSI is at 64.30, indicating stronger momentum but not yet reaching the ‘overbought’ threshold of 70.

Both the 200-4H and 50-4H moving averages are below the current price, at 1.3431 and 1.3577, respectively, suggesting a bullish trend in the short to medium term. Given this, market sentiment leans bullish.

Auto Fuel Drop Drives Euro Zone Retail Sales Decline in July

Auto Fuel Drop Drives Euro Zone Retail Sales Decline in July

Euro Area Retail Trade Volume Decline

The July 2023 seasonally adjusted retail trade volume saw a decrease of 0.2% in the euro area and 0.3% in the EU, contrasting June 2023’s 0.2% uptick. This data stems from estimates by Eurostat, the European Union’s statistical office. Comparing July 2023 with the same month in 2022, retail sales fell 1.0% in the euro area and 1.2% in the entire EU.

Monthly Retail Sector Breakdown

In July 2023, the euro area’s automotive fuel retail volume declined by 1.2%. However, there was a rise of 0.4% in food, drinks, and tobacco, and a 0.5% growth for non-food products. Simultaneously, the EU experienced a 1.1% reduction for automotive fuels, but food, drinks, and tobacco grew by 0.2%, and non-food items witnessed a 0.6% increase. Denmark and Ireland led the Member States with the steepest monthly decreases at -2.3%. Meanwhile, Portugal (+1.1%), Sweden (+1.0%), and Cyprus (+0.8%) saw the most significant growth.

Yearly Retail Sector Analysis

Analyzing data from July 2023 against July 2022, the euro area experienced a 3.4% decrease in automotive fuel retail volume and a 2.2% dip for food, drinks, and tobacco. On the bright side, non-food products had a growth of 1.1%. For the broader EU, the volume of retail trade went down by 3.9% for automotive fuels and 2.4% for food and beverages, but non-food products improved by 0.7%. Slovenia suffered the most considerable yearly volume decrease, plummeting by 16.3%. Conversely, Spain led the growth charge with an impressive 8.6% increase.

Short-Term Forecast

Given the current landscape, the retail trade environment seems to be cautiously bearish. Mixed results across different sectors, combined with various performances among Member States, introduce potential volatility in the near term. Traders and stakeholders are advised to stay abreast of evolving trends and regional differences.

Silver Prices Forecast: XAG/USD Undermined by Soaring U.S. Yields

Silver Prices Forecast: XAG/USD Undermined by Soaring U.S. Yields

U.S. Dollar’s Rise Pressures Precious Metals

Silver (XAG/USD) prices experienced a significant downturn on Wednesday, reaching their lowest since August 23rd. This drop coincides with the U.S. dollar approaching a six-month high and a surge in U.S. Treasury yields. The prevailing sentiment suggests an ongoing demand for high-interest rates, largely fueled by concerns surrounding China’s economic status and worldwide growth. Consequently, silver, similar to gold, becomes less accessible for those holding foreign currencies.

Market Concerns Amidst Economic Indicators

As trading resumed post-Labor Day, all eyes turned to the mounting U.S. Treasury yields. Notably, oil prices are on an upward trajectory, rekindling fears of the $100 benchmark. Wall Street is apprehensive, predicting stocks will find it challenging to outpace Treasuries. The backdrop to this market tension is last Friday’s nonfarm payrolls report, which indicated a peak in unemployment rates since early 2022 and declining hourly earnings, causing a shift in investors’ views on inflation and Federal Reserve policies.

Trading Derivatives carries a high level of risk to your capital and you should only trade with money you can afford to lose. Trading Derivatives may not be suitable for all investors, so please ensure that you fully understand the risks involved, and seek independent advice if necessary. A Product Disclosure Statement (PDS) can be obtained either from this website or on request from our offices and should be considered before entering into a transaction with us. Raw Spread accounts offer spreads from 0.0 pips with a commission charge of USD $3.50 per 100k traded. Standard account offer spreads from 1 pips with no additional commission charges. Spreads on CFD indices start at 0.4 points. The information on this site is not directed at residents in any country or jurisdiction where such distribution or use would be contrary to local law or regulation.

Federal Reserve Deliberations

In light of recent economic indicators, including a cooling labor market, the impending Federal Reserve policy meeting is generating buzz. Most market pundits, informed by Governor Christopher Waller’s remarks, predict no changes in interest rates. As of now, the CME FedWatch tool signals a 93% likelihood of rates remaining constant. Speculation also surrounds the potential for additional tightening later in the year, contingent on forthcoming economic data.

Global Business Decline and the U.S. Dollar’s Ascendance

Recent reports indicate a slowing global business landscape, bolstering the appeal of the U.S. dollar as a stable asset over precious metals like silver and gold. Confirming this sentiment, the SPDR Gold Trust, a leading gold-backed exchange-traded fund, registered a 0.1% drop in its holdings.

Silver Outlook: A Cautionary Tale

The intersecting forces of burgeoning U.S. interest rates, soaring Treasury bond yields, and a robust U.S. dollar forecast a bearish short-term future for silver. The increased opportunity costs associated with retaining unyielding silver, in conjunction with impending policy shifts, cement a gloomy prediction for this precious metal.

Technical Analysis

4-Hour Silver (XAGUSD)The current 4-hour price of 23.41 sits below both the 200-4H moving average (23.75) and the 50-4H moving average (24.24), indicating a bearish trend. The 14-4H RSI at 30.74 suggests the commodity is nearing oversold conditions, signaling potential exhaustion in the recent downward momentum.

Furthermore, the price remains above the main support zone (22.70 to 22.28) but has room before reaching the main resistance (25.00 to 25.27). No minor support or resistance levels have been identified. Collectively, these technical indicators suggest a currently bearish sentiment for Silver on a 4-hour chart perspective.