Oil Prices Forecast: Russian Export Ban Elevates Global Oil Price Concerns

Oil Prices Forecast: Russian Export Ban Elevates Global Oil Price Concerns

Global Supply Concerns Drive Oil Prices Higher

Rising tensions have pushed oil prices higher as Russia’s ban on fuel exports raises alarms over tightening global supply. This comes even as apprehensions surrounding U.S. interest rate hikes that might impact demand linger.

Brent futures experienced a 0.5% climb to reach $93.80 a barrel, and U.S. West Texas Intermediate crude (WTI) futures saw a 0.7% increase, positioning at $90.26 a barrel. Despite this, the benchmarks are set for a marginal weekly fall after a robust gain of over 10% in the prior three weeks. A notable factor in this trend is the OPEC+’s decision to uphold production cuts.

Trading Derivatives carries a high level of risk to your capital and you should only trade with money you can afford to lose. Trading Derivatives may not be suitable for all investors, so please ensure that you fully understand the risks involved, and seek independent advice if necessary. A Product Disclosure Statement (PDS) can be obtained either from this website or on request from our offices and should be considered before entering into a transaction with us. Raw Spread accounts offer spreads from 0.0 pips with a commission charge of USD $3.50 per 100k traded. Standard account offer spreads from 1 pips with no additional commission charges. Spreads on CFD indices start at 0.4 points. The information on this site is not directed at residents in any country or jurisdiction where such distribution or use would be contrary to local law or regulation.

Monetary Policies and Oil Demand Worries

On the backdrop of the Russian fuel export ban, oil trade remains volatile. This uncertainty is a result of conflicting sentiments—supply anxieties due to the Russian move versus concerns about dwindling demand courtesy stricter monetary regimes in the U.S. and Europe.

With the U.S. Federal Reserve’s announcement to retain interest rates but assume a firmer hawkish stance, predictions indicate a rise to between 5.50-5.75% by the end of the year. This move stokes fears about hampered economic growth and the resulting reduced fuel demand. Moreover, with the U.S. dollar reaching its peak since early March, oil and similar commodities become pricier for those transacting in other currencies.

Central Banks’ Rate Stance

Not just the U.S. Federal Reserve, but the Bank of England also refrained from altering interest rates after a series of hikes. However, the Bank doesn’t seem complacent about the recent dip in inflation.

Meanwhile, a European Central Bank (ECB) governing council member hinted at the possibility of stable interest rates in their upcoming policy meeting. Norway stood out as its central bank not only hiked its benchmark rate but also hinted at another increase in December.

Outlook on Supply and Demand Dynamics

Amid the monetary policy shifts and geopolitical moves, oil prices have displayed resilience due to persistent concerns about the supply side. With global supply worries looming large, especially as we head into Q4, oil’s stronghold continues.

This sentiment is further cemented by the fact that U.S. crude stocks, particularly at Cushing (the WTI delivery hub), are at a historic low since July 2022, as OPEC+ remains firm on their production cut strategy.

Short-Term Forecast

Given the intricacies of central bank decisions, geopolitical tensions, and supply-side challenges, the short-term outlook for oil remains bullish. Traders and investors are advised to keep a keen eye on OPEC+ moves and monitor global monetary policy shifts to navigate this complex landscape.

Technical Analysis

4-Hour Light Crude Oil Futures

The current 4-hour price of $90.28 is slightly above the previous 4-hour price of $89.92, indicating a modest uptick. The price is well above the long-term 200-4H moving average of $84.41 but only slightly above the short-term 50-4H moving average of $89.82, suggesting an intermediate bullish stance. The 14-4H RSI stands at 52.65, denoting marginally strong momentum without being overbought.

As for support and resistance, the commodity price lies between the main support area of $84.89-$83.81 and the main resistance area of $90.10-$93.74. Given the positioning between these crucial levels and the RSI reading, the current market sentiment appears cautiously bullish.

DAX Index: PMI Focus as Services Sector Feels the Squeeze

DAX Index: PMI Focus as Services Sector Feels the Squeeze

DAX Thursday Overview

On Thursday, the DAX slid by 1.33%. Reversing a 0.75% gain from Wednesday, the DAX ended the day at 15,572.

Higher for Longer Theme to Set the Tone

The higher-for-longer interest rate outlook continued to push government bond yields higher.

Trading Derivatives carries a high level of risk to your capital and you should only trade with money you can afford to lose. Trading Derivatives may not be suitable for all investors, so please ensure that you fully understand the risks involved, and seek independent advice if necessary. A Product Disclosure Statement (PDS) can be obtained either from this website or on request from our offices and should be considered before entering into a transaction with us. Raw Spread accounts offer spreads from 0.0 pips with a commission charge of USD $3.50 per 100k traded. Standard account offer spreads from 1 pips with no additional commission charges. Spreads on CFD indices start at 0.4 points. The information on this site is not directed at residents in any country or jurisdiction where such distribution or use would be contrary to local law or regulation.

While central banks enter the ‘pause phase,’ the higher for longer mantra has erased hope for a more accommodative policy outlook.

Eurozone Consumer Confidence reflected expectations of elevated interest rates amidst a deteriorating macroeconomic environment. The Eurozone consumer confidence index fell from -16.0 to -17.8.

US Jobless Claims Spooks Investors

US jobless claims fell from 221k to 201k, according to figures out on Thursday. The labor market numbers aligned with the upbeat FOMC economic projections, supporting the more hawkish interest rate path.

The US equity markets responded to the labor market numbers, with the NASDAQ Composite Index sliding by 1.82%. It was also a grim session for the Dow and S&P 500, which saw losses of 1.08% and 1.64%, respectively.

The Thursday Market Movers

Four stocks bucked the bearish trend, including Commerzbank, which gained 0.50%. CFO projections on interest income resonated.

However, investor sentiment toward Fed monetary policy and the German economic outlook left the broader market in negative territory. BASF and Sartorius AG slid by 4.86% and 4.17%, respectively. Siemens Energy (-3.09%), Bayer (-2.82%), and Adidas (-2.40%) were also among the biggest losers.

Euro Area Private Sector PMIs in the Spotlight

German and Eurozone private sector PMIs for September will draw investor interest today. A more marked contraction across the manufacturing and services sector would weigh on buyer appetite.

Economists forecast the German services PMI to decline from 47.3 to 47.2 and the manufacturing PMI to rise from 39.1 to 39.5. Eurozone projections follow a similar trend. Economists forecast the Eurozone services PMI to fall from 47.9 to 47.7 and the manufacturing PMI to increase from 43.5 to 44.0.

With the services sector contributing over 60% to the Eurozone economy, the DAX will show more sensitivity to the services PMIs. A more marked contraction would further support a prolonged economic recession.

US Services PMI to Conclude a Volatile Week

US private sector PMIs will also need consideration. A hotter-than-expected US services PMI would support a more hawkish Fed interest rate path. The prospects of further Fed rate hikes and reducing chances of a 2024 Fed rate cut have weighed on the appetite for riskier assets.

Economists forecast the services PMI to increase from 50.5 to 50.6.

Short-Term Forecast

A more hawkish Fed policy outlook and the threat of a higher-for-longer Eurozone interest rate environment leave the DAX on the defensive. Euro area and US services PMIs will influence buyer appetite today and likely support the near-term bullish trend reversal.

DAX Technical Indicators

Daily Chart

The DAX sat below the 50-day EMA while remaining above the 200-day EMA, sending bearish near-term but bullish longer-term price signals.

A break above the 15,663 resistance level would support a DAX move to the trend line and 50-day EMA. Selling pressure will likely intensify at 15,830. The 50-day EMA is confluent with the trend line.

To break above the 15,663 resistance level, private-sector PMIs would need to exceed forecasts.

However, weaker services PMIs would support a DAX move toward the 200-day EMA and the 15,459 support level. Buying pressure will build at 15,470, with the 200-day EMA confluent with the 15,459 support level.

The 14-Daily RSI reading of 41.47 supports a DAX break below the 200-day EMA and 15,459 support level before entering oversold territory.

DAX Daily Chart sends mixed price signals.
DAX 220923 Daily Chart

4-Hourly Chart

The DAX, sitting below the 50-day and 200-day EMAs, sends bearish price signals. A DAX break above the 15,663 resistance level would support a move to the 50-day EMA.

However, a fall to 15,500 would give the bears a run at the 15,459 support level.

The 38.15 RSI reading supports a DAX break fall to 15,500 before entering overbought territory.

4-Hourly Chart sends bearish price signals.
DAX 220923 4-Hourly Chart
EUR/USD Forecast: PMIs Pose Risks; Euro Navigates Uncertainty

EUR/USD Forecast: PMIs Pose Risks; Euro Navigates Uncertainty

Thursday Overview

On Thursday, the EUR/USD slipped by 0.02%. Following a 0.18% loss on Wednesday, the EUR/USD ended the day at $1.06579. The EUR/USD fell to a low of $1.06167 before rising to a high of $1.06736.

Private Sector PMIs and ECB Chatter in Focus

After the ECB rate hike, possibly for a final time, investor focus will be firmly on the macroeconomic environment. Manufacturing and Services PMIs for France, Germany, and the Eurozone will influence the EUR/USD pair.

Trading Derivatives carries a high level of risk to your capital and you should only trade with money you can afford to lose. Trading Derivatives may not be suitable for all investors, so please ensure that you fully understand the risks involved, and seek independent advice if necessary. A Product Disclosure Statement (PDS) can be obtained either from this website or on request from our offices and should be considered before entering into a transaction with us. Raw Spread accounts offer spreads from 0.0 pips with a commission charge of USD $3.50 per 100k traded. Standard account offer spreads from 1 pips with no additional commission charges. Spreads on CFD indices start at 0.4 points. The information on this site is not directed at residents in any country or jurisdiction where such distribution or use would be contrary to local law or regulation.

Economists forecast modest increases in the manufacturing PMIs. However, economists predict a more marked contraction across the euro area services sector.

Economists predict the Eurozone manufacturing PMI to rise from 43.5 to 44.0 and the services PMI to fall from 47.9 to 47.7. The services PMIs will influence the EUR/USD more, with the euro area services sector accounting for more than 60% of GDP.

A more marked decline in service sector activity would put the euro area at risk of a prolonged recession. An elevated interest rate environment curbs consumer spending, further impacting service sector activity.

Beyond the numbers, ECB Chief Economist Philip Lane and ECB Executive Board member Luis de Guindos are on the calendar to speak. Lane will have more influence on the EUR/USD. A deviation from the higher-for-longer interest rate outlook would move the dial.

US Services PMI to Affirm Sentiment Toward Fed Policy Outlook

US private sector PMIs will draw investor interest later today. The services PMI will have more influence on sentiment toward Fed policy bets.

US services sector activity contributes over 75% to GDP. A pickup in service sector activity would fuel demand-driven inflation. Higher interest rates would curb consumption and ease demand-driven inflationary pressures.

Economists forecast the services PMI to increase from 50.5 to 50.6 in September. Hotter-than-expected services PMI numbers would also support bets on the Fed delaying rate cuts until 2025.

Short-Term Forecast:

Monetary policy and economic divergence remain firmly tilted in favor of the US dollar. However, an unexpected contraction across the US services sector could change the narrative. Near-term EUR/USD trends hinge on the services sector PMIs.

EUR/USD Price Action

Daily Chart

The EUR/USD positioned below the 50-day and 200-day EMAs is indicative of bearish price signals.

A more marked contraction across the euro area services sector would support a EUR/USD break below the $1.06342 support level. A break below the support level would bring sub-$1.06 into play.

However, an unexpected contraction across the US services sector would support a EUR/USD return to 1.07. The EUR/USD would need a sharp rise in service sector PMIs to support a move toward the $1.07635 resistance level.

The 14-period Daily RSI at 35.78 supports a EUR/USD break below the $1.06342 support level before entering oversold territory.

EUR/USD Daily Chart sends bearish price signals.
EURUSD 220923 Daily Chart

4-Hour Chart

The EUR/USD remains below the 50-day and 200-day EMAs, reaffirming the bearish price signals. A break above the 50-day EMA would support a EUR/USD return to $1.07.

However, a EUR/USD fall through the $1.06342 support level would bring sub-$1.06 into play.

The 14-period 4-Hourly RSI at 45.67 supports a EUR/USD fall through the $1.06342 support level before entering oversold territory.

4-Hourly Chart affirms bearish price signals.
EURUSD 220923 4 Hourly Chart
Eurozone PMI Numbers Underscore Manufacturing and Services Slump

Eurozone PMI Numbers Underscore Manufacturing and Services Slump

Eurozone Confronts Economic Contractions Amid Fading Demand

The Eurozone has encountered a notable decline in the private sector, marked by the most significant dip in new orders in almost three years. As companies grapple with diminishing demand, key metrics from the HCOB Flash Eurozone PMI reveal the depth of this economic slump.

Manufacturing continues to be the leading contributor to the decline in the Eurozone’s output. The HCOB Flash Eurozone Manufacturing PMI Output Index remained unchanged at 43.4. The service sector, however, marked a slight improvement, with its PMI Business Activity Index rising to 48.4 from 47.9 in August. Notably, both sectors are still below the 50-mark threshold, indicating contraction.

Inflationary Pressures and Pricing

The Eurozone’s inflation story in September revealed contrasting trends. Input costs surged at their most rapid pace in four months, with services bearing the brunt due to increased wages and fuel expenses. In stark contrast, manufacturing registered a seventh continuous monthly decline in input costs. Despite rising input costs, the softer demand meant companies raised their selling prices to a lesser degree than the preceding month.

National Disparities and Impacts

Germany and France, the two major economies of the Eurozone, have been at the forefront of the downturn. Germany’s output reduced for a third straight month, whereas the contraction in France was even more pronounced, marking its steepest drop in over a decade. Meanwhile, the rest of the Eurozone observed a comparatively stable business environment in September, with a mild upturn in services.

Short-Term Forecast: Bearish Outlook

Given the contraction in both manufacturing and services sectors, the outlook for the Eurozone remains bearish. Manufacturing, especially, is in a precarious state, and while services are showing some resilience, they’re not enough to offset the decline. With companies cautious in hiring, the forecast suggests that the Eurozone is poised to enter a contraction in the third quarter. Dr. Cyrus de la Rubia, Chief Economist at Hamburg Commercial Bank, further emphasized the risk of a wage-price spiral, underscoring the challenges that lie ahead for the Eurozone economy.

Silver Prices Forecast: XAG/USD Shows Resilience Amidst Rising Rates

Silver Prices Forecast: XAG/USD Shows Resilience Amidst Rising Rates

Silver’s Response to Interest Rates

Silver (XAG/USD) marked an increase of 1.15%, settling at $23.702 per ounce on Friday. Despite a robust dollar and ascending bond yields, silver’s resilience emerges as central banks signal the retention of high interest rates. The underlying concern? Potential deceleration of global economic growth.

USD Dynamics and Treasury Yields

The U.S. dollar remains formidable, nearing a six-month pinnacle, while the 10-year Treasury yields touch a 16-year zenith. This has put equities under duress. Silver, traditionally a safe-haven asset, grapples with these heightened interest rates, which tend to weigh on metals not yielding interest.

Trading Derivatives carries a high level of risk to your capital and you should only trade with money you can afford to lose. Trading Derivatives may not be suitable for all investors, so please ensure that you fully understand the risks involved, and seek independent advice if necessary. A Product Disclosure Statement (PDS) can be obtained either from this website or on request from our offices and should be considered before entering into a transaction with us. Raw Spread accounts offer spreads from 0.0 pips with a commission charge of USD $3.50 per 100k traded. Standard account offer spreads from 1 pips with no additional commission charges. Spreads on CFD indices start at 0.4 points. The information on this site is not directed at residents in any country or jurisdiction where such distribution or use would be contrary to local law or regulation.

Federal Reserve’s Outlook

The Fed remains consistent in its rate approach, though there’s buzz about a probable rate augmentation this year, extending through 2024. This perceived hawkishness briefly pressured silver prices. However, post-FOMC spot silver depicts a more tempered dip, suggesting an anticipatory sentiment for a forthcoming U.S. rate moderation.

Market Anticipation and Indicators

Per the CME FedWatch tool, the market senses a 45% chance for another rate upswing this year and a 44% probability for rate retractions by early 2024. Contextualizing this sentiment is the Bank of Japan’s stance on sustaining ultra-low rates and the imminent PMI data release from key economies like the UK, U.S., and the Eurozone.

Short-term Forecast:  Leaning Toward Bullish

In the prevailing financial ecosystem, silver’s upward trajectory is closely tied to the evolution of Treasury yields. With these yields at notable highs, the silver market remains vigilant to upcoming U.S. employment figures and the Federal Reserve’s ensuing strategies. The prevalent sentiment? A cautious optimism veering toward a bullish disposition for silver.

Technical Analysis

4-Hour Silver (XAG/USD)The current 4-hour price of 24.015 showcases an advancement compared to the previous 4-hour close of 23.855. When observing the moving averages, the commodity is trading above both the 200-4H moving average (23.524) and the 50-4H moving average (23.374), indicating an underlying bullish momentum.

The 14-4H RSI reading of 64.35 supports this sentiment, sitting above the 50 threshold but below the overbought level, suggesting increasing but not extreme momentum.

With the current price above the main support area (23.330 to 23.105) and below the main resistance range (25.170 to 25.455), it reveals a bullish market sentiment for the short-term, as the commodity seeks to challenge higher resistance levels.

Gold Prices Forecast: XAU/USD Defies Strong Dollar, Reflecting Global Growth Worries

Gold Prices Forecast: XAU/USD Defies Strong Dollar, Reflecting Global Growth Worries

Gold Prices Respond to Central Banks’ Interest Rate Decisions

Gold (XAU/USD) prices experienced a slight increase on Friday, with a 0.2% rise to $1,925.27 per ounce, despite a strong U.S. dollar and rising bond yields. This uptick occurs in the wake of central banks from the world’s major economies signaling their commitment to maintaining high interest rates to address inflation.

These decisions reflect concerns about global economic growth rather than controlling inflation. Specifically, there’s an overarching sentiment that the momentum of global growth is diminishing.

Trading Derivatives carries a high level of risk to your capital and you should only trade with money you can afford to lose. Trading Derivatives may not be suitable for all investors, so please ensure that you fully understand the risks involved, and seek independent advice if necessary. A Product Disclosure Statement (PDS) can be obtained either from this website or on request from our offices and should be considered before entering into a transaction with us. Raw Spread accounts offer spreads from 0.0 pips with a commission charge of USD $3.50 per 100k traded. Standard account offer spreads from 1 pips with no additional commission charges. Spreads on CFD indices start at 0.4 points. The information on this site is not directed at residents in any country or jurisdiction where such distribution or use would be contrary to local law or regulation.

Dollar and Treasury Dynamics

The U.S. dollar’s position is close to a six-month peak, influenced by expectations of enduring high U.S. rates. Concurrently, 10-year Treasury yields have reached a 16-year high, putting stocks under strain. As a traditionally sought hedge against economic instability, gold faces challenges from rising interest rates, which impact non-interest-yielding bullion priced in dollars.

Federal Reserve’s Rate Stance

The Federal Reserve opted for steadiness in interest rates, though their latest projections indicate a potential rate increase within the year and a consistent approach through 2024. This stance caused a dip in gold as traders processed the Fed’s more hawkish attitude. However, spot gold saw only limited declines post-FOMC, suggesting traders are anticipating a U.S. rate cut in the future.

Market Responses and Speculations

According to the CME FedWatch tool, markets predict a 45% probability of another rate hike this year and approximately a 44% likelihood of rate reductions in early 2024. These speculations are in the backdrop of the Bank of Japan’s decision to retain ultra-low rates and the upcoming release of key PMI data from the UK, U.S., and the euro zone.

Short-Term Outlook

Given the existing dynamics, gold’s potential for significant gains hinges on slowing momentum in Treasury yields. With U.S. Treasury yields currently at multiyear highs, gold prices and the broader market will keenly watch forthcoming U.S. unemployment data and Federal Reserve’s next moves to discern any policy shifts or economic indications. The current market sentiment remains cautious, leaning towards a bullish stance for gold.

Technical Analysis

4-Hour Gold (XAU/USD)Given the provided data for Gold (XAU/USD) on the 4-hour chart, the commodity exhibits marginal upward momentum, with the current price of 1944.20 sitting just above its previous 4-hour close of 1944.10.

It’s positioned in a tight band, trading slightly below the 200-4H moving average of 1945.50 but marginally above the 50-4H moving average of 1943.20, suggesting a phase of consolidation. The 14-4H RSI at 47.27 denotes a softening momentum, steering clear from any oversold conditions.

Currently, the price maintains a position above the main support zone, between 1908.50 and 1900.60, while facing potential resistance from 1980.00 to 2000.50. The overall analysis leans towards a neutral to slightly bullish market sentiment.

Bank of Japan Unanimously Votes to Leave Interest Rates in Negative Territory

Bank of Japan Unanimously Votes to Leave Interest Rates in Negative Territory

Bank of Japan Leaves Interest Rates in Negative Territory

On Friday, the Bank of Japan left interest rates at -0.10%. The hold on interest rates came despite recent discussions of a move away from negative rates. Bank of Japan Governor Ueda recently discussed the need for wage growth and consumption to fuel demand-driven inflationary pressures before considering a shift in interest rates.

The hold on interest rates at -0.10% shifted the market focus to the Monetary Policy Statement.

Salient points from the Monetary Policy Statement included,

  • The Board unanimously voted in favor of leaving the short-term policy interest rate at -0.10%.
  • Unanimously, the Board voted to allow 10-year JGB yields to within a +/- 0.5 percentage point range.
  • The Bank will conduct Yield Curve Control (UCC) policy with greater flexibility as before.

Macroeconomic Conditions

  • Japan’s economy has recovered moderately, supporting employment and wage growth.
  • Private consumption has increased at a moderate pace despite elevated price levels.
  • Inflation expectations have shown upward movements again.
  • Japan’s economy is likely to continue recovering moderately over the near term.
  • The Board expects the annual inflation rate to decelerate over the near term.

USD/JPY Reaction to the Bank of Japan Decision

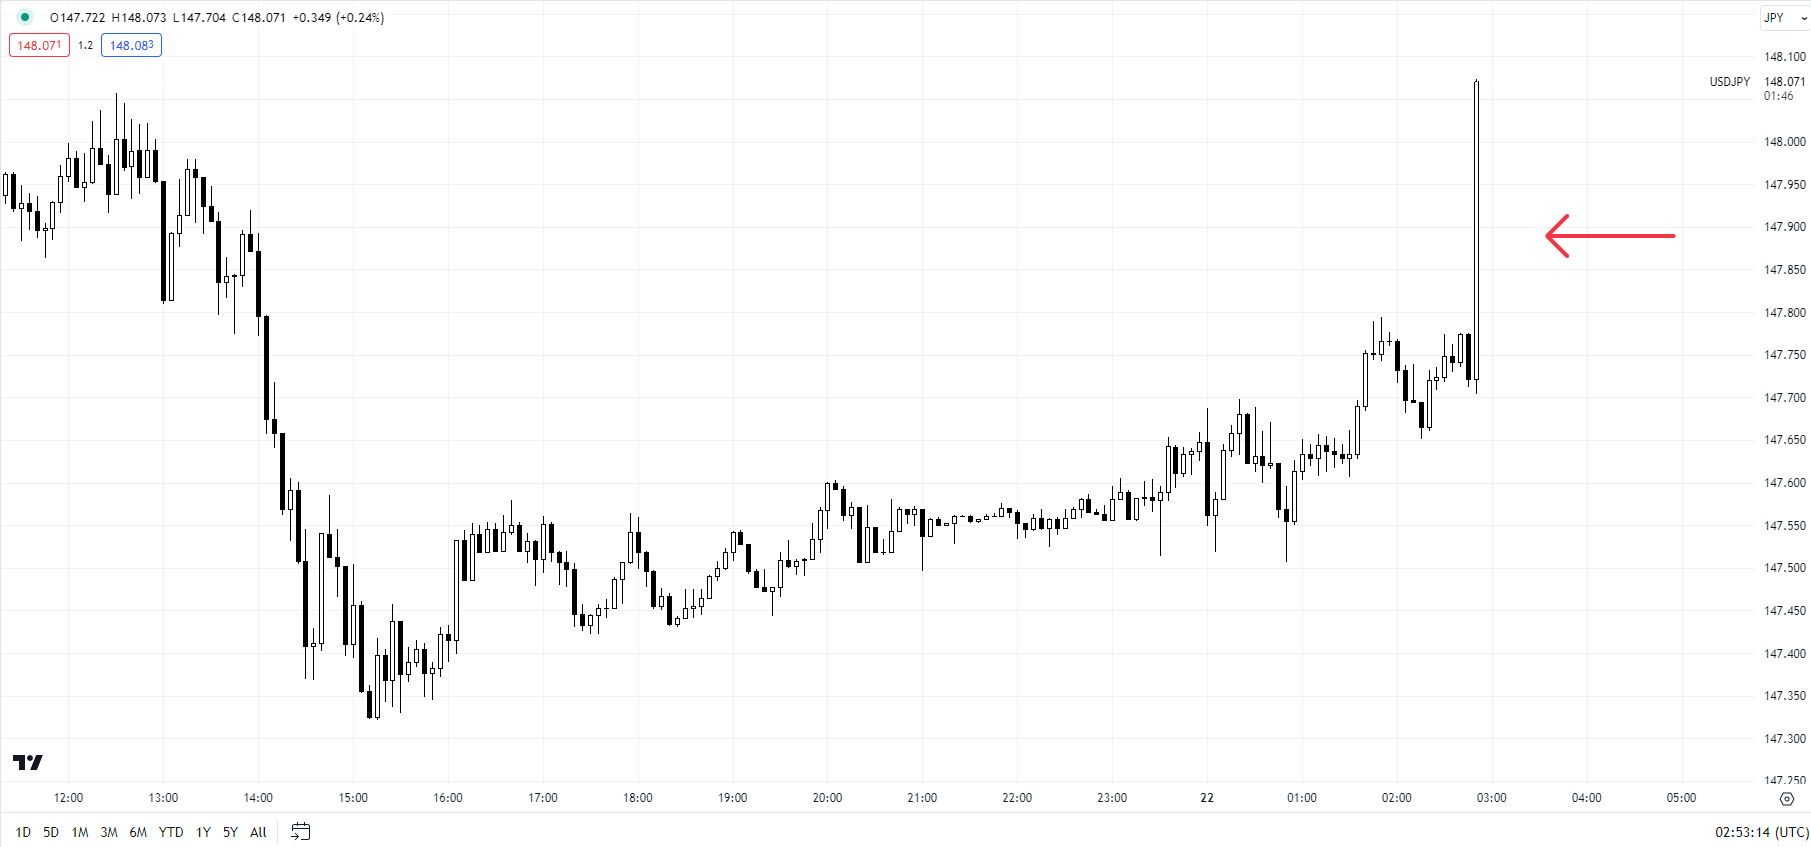
Before the Bank of Japan’s monetary policy decision, the USD/JPY fell to a pre-BoJ low of 147.496 before rising to a high of 147.794.

However, in response to the BoJ interest rate decision and Monetary Policy Statement, the USD/JPY fell to a low of 147.955 before rising to a high of 148.105.

At the time of writing, the USD/JPY was up 0.34% to 148.072.

USD/JPY 3-Minute Chart shows USD/JPY response to the BoJ policy hold.
220923 USDJPY 3 Minute Chart

Bank of Japan Press Conference to Garner Investor Interest

There will be more investor interest than usual in the Bank of Japan press conference. After holding rates unchanged, comments relating to a move away from negative rates will influence the USD/JPY pair.

However, the BoJ needs to spell out the conditions under which the Board would vote in favor of a move away from ultra-loose monetary policy. USD/JPY sensitivity to the press conference will hinge on references to a move away from negative interest rates.

The US Session

While the Bank of Japan was the focal point this morning, Fed monetary policy will be a talking point this afternoon. After the better-than-expected US jobless claims, the prelim US service sector PMI for September will garner interest.

Economists forecast the US Services PMI to increase from 50.5 to 50.6 in September.

A pickup in service sector activity would fuel further bets on a November Fed rate hike. The US services sector contributes over 75% to GDP. Higher interest rates would impact labor market stability and wage growth. Softer wage growth would ease consumption and demand-driven inflationary pressures.

Gold Price Extend Losses in the Aftermath of the Fed, XAU/USD Upside Bets Grow

Gold Price Extend Losses in the Aftermath of the Fed, XAU/USD Upside Bets Grow

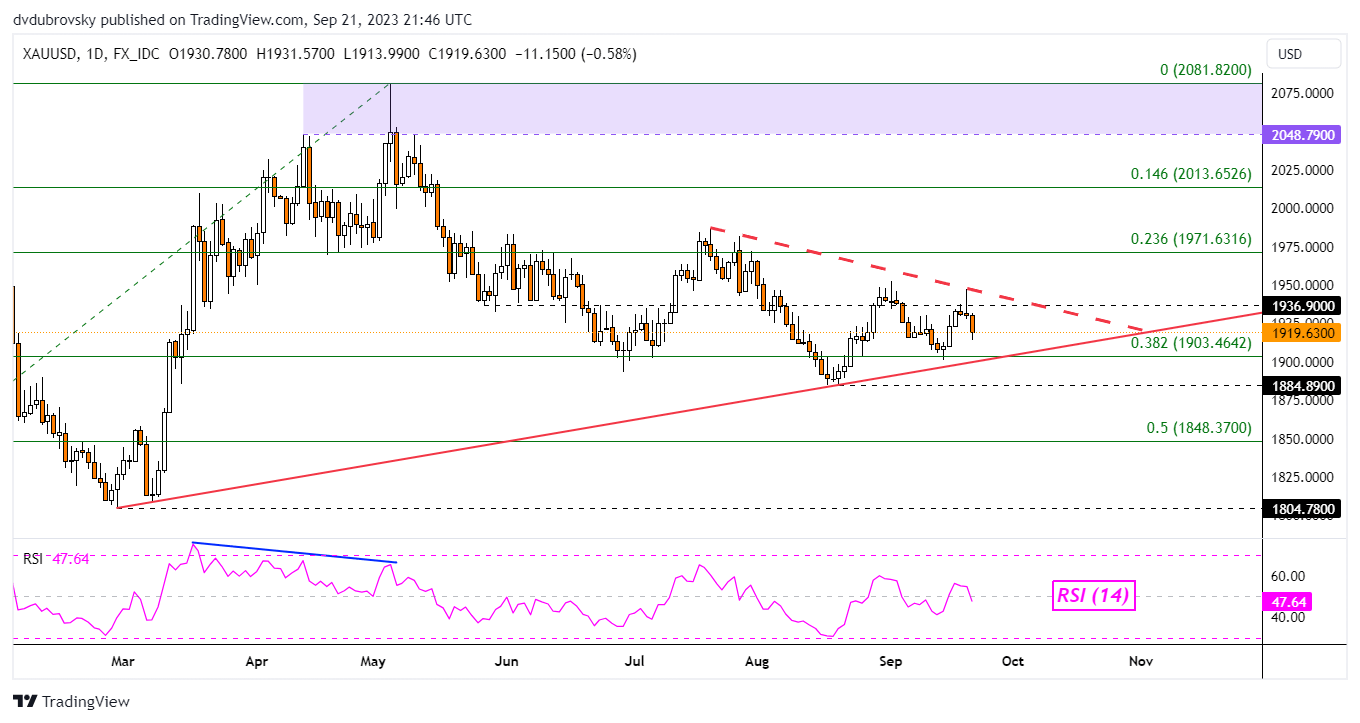
Gold prices fell about -0.6 percent over the past 24 hours as financial markets continued digesting the aftermath and implications of the Federal Reserve interest rate decision. In response, retail traders have increased bullish exposure in the precious metal. This can be seen by looking at IG Client Sentiment (IGCS), which often functions as a contrarian indicator.

Gold Sentiment Outlook – Bearish

The IGCS gauge shows that about 74% of retail traders are net-long gold. Since most are biased to the upside, this things that prices may continue falling down the road. Meanwhile, upside bets have increased by 8.02% and 5.9% compared to yesterday and last week, respectively. With that in mind, the combination of overall positioning and recent changes produces a stronger bearish contrarian trading bias.


XAU/USD Daily Chart

On the daily chart, recent losses have continued pushing gold lower towards rising support from February. At the same time, near-term falling resistance from July is offering a downside trajectory. As the two trendlines converge, this brings prospects of a breakout increasingly sooner. Key support is the rising trendline, as well as the 38.2% Fibonacci retracement level of 1903.46.

Breaking lower would open the door to an increasingly bearish bias, placing the focus on the August low of 1884.89. Otherwise, a turn higher and breakout through the falling trendline exposes the 23.6% Fibonacci retracement level of 1971.63. That would offer a shift to an increasingly bullish technical outlook.

XAU/USD Daily Chart

Chart Created in Trading View

Asia Day Ahead: Risk-off Sentiment in place, BoJ Meeting on the Radar

Asia Day Ahead: Risk-off Sentiment in place, BoJ Meeting on the Radar

Market sentiments continue to reel in from the post-Fed meeting jitters (DJIA -1.08%; S&P 500 -1.64%; Nasdaq -1.82%), as the US 10-year Treasury yields rose to another fresh 17-year high near the 4.50% handle amid a high-for-longer rate outlook. Some resilience in the US labour market, reflected from lower-than-expected read out of US jobless claims overnight, just provided more room for the Fed to retain its hawkish stance further.

For now, while Fed funds rate futures continue to reflect some doubts that the Fed may not follow through with its final rate hike this year, the timeline for rate cuts are now pushed back to a later timeline of 2H 2024. The US dollar saw some slight profit-taking (-0.1%) overnight, while gold prices remain weighed (-1.3%). On the other hand, crude oil prices have managed to eke out slight gains after a short blip from oversold technical conditions.

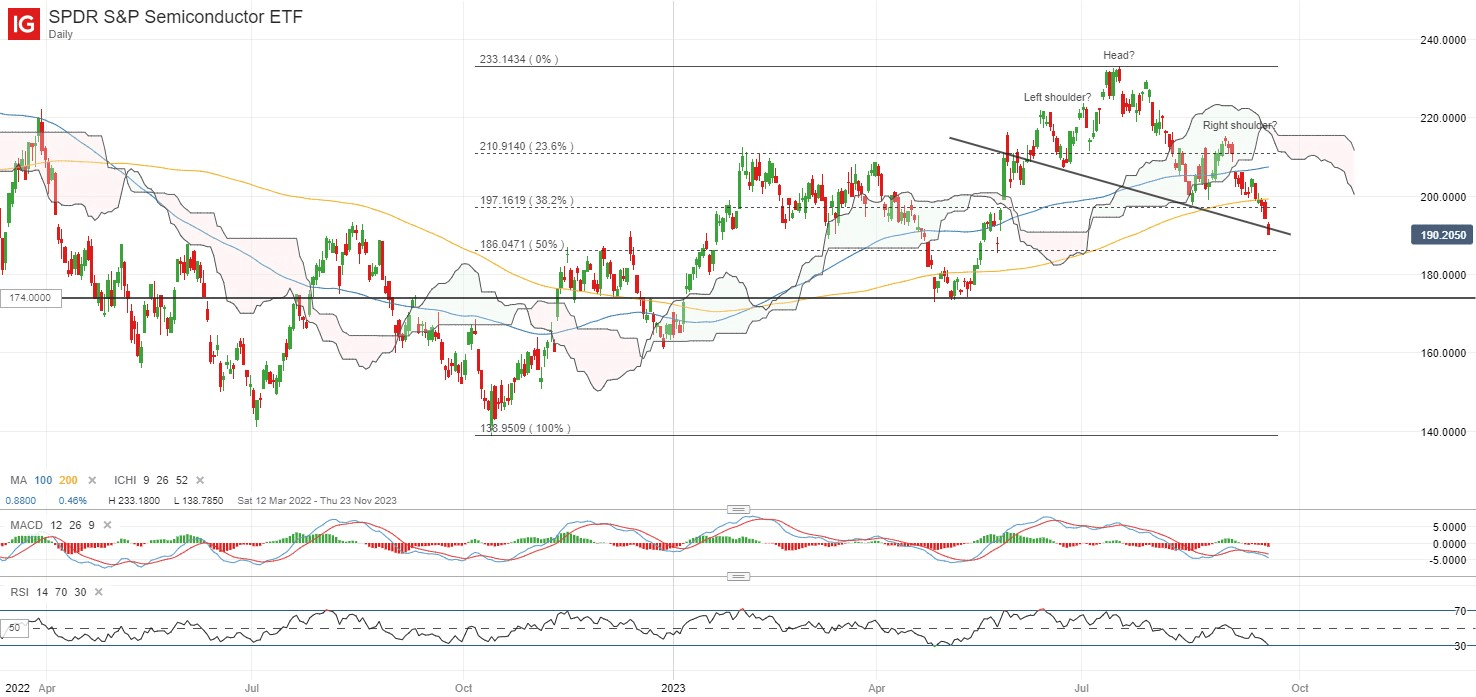
Major US indices are finding themselves at a critical juncture, with the S&P 500 back to retest a key support at the 4,330 level. Similarly, the Nasdaq 100 faces a key test for dip-buyers at the 14,680 level. Rate-sensitive growth sectors have been bearing a greater brunt of the sell-off lately, with the SPDR S&P Semiconductor ETF seemingly breaking below its neckline of a head-and-shoulder formation on the daily chart. There is still the potential for a bullish divergence to be formed on the daily relative strength index (RSI), provided that the index turned higher over coming days, but the neckline resistance will have to be reclaimed. Failure to do so may leave the May 2023 low on watch for a retest at the 174.00 level.

image1.png

Asian stocks look set for a downbeat open, with Nikkei -1.16%, ASX -1.13% and KOSPI -0.90% at the time of writing, largely following through with the negative handover from Wall Street. The key focus today will be on the Bank of Japan (BoJ) meeting. With the BoJ Governor Kazuo Ueda floating the idea that the central bank could have enough data by year-end to determine whether to end negative rates, markets seem to perceive it as an imminent rate hike into early-2024. Therefore, all eyes will be on the Governor’s communications at the press conference for any slightest signs of hawkishness to validate such timeline.

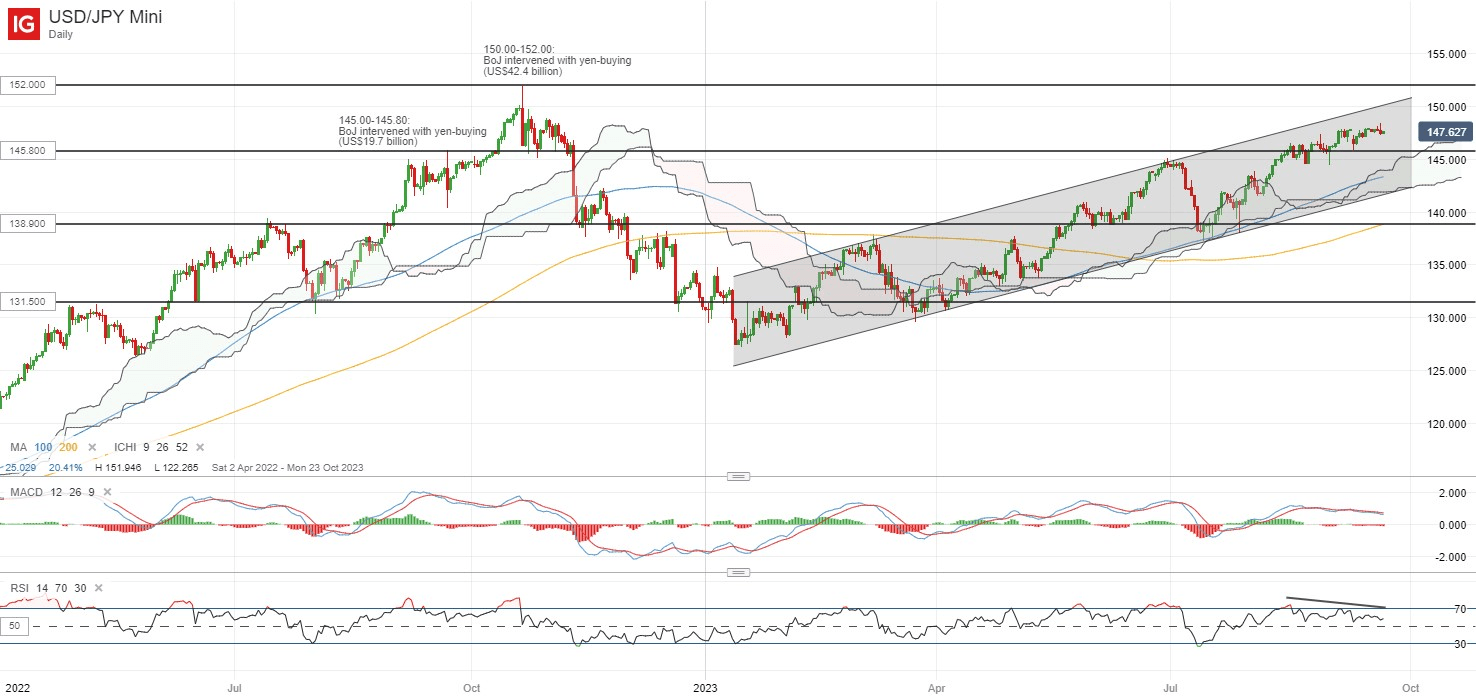
The USD/JPY has touched a new year-to-date high this week, with the pair still trading above the 145.00-145.80 range, where the BoJ had intervened with US$19.7 billion of yen-buying back in September 2022. With that, focus at the upcoming BoJ meeting will also be on how policymakers may address the weak yen and their willingness to tolerate a pull-ahead in the Japanese 10-year bond yields to levels last seen in 2013.

A bearish divergence on the daily RSI points to some near-term exhaustion for now, but staying above its Ichimoku cloud pattern and various moving averages (MA) on the daily chart still leaves an upward trend intact for the pair. Rising yield differentials between the US and Japan government bond yields have touched a new 10-month high, which may still provide some upward bias for the pair.

image2.png

Silver prices have been resilient lately, with a post-Fed sell-off on Thursday met with some dip-buying overnight, as seen by the formation of a bullish pin bar on the daily chart. Thus far, prices have been edging higher upon a retest of an upward trendline support in place since August 2022, with higher lows on Moving Average Convergence/Divergence (MACD) pointing to some upward momentum.

Further upside may leave the US$24.50 level on watch for a retest, where the upper edge of its months-long consolidation pattern resides. Whereas on the downside, the upward trendline support will be an immediate support to defend by the bulls.


Japanese Yen Tumbles as BOJ Maintains Status Quo: USD/JPY Eyes 150

Japanese Yen Tumbles as BOJ Maintains Status Quo: USD/JPY Eyes 150

The Japanese yen tumbled against the US dollar after the Bank of Japan (BOJ) kept its ultra-loose policy settings and maintained the target around 0% and the cap of 1.0% for the 10-year bond yield.

The Japanese central bank was widely expected to keep its policy settings unchanged at the two-day meeting as policymakers wait for more evidence of sustained price pressures. Markets are now focusing on Governor Kazuo Ueda’s briefing for any cues on the timing of the policy shift. In a recent interview, Ueda said the central bank would have enough information and data by the year-end on prices to assess whether to end negative rates, raising speculation of an early exit from current policy settings.

USD/JPY 5-Minute Chart

image1.png

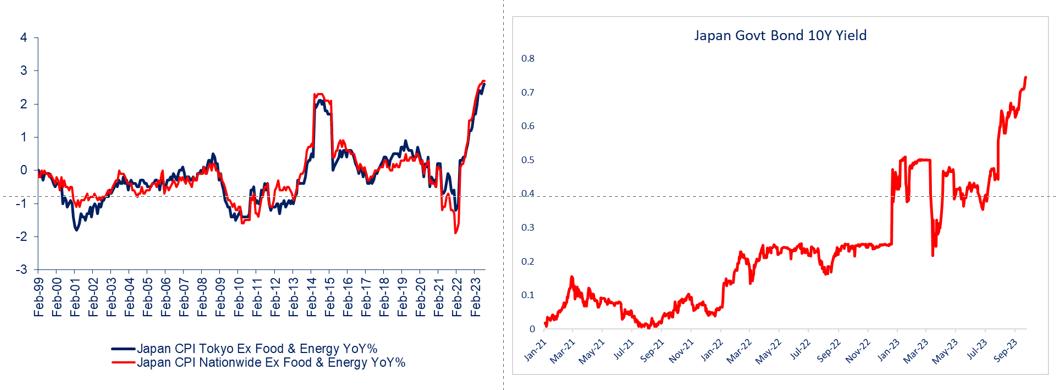
With inflation continuing to stay well above the central bank’s target, it could be a matter of time before BOJ removes its foot off the ultra-loose monetary pedal. Data released earlier Friday showed Japan’s core inflation rose to 3.1% on-year in August, higher than the 3.0% expected, staying above BOJ’s 2% target. Many in the market believe the BOJ will end its negative interest rates policy next year.

Japan Core Inflation and JGB 10-Year Yield

image2.png

The central bank’s move in July allowing greater flexibility for long-term rates to move was seen as a step closer toward an exit from the current policy settings. See “Japanese Yen Drops as BOJ Keeps Policy Unchanged: What’s Next for USD/JPY?” published July 28. Since then, the Japan 10-year government bond yield has risen to a fresh-decade high, catching up with rising yields globally as central banks maintain hawkishness amid stubbornly high price pressures.

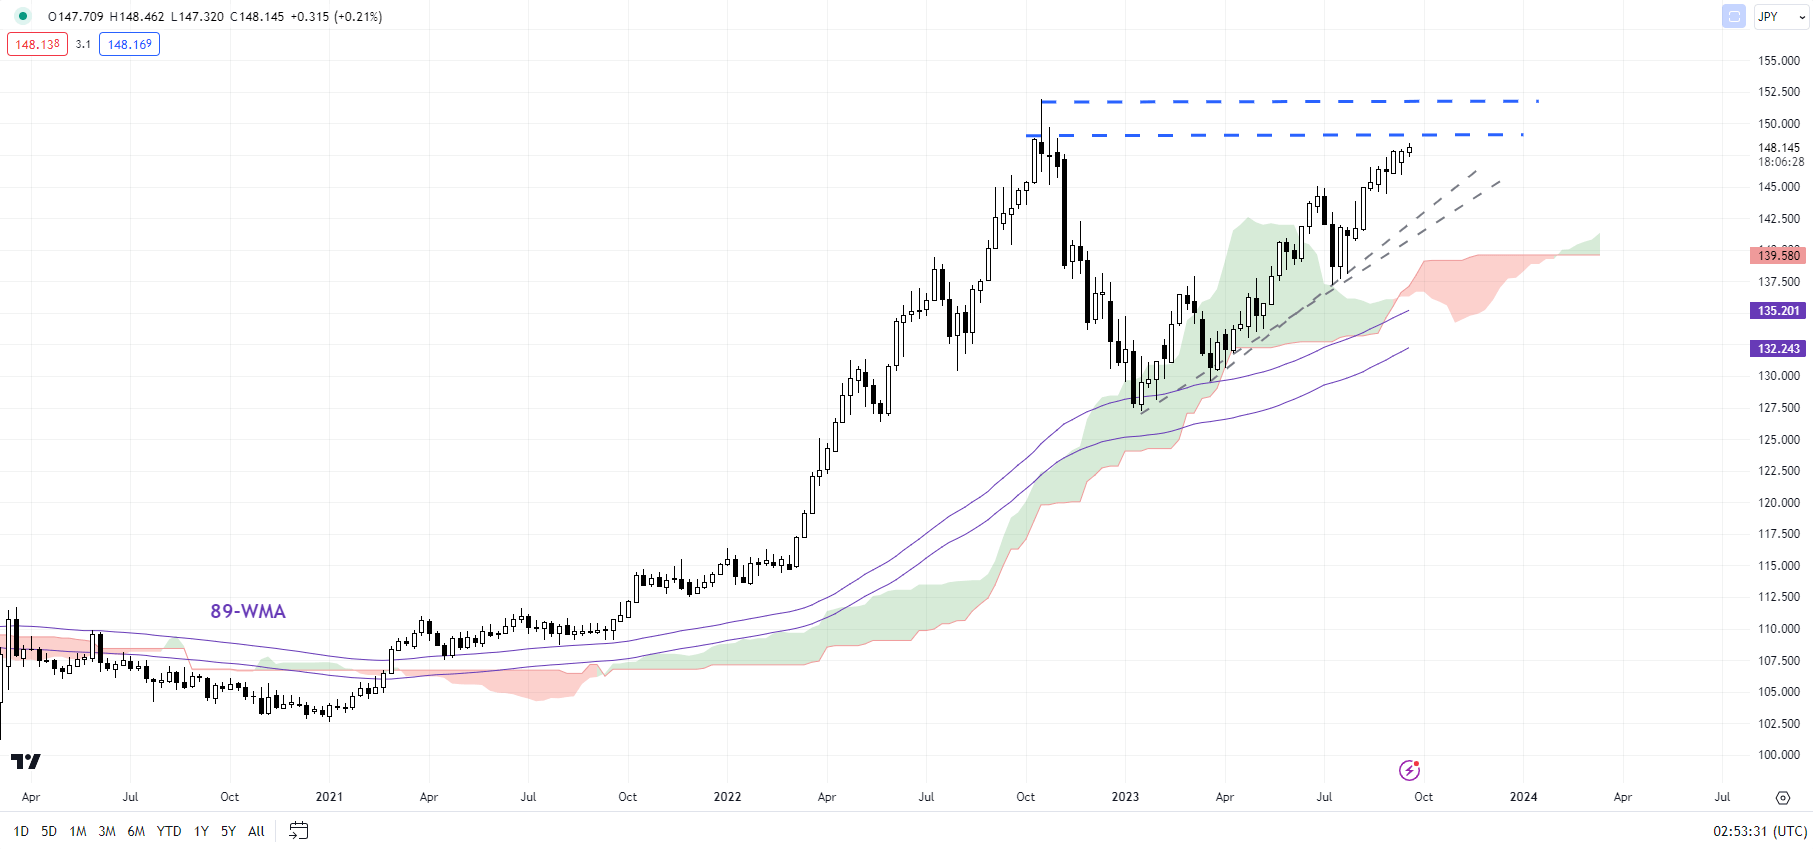
USD/JPY Weekly Chart

image3.png

The divergence in monetary policy between Japan and its peers has pushed USD/JPY toward the three-decade high of 152.00 hit in 2022, within the territory that invited intervention in the currency market last year, prompting verbal intervention by Japanese authorities recently. While any intervention could put brakes on JPY’s weakness, for a more sustainable strength in JPY an exit from ultra-loose policy settings by Japan and/or a step back from hawkishness by its peers would be required.

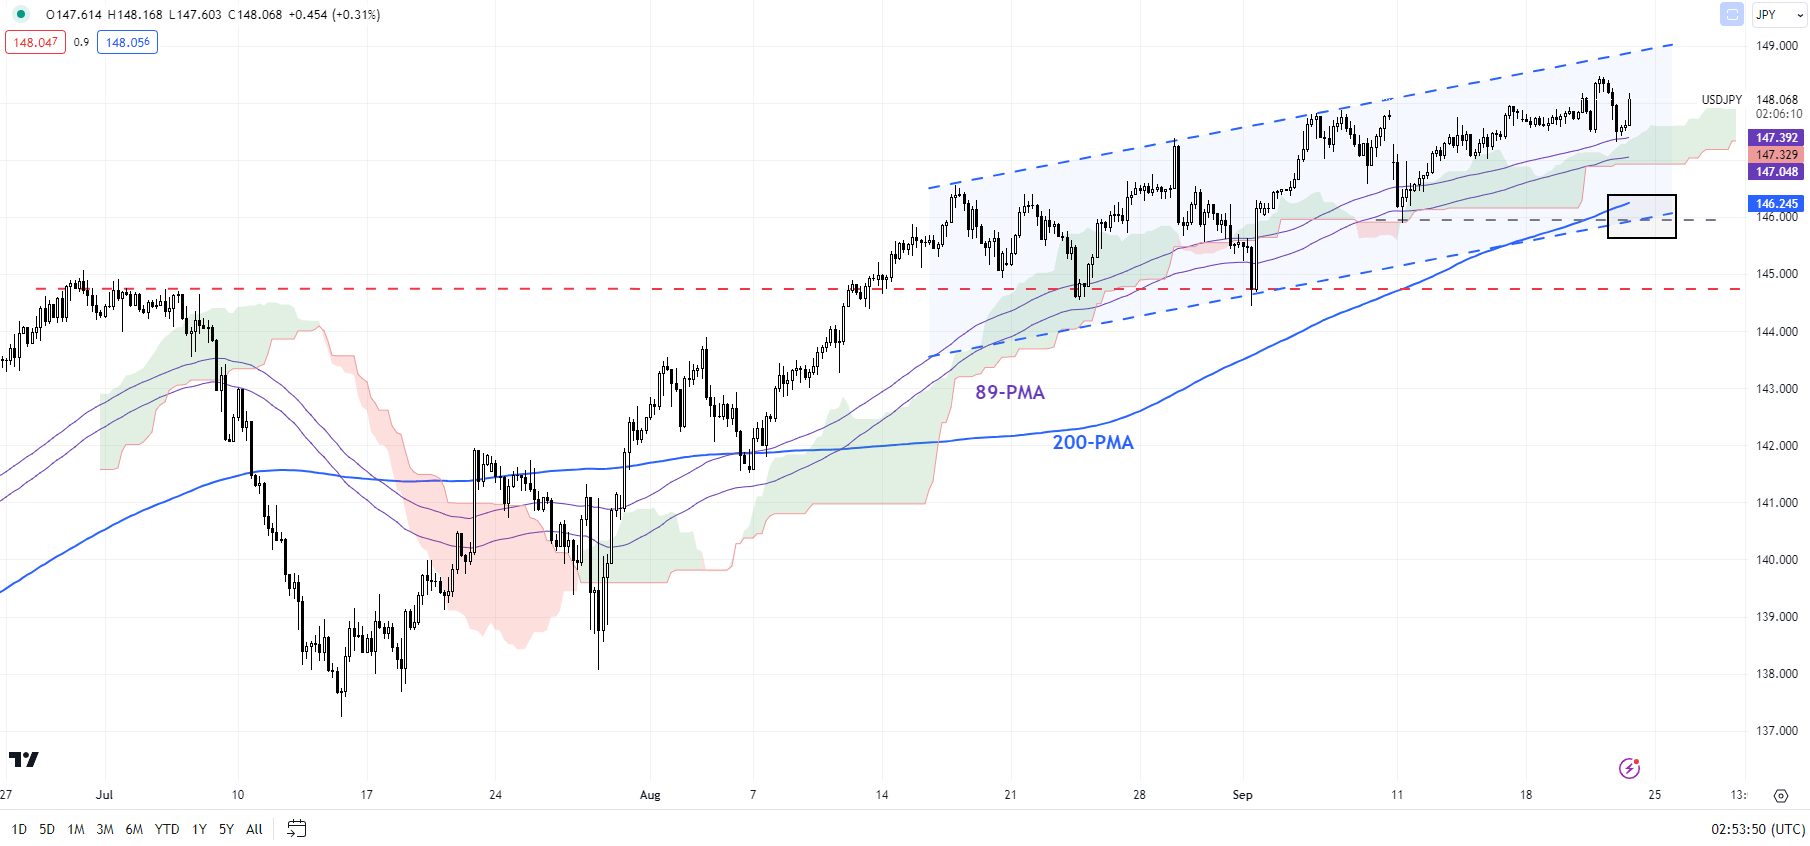
USD/JPY 240-Minute Chart

image4.png


On technical charts, while the uptrend has slowed in recent weeks, it is by no means over. Even on intraday charts, USD/JPY continues to hold above vital support levels. For instance, on the 240-minute charts, USD/JPY has been trending above the 200-period moving average since July. A break below the moving average, which coincides with the mid-September low of 146.00 would be a warning sign that the two-month-long uptrend was changing. A fall below the early-September low of 144.50 would put the bullish bias at risk.

On the upside, USD/JPY is approaching a stiff ceiling at the 2022 high of 152.00. Above 152.00, the next level to watch would be the 1990 high of 160.35.