Sterling Slump Continues after Disappointing UK Retail Sales

Sterling Slump Continues after Disappointing UK Retail Sales

UK Retail Sales Disappoint in August

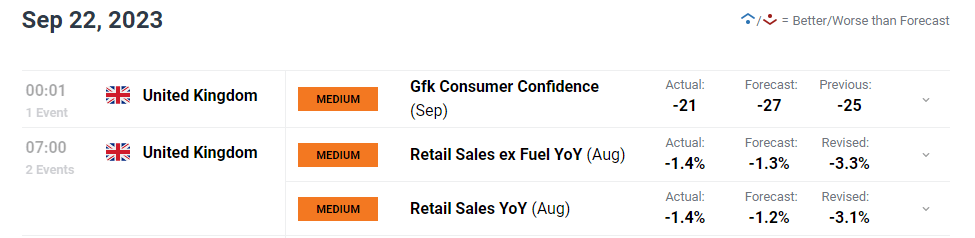
UK retail sales largely failed to improve on July’s rain affected print as rising oil prices and weaker online contributed to the less than stellar results. Going forward, the average British household will be breathing a slight sigh of relief after the Bank of England (BoE) decided to halt hiking interest rates this week owing somewhat to the recent progress on inflation. However, elevated oil prices are likely to keep a lid on consumer spending heading into the fourth quarter and the festive Christmas season.

image1.png

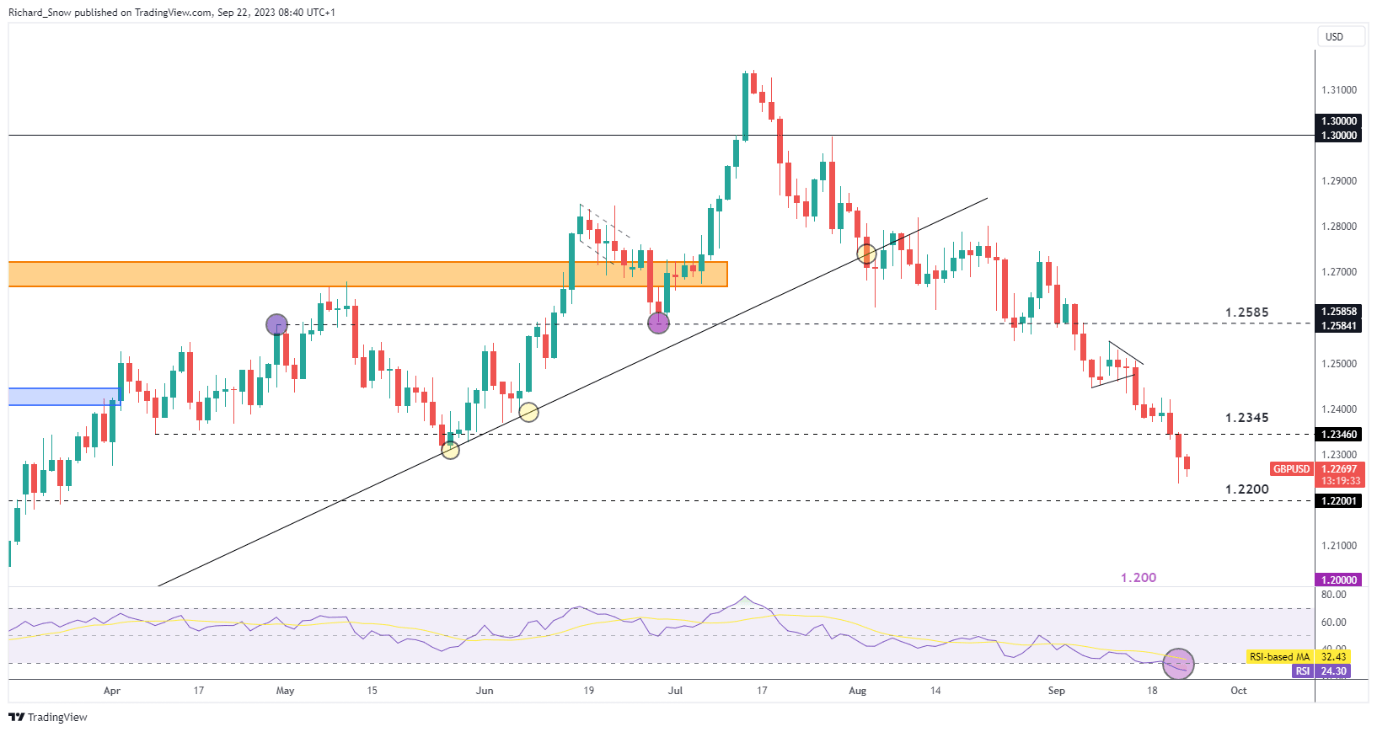
GBP/USD Bearish Momentum Likely to Continue into the Weekend

The impressive selloff which began in the middle of July, has stepped up a gear after the Bank of England (BoE) signaled a possible end to the hiking cycle after promising to keep interest rates at “sufficiently restrictive” levels for “sufficiently long” to get inflation back to the target. With markets pricing in only a slight chance of another BoE hike by the end of the year, sterling has had the rug pulled out from underneath it.

Hurtling through 1.2345 with ease, GBP/USD now looks to 1.2200 as the next level of support but the RSI has entered oversold territory – meaning it would not be unusual to see a slight reprieve as early as next week perhaps. That being said, the pair’s long-term trend remains well intact with few other signs of a slowdown. Resistance remains at 1.2345.

GBP/USD Daily Chart

image2.png

How to use the PPI in Forex Trading

How to use the PPI in Forex Trading

Using PPI to trade forex: Talking points

  • PPI stands for the Producer Price Index, which is an important piece of economic data
  • PPI data is released during the second week of each month.
  • Forex traders can use PPI as a leading indicator to forecast consumer inflation measured by the Consumer Price Index (CPI).

PPI is an important piece of economic data due to its signaling effect on future expected inflation. Traders monitor PPI in forex trading because of the positive relationship between inflation and interest rates, but ultimately, traders are concerned with how the resultant interest rate changes are likely to affect currency pairs. Continue reading to learn more about the PPI index and how it affects the foreign exchange market.

What is PPI and what does it measure?

PPI stands for Producer Price Index and measures the change in the price of finished goods and services sold by producers. PPI data represents the monthly change in the average price of a basket of goods purchased by manufacturers.

How is PPI calculated?

PPI examines three production areas; commodity-based, industrial-based, and stage-of-processing-based companies. Released by the Bureau of Labor Statistics, PPI is created using data collected from a mailed survey of retailers selected via a process of systematic sampling of all firms listed with the Unemployment Insurance System.

Traders can see changes in PPI expressed as a percentage change from the previous year, or on a month to month basis.

PPI and inflation

A positive change in the PPI index implies that costs are rising and, in the end, price increases get passed down to consumers. If this effect is large enough, there will be an increase in future CPI figures to reflect that the general level of prices has increased.

PPI is a leading indicator of inflation

Inflation and the effect on the economy

An increase in the general price level is good for an economy but only when this is contained. When demand for goods and services increases, businesses must increase capital expenditure and hire more workers in order to increase their output to meet higher demand. The problem arises when prices increase drastically, resulting in a decrease in the purchasing power of a country’s currency. $1 can buy less than it could one year ago, for example.

In the 1950s, gasoline was $0.27, while apartment rent was $42/month and a movie ticket was $0.48. These figures are nowhere near to where they are today, and this reflects how inflation erodes the value of local currency. In an attempt to combat the erosion of purchasing power, central banks effectively reduce inflation by raising the benchmark interest rate.

How does PPI impact currencies?

When it comes to money there is always a trade-off: individuals can save money and earn interest, or they can spend money immediately and forgo any interest payments.

If PPI is on the rise it may cause the interest rates to rise. When interest rates go up, electing to save money looks more attractive as the reward (interest) is greater than before. Spending money becomes costlier because consumers would effectively be losing out on the higher interest rate when they choose to spend money instead of saving. As a result, increased PPI may filter down into increased rates and a stronger currency.

Using the Euro as an example, forex traders know that higher interest rates results in increased financial flows by foreign investors wanting to buy the higher yielding Euro. This effect tends to drive the value of the Euro up as the demand for the Euro has increased.

A popular strategy chasing higher interest rates is the “carry trade” strategy; whereby traders borrow funds in a currency that has a low interest rate and buy a currency with a higher interest rate.

Money follows yield and traders will look to take advantage of this.

Learn more about how interest rates affect forex.

How PPI affects the US dollar

The Producer Price Index tends to have little effect on the US dollar initially. This is because in the real economy there is a time lag between the increase in prices from producers, and the end result of higher inflation resulting from consumers having to fork out more at the tills.

DailyFX economic calendar showing Producer Price Index (PPI)

However, don’t be misled by the “low priority” impact assessment of this data release. Astute traders are able to forecast the knock-on effects PPI is likely to have on CPI and interest rates and trade accordingly. Thus, the most valuable component of the PPI data is the signaling effect it provides to the market.

Oil Prices Forecast: Hawkish Fed Shadows OPEC Production Amid Inventory Draw

Oil Prices Forecast: Hawkish Fed Shadows OPEC Production Amid Inventory Draw

Fed’s Hawkish Stance Weighs on Oil Prices

Oil prices experienced a dip in the Asian market on Thursday, following a significant decline in the prior session. The anticipated U.S. interest rate hikes are overshadowing the reduced U.S. crude stockpiles’ effects. The Federal Reserve’s decision to hold the interest rates steady, though anticipated, was perceived as a hawkish pause. This outlook, signaling a potential rate rise by the end of the year, has increased concerns over a potential slowdown in economic growth and, consequently, fuel demand.

Trading Derivatives carries a high level of risk to your capital and you should only trade with money you can afford to lose. Trading Derivatives may not be suitable for all investors, so please ensure that you fully understand the risks involved, and seek independent advice if necessary. A Product Disclosure Statement (PDS) can be obtained either from this website or on request from our offices and should be considered before entering into a transaction with us. Raw Spread accounts offer spreads from 0.0 pips with a commission charge of USD $3.50 per 100k traded. Standard account offer spreads from 1 pips with no additional commission charges. Spreads on CFD indices start at 0.4 points. The information on this site is not directed at residents in any country or jurisdiction where such distribution or use would be contrary to local law or regulation.

Dollar’s Strength and Inventory Drawdowns

With the Fed’s stance, the U.S. dollar soared to its highest value since March, further pressuring oil prices. A robust dollar often results in higher commodity prices for those dealing in other currencies. Meanwhile, data from the U.S. Energy Information Administration (EIA) indicated that the decline in crude inventories last week was less significant than expected. The actual decrease was a mere 2.14 million barrels, a stark contrast to the American Petroleum Institute’s projected 5.25 million barrel reduction. This discrepancy further prompted traders to capitalize on their gains.

Supply Concerns and Future Predictions

Despite these challenges, the decline in oil prices was moderated by ongoing concerns over tight global supply as we head into Q4. Stock levels at Cushing, the WTI delivery point, have reached their lowest since July 2022. The sustained production cuts by OPEC+ also underpin these concerns.

Some experts anticipate that prices will remain stable in the near term, with potential operational minimums in tanks.

If OPEC+ continues its production cuts, inventory levels might hit unprecedented lows. Current projections indicate a supply deficit exceeding 2 million barrels per day for Q4, suggesting potential further strengthening in oil prices in the imminent future.

Short-Term Outlook: Bullish Yet Cautious

Given the ongoing global supply concerns and the predicted supply deficit for the coming quarter, the short-term outlook for oil prices appears bullish.

However, the interplay of the Fed’s monetary policy decisions and the global economic landscape necessitates vigilance among traders and investors since these actions could drive the greenback higher, pressuring demand for dollar-denominated crude oil.

Technical Analysis

4-Hour Light Crude Oil FuturesThe current 4-hour price of Light Crude Oil Futures stands at $88.95, showing a marginal decrease from the previous 4-hour close of $88.98. While the price is positioned above the 200-4H moving average (MA) of $84.21, it remains below the 50-4H MA at $89.55. The 14-4H RSI reading of 40.45 suggests weakened momentum and as the market edges towards oversold territory.

Furthermore, the price hovers above the main support area (84.89 to 83.81) and below the main resistance range (90.10 to 93.74). Analyzing the metrics, the market sentiment for Light Crude Oil Futures appears cautiously bearish in the short term.

Dax Index: Will Hawkish Fed Stances Impact the DAX Market’s Thursday Mood?

Dax Index: Will Hawkish Fed Stances Impact the DAX Market’s Thursday Mood?

DAX Wednesday Overview

On Wednesday, the DAX gained 0.75%. Partially reversing a 0.40% fall from Tuesday, the DAX ended the day at 15,782.

People’s Bank of China Shows Signs of Confidence

On Wednesday, the People’s Bank of China (PBoC) demonstrated confidence, leaving loan prime rates unchanged. Economists expected the PBoC to stand pat following more upbeat economic indicators from China last Friday.

Trading Derivatives carries a high level of risk to your capital and you should only trade with money you can afford to lose. Trading Derivatives may not be suitable for all investors, so please ensure that you fully understand the risks involved, and seek independent advice if necessary. A Product Disclosure Statement (PDS) can be obtained either from this website or on request from our offices and should be considered before entering into a transaction with us. Raw Spread accounts offer spreads from 0.0 pips with a commission charge of USD $3.50 per 100k traded. Standard account offer spreads from 1 pips with no additional commission charges. Spreads on CFD indices start at 0.4 points. The information on this site is not directed at residents in any country or jurisdiction where such distribution or use would be contrary to local law or regulation.

German Producer Prices Offer Pre-Fed Comfort

The European equity markets turned from panic mode to calm and reflection. German producer prices drove early buyer appetite on Wednesday. German producer prices increased by 0.3% in August versus a 1.1% slide in July. Economists forecast a 0.2% rise.

An upward trend in producer prices reflects an improving demand environment, allowing producers to increase contract prices.

A pullback in Government bond yields offered relief to riskier assets ahead of the Fed interest rate decision.

The Wednesday Market Movers

The risk-on sentiment provided support to several sectors. Auto stocks were among the front-runners.

Porsche rallied 2.78%, with BMW and Mercedes Benz Group seeing gains of 2.64% and 2.05%, respectively. Volkswagen rose by 1.90%, while Continental ended the day up by 0.09%.

A bounce back in German car registrations likely contributed to the session gains. German car registrations surged by 12.4% in August, reversing a 13.2% slump from July.

Bank stocks were also on the move. Commerzbank and Deutsche Bank saw gains of 1.59% and 0.97%, respectively. Commerzbank CFO projected net interest of €8 billion this year on higher interest rates, signaling a positive earnings outlook.

US Federal Reserve to Send the DAX South

Investors will respond to the overnight Fed interest rate decision, economic projections, and press conference. Fed Chair Powell addressed the markets, indicating that the future rate path hinges on the economic indicators. However, the FOMC economic projections were hawkish, with 10 out of 19 FOMC members seeing rates holding above 5% throughout 2024.

US equities tumbled in response to a hawkish Fed-fueled jump in Treasury yields. The Dow fell by 0.22%, with the S&P 500 and NASDAQ Composite Index ending the day down 0.94% and 1.53%, respectively.

The futures markets point to a bearish Thursday session, with the DAX down 154 points.

Later today, US jobless claims need consideration. Tight labor market conditions would support the more hawkish Fed interest rate path. However, Philly Fed Manufacturing Index numbers will also move the dial. Investors will look for reasons for the Fed to deviate from the new interest rate path.

Beyond the numbers, investors should consider ECB Executive Board member speeches. Executive Board member Isabel Schnabel and ECB President Christine Lagarde are on the calendar to speak today. Hawkish central bank chatter could spook the markets as investors digest the latest from the Fed.

Short-Term Forecast

Downside risks linger for the DAX, with the Fed in a more hawkish mood and the ECB concerned with inflation. However, improving macroeconomic conditions across the euro area would cushion the downside.

DAX Technical Indicators

Daily Chart

The DAX remained below the 50-day EMA while holding above the 200-day EMA, sending bearish near-term but bullish longer-term price signals.

A break above the trend line would support a DAX move to the 50-day EMA. Dovish ECB member commentary and a spike in US jobless claims would give the bulls a run at 16,000.

However, failure to break above the trend line would leave the 15,663 support level in play. Better-than-expected US economic indicators and a hawkish ECB President would support a break below the 15,663 support level.

The 14-Daily RSI reading of 49.38 indicates a DAX break below the 15,663 support level to sub-15,500 before entering oversold territory.

DAX Daily Chart sends bearish near-term price signals.
DAX 210923 Daily Chart

4-Hourly Chart

The DAX sits above the 50-day EMA while below the 200-day EMA, sending bullish near-term but bearish longer-term price signals. A DAX break above the trend line would support a DAX move to the 200-day EMA.

However, a break below the 50-day EMA would give the bears a run at the 15,663 support level.

A break below the 15,663 support level would support a DAX return to 15,500 and target 15,459 support level.

The 51.86 RSI reading supports a DAX break above the trend line before entering overbought territory.

4-Hourly Chart sends mixed price signals.
DAX 210923 4-Hourly Chart
EUR/USD Forecast: A Delicate Balance Between ECB Sentiments and US Job Claims

EUR/USD Forecast: A Delicate Balance Between ECB Sentiments and US Job Claims

Wednesday Overview

On Wednesday, the EUR/USD fell by 0.18%. Following a 0.12% loss on Tuesday, the EUR/USD ended the day at $1.06605. The EUR/USD rose to a high of $1.07368 before falling to a low of $1.06500.

French Business Confidence and ECB President Lagarde in Focus

The French economy will be in focus this morning. French business confidence will draw investor interest. The markets must assess the impact of ECB monetary policy moves on business sentiment.

Trading Derivatives carries a high level of risk to your capital and you should only trade with money you can afford to lose. Trading Derivatives may not be suitable for all investors, so please ensure that you fully understand the risks involved, and seek independent advice if necessary. A Product Disclosure Statement (PDS) can be obtained either from this website or on request from our offices and should be considered before entering into a transaction with us. Raw Spread accounts offer spreads from 0.0 pips with a commission charge of USD $3.50 per 100k traded. Standard account offer spreads from 1 pips with no additional commission charges. Spreads on CFD indices start at 0.4 points. The information on this site is not directed at residents in any country or jurisdiction where such distribution or use would be contrary to local law or regulation.

Economists forecast the Business Confidence Index to climb from 96 to 97. A more marked increase in confidence would ease concerns over business investment and hiring. Plans to increase hiring would support the French economy.

French private consumption accounts for over 50% of GDP. Improving labor market conditions would fuel wage growth and consumer spending. However, a more upbeat labor market outlook would also support demand-driven inflation.

Late in the session, ECB President Lagarde and ECB Executive Board member Isabel Schnabel are on the calendar to speak. Lagarde will have more influence on the EUR/USD. A deviation from the Thursday press conference script would direct the EUR/USD.

US Labor Market Takes Center Stage

US initial jobless claims and the Philly Fed Manufacturing Index will be in focus on Thursday. A spike in US jobless claims would raise question marks about the FOMC projections for unemployment.

Weaker labor market conditions would weigh on spending and impact the US economy. US private consumption accounts for over 65% of GDP.

While initial jobless claims are vital, the Philly Fed Manufacturing Index also needs consideration. The markets will respond to economic indicators that could adjust the Fed interest rate path.

Economists forecast initial jobless claims to rise from 220k to 225k and the Philly Fed to slide from 12.0 to -0.07.

Short-Term Forecast:

Monetary policy and economic divergence continue to tilt in favor of the dollar. Steady labor market conditions and a grim euro area economic outlook support further EUR/USD downside. However, the dollar remains at risk of a stumble on a spike in jobless claims.

EUR/USD Price Action

Daily Chart

The EUR/USD remained below the 50-day and 200-day EMAs, affirming bearish price signals. A EUR/USD break below the $1.06342 support level would support a EUR/USD move toward sub-$1.06.

Better-than-expected US economic indicators would support the Fed rate path projection and the EUR/USD trajectory.

However, a EUR/USD return to $1.07 would give the bears a look at the $1.07635 resistance level. The EUR/USD needs hawkish ECB speeches and a spike in jobless claims to support a return to $1.07.

The 14-period Daily RSI at 34.06 supports a EUR/USD break below the $1.06342 support level before entering oversold territory.

EUR/USD Daily Chart sends bearish price signals.
EURUSD 210923 Daily Chart

4-Hour Chart

The EUR/USD sits below the 50-day and 200-day EMAs, reaffirming the bearish price signals. A EUR/USD break above the 50-day EMA would support a EUR/USD move toward the $1.07635 resistance level.

However, a break below the $1.06342 support level would give the bears a run at sub-$1.06.

The 14-period 4-Hourly RSI at 39.47 indicates a EUR/USD break below the $1.06342 support level and a return to sub-$1.06 before entering oversold territory.

4-Hourly Chart affirms bearish price signals.
EURUSD 210923 4 Hourly Chart
Silver Prices Forecast: XAG/USD’s Upside Limited by Fed Tightening, US Dollar Strength

Silver Prices Forecast: XAG/USD’s Upside Limited by Fed Tightening, US Dollar Strength

Dynamics of Silver in a Strong Dollar Environment

Silver’s (XAG/USD) performance on Thursday appeared somewhat reserved as the U.S. dollar and bond yields pressed onward. This restraint comes on the heels of the Federal Reserve’s recent indication of an upcoming rate hike this year and a shift in their easing strategy, expected to last until 2024.

Trading Derivatives carries a high level of risk to your capital and you should only trade with money you can afford to lose. Trading Derivatives may not be suitable for all investors, so please ensure that you fully understand the risks involved, and seek independent advice if necessary. A Product Disclosure Statement (PDS) can be obtained either from this website or on request from our offices and should be considered before entering into a transaction with us. Raw Spread accounts offer spreads from 0.0 pips with a commission charge of USD $3.50 per 100k traded. Standard account offer spreads from 1 pips with no additional commission charges. Spreads on CFD indices start at 0.4 points. The information on this site is not directed at residents in any country or jurisdiction where such distribution or use would be contrary to local law or regulation.

Recent Highs Overshadowed by Monetary Policy

The precious metal’s peak just the previous day, the highest since September 6th, found itself eclipsed by the U.S. Fed’s newly recalibrated economic outlook. This outlook hints at prolonged higher rates, sending ripples of uncertainty through the market. However, the silver market still remains attractive to some speculators, providing a safety net against a sharp decline.
Decoding the Fed’s Hawkish Undertones

Wednesday was a whirlwind in the bond market. Treasury yields leaped after the Federal Reserve hinted at an additional rate increase before 2023 concludes. This decision brought two notable yields to levels unseen in over a decade. Fed Chair Jerome Powell, in a post-meeting press briefing, hinted at a cautious approach to future hikes while acknowledging the challenges posed by persistent inflation.

Despite some market speculation of a nearing end to rate hikes, the Fed’s latest stance suggests a prolonged period of elevated rates to combat inflation. Notably, the central bank’s campaign against inflation started in March 2022 and has been mostly consistent, given the continued moderate inflationary pressures evident in recent reports.

Implications on Silver’s Appeal

Historically, silver’s allure is fortified during inflationary times. Yet, as interest rates ascend, this charm diminishes, predominantly due to the competitive pull of Treasury yields. In other words, as rates rise, demand for silver tends to weaken since the asset doesn’t pay interest to hold it. The immediate future suggests a possible restrained upward momentum for silver.

Short-term Projections for Silver

The current market environment implies a limited upward movement for silver prices in the near term. Potential for a surge might arise from a combined global and U.S. sentiment favoring declining interest rates and a weakening dollar. Nonetheless, silver remains on the radar of central banks, their continuous demand serving as a foundational support for its pricing.

Technical Analysis

4-Hour Silver (XAG/USD)Based on the 4-hour data provided for Silver (XAG/USD), the current price of 23.24 sits slightly below the 200-4H moving average of 23.33 but above the 50-4H moving average of 23.06, suggesting a neutral trend and impending moving average breakout. The 14-4H RSI reading of 52.60, while above the neutral level of 50, indicates mildly strengthened momentum but doesn’t signify an overbought condition.

The commodity’s price remains comfortably nestled between the main support area of 22.70 to 22.28 and the main resistance range of 25.00 to 25.27. Given these metrics, the current market sentiment for Silver leans slightly bullish, yet it’s essential to monitor closely for any breakout or breakdown signals.

Generally speaking, look for upside momentum to develop on a sustained move over 23.33 and downside momentum to increase on a sustained move under 23.06

Gold Prices Forecast: Fed’s Hawkish Stance Dims XAU/USD’s Luster

Gold Prices Forecast: Fed’s Hawkish Stance Dims XAU/USD’s Luster

Fed’s Tightening, Dollar’s Rise Fuels XAU/USD Retreat

Gold (XAU/USD) prices faced a setback on Thursday as the U.S. dollar and bond yields surged. This surge was triggered by the Federal Reserve’s indication of an additional rate hike within the year and a decreased likelihood of policy easing till 2024. Spot gold (XAU/USD) slightly declined to $1,928.70 per ounce, while U.S. December Comex gold futures were down by nearly 1% at $1,948.40.

Wednesday’s Peak and the Aftermath

Just a day before, gold reached its peak since September 1st. However, the U.S. Fed’s revised economic outlook, emphasizing sustained higher rates, overshadowed this achievement. With this updated interest rate scenario, the market is exhibiting some nervousness. Yet, gold is attracting buyers, preventing a drastic plunge in its price.

Trading Derivatives carries a high level of risk to your capital and you should only trade with money you can afford to lose. Trading Derivatives may not be suitable for all investors, so please ensure that you fully understand the risks involved, and seek independent advice if necessary. A Product Disclosure Statement (PDS) can be obtained either from this website or on request from our offices and should be considered before entering into a transaction with us. Raw Spread accounts offer spreads from 0.0 pips with a commission charge of USD $3.50 per 100k traded. Standard account offer spreads from 1 pips with no additional commission charges. Spreads on CFD indices start at 0.4 points. The information on this site is not directed at residents in any country or jurisdiction where such distribution or use would be contrary to local law or regulation.

Implications of U.S. Fed’s Hawkish Stance

The U.S. dollar index experienced a 0.4% boost, marking its highest since March 9. Concurrently, two-year Treasury yields escalated to a 17-year pinnacle. The Fed maintained its interest rates but delineated a more rigorous approach to tackle the inflation predicted to linger until 2026. This focus on higher interest rates tends to deter investors from non-interest-generating assets like gold.

Short-term Forecast: A Capped Upside for Gold

While gold traditionally serves as an inflation hedge, its charm fades when interest rates climb. This phenomenon is due to the increased allure of competing Treasury yields. Current indications suggest that gold’s upward trajectory may remain limited.

A more pronounced positive momentum for gold prices might only materialize if there’s a market consensus about declining global and U.S. interest rates, coupled with a weaker dollar. Moreover, central banks’ consistent demand for gold, as part of their diversification strategy, offers some support to its price.

Technical Analysis

4-Hour Gold (XAU/USD)Gold (XAU/USD) trading above both the 200-4H and 50-4H moving averages, showcases a bullish short-term trend. These moving averages, specifically at 1919.35 and 1922.13 respectively, serve as immediate support levels.

If the commodity were to break below these points, it could signal a potential shift in market sentiment and trigger accelerated selling pressure. Conversely, remaining above these averages maintains a positive outlook.

Additionally, the RSI at 50.00 suggests a neutral market.

The proximity of the current price to these moving averages highlights the significance of their role as potential pivot points in the market. As always, it’s crucial for traders to monitor these levels closely, alongside other indicators and market news, to make informed decisions.

Fed’s Powell Urges Flexibility on Rate Projections: Forecasts Not Set in Stone

Fed’s Powell Urges Flexibility on Rate Projections: Forecasts Not Set in Stone

Powell’s Take on Rate Plans

Federal Reserve Chair Jerome Powell delivered a word of caution following today’s recent Federal Open Market Committee (FOMC) meeting. Addressing the
Fed’s updated rate forecasts, Powell emphasized that the presented outlook isn’t necessarily indicative of a concrete plan. The new projections simply suggest that the economy might outperform earlier expectations.

Powell, who oversaw a decision to maintain steady rates but hinted at a possible increase by year-end, stressed the need for flexibility. He stated, “We are prepared to raise rates further if appropriate.”

Fed’s Monetary Stance

Central bank’s current approach has garnered widespread attention. Ahead of its meeting, there were strong expectations for significant rate cuts in the coming year. These expectations have since been tempered by projections indicating that 10 of 19 officials foresee the policy rate lingering above 5% through the next year. Market responses were swift.

The two-year Treasury note surged to its highest since July 2006, stocks closed lower, and the dollar made a comeback against major currencies. With the recent turn of events, traders seem less optimistic about rate reductions in the future.

Economic Forecasts and External Views

There’s a notable change in the Fed’s economic growth projections. Previously forecasting growth as slow as 0.4% for the year, the central bank now anticipates a 2.1% growth for 2023. The predictions also suggest stable unemployment rates, hinting at confidence in managing inflation without major job cuts. However, there are concerns. With rising borrowing costs, companies and households could face stringent credit conditions.

Olu Sonola of Fitch Ratings interpreted the Fed’s revised figures as evidence of increased confidence in a soft economic landing, despite persistently high rates. In contrast, Omair Sharif of Inflation Insights labeled the Fed’s projections as “oddly optimistic” regarding the labor market and “pessimistically skewed” on core inflation.

Experts Weigh In

Various experts had their say post the Fed announcement. Garrett Melson of Natixis Investment Managers Solutions, Boston, saw a strong signal towards a soft landing, given the upward revisions in growth and the reduced unemployment projections.

Gina Bolvin from Bolvin Wealth Management Group, Boston, believed the Fed has returned to a neutral stance and is optimistic about the potential for a soft landing.

Contrarily, Tom Martin from Globalt Investments, Atlanta, found the announcement more hawkish than expected and foresaw elevated interest costs persisting for a longer duration.

Short-Term OutlookA Cautious Stance

Drawing from the current updates and expert opinions, it’s clear that the Federal Reserve is advocating a cautious and flexible approach, re-evaluating its stance as and when new data emerges.

While the current sentiment might lean towards a bullish outlook, traders and investors should remain vigilant, as policy decisions will remain heavily tethered to evolving economic conditions.

Gold and Silver After the Fed: XAU/USD, XAG/USD at Risk to Higher Treasury Yields

Gold and Silver After the Fed: XAU/USD, XAG/USD at Risk to Higher Treasury Yields

XAU/USD Analysis

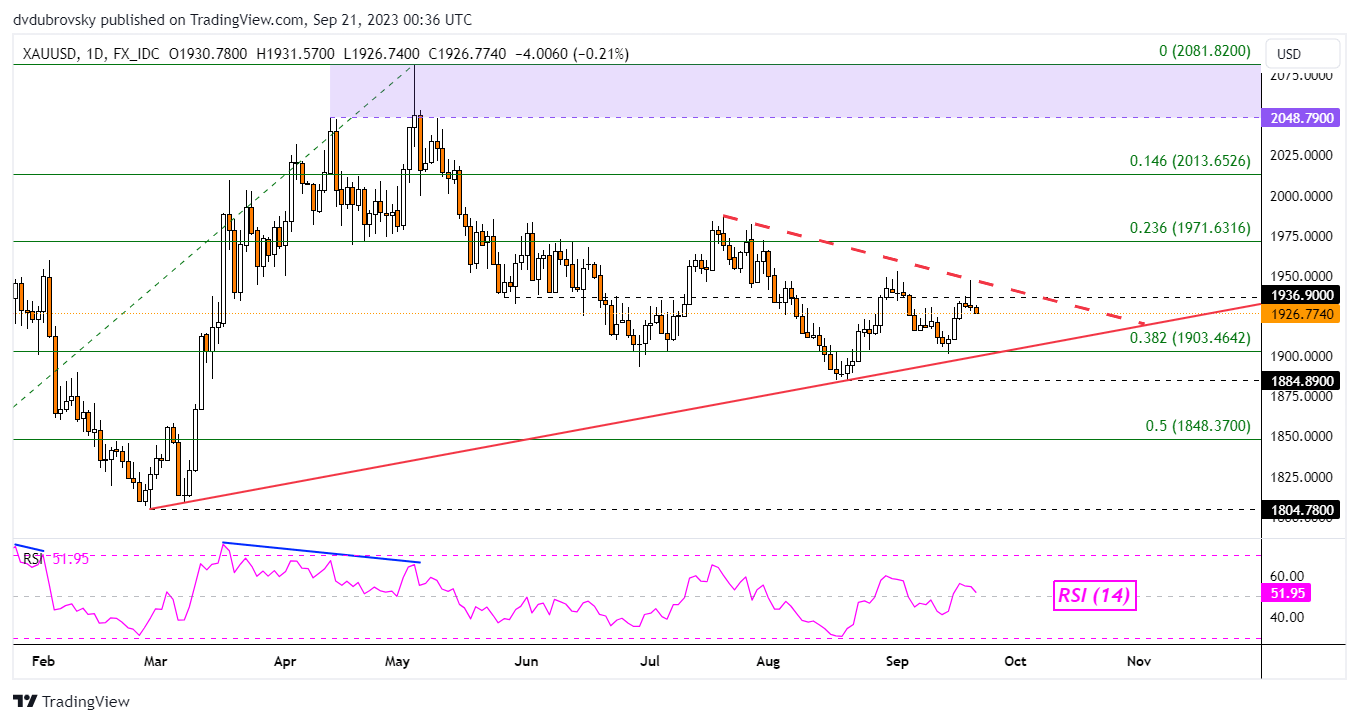
Gold and silver prices have turned lower in the aftermath of the Federal Reserve monetary policy announcement. There, Chair Jerome Powell basically alluded to a ‘higher for longer’ approach, causing financial markets to price in a higher terminal Federal Funds rate and pushing back expectations of rate cuts further down the time horizon.

In response, Treasury yields and the US Dollar rose, working together to pressure precious metals, like gold and silver, lower. On the daily chart below, XAU/USD rejected a recently formed, near-term falling trendline from July. That has opened the door to revisiting rising support from April, which is closely aligned with the 38.2% Fibonacci retracement level of 1903.46.

Clearing under the latter would open the door to a stronger bearish technical bias. Otherwise, pushing above near-term falling resistance exposes the 23.6% level of 1971.63.

image1.png

XAG/USD Analysis

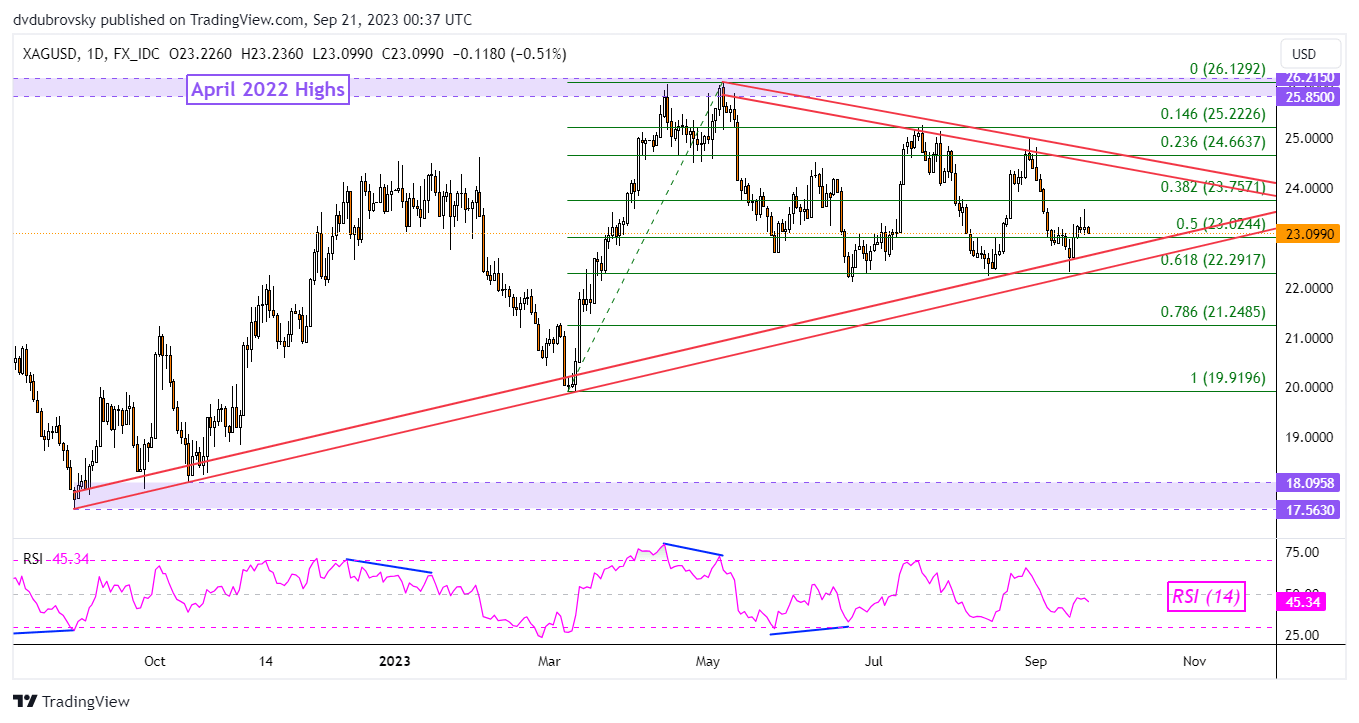
Meanwhile, silver faces a similar predicament in the wake of the Fed. Higher borrowing costs for longer and a stronger Greenback will likely pressure XAG/USD.

On the daily chart, silver can be seen turning back lower towards the rising range of support from August. Broadly speaking, XAG/USD has been consolidating between this rising support and a range of falling resistance from May.

As such, the broader technical outlook remains neutral. But, the fundamental consequences of the Fed on silver could open the door to an extended move lower. As such, keep a close eye on rising support. Breaking lower exposes the 78.6% Fibonacci retracement level of 21.24.

image2.png

AUD Price Forecast: FOMC Weighing on Aussie Dollar

AUD Price Forecast: FOMC Weighing on Aussie Dollar

AUSTRALIAN DOLLAR FUNDAMENTAL BACKDROP

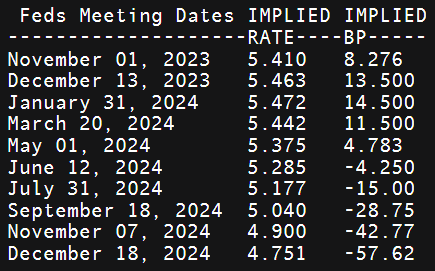
The Australian dollar took a turn lower after yesterday’s FOMC announcement and Westpac lending index data. The Fed kept their rates on hold but delivered a hawkish message that suggested sustained elevated interest rates for a longer period with fewer rate cuts in 2024 – now priced in at 56bps vs 100bps recently (see table below).

IMPLIED FED FUNDS FUTURES

image1.png

Earlier this morning, the RBA bulletin was released with the key takeaway being the close scrutiny of wage developments due to its impact on inflation.

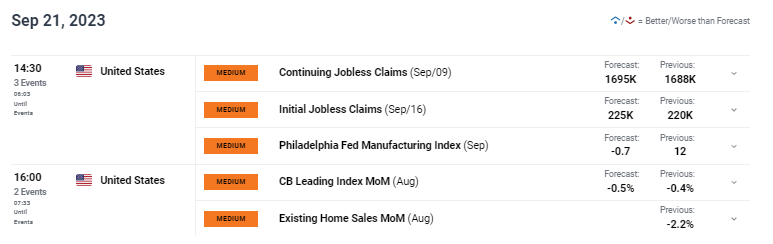
Later today, the pair will be largely driven by US factors including initial jobless claims data (see economic calendar below). Recent figures have reiterated the robust labor market in the US and this week look to exhibit little change. A strong initial jobless claims figure could supplement US dollar upside and weigh on the AUD.

AUD/USD ECONOMIC CALENDAR (GMT +02:00)

image2.png

TECHNICAL ANALYSIS

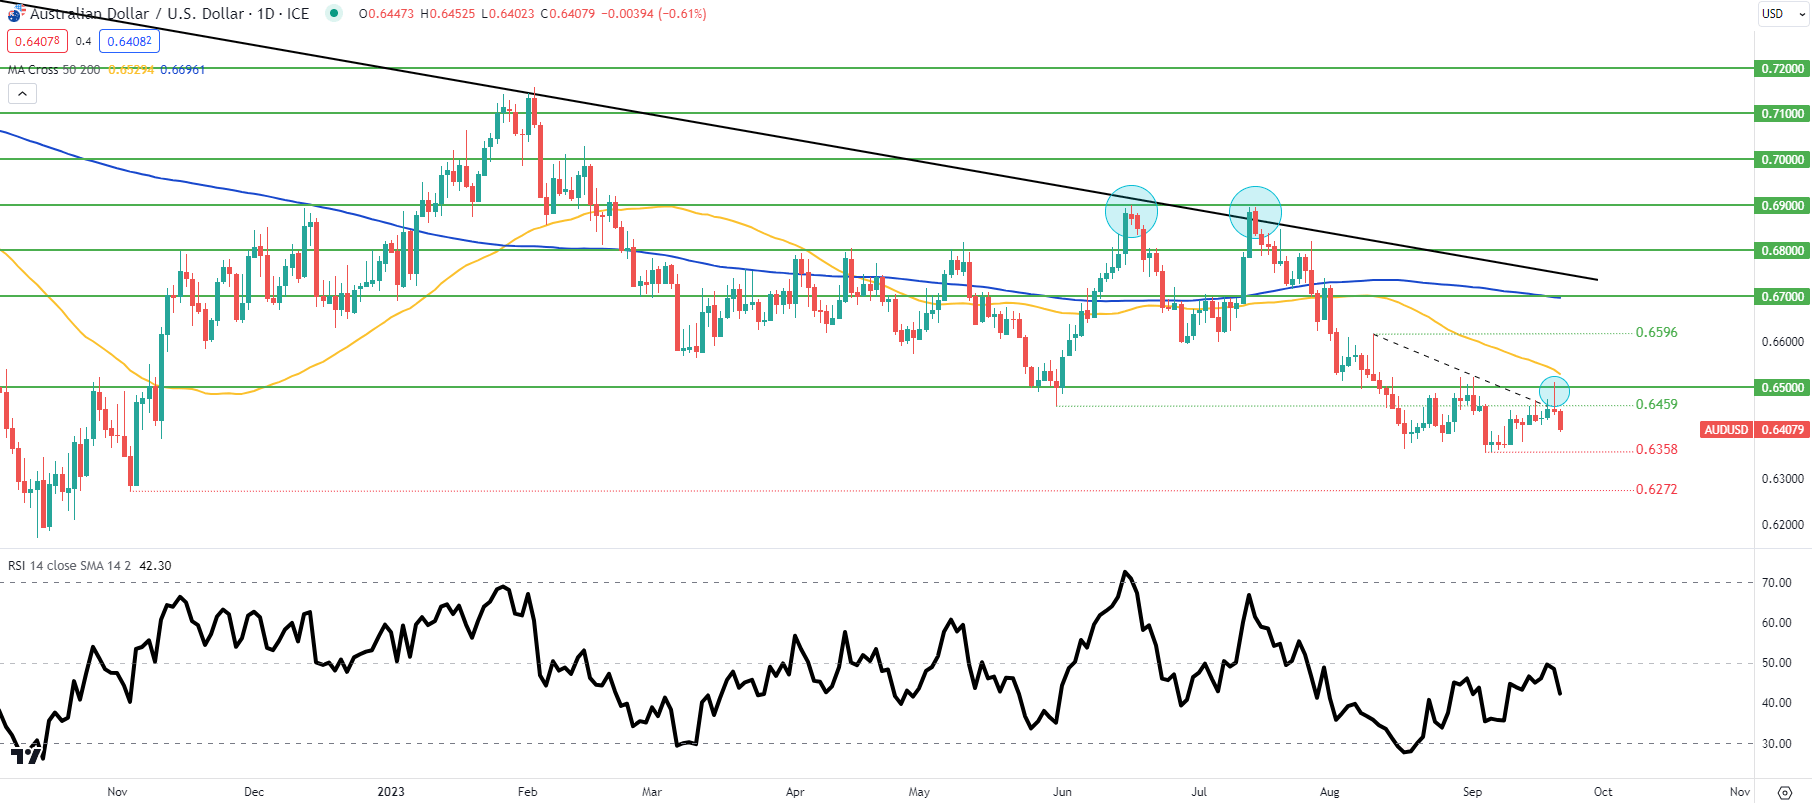
AUD/USD DAILY CHART

image3.png

Daily AUD/USD price action above shows Aussie bulls respectful of the medium-term trendline resistance (dashed black line) after levels breached the 0.6500 psychological handle yesterday. The candle subsequently closed with a long upper wick (blue), suggestive of impending downside to come. Subsequent support zones could be under threat if markets buy into the Fed’s ‘higher for longer’ stance.