Japanese Yen Remains at Risk After the Fed, Retail Traders Unwind USD/JPY Bullish Bets

Japanese Yen Remains at Risk After the Fed, Retail Traders Unwind USD/JPY Bullish Bets

The Japanese Yen weakened against the US Dollar in the aftermath of the Federal Reserve interest rate decision, where Chair Jerome Powell alluded to a ‘higher for longer’ monetary policy approach. In response, retail traders have become less bullish about USD/JPY. This can be seen by taking a look at IG Client Sentiment (IGCS), which typically functions as a contrarian indicator.

USD/JPY Sentiment Outlook – Bullish

The IGCS gauge shows that about 38% of retail traders are net-long USD/JPY. Since most of them are biased to the downside, this hints that prices may continue higher down the road. This is as upside exposure decreased by -5% and -17% compared to yesterday and last week, respectively. With that in mind, the combination of overall positioning and recent changes offers a stronger bullish bias.

Japanese Yen Daily Chart

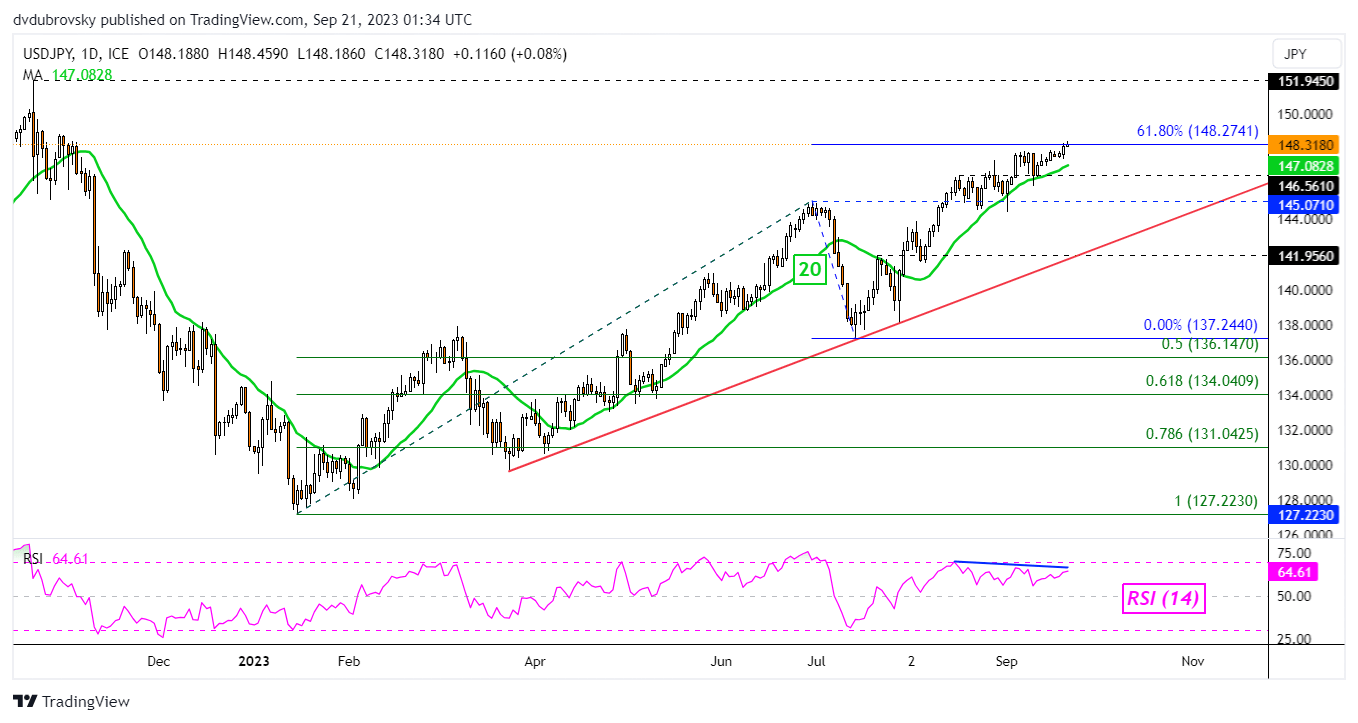
Looking at the daily chart, USD/JPY is flirting with attempting a break above the 61.8% Fibonacci extension level at 148.27. That said, negative RSI divergence is present. This shows that upside momentum is fading, which can at times precede a turn lower. That would place the focus on the 20-day Moving Average, which is immediate support.

That said, the broader bullish bias is being maintained by rising support from March. As such, it would take an extended move lower to overturn the bullish bias. Clearing higher exposes last year’s high of 151.94.

Japanese Yen Daily Chart


US Dollar Gets a Boost from Optimistic Fed; EUR/USD, GBP/USD, AUD/USD

US Dollar Gets a Boost from Optimistic Fed; EUR/USD, GBP/USD, AUD/USD

The US dollar received a boost overnight after the US Federal Reserve signaled one more rate hike before the end of the year and fewer rate cuts than previously indicated. The Fed kept the fed funds rate unchanged at 5.25%-5.5%, in line with expectations while lifting the economic assessment to ‘solid’ from ‘moderate’ and leaving the door open for one more rate hike as ‘inflation remains elevated’.

The Summary of Economic Projections showed 50 basis points fewer rate cuts in 2024 than the projections released in June. The Committee now sees just two rate cuts in 2024 which would put the funds rate around 5.1%. With the US economy outperforming some of its peers, the path of least resistance for the greenback remains sideways to up.

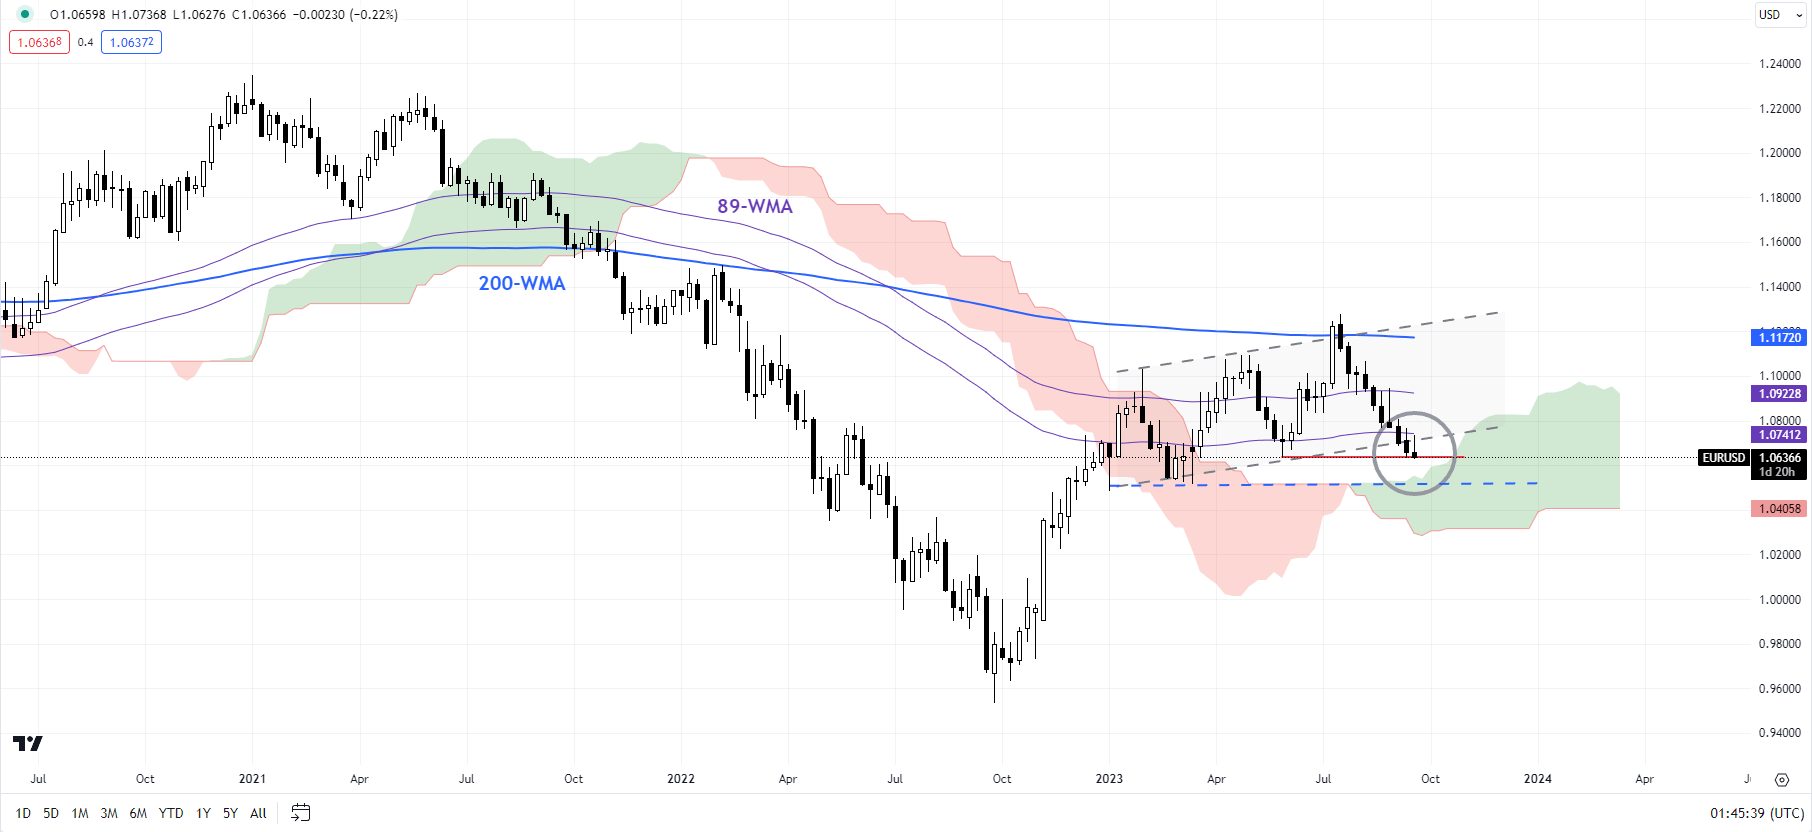
EUR/USD Weekly Chart

image1.png

EUR/USD: No confirmation of a low

EUR/USD is testing fairly strong support at the May low of 1.0630. Oversold conditions suggest it could be tough to break below at least in the first attempt. But unless EUR/USD is able to recover some of the lost ground, including a rise above the early-August high of 1.1065, the broader sideways to weak bias is unlikely to change. Below 1.0630, the next support comes in at the January low of 1.0480.

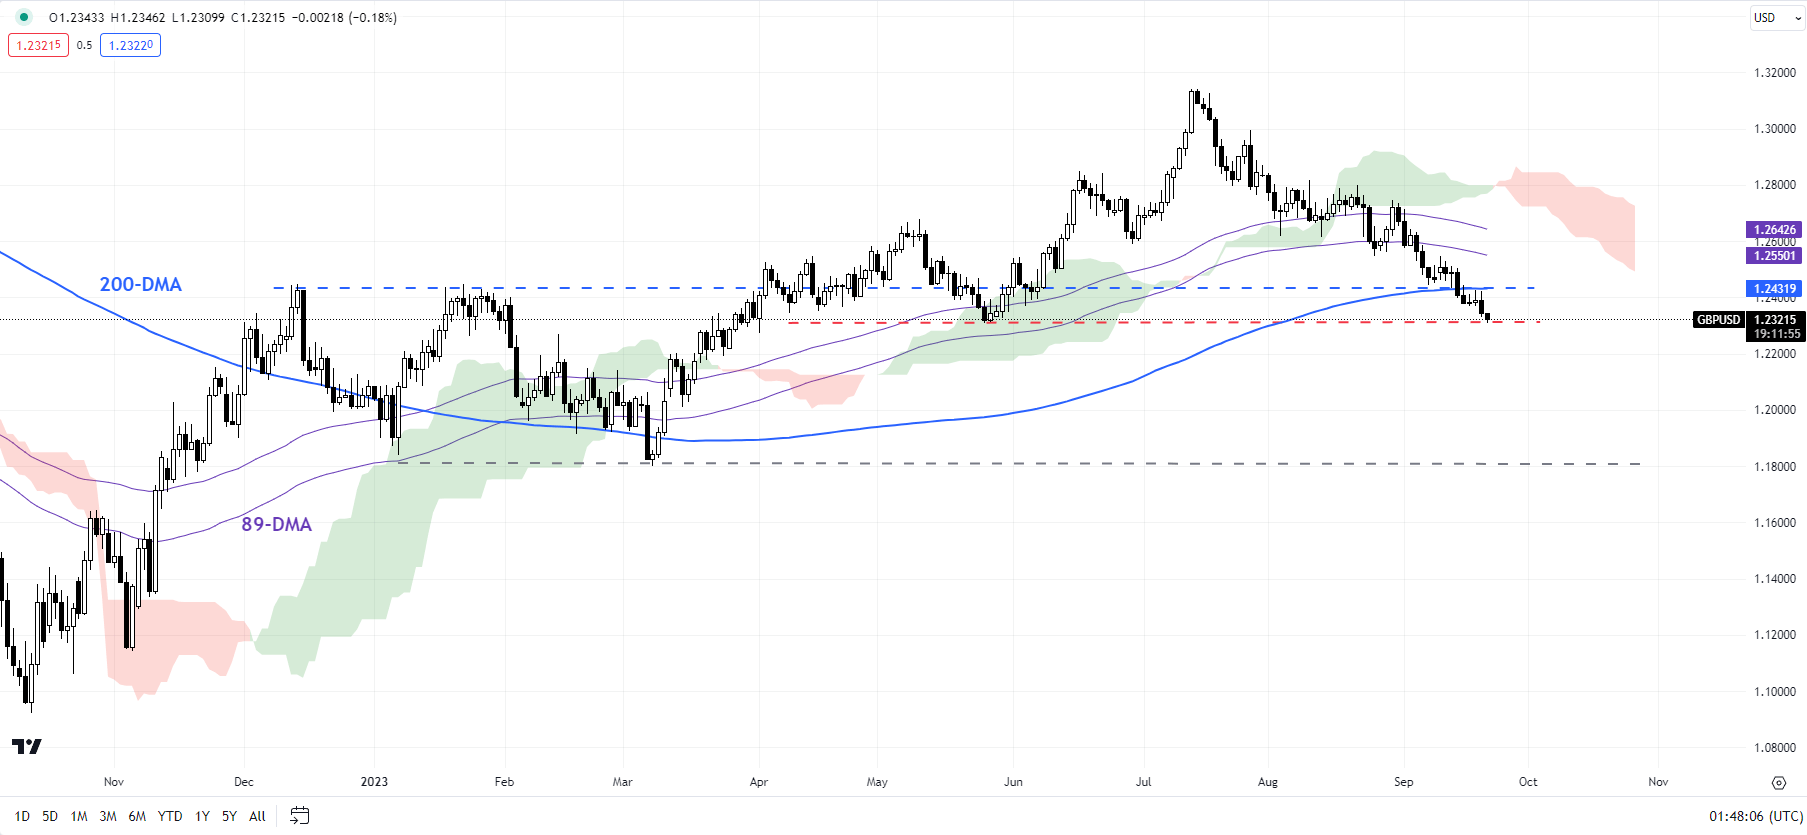
GBP/USD Daily Chart

image2.png

GBPUSD: Downward bias unchanged

The sequence of lower-highs-lower-lows since July keeps GBP/USD’s short-term bias bearish. For the first time since the end of 2022, cable has fallen below the Ichimoku cloud support on the daily charts – a reflection that the bullish bias has changed. For more discussion, see “Pound’s Resilience Masks Broader Fatigue: GBP/USD, EUR/GBP, GBP/JPY Setups,” published August 23.

However, cable looks oversold as it tests quite strong converged support at the end-May low of 1.2300, near the 200-day moving average. This support is strong, and a break below is by no means imminent. However, A decisive break below the May low of 1.2300 would disrupt the higher-low-higher-high sequence since late 2022. The next significant support is at the March low of 1.1800.

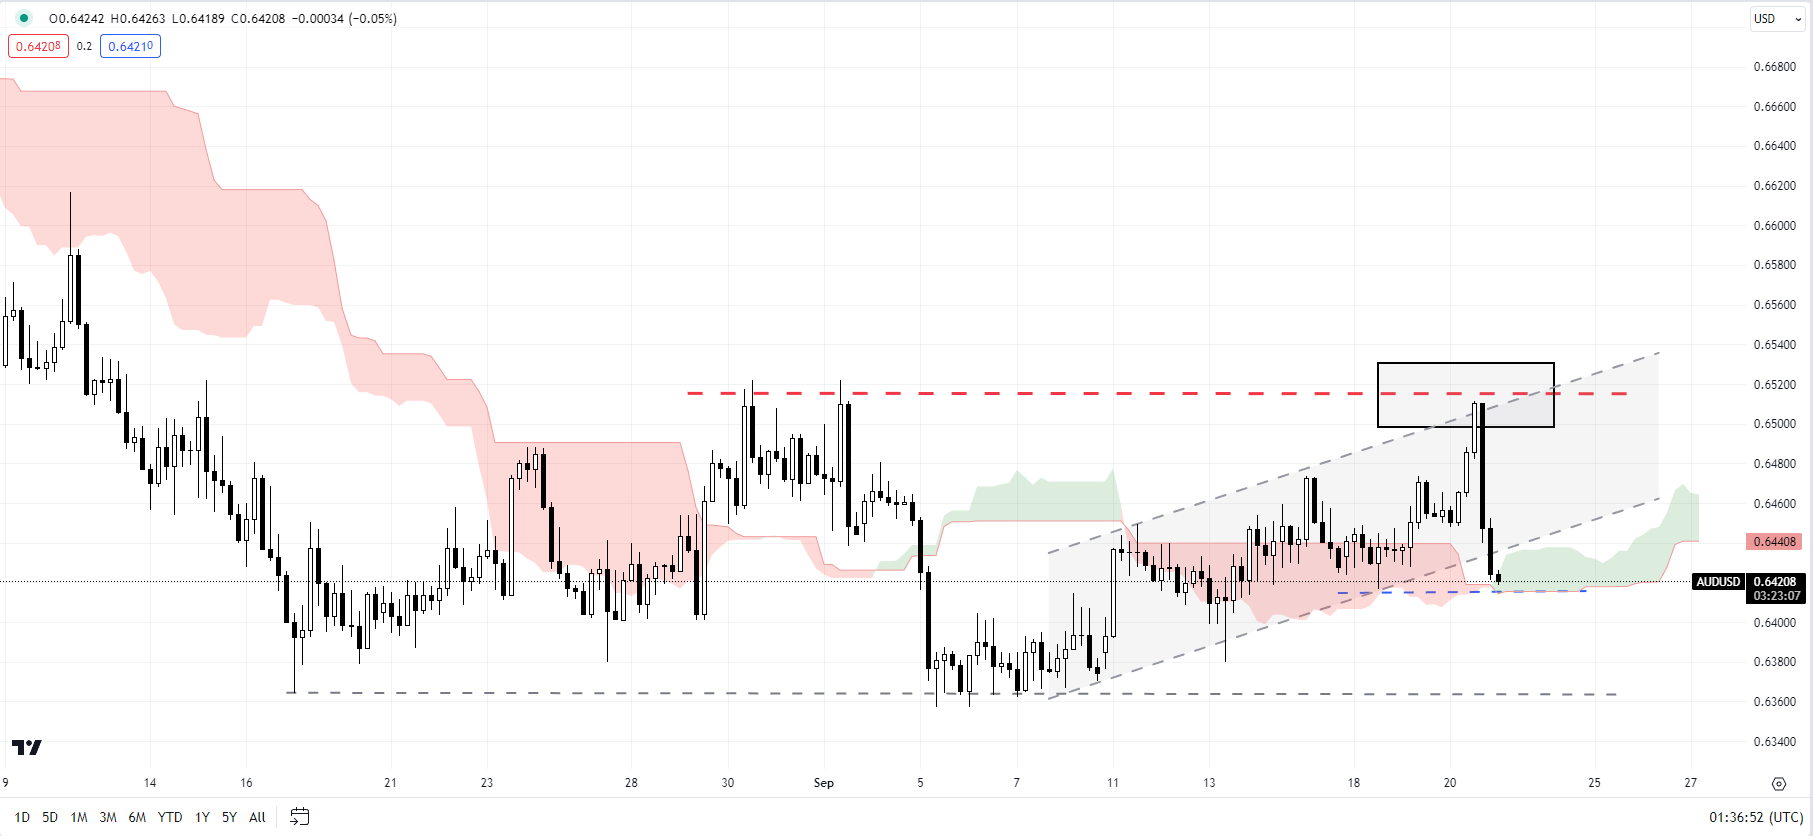
AUD/USD 240-minute Chart

image3.png

AUD/USD: Backs off from key resistance

AUD/USD has retreated from fairly strong converged resistance at the August high of 0.6525, coinciding with the upper edge of a rising channel since early September. The focus now shifts to the vital cushion at Monday’s low of 0.6415, near the lower edge of the Ichimoku cloud on the 240-minute charts. AUD/USD needs to hold above the support if the recovery from the start of the month has to extend, failing which the immediate bias would shift to range from bullish. Any break below the August-September lows of around 0.6350 could expose downside risks toward the November 2022 low of 0.6270.

UK Inflation Softens to 6.7% Creating Uncertainty About a BoE Rate Hike

UK Inflation Softens to 6.7% Creating Uncertainty About a BoE Rate Hike

UK Inflation Report

The UK inflation report for August was in the spotlight this morning. A pickup in UK inflationary pressure would force the Bank of England (BoE) to keep rates higher at the expense of the UK economy.

However, the UK annual inflation rate softened from 6.8% to 6.7% in August. Economists forecast an inflation rate of 7.0%. Consumer prices increased by 0.3% in August versus a 0.4% decline in July. Economists forecast a 0.7% jump in consumer prices.

There was more interest than usual in the numbers. With the UK heading for a recession, softer inflation rates could ease pressure on the BoE to push rates higher and tip the UK economy into a deeper recession.

GBP to USD Reaction to the UK Inflation Report

Before the UK inflation report, the GBP to USD pair rose to a pre-stat high of $1.23970 before falling to a low of $1.23821.

However, in response to the UK inflation report, the GBP to USD pair tumbled from $1.23856 to a low of $1.23332.

This morning, the GBP to USD was down 0.32% to $1.23514.

GBP to USD sinks on softer UK inflation.
The US Federal Reserve will be in the spotlight later today. With the markets betting on the Fed to hit the pause button, the focus will be on the FOMC economic projections and press conference.Upbeat revisions to GDP, inflation, and unemployment would fuel bets on a November rate hike. Considering the latest UK inflation numbers, a hawkish Fed pause would weigh more heavily on the GBP to USD pair.

Asia Day Ahead: Sentiments on hold for Fed meeting, China’s loan prime rate in focus

Asia Day Ahead: Sentiments on hold for Fed meeting, China’s loan prime rate in focus

Further de-risking took hold of Wall Street overnight, as the usual caution persisted in the lead-up to the Federal Open Market Committee (FOMC) meeting, albeit with some paring of losses into the latter half of the session. Treasury yields resumed their ascent to retest their multi-year highs, seemingly reflecting increased positioning for a hawkish-pause scenario from the Federal Reserve (Fed). Both the US two-year and ten-year yields touched its highest level in 16 years, both rising by around 4.7 basis-point (bp) to reach 5.109% and 4.365% respectively.

This comes as a gridlock over spending bills in Congress brought renewed risks of a US government shutdown, with the tendency for policymakers to use time pressures to better further their aims potentially keeping sentiments on some unease in the lead-up to its deadline of 30 September 2023.

At least for now, attention will be concentrated on the upcoming Fed meeting, with rate expectations leaning towards a prolonged rate hold from the Fed, which seems to misalign with policymakers’ views of one additional hike by the end of this year. Focus will be on whether the fresh economic projections are able to provide the much-needed conviction for market participants that the Fed’s call for additional tightening will be followed through.

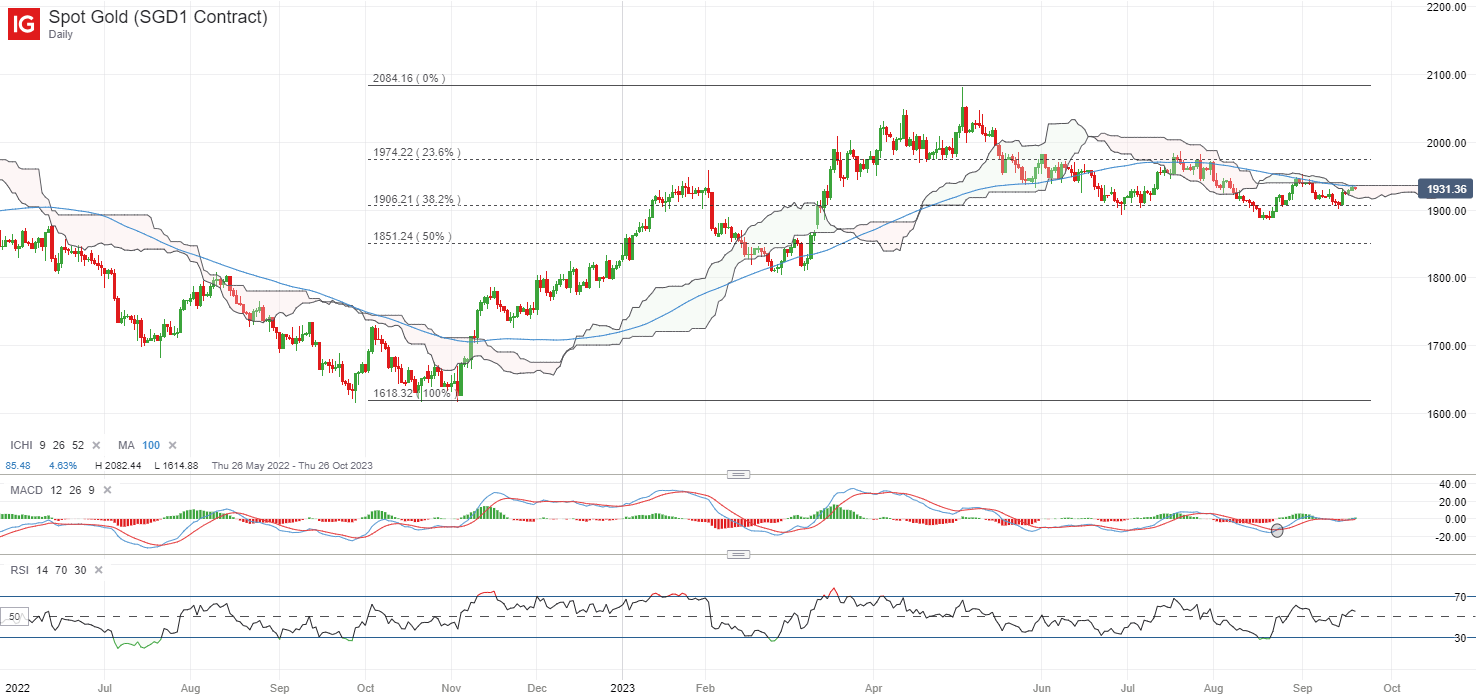
Elevated real Treasury yields have been a key headwind for gold prices, but some signs of life were seen lately, with the yellow metal’s prices edging higher to retest the upper edge of its Ichimoku cloud on the daily chart. Much will still depend on whether we can see a successful break above the cloud zone, with prices failing to do since June this year. Immediate resistance to watch may be at US$1,950 level, while the US$1,900 level will be a key support to hold for buyers.

image1.png

Asian stocks look set for a subdued open, with Nikkei -0.26%, ASX -0.44% and KOSPI +0.18% at the time of writing. Ahead, China’s loan prime rate will be in focus, with broad expectations looking for a no-change, following last week’s inaction on the Medium-term Lending Facility (MLF) rate by the People’s Bank of China (PBoC). Given some positive surprises in economic data reflecting initial success in supportive policies lately, it also provides room for authorities for some wait-and-see. Any cuts may come as a surprise, which could arguably instil some alarm of a more lacklustre recovery instead.

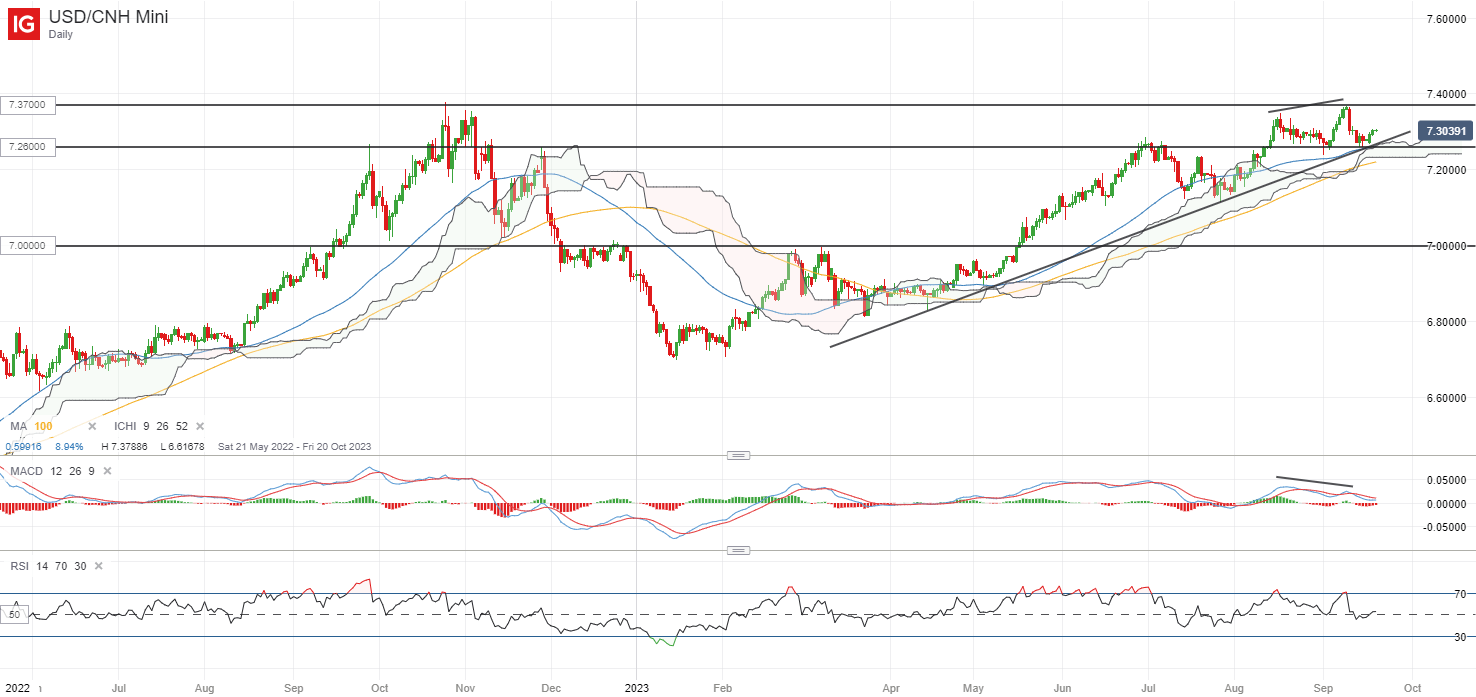
The USD/CNH may be in focus, having defended its support confluence at the 7.260 level lately, following a short retracement from its November 2022 high. This level is where an upward trendline support stands alongside its 50-day moving average (MA). For now, the broader upward trend remains in place, with the pair still trading above its Ichimoku cloud pattern on the daily chart, guided by a series of higher highs and higher lows since the start of the year. Any breakdown of the key 7.260 level may leave the 7.190 level on watch next, while on the upside, the year-to-date high at the 7.370 level will be a key resistance to overcome.

image2.png

On the watchlist: Natural gas prices attempting for a break above a key psychological level

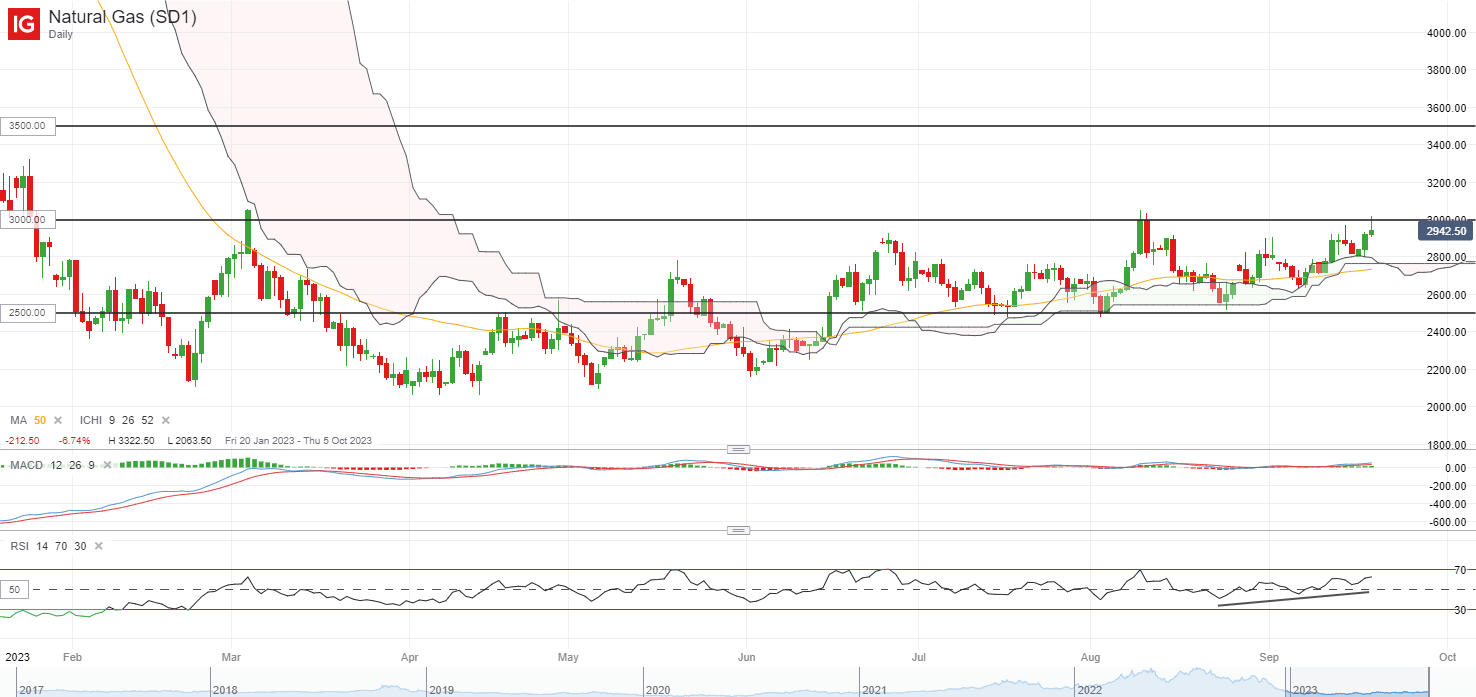
US natural gas prices have gained for the second straight day to a one-month high this week, attempting for a break above its key psychological $3.00/MMBtu mark due to a drop in daily output, along with some positive spillover effect from higher oil prices lately. While some resistance have surfaced at this level overnight with the formation of a bearish shooting star on the daily chart, the higher highs and higher lows formation since late-August this year may still reflect some control from buyers, with prices still defending its Ichimoku cloud support since June this year.

Any successful reclaim of the $3.00/MMBtu level ahead may support a move to retest the $3.50/MMBtu next, with projection based on a breakout of the current ranging pattern. On the downside, the daily Ichimoku cloud has proven to be a key support zone for buyers, which leaves the $2.80/MMBtu as an immediate support to hold.

image3.png


US Indices Ahead of Fed Rate Decision: Dow, S&P 500, Nasdaq Price Setups

US Indices Ahead of Fed Rate Decision: Dow, S&P 500, Nasdaq Price Setups

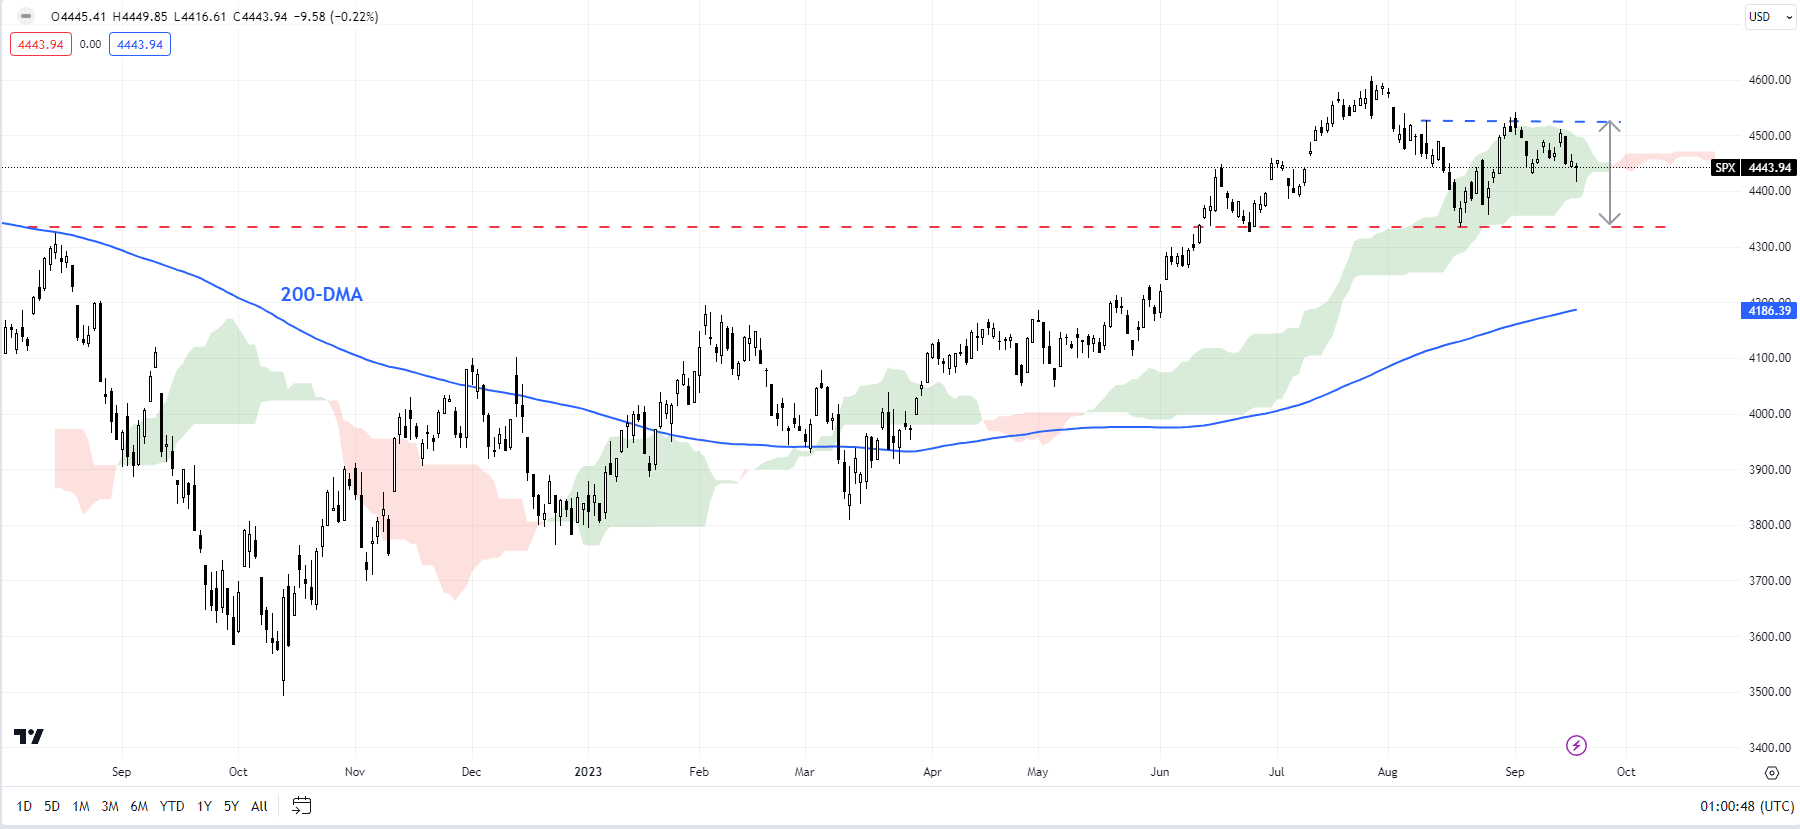
S&P 500: 4325 is key support

While there are no signs of reversal of the uptrend that began earlier this year, signs of fatigue have emerged in recent weeks, as pointed out in recent updates. See “US Indices Hit a Roadblock After Solid Services Print: S&P 500, Nasdaq,” published September 7; “US Indices Rally Beginning to Crack? S&P 500, Nasdaq Price Setups,” published August 3; “S&P 500, Nasdaq 100 Forecast: Overly Optimistic Sentiment Poses a Minor Setback Risk,” published July 23.

On intraday charts, the index in August moved under the Ichimoku cloud cover on the 240-minute charts for the first time since the rally began in early 2023. The subsequent rally has stalled at cloud cover. Taken together, on its own, this doesn’t necessarily mean that the uptrend is reversing – that is, it would well be a consolidation/pause within the uptrend.

S&P 500 Daily Chart

image1.png

However, any break below crucial converged support on the 200-period moving average, coinciding with the June low of 4325 would confirm that the multi-week upward pressure had faded. Such a break could open the door toward the 200-day moving average (at about 4200). On the upside, the index needs to crack above 4550 for the downside risks to dissipate. Stronger resistance is at the March 2022 high of 4637.

S&P 500 240-Minute Chart

image2.png

Nasdaq 100: Upward momentum has slowed recently

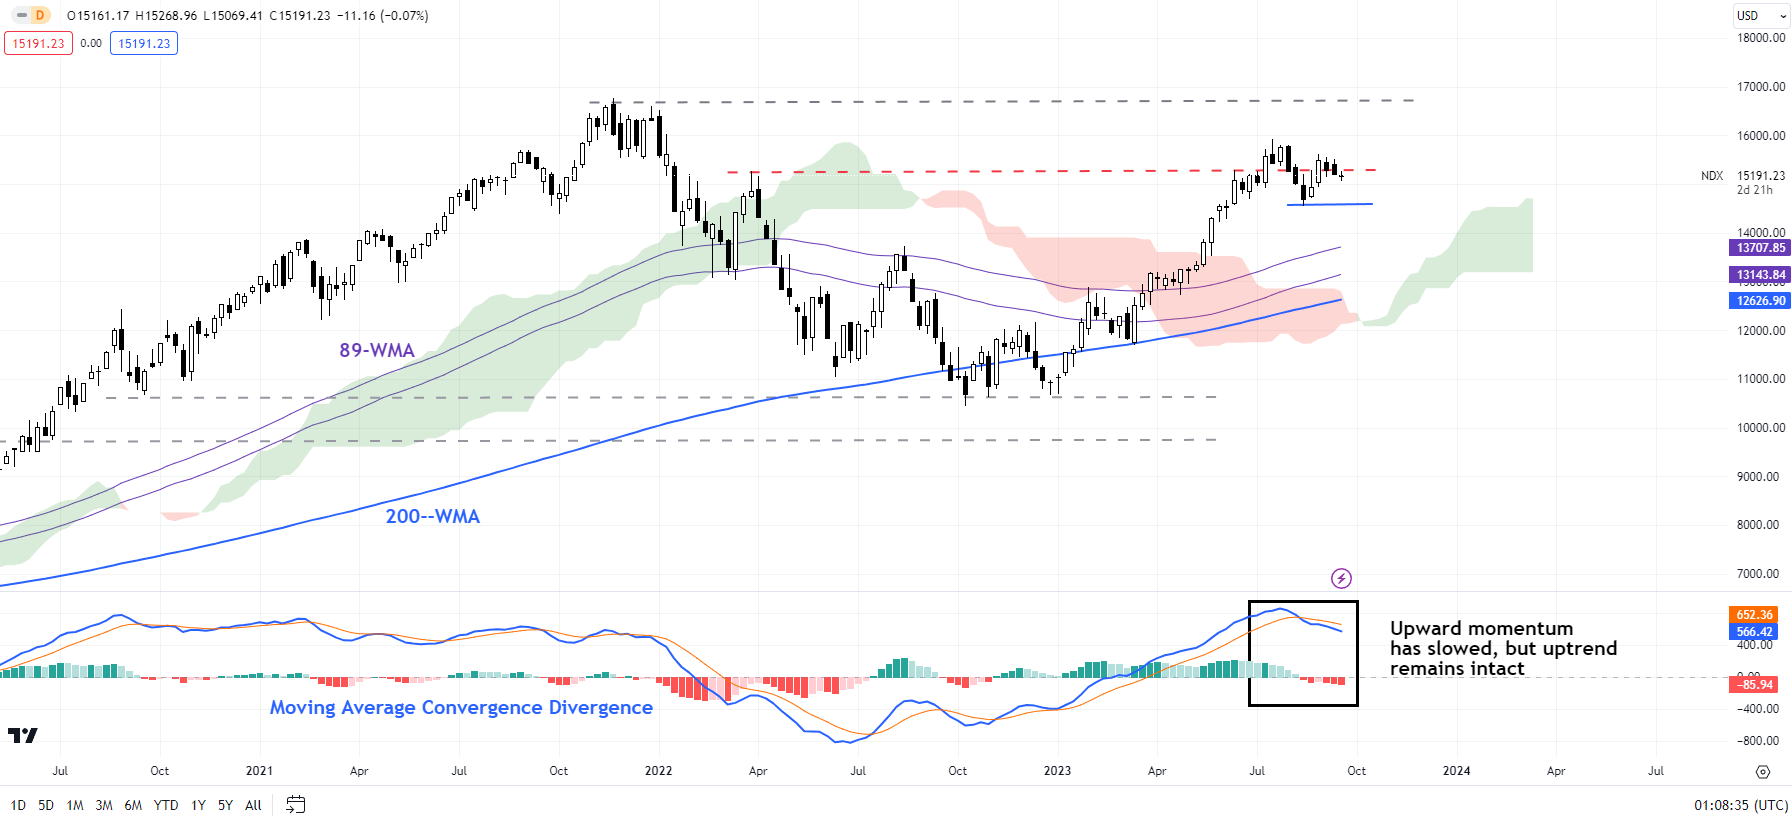
While the upward momentum in the Nasdaq 100 index may have slowed, the Moving Average Convergence Divergence indicator on the weekly charts suggests the uptrend has not ended – the MACD indicator continues to hover in positive territory suggesting the interim trend is up. Only a break below the August low of 14560 would pose a risk to the uptrend. Until then, the path of least resistance remains sideways to up.

Nasdaq 100 Weekly Chart

image3.png

Zooming out, and looking at the bigger picture, as highlighted in arecent update, the momentum on the monthly charts has been feeble compared with the huge rally since late 2022, raising the risk of a gradual weakening, similar to the gradual drift lower in gold since May. For more discussion, see “Is Nasdaq Following Gold’s Footsteps? NDX, XAU/USD Price Setups,” published August 14.

Dow Jones Industrial Average Weekly Chart

image4.png

Dow Jones Industrial Average (DJIA): Holding the bullish break

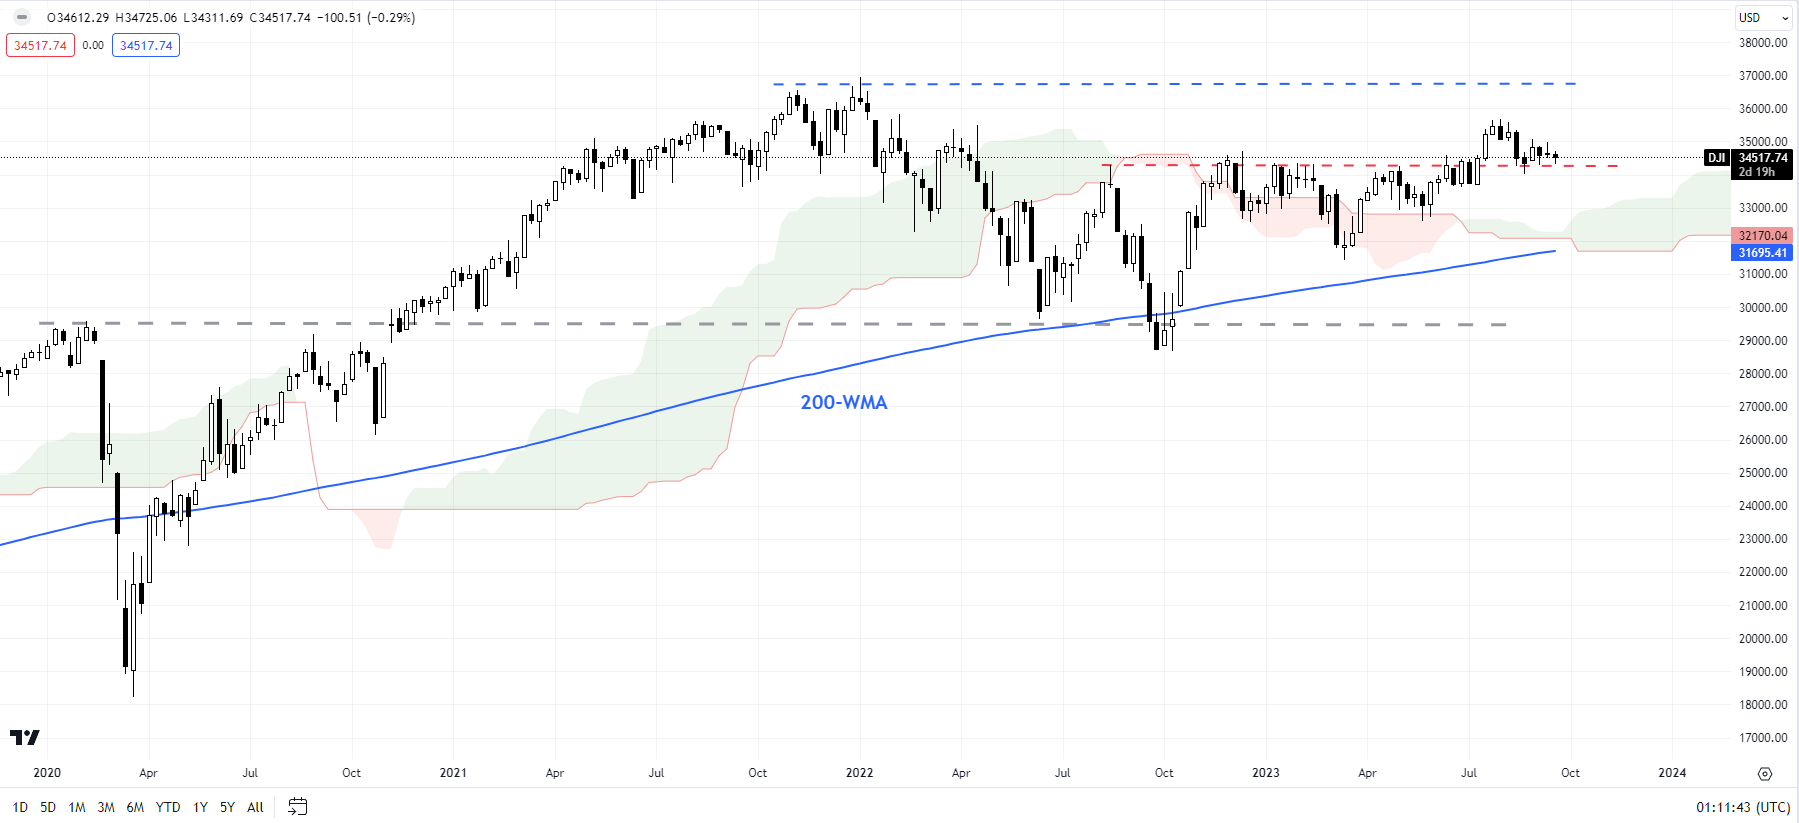
Gains in DJIA have stalled after the bullish break in July above a vital hurdle on a horizontal trendline since 2022. While the breakout confirmed that the downward pressure since 2022 has eased somewhat, it may not be a sign that the index has turned bullish unambiguously. That is, the index needs to break above the early-2022 high of 36950 for the outlook to turn bullish. Until then, the index could remain in a broad range with an upward bias.

How Will the US Dollar React to the Fed Rate Decision?

How Will the US Dollar React to the Fed Rate Decision?

US Dollar Scenarios Ahead of FOMC – Price Setups:

Market pricing based on the CME FedWatch tool suggests the US Federal Reserve is widely expected to keep the federal funds rate steady at its meeting on September 19-20. Moderating core inflation (notwithstanding the uptick in headline CPI last month), cooling labour market conditions, and stabilizing the housing market argue for a pause.

Meanwhile, Fed Chair Powell is likely to be balanced in his assessment, emphasizing data-dependency with regard to the near-term path of policy. His message could be similar to his message at Jackson Hole last month, where he left the door open for further tightening to cool still-high inflation and above-trend growth.

The bigger question is whether the Fed is done with rate hikes. Recent strong macro data raises the odds of a resurgence in economic activity, raising the risk of renewed price pressures. Hence, while the September rate decision could be a done deal, the November meeting could be a close call. In this regard, next month’s payroll and CPI data will be key before the November 1 FOMC meeting.

The key focus next week will be on the Summary of Economic Projections (SEP) which will be released along with the September FOMC statement. In particular, the 2023 median policy rate could show one more 25 basis-point hike to 5.50%-5.75%, in line with the June assessment. Increased interest would be on whether the 2024 median policy rate forecast is raised from 4.6% projected in June.

From a market perspective, the SEP could be a key driver. Even a 25 basis-point shift higher would still leave roughly 50 basis-points gap with the current dovish 2024 market pricing. Anything greater than that would be perceived to be quite hawkish, triggering a reassessment of the dovish market pricing next year, pushing up USD globally. On the other hand, if 2024 median policy rate projections are unchanged, USD’s rally could take a breather. However, any retreat could be temporary while the US economy outperforms the rest of the world.

DXY Index (USD) 240-Minute Chart

image1.png

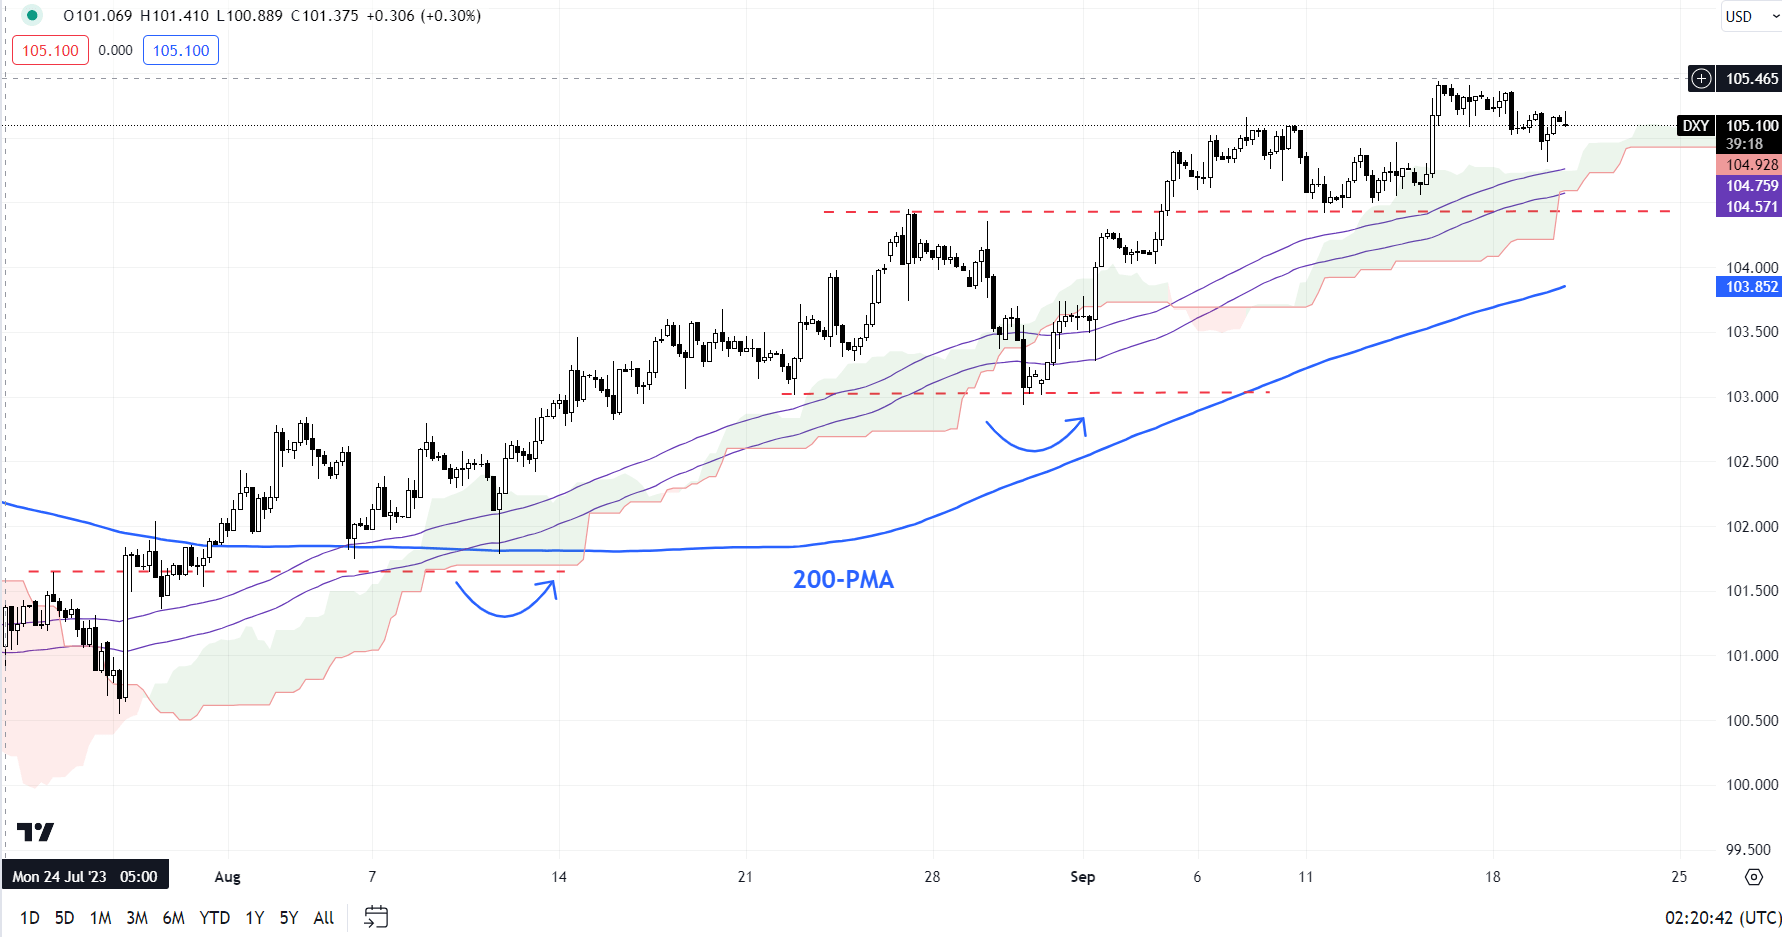
On technical charts, as highlighted in the previous update, the short-term bullish pressure remains intact after the DXY Index (USD index). See “US Dollar Struggles at Resistance Amid Softening Data; EUR/USD, GBP/USD, USD/CAD,” published September 5. The higher-highs-higher-lows sequence from July, associated with breaks above two vital resistance levels on the daily chart reinforces the short-term uptrend.

DXY Index (USD) Daily Chart

image2.png

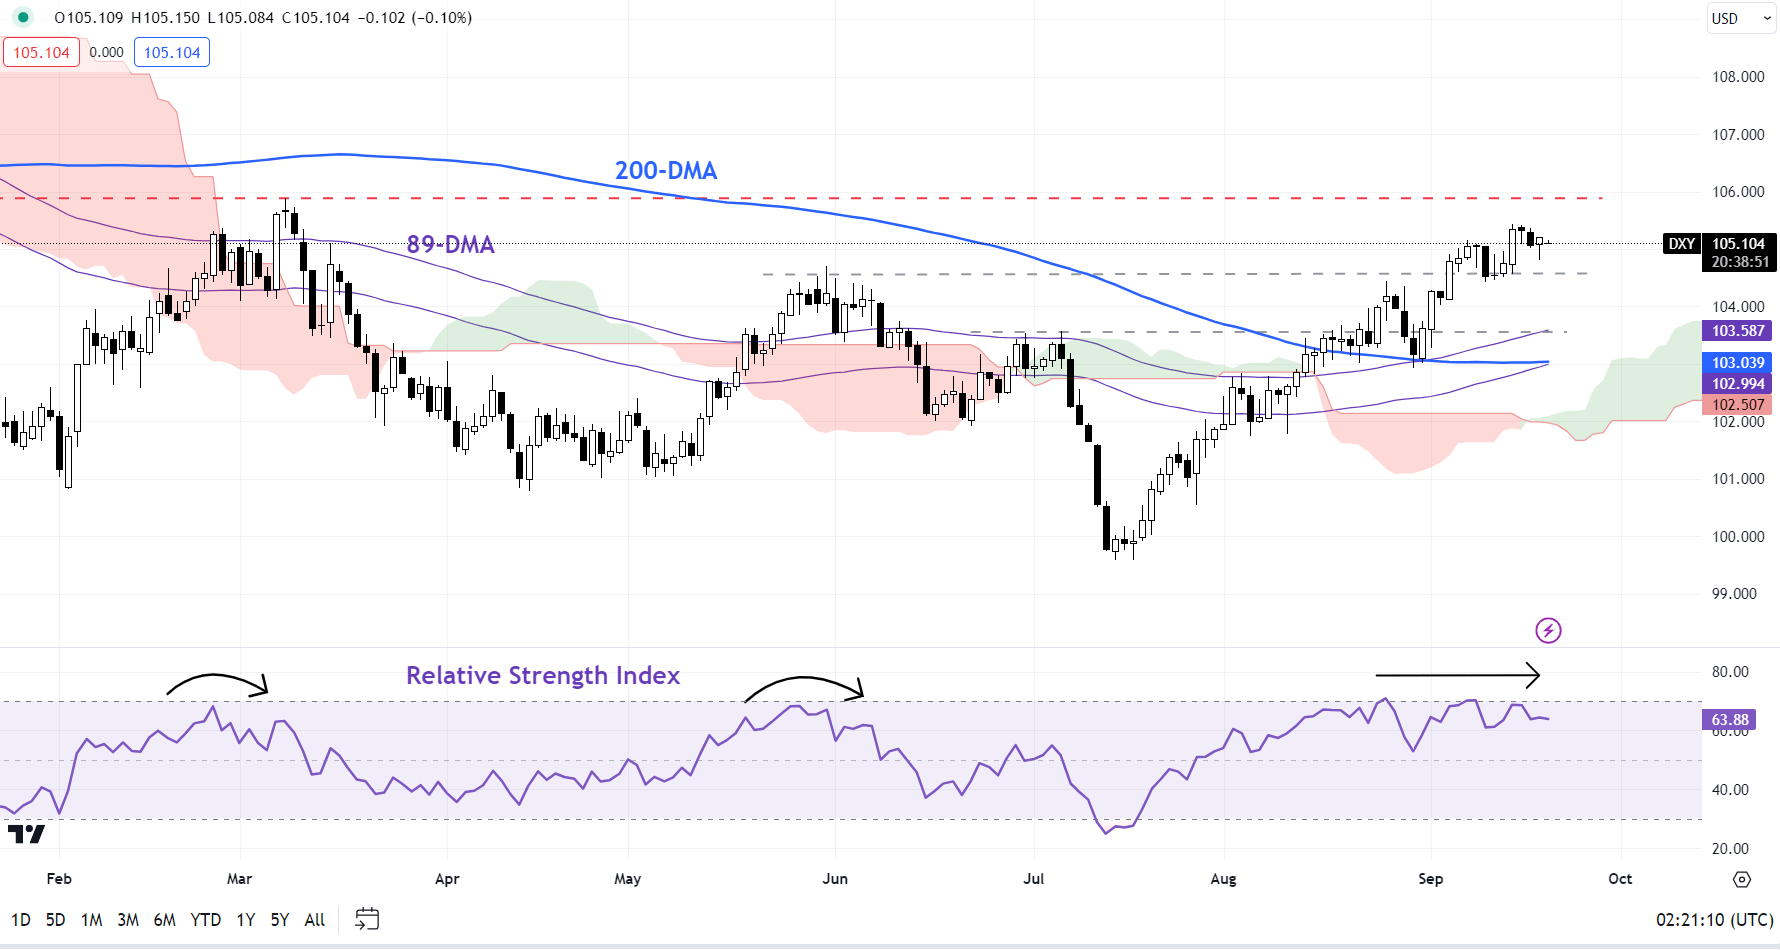
The index is now testing stiff resistance at the March high of around 106.00. While momentum on the daily charts has flattened even as the index has marched higher, suggesting fatigue in the rally, a decisive break above 106.00 would be significantly bullish for the US dollar. On the downside, only a break below the 102.50-103.00 would raise the odds that the DXY Index had peaked.

UK Breaking News: UK CPI Miss Unable to Deter GBP Fragility

UK Breaking News: UK CPI Miss Unable to Deter GBP Fragility

GBP/USD FUNDAMENTAL BACKDROP

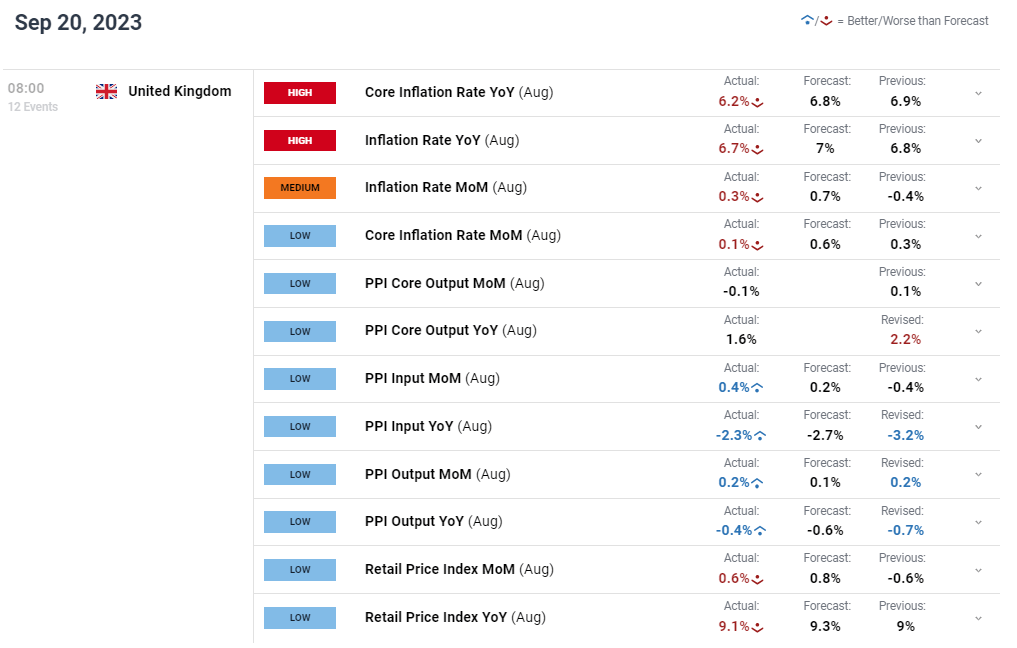
The UK CPI release missed on both headline and core inflation respectively (see economic calendar below) with the largest downward contributor being food while upside influences saw motor fuel leading the way. This is no surprise as global CPI reports are capturing the rally in crude oil prices, leaving central banks wary about future costs.

Although inflationary pressures slightly softened, we saw core inflation at these levels in early 2023 after which prices then pushed higher. Headline readings are promising reaching levels last seen in February 2022 but remain far off from target levels. The slowdown in retail sales will encourage BoE officials in that the tight monetary policy environment seems to be weighing on consumers.

The uptick in PPI however, is a cause for concern as PPI tends to be a leading indicator whereby producer prices often end up being passed on to the consumer thus increasing CPI figures going forward. If energy prices continues to rise, this may well be the case.

GBP/USD ECONOMIC CALENDAR (GMT +02:00)

image1.png

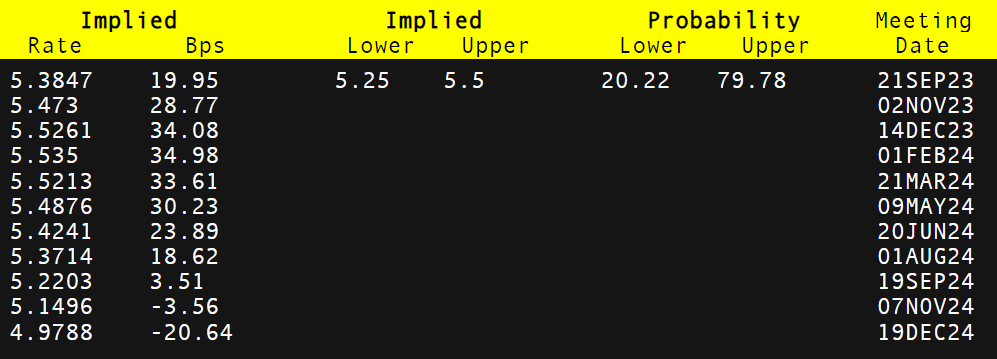
The impact on money market pricing (refer to table below) for the Bank of England (BoE), has changed little post-announcement and remains in favor of a 25bps rate hike with roughly 79% probability tomorrow. I expect no surprises here and forward guidance will be critical to the future interest rate cycle.

BANK OF ENGLAND INTEREST RATE PROBABILITIES

image2.png

TECHNICAL ANALYSIS

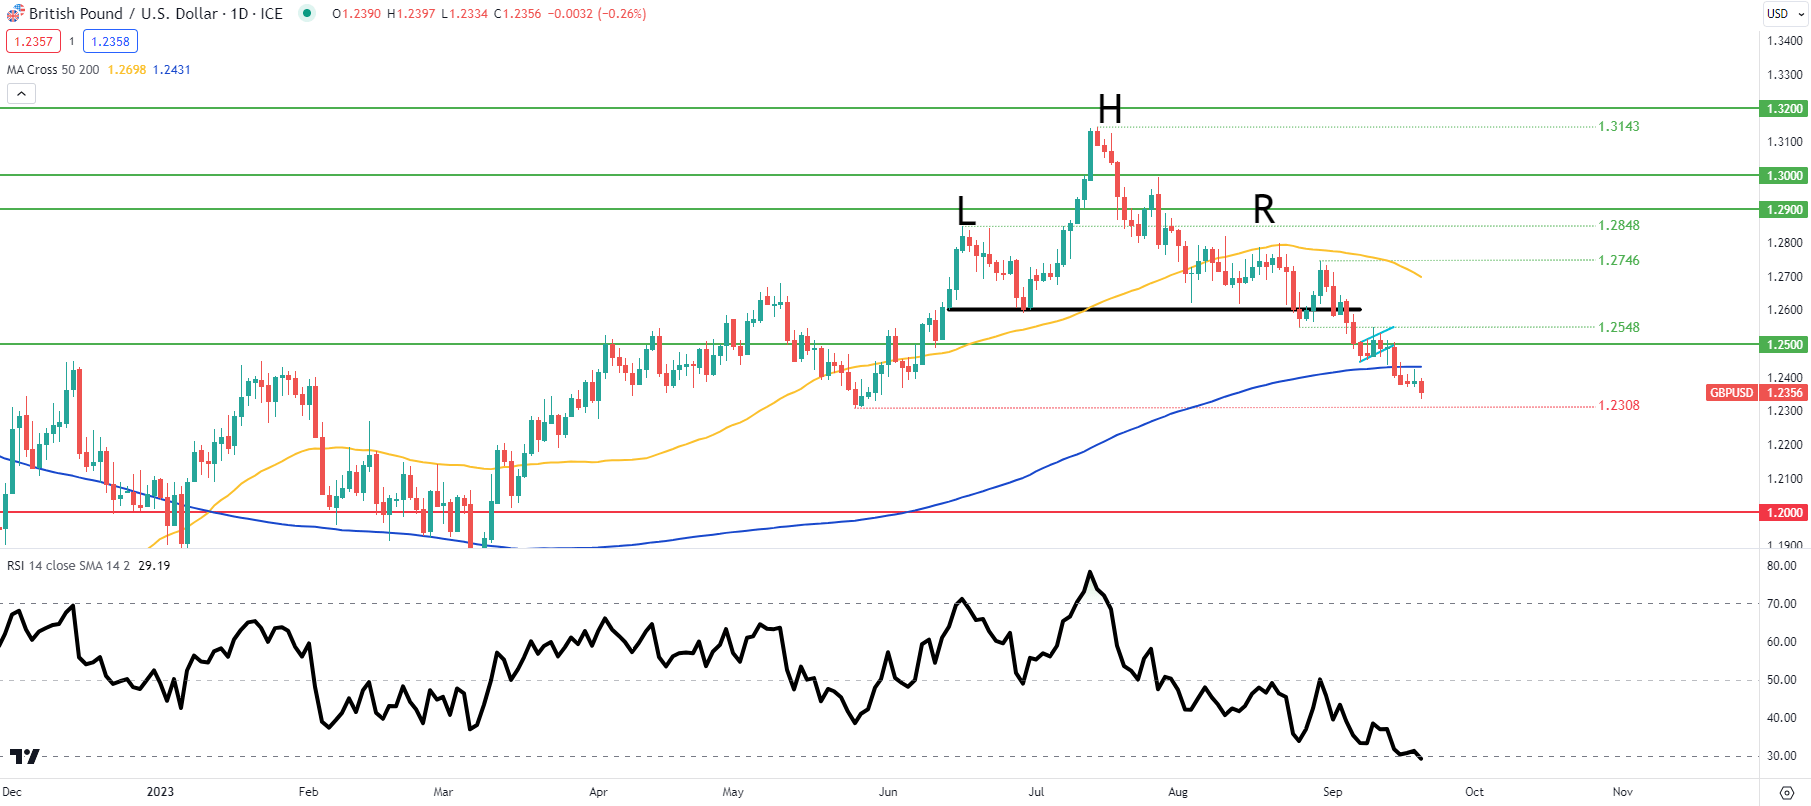
GBP/USD DAILY CHART

image3.png

Price action on the daily cable chart above shows the pound selling off, heading towards the 1.2308 May swing low. The pair now enters oversold territory as measured by the Relative Strength Index (RSI) but has a lot more volatility in store with the Fed rate announcement later today and the BoE tomorrow.

Gold (XAU/USD) Pressured by Rising US Bond Yields Ahead of FOMC Decision

Gold (XAU/USD) Pressured by Rising US Bond Yields Ahead of FOMC Decision

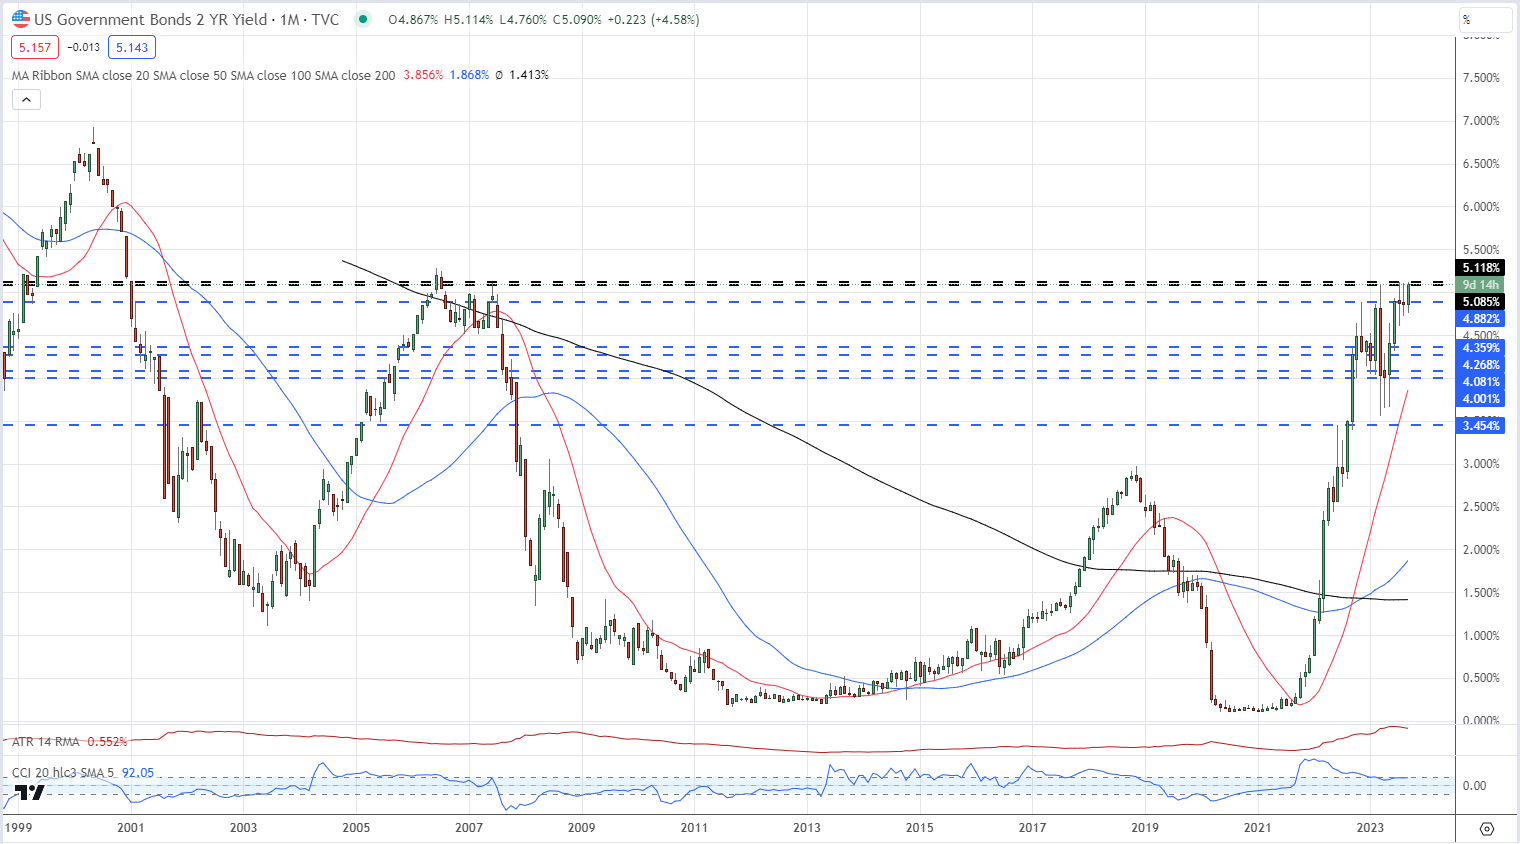
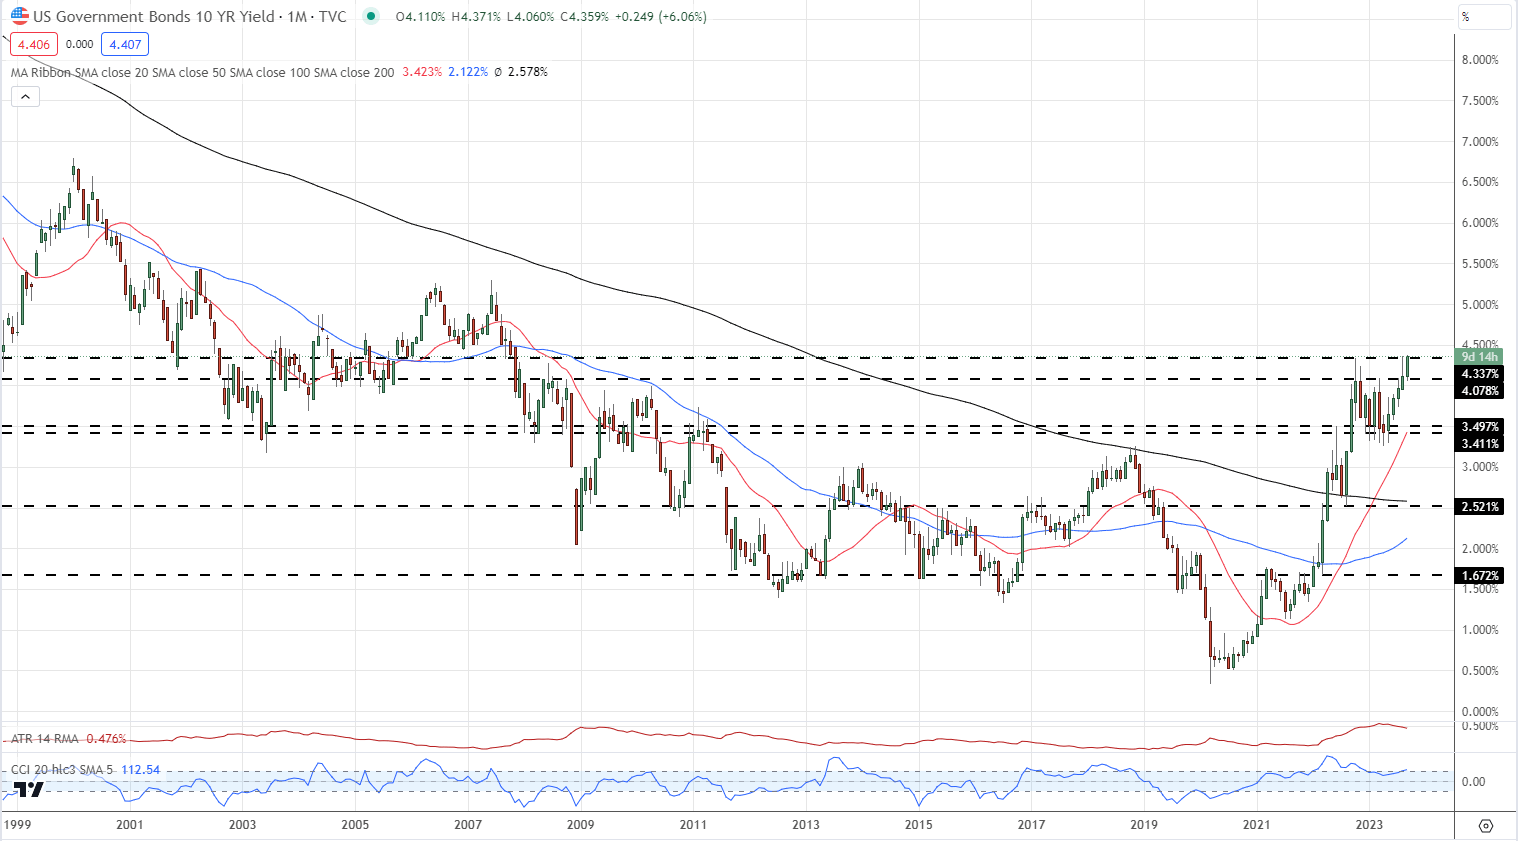
US Treasury yields are pressing against multi-year highs as markets continue to price in higher inflation expectations. The UST 2yr is within a handful of basis points of levels last seen in mid-2006, while the 10yr benchmark yesterday hit levels last seen in November 2007. The recent push higher in oil prices is helping to fuel the inflation narrative, while traders are also pricing in a hawkish hold by the Federal Reserve later today. In addition, market participants are also demanding more yield for their money in the face of the increased US Treasury issuance this year. The US Treasury last week sold around $103 billion of longer-term US Treasuries, placing upward pressure on UST yields.

US Treasury 2yr Yields Monthly Chart

image1.png

US Treasury 10yr Yields Monthly Chart

image2.png

DailyFX Economic Calendar

The Federal Reserve is fully expected to keep interest rates unchanged (525-550) at their latest policy meeting later today. The focal point of today’s meeting will be the post-decision press conference and the latest Summary of Economic Projections or dot plot. This chart shows where each FOMC voting member thinks that interest rates will be over the coming years. The dot plot is closely watched by traders for clues in the Fed’s overall thinking on interest rates.

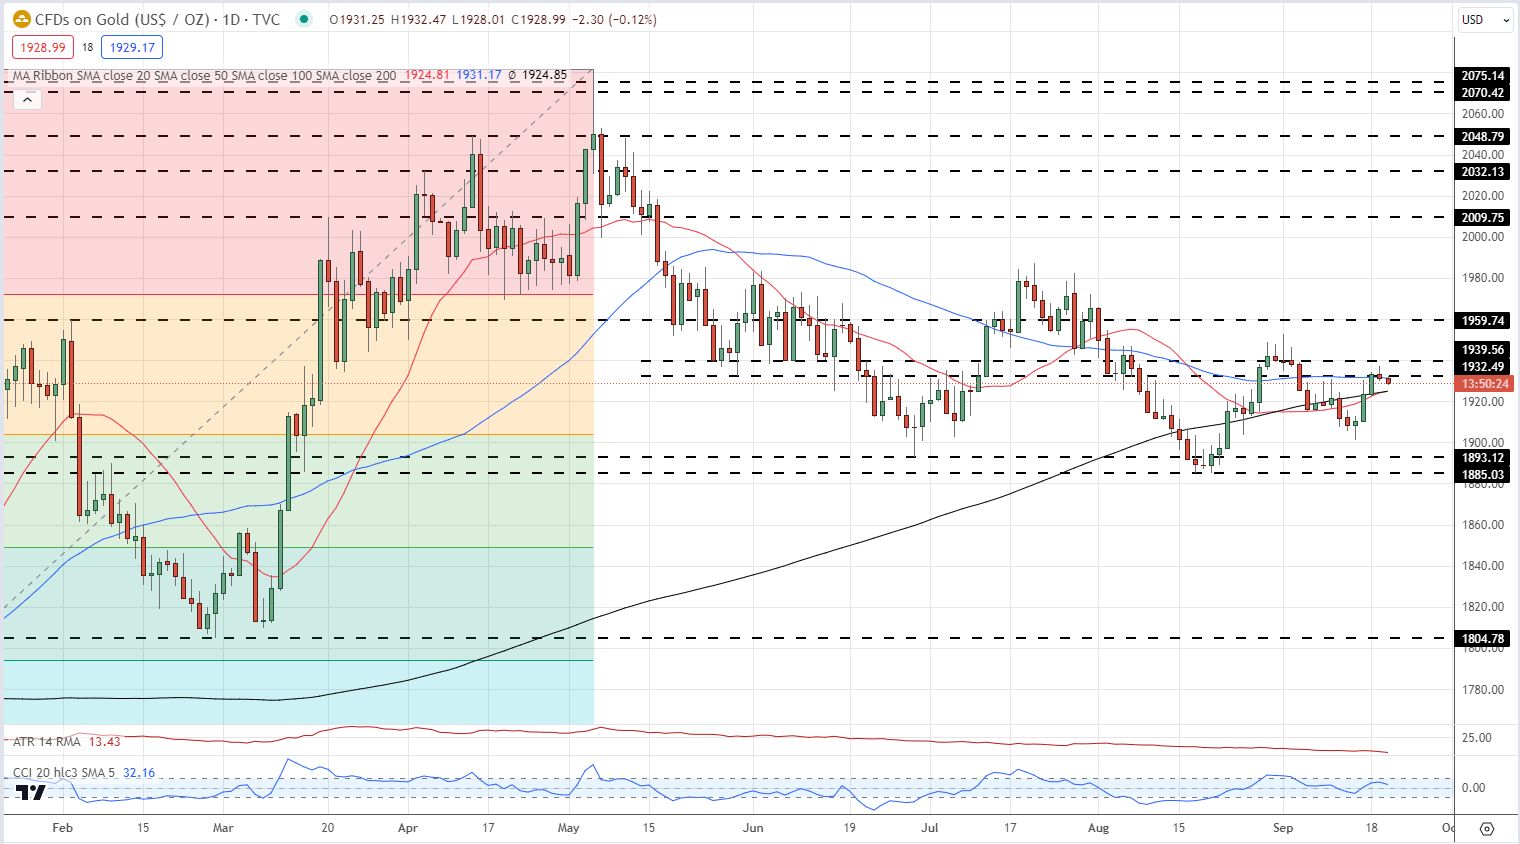
Gold is struggling against the current backdrop with a prior zone of resistance between $1,932/oz. and $1,940/oz. proving difficult to overcome. All three simple moving averages are also clustered just below this area – $1,924/oz. to $1,931/oz. – adding to the mixed outlook. If gold breaks below these moving averages then $1,900/oz. is the next target ahead of $1,893/oz. and $1,885/oz.

Gold Daily Price Chart – September 20, 2023

image3.png

Charts via TradingView

Crypto News: Citi Embraces Blockchain to Service Institutional Clients

Crypto News: Citi Embraces Blockchain to Service Institutional Clients

The Monday Session Overview

SEC v Binance: SEC Loses a Court Motion: The ongoing SEC v Binance US, Binance, and Binance CEO, Changpeng Zhao (often known as CZ) case has gathered momentum. On Monday, the Court denied an SEC request to access Binance US software.

According to Bloomberg, Presiding Judge Faruqui, said, “He wasn’t inclined to allow the inspection at this time.”

Trading Derivatives carries a high level of risk to your capital and you should only trade with money you can afford to lose. Trading Derivatives may not be suitable for all investors, so please ensure that you fully understand the risks involved, and seek independent advice if necessary. A Product Disclosure Statement (PDS) can be obtained either from this website or on request from our offices and should be considered before entering into a transaction with us. Raw Spread accounts offer spreads from 0.0 pips with a commission charge of USD $3.50 per 100k traded. Standard account offer spreads from 1 pips with no additional commission charges. Spreads on CFD indices start at 0.4 points. The information on this site is not directed at residents in any country or jurisdiction where such distribution or use would be contrary to local law or regulation.

However, the Judge suggested the SEC should offer a more specific request and approach additional witnesses.

Citigroup Joins the Blockchain Community in Earnest: On Monday, Citigroup (C) announced the launch of Citi Token Services. According to the press release, Citi Token Services uses blockchain and smart contract technologies to deliver digital asset solutions for institutional clients. Global Head of Citi Services, Shahmir Khaliq, said,

”Digital asset technologies have the potential to upgrade the regulated financial system by applying new technologies to existing legal instruments and well-established regulatory frameworks.”

The crypto community responded to the news. Crypto-Law US founder and Amicus Curiae attorney John E. Deaton said,

“They laugh at it, ignore it, fight it, get regulators to sue over it, and then, they adopt the technology.”

JPEX Hits the News Wires for a Second Session: On Sunday, crypto platform JPEX annouonced the suspension of trading in response to HK authorities investigating the platform for suspected fraud. On Monday, HK authorities arrested six persons linked to JPEX, including social media influencer Joseph Lam. According to the South China Morning Post, Joseph Lam was arrested on suspicion of conspiracy to defraud. The HK SFC reportedly stated JPEX relied on misleading statements made by key opinion leaders (KOLs), who are often paid promoters.

Technical Analysis

Bitcoin Analysis

BTC remained above the $26,755 support level after the positive Monday session. However, BTC remained below the 50-day and 200-day EMAs, affirming bearish price signals.

A bearish cross of the 50-day EMA through the 200-day EMA would support a BTC break below the $26,755 support level. A break below the support level would bring the trend line into play.

However, a hold above the $26,755 support level would give the bulls a run at the 200-day and 50-day EMAs. A break above the EMAs would bring the $28,187 EMA into view.

Favorable updates on the BTC-Spot ETF applications and ongoing SEC case against Coinbase (COIN) and Ripple would support a breakout.

The 14-Daily RSI reading of 54.09 supports a BTC move to the 200-day and 50-day EMAs before entering overbought territory.

BTCUSD Daily Chart sends bearish price signals.
BTCUSD 190923 Daily Chart

Ethereum Analysis

ETH hovered above the $1,626 support level. However, ETH remained below the 50-day and 200-day EMAs, reaffirming bearish price signals. Avoiding the $1,626 support level would give the bulls a run at the 50-day EMA.

Favorable ETH-spot ETF news would support a breakout from $1,650 to target the 50-day EMA.

However, a break below the $1,626 support level would signal an ETH move to the $1,502 support level.

The 14-Daily RSI reading of 47.20 supports an ETH return to $1,600 before entering oversold territory.

ETH Daily Chart sends bearish price signals.
ETHUSD 190923 Daily Chart
DAX Index: ECB Rhetoric and Upcoming Fed Decisions Weigh on DAX 30

DAX Index: ECB Rhetoric and Upcoming Fed Decisions Weigh on DAX 30

DAX Monday Overview

On Monday, the DAX slid by 1.05%. Reversing a 0.56% gain from Friday, the DAX ended the day at 15,727.

Central Bankers Instill Pre-Fed Dread

Hawkish ECB commentary weighed on the DAX and the broader European equity markets. Despite hints of the ECB hitting the brakes after the Thursday rate hike, investors remained sensitive to ECB chatter.

Trading Derivatives carries a high level of risk to your capital and you should only trade with money you can afford to lose. Trading Derivatives may not be suitable for all investors, so please ensure that you fully understand the risks involved, and seek independent advice if necessary. A Product Disclosure Statement (PDS) can be obtained either from this website or on request from our offices and should be considered before entering into a transaction with us. Raw Spread accounts offer spreads from 0.0 pips with a commission charge of USD $3.50 per 100k traded. Standard account offer spreads from 1 pips with no additional commission charges. Spreads on CFD indices start at 0.4 points. The information on this site is not directed at residents in any country or jurisdiction where such distribution or use would be contrary to local law or regulation.

Governor of National Bank of Slovakia Peter Kazimir drew interest on Monday, reportedly saying the ECB may need until March to ascertain whether more rate hikes are necessary. However, ECB Executive Board member Luis de Guindos failed to cushion the downside. De Guindos reportedly said,

“Underlying inflation’s worst moment has passed and it should moderate.”

There were no economic indicators from China or the euro area to influence investor sentiment. The markets remain sensitive to hawkish central bank comments, with the Fed in the spotlight on Wednesday.

Fears of an upward revision to the FOMC economic projections for growth and inflation tested buyer appetite. Upbeat revisions to GDP, inflation, and unemployment would support a November Fed rate hike. Significantly, upbeat revisions would also ease the prospects of a 2024 Fed rate cut.

US equities struggled to break out on Monday. The Dow rose by 0.02%, with the S&P 500 and NASDAQ Composite Index seeing gains of 0.01% and 0.07%, respectively.

The Monday Market Movers

Tech stocks struggled, with Infineon Technologies and Siemens Energy sliding by 2.92% and 2.44%, respectively.

Auto stocks were also among the worst performers.

Porsche and Volkswagen ended the session down 2.59% and 2.15%, respectively. Mercedes Benz Group and Continental fell by 1.15% and 1.58%, respectively, with BMW ending the day down 0.75%.

Disappointment over the Soc Gen strategic plan rollout weighed on bank stocks. Commerzbank and Deutsche Bank declined by 1.42% and 1.91%, respectively.

The Tuesday Session

The futures markets are pointing to a mixed Tuesday session. The DAX is up 9 points, while the NASDAQ mini was down 5.5 points.

Finalized Eurozone inflation figures for August will influence buyer appetite. Considering the market sensitivity to hawkish ECB commentary, upward revisions to core inflation would pressure the DAX.

According to prelim figures, the annual core inflation rate softened from 5.5% to 5.3%, while the annual inflation rate held steady at 5.3%.

Beyond the numbers, investors should consider ECB Executive Board member speeches. Executive Board member Frank Elderson is on the calendar to speak today.

FOMC Meeting Kickoff Likely to Overshadow US Housing Sector Numbers

Later today, US housing sector numbers are unlikely to influence investor sentiment. Economists forecast declines in housing starts and building permits. However, the FOMC meeting gets underway today, which will likely limit the impact of the numbers on market risk sentiment.

Fears of upbeat revisions to GDP, inflation, and unemployment and hawkish Fed Funds rate projections will continue to test the appetite for riskier assets.

Short-Term Forecast

Upward revisions to Eurozone inflation figures would pressure the DAX. The ECB remains wary of inflation, exposing the DAX to hawkish ECB commentary. However, the Wednesday Fed interest rate decision and FOMC economic projections are the biggest threat to the DAX and riskier assets.

DAX Technical Indicators

Daily Chart

On Monday, the DAX broke below the trend line and the 50-day EMA, sending bearish near-term price signals. However, the DAX remained above the 200-day EMA, affirming longer-term bullishness.

A break below the 15,663 support level would signal a DAX move to the 200-day EMA and 15,459 support level. Upward revisions to Eurozone inflation numbers and hawkish ECB chatter would weigh. However, buyer appetite will likely intensify at 15,500, with the 200-day EMA confluent with the 15,459 support level.

Softer Eurozone inflation figures would support a DAX break above the trend line. A break above the trend line would signal a DAX move toward the 16,007 resistance level.

The 14-Daily RSI reading of 46.35 indicates a DAX break below the 15,663 support level before entering oversold territory.

 

undefined


4-Hourly Chart

The DAX sits below the 50-day and 200-day EMAs, sending bearish price signals. A DAX break below the 15,663 support level would give the bulls a look at 15,500 and the 15,459 support level.

A DAX break above the trend line and 50-day EMA would bring the 200-day EMA into play. However, sellers will likely cap the upside at the trend line, with the 50-day EMA confluent with the trend line at $15,785.

The 46.40 RSI reading signals a DAX break below the 15,663 support level before entering oversold territory.
 

undefined


For a lo