EUR/USD Analysis: Eurozone Inflation Dictates Direction Amid Rising EUR/USD Momentum

EUR/USD Analysis: Eurozone Inflation Dictates Direction Amid Rising EUR/USD Momentum

On Monday, the EUR/USD rose by 0.30%. Following a 0.16% gain on Friday, the EUR/USD ended the day at $1.06915. The EUR/USD fell to a low of $1.06545 before rising to a high of $1.06986.

Eurozone Inflation to Pre-Fed Direction

Later today, Finalized Eurozone inflation figures for August will draw investor interest. Market sensitivity to hawkish ECB member commentary was evident on Monday, exposing the EUR/USD to softer-than-expected inflation numbers.

Trading Derivatives carries a high level of risk to your capital and you should only trade with money you can afford to lose. Trading Derivatives may not be suitable for all investors, so please ensure that you fully understand the risks involved, and seek independent advice if necessary. A Product Disclosure Statement (PDS) can be obtained either from this website or on request from our offices and should be considered before entering into a transaction with us. Raw Spread accounts offer spreads from 0.0 pips with a commission charge of USD $3.50 per 100k traded. Standard account offer spreads from 1 pips with no additional commission charges. Spreads on CFD indices start at 0.4 points. The information on this site is not directed at residents in any country or jurisdiction where such distribution or use would be contrary to local law or regulation.

According to prelim figures, the annual core inflation rate softened from 5.5% to 5.3% in August. However, the annual inflation rate held steady at 5.5%. An upward revision to core inflation would support hawkish ECB comments and appetite for the EUR.

Given the focus on inflation, investors should consider ECB Executive Board member commentary. Board member Frank Elderson is on the calendar to speak today.

US Housing Sector Takes Center Stage as FOMC Meeting Gets Underway

US building permits and housing starts will be in focus early in the US session. However, the FOMC meeting also gets underway today, leaving investors to second guess the Fed interest rate trajectory.

Barring a significant decline in housing sector data, investors will likely overlook these figures. The housing sector is unlikely to influence the Fed and FOMC member projections. However, investors should remain wary, as a deterioration in the housing sector could signal a hard landing for the US economy.

A deteriorating housing sector would weigh on consumer confidence and spending. US private consumption contributes more than 65% to the US economy. A pullback in spending would ease demand-driven inflationary pressures and rein in expectations of further Fed rate hikes.

Short-Term Forecast:

While Eurozone inflation numbers and ECB commentary will influence buyer appetite, the Fed remains the key driver. A hawkish Fed would support the bearish near-term EUR/USD trend and a return to sub-$1.06.

EUR/USD Price Action

Daily Chart

The EUR/USD remained below the 50-day and 200-day EMAs, reaffirming bearish price signals. A break below the $1.06342 support level would give the bears a run at $1.06.

However, the Eurozone inflation figures should be softer than prelim to support a EUR/USD pullback.

A EUR/USD return to $1.07 would signal a move toward the $1.07635 resistance level. The EUR/USD needs hawkish central bank speeches and upward revisions to prelim inflation numbers to support a breakout session.

The 14-period Daily RSI at 37.79 indicates a EUR/USD break below the $1.06342 support level before entering oversold territory.

EUR/USD Daily Chart sends bearish price signals.
EURUSD 190923 Daily Chart

4-Hour Chart

The EUR/USD sits below the 50-day and 200-day EMAs, reaffirming the bearish price signals. A EUR/USD break above the 50-day EMA would support a move toward the $1.07635 resistance level.

However, failure to break above the 50-day EMA would support a EUR/USD fall toward the $1.06342 support level.

The 14-period 4-Hourly RSI at 47.59 indicates a EUR/USD break below the $1.06342 support level before entering oversold territory.

4-Hourly Chart affirms bearish price signals.
EURUSD 190923 4 Hourly Chart
Silver Prices Analysis: XAG/USD Navigating Central Bank Chatter

Silver Prices Analysis: XAG/USD Navigating Central Bank Chatter

Silver at the Crossroads: A Delicate Dance with Global Economics

Silver (XAG/USD) is hovering around a two-week high, closely watching the U.S. dollar’s moves and what the big central banks are up to. With so much going on in the global economy, it’s tough to pin down where silver’s headed next, but it’s definitely tied to big financial news and monetary policy changes.

Central Bank Decisions Loom

The market is abuzz, predominantly due to the upcoming Federal Reserve meeting. With a 99% expectation that the Fed will maintain current interest rates, as indicated by CME’s FedWatch tool, there remains an atmosphere of suspense. Speculations of rate hikes later in the year persist, chiefly steered by the latest inflation data. Additionally, decisions from central banks in Britain and Japan further add complexity to silver’s impending course.

Trading Derivatives carries a high level of risk to your capital and you should only trade with money you can afford to lose. Trading Derivatives may not be suitable for all investors, so please ensure that you fully understand the risks involved, and seek independent advice if necessary. A Product Disclosure Statement (PDS) can be obtained either from this website or on request from our offices and should be considered before entering into a transaction with us. Raw Spread accounts offer spreads from 0.0 pips with a commission charge of USD $3.50 per 100k traded. Standard account offer spreads from 1 pips with no additional commission charges. Spreads on CFD indices start at 0.4 points. The information on this site is not directed at residents in any country or jurisdiction where such distribution or use would be contrary to local law or regulation.

A slew of recent inflation metrics, including the consumer and producer price indexes, suggests a potential tempering of inflationary pressures. These data points, especially when excluding fluctuating variables like food and energy, introduce a layer of uncertainty. Furthermore, the University of Michigan’s report indicating a dip in inflation expectations adds to the growing cloud of unpredictability.

Currency Interplay

The U.S. dollar’s slight descent has inadvertently thrust silver into the spotlight for global investors. A 0.3% dip against major currencies amplifies silver’s appeal, especially as global economies grapple with inflation concerns and potential policy shifts. This currency dynamic, coupled with Fed Chair Powell’s anticipated insights on inflation, holds the power to mold the metal’s attractiveness in the immediate future.

Plotting Silver’s Path

Amid signals of potential rate hikes by the Bank of England and the yet-undefined stance of the Bank of Japan, silver’s journey is intricate. There’s an undercurrent of anxiety around persistent inflation, buttressed by robust consumer spending and a stringent labor market landscape. These factors may propel central banks to either uphold or escalate their interest rate regimes, consequently affecting silver’s prospects for a robust ascent.

Short-Term Outlook

In wrapping up, silver’s immediate future is delicately poised between optimism and caution. It remains tethered to the forthcoming determinations of central banks and the overarching global economic narrative. Investors and stakeholders are keenly observing, ready to respond to the subtlest of cues that might dictate the metal’s direction.

Technical Analysis

4-Hour Silver (XAG/USD)Silver (XAG/USD) stands at a 4-hour price of 23.18, exactly aligning with its previous 4-hour mark. It trades slightly below its 200-4H moving average of 23.35 but above the 50-4H moving average of 22.99, suggesting a potential tussle between bullish and bearish sentiments. The 14-4H RSI registers at 56.46, indicating a mildly bullish momentum as it’s above the neutral point.

Although the current price sits above the main support area of 22.70 to 22.28, it remains distanced from the primary resistance zone of 25.00 to 25.27. With these metrics, the short-term sentiment leans cautiously bullish, but challenges persist for a definitive uptrend.

Gold Prices Forecast: XAU/USD Spot Wavers, Awaiting Fed Decisions

Gold Prices Forecast: XAU/USD Spot Wavers, Awaiting Fed Decisions

Gold Prices Flutter Ahead of Key Central Bank Decisions

Gold (XAU/USD) is exhibiting a cautious demeanor, hovering near a two-week high as the U.S. dollar wanes from its six-month peak. Traders are positioning themselves ahead of pivotal central bank meetings, beginning with the U.S. Federal Reserve today. The market’s focus is squarely on future rate hikes and inflation outlooks, elements that are vital for the precious metal’s performance.

U.S. Dollar and Overseas Buyers

The softening U.S. dollar has made gold more attractive to international buyers. This comes just ahead of the anticipated policy decisions from the central banks of the United States, Britain, and Japan. The dollar’s 0.3% dip against rival currencies has rekindled interest in gold, as investors are increasingly concerned about inflation and interest rate changes.

Trading Derivatives carries a high level of risk to your capital and you should only trade with money you can afford to lose. Trading Derivatives may not be suitable for all investors, so please ensure that you fully understand the risks involved, and seek independent advice if necessary. A Product Disclosure Statement (PDS) can be obtained either from this website or on request from our offices and should be considered before entering into a transaction with us. Raw Spread accounts offer spreads from 0.0 pips with a commission charge of USD $3.50 per 100k traded. Standard account offer spreads from 1 pips with no additional commission charges. Spreads on CFD indices start at 0.4 points. The information on this site is not directed at residents in any country or jurisdiction where such distribution or use would be contrary to local law or regulation.

What the Fed Might Signal

The U.S. Federal Reserve is unlikely to change its current rates, but all eyes will be on Fed Chair Powell’s insights on inflation risks. While Powell is expected to stress that inflation threats persist, he is likely to express a “wait-and-see” approach. Low global inventories of gasoline and diesel pose short-term risks to inflation targets, a situation that could impact gold’s appeal should the Fed opt to hike rates further to control inflation.

Market Sentiment

With the Bank of England expected to raise rates and the Bank of Japan’s stance still unknown, gold investors are treading cautiously. If inflation remains sticky due to strong consumer spending and a tight labor market, it would force central banks to maintain or even increase elevated rates, hampering gold’s prospects for a strong rally. Therefore, it is increasingly unlikely that the Fed will loosen its grip on financial conditions this year, keeping gold bulls in check.

Short-Term Outlook

In the short term, the outlook for gold remains uncertain, swaying between bullish and bearish sentiments. The market is keenly awaiting cues from central bank policies, specifically the Fed’s decision due on Wednesday. Given the global focus on inflation and interest rates, gold is caught in a limbo, its fate intricately tied to upcoming central bank pronouncements.

The market’s unease manifests as it navigates through a maze of inflation risks and monetary policy adjustments. For now, gold remains a barometer of global economic anxieties, its path ahead clouded by the decisions that will emerge from this week’s central bank meetings.

Technical Analysis

4-Hour Gold (XAU/USD)The current price of 1930.55 is marginally above both the 200-4H and 50-4H moving averages, indicating a possible positive momentum, albeit slight. The 14-4H RSI of 62.12 suggests that momentum remains on the stronger side, but it hasn’t reached overbought territory.

The current price sits comfortably between the main support area of 1893.07-1885.79 and the main resistance area of 1946.99-1954.88. Although it has decreased slightly from the previous 4-hour price, the commodity remains closer to its resistance level. This, combined with the RSI reading, suggests a mildly bullish market sentiment for Gold in the short term.

Oil Prices Forecast: WTI Nears 10-Month High Amid OPEC Supply Cuts, US Shale Decline

Oil Prices Forecast: WTI Nears 10-Month High Amid OPEC Supply Cuts, US Shale Decline

Oil Prices Surge Amid Shifting Supply and Demand Landscape

Oil prices are riding a bullish wave, marking the fourth straight day of gains. This upswing is propelled by a drop in U.S. shale production and sustained supply cuts by Saudi Arabia and Russia. With both benchmark prices reaching near 10-month highs, market watchers are balancing optimism with caution.

Trading Derivatives carries a high level of risk to your capital and you should only trade with money you can afford to lose. Trading Derivatives may not be suitable for all investors, so please ensure that you fully understand the risks involved, and seek independent advice if necessary. A Product Disclosure Statement (PDS) can be obtained either from this website or on request from our offices and should be considered before entering into a transaction with us. Raw Spread accounts offer spreads from 0.0 pips with a commission charge of USD $3.50 per 100k traded. Standard account offer spreads from 1 pips with no additional commission charges. Spreads on CFD indices start at 0.4 points. The information on this site is not directed at residents in any country or jurisdiction where such distribution or use would be contrary to local law or regulation.

The Supply Equation: U.S. Shale Takes a Dip

At the crux of the supply-side narrative is the projected decline in U.S. shale output to 9.393 million barrels per day by October, the lowest level seen since May 2023. This reduction aligns with Saudi Arabia and Russia’s commitment to extend their combined 1.3 million bpd production cuts through the end of the year, amplifying concerns about a tightened market.

Questioning Long-Term Demand

In a recalibration of expectations, Saudi Aramco CEO Amin Nasser recently revised the company’s long-term demand forecast downward to 110 million bpd by 2030, a significant drop from their previous 125 million bpd estimate. The industry is clearly wrestling with evolving views on long-term oil consumption.

Contradictory Views on Peak Oil Demand

Notwithstanding gloomy forecasts that suggest oil demand will plateau, industry leaders are pushing a more bullish narrative. Highlighting the resilience of the market, Nasser stated that talk of peak oil demand tends to wilt under scrutiny. Adding to the optimism, OPEC predicts demand growth to reach 102.1 million bpd this year, a more upbeat forecast compared to the International Energy Agency’s conservative projections.

Short-Term Forecast: Bullish but Guarded

Driven by immediate supply concerns, the short-term outlook for oil is cautiously bullish. However, investors should keep their guard up. Volatility looms large, particularly as demand forecasts shift and geopolitical dynamics evolve.

In sum, the oil market finds itself at a crossroads, influenced by a complex web of supply concerns, evolving long-term demand estimates, and differing opinions on peak oil demand.

Technical Analysis

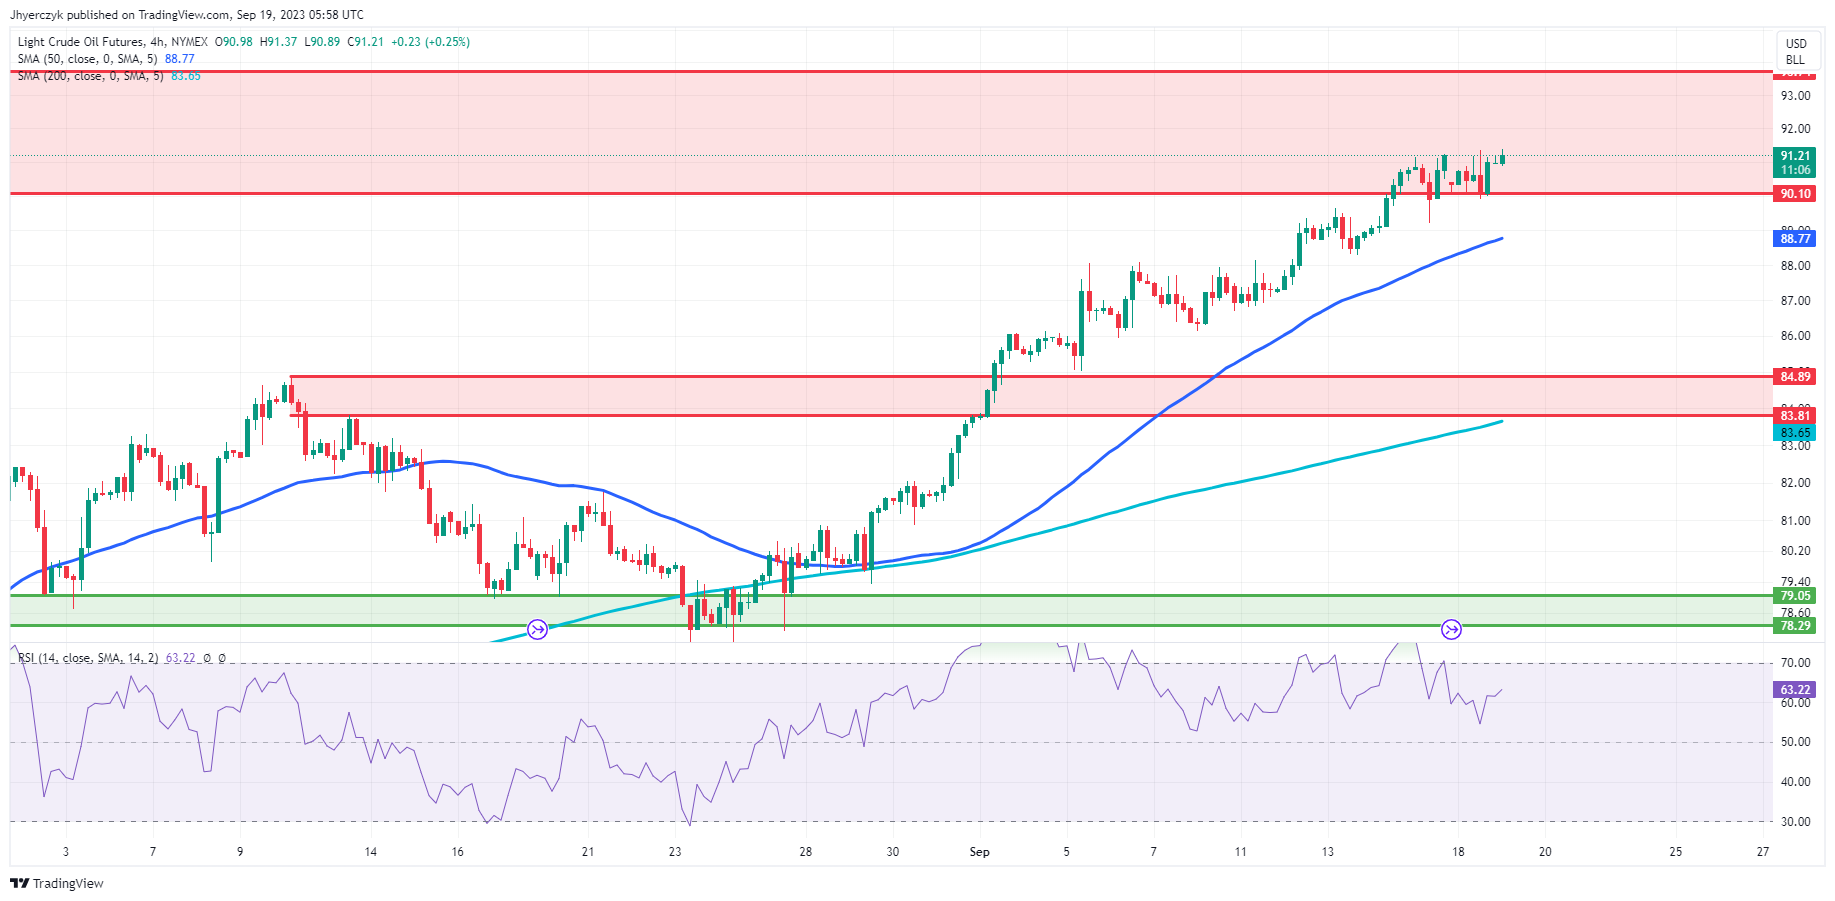
4-Hour Light Crude Oil FuturesGiven the current 4-hour price of Light Crude Oil Futures at $91.20, it’s evident that the market is trading above both the 200-4H moving average of $83.65 and the 50-4H moving average of $88.77. This positioning suggests bullish momentum in the short term. The 14-4H RSI reading of 63.15 indicates strengthening momentum and approaches the overbought territory.

Additionally, the price is well above the main support area of $84.89-$83.81, while testing the main resistance range of $90.10-$93.74. Based on these indicators, the current sentiment for Light Crude Oil Futures in the 4-hour timeframe appears bullish.

Gold Price Outlook: XAU/USD Flirts Breakout as Retail Traders Turn More Bearish

Gold Price Outlook: XAU/USD Flirts Breakout as Retail Traders Turn More Bearish

Gold prices have rallied for a couple of trading sessions and retail traders have responded by increasing their downside exposure. This can be seen by looking at IG Client Sentiment (IGCS), which often functions as a contrarian indicator. With that in mind, will an increasing shift in retail exposure offer a warm welcome for the yellow metal?

Gold Sentiment Outlook – Bullish

The IGCS gauge shows that about 70% of retail traders are net-long gold. Since the majority of them are biased to the upside, this still could spell trouble for gold down the road. That said, downside exposure has increased by 9.49% and 3.59% compared to yesterday and last week, respectively. With that in mind, recent changes in exposure hint that the price trend may soon reverse higher.

XAU/USD Daily Chart

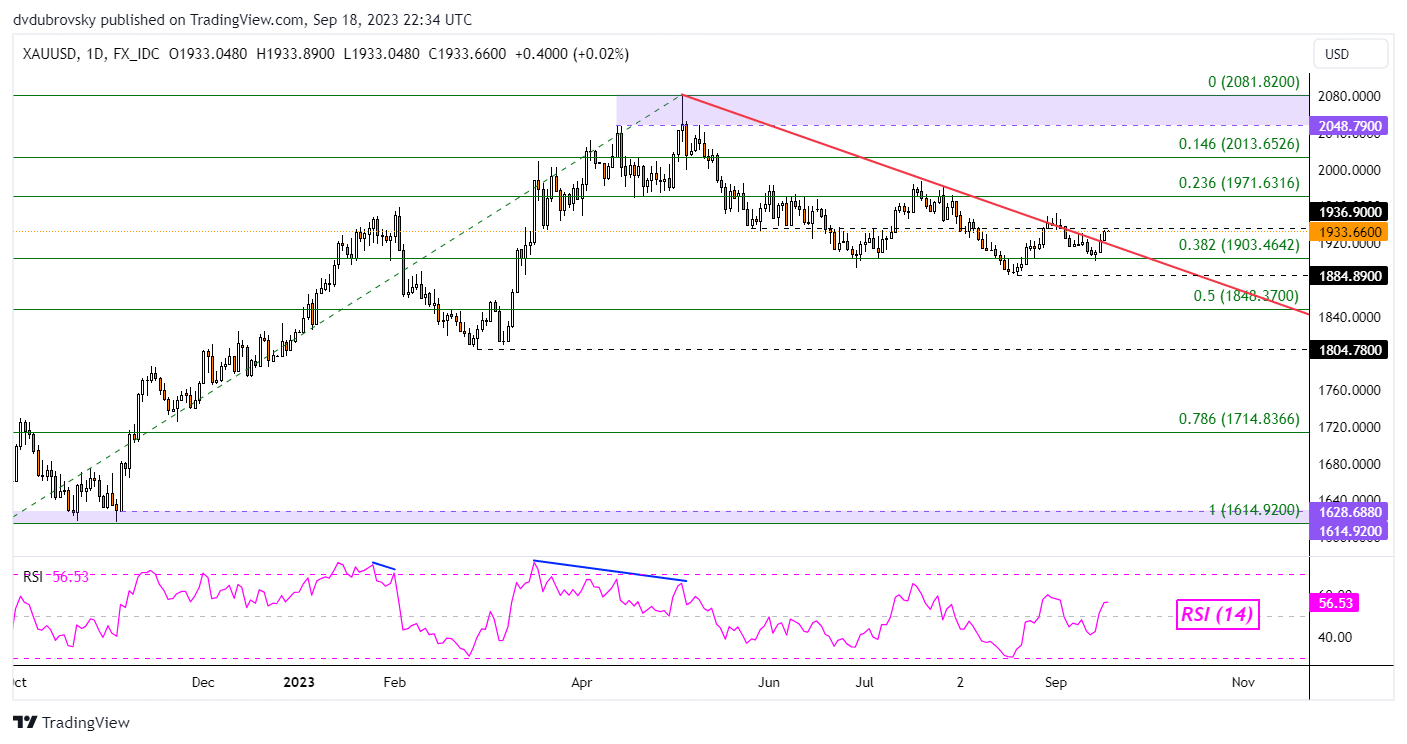
On the daily chart, recent gains have pushed gold prices to flirt confirming a breakout above the falling trendline from May. Immediate resistance is the 1936.90 inflection point. A push above that exposes the 23.6% Fibonacci retracement level of 1971.63, opening the door to an increasingly bullish technical bias.

Otherwise, a false breakout places the focus back on the 38.2% point around 1903.46 before exposing the August swing low of 1884.37. Confirming a breakout under the latter opens the door to extending the downtrend since May.

 image2.png


Asia Day Ahead: Wait-and-See in Lead-Up to Fed’s Decision, RBA Minutes in Focus

Asia Day Ahead: Wait-and-See in Lead-Up to Fed’s Decision, RBA Minutes in Focus

Market sentiments remained in its usual wait-and-see ahead of the Federal Open Market Committee (FOMC) meeting this week, as the VIX headed higher for the second straight day to reflect increased hedging activities while major US indices ended the day flat.

On the other hand, US Treasury yields continued to hover around their multi-year highs, with expectations seemingly leaning towards a potential ‘hawkish pause’ scenario from the Federal Reserve (Fed). This is where the central bank keeps rates on hold at the upcoming meeting, but leaves the door open for one more rate hike by the end of this year as per its previous dot plot. Some pushback against recession risks by policymakers lately may support an upward revision in growth forecasts, but with soft landing hopes having to face off against a potential hawkish recalibration in rate expectations.

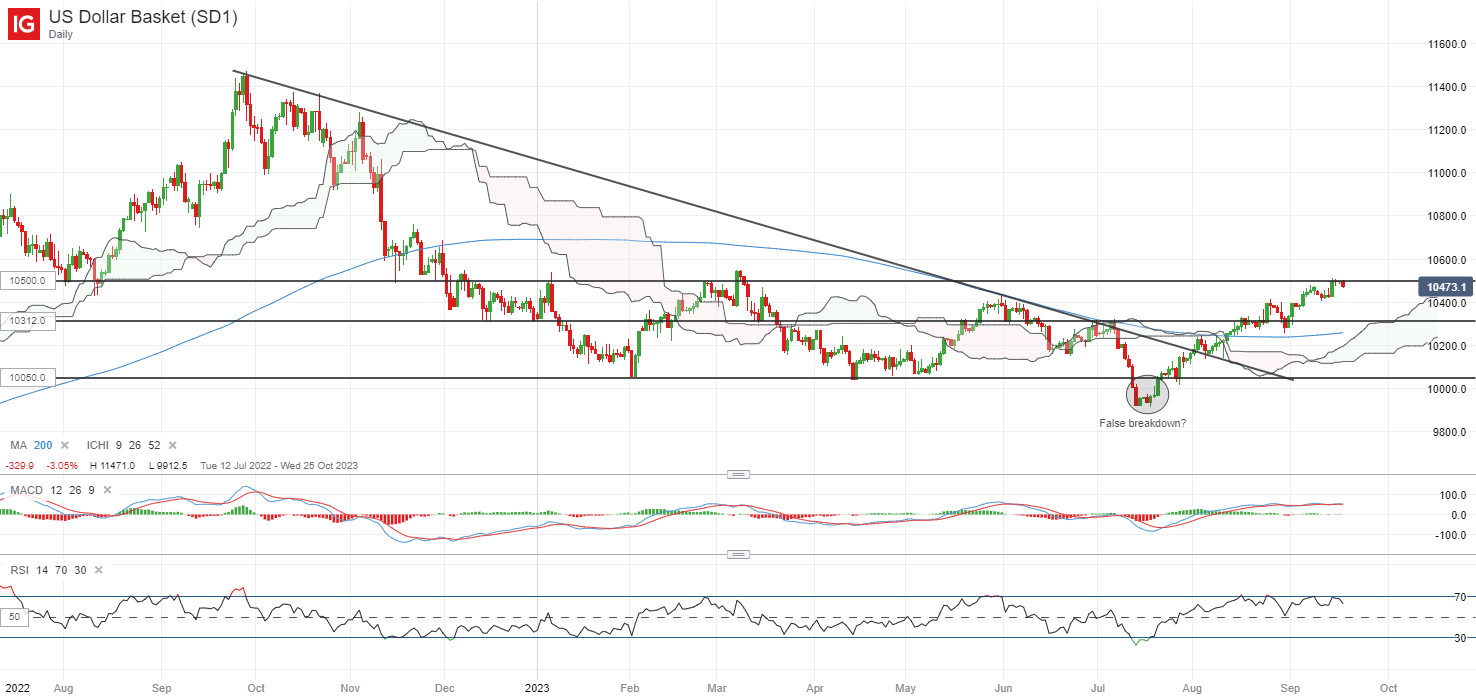
The US dollar continues to trade above its 200-day MA, with the formation of higher highs and higher lows since July this year, as market participants get more accustomed to a high-for-longer rate outlook. That said, the US dollar index is now back to retest a key resistance at the 105.00-105.60 range, which marks its year-to-date high.

Any successful move above this range may support a breakout of its months-long ranging pattern since December 2022, but a potential bearish divergence on Relative Strength Index (RSI) points to some near-term exhaustion for now. CFTC data revealed that the aggregate net-short positioning for US dollar against other G10 currencies is at its lowest in three months, with any reversal into net-long positioning likely to support further upward bias based on historical instances.

image1.png

Asia Open

Asian stocks look set for a downbeat open, with Nikkei -0.76%, ASX -0.32% and KOSPI +0.16% at the time of writing, as Japan markets return from its holiday break. Chinese equities remain in a mixed state yesterday, attempting to weigh between recent improvement in economic data and lingering default risks from Country Garden, which suggests that the property sector risks will likely drag for longer.

The Reserve Bank of Australia (RBA) meeting minutes will be in focus today. With the central bank keeping rates on hold for the third straight month at its September meeting, expectations are largely priced for the trend to continue through the rest of the year, with any confirmation to be sought from the upcoming minutes. At its previous meeting, the central bank retained its tightening bias, but also acknowledged growing economic risks from China and recent slowdown in inflation data, which seem to leave room for more wait-and-see for now.

The AUD/NZD may be on watch, having been trading within an ascending triangle pattern since July this year, with the 1.092 level serving as an immediate resistance to overcome for buyers. Its daily RSI has been attempting to defend the key 50 level since August this year as well, which leaves buyers in some control for now. On the downside, the upward trendline support may be crucial to hold, failing which could pave the way to retest its July/August 2023 lows at the 1.073 level next.

image2.png

On the watchlist: Silver prices attempting a bounce-off support confluence

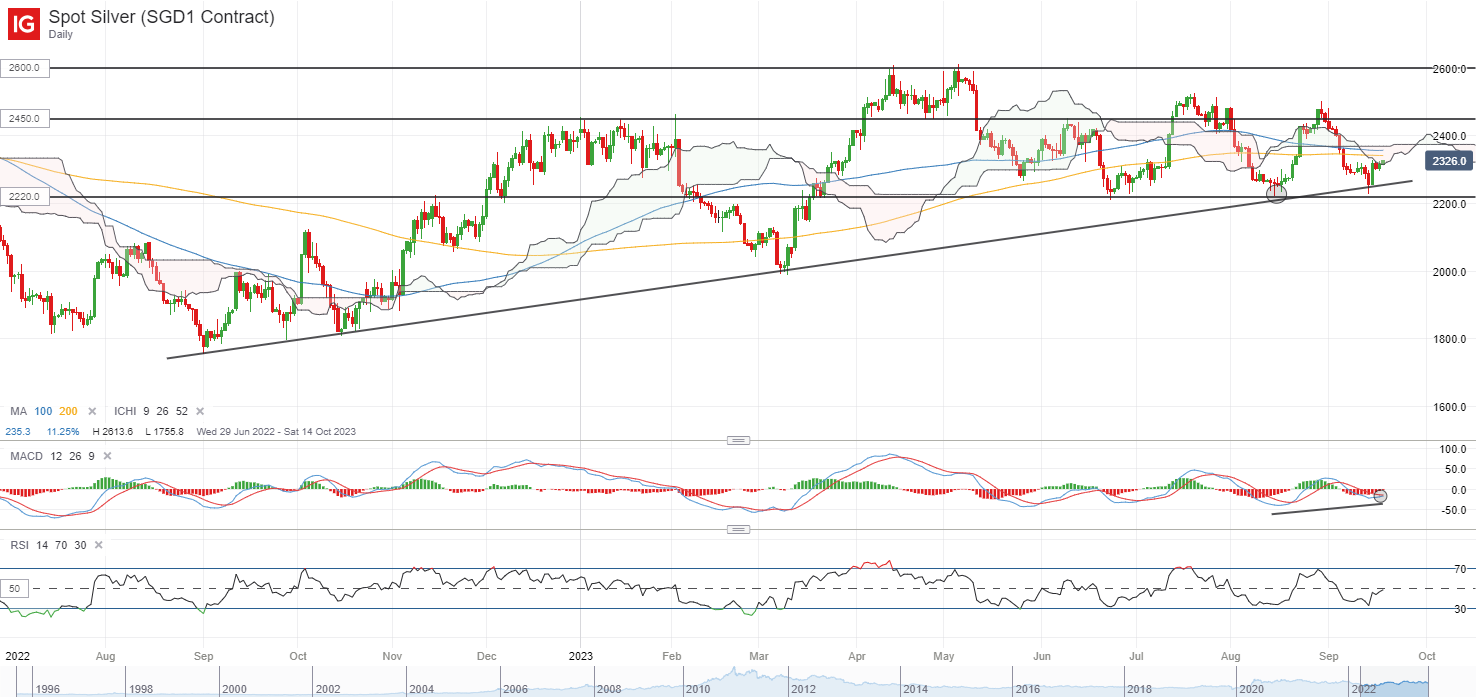
Silver prices have been attempting to hold up lately amid higher Treasury yields and US dollar strength, as buyers managed to defend the US$22.30 level, where an upward trendline support is in place since September 2022. Higher lows on Moving Average Convergence/Divergence (MACD) on the daily chart may point to some upward momentum in the near term, as prices may potentially eye for a retest of the US$24.50 level, where the upper edge of its ranging pattern resides.

On the weekly chart, a bullish pin bar formation was formed last week, with any positive follow-through on watch this week. Further upside may also validate a bullish crossover on daily MACD, which may potentially draw some technical buyers.

image3.png

Australian Dollar Ponders Path Ahead After RBA Minutes. Will AUD/USD Breakout?

Australian Dollar Ponders Path Ahead After RBA Minutes. Will AUD/USD Breakout?

The Australian Dollar’s grip above 64 cents is intact after the RBA’s meeting minutes were published today.

The notes expanded on the commentary in the monetary policy statement that was released at the time of the rate decision on September 5th.

The RBA left rates on hold at 4.10% at the meeting and the interest rate market is ascribing only a low probability of any further hikes in this cycle.

It appears that the third quarter CPI, due to be released on October 25th, is the crucial data point that might shift the needle on the RBA’s thinking around monetary policy.

The RBA has hiked by 400 basis points (bps) since the pandemic lows near zero, while the Federal Reserve has hiked by 525 bps.

Today’s publication of the RBA board’s perspective noted, “The members considered two options for monetary policy at this meeting: raising the cash rate target by a further 25 basis points; or holding the cash rate target steady.”

They went on to say, “In weighing up the two options, members agreed that the case to keep the cash rate target unchanged at this meeting was the stronger one.”

Overall, the two main competing factors appear to be the concern for the economic outlook for China being weighed against persistently high domestic inflation.

At the time of the monetary policy decision the accompanying statement cited risks around services inflation, the uncertainty around the laggard effects of tighter policy, household consumption and the economic outlook for China given the problems in its property sector.

All of these themes received further attention in the minutes.

Consistent with today’s release, the statement from the meeting noted, “Some further tightening of monetary policy may be required to ensure that inflation returns to target in a reasonable timeframe, but that will continue to depend upon the data and the evolving assessment of risks.”

The meeting was Governor Philip Lowe’s last as leader and he handed the baton over to Michelle Bullock this week.

Ms Bullock has been the Deputy Governor of the bank since April 2022 and has been with the institution since 1985. She has a reputation as a leading economist in her own right.

The appointment is mostly viewed as a steady transfer of leadership. Her recent remarks point toward a similar approach to that of her predecessors.

Interest rate markets see only a small chance of further tightening in this cycle from the RBA and the Fed.

Adjustments in the disparity of monetary policy between the central banks might be a driver for the Aussie going forward. For more information on how to trade AUD/USD, click on the banner below.

AUD/USD TECHNICAL ANALYSIS RECAP

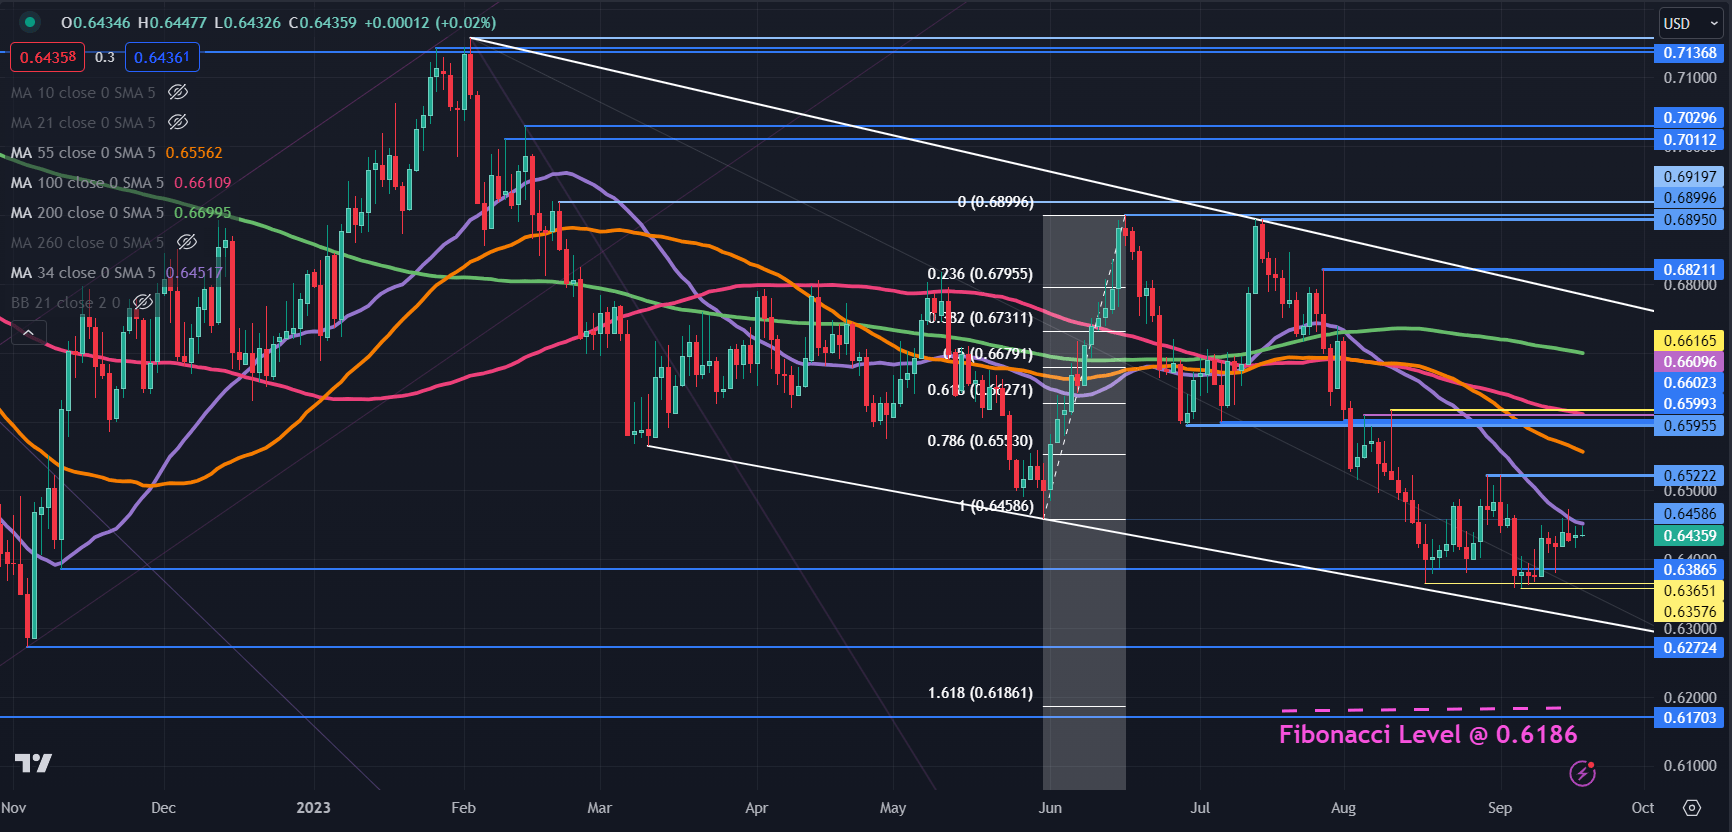
AUD/USD remains in a shorter-term descending trend channel after rallying last week to retreat back into the recent range. The price has been trading between 0.6358 and 0.6522 for six weeks.

The Aussie remains below the 34-, 55- and 100-day Simple Moving Averages (SMA) and they have negative gradients, which may suggest that bearish momentum is intact for now.

Resistance could be at the recent high near 0.6520. Further up, the 0.6600 – 0.6620 area might be a notable resistance zone with several breakpoints and prior peaks there, as well as the 100-day SMA.

On the downside, support may lie at the breakpoints and previous lows near 0.6360, 0.6270 and 0.6170.

The latter might also be supported at 161.8% Fibonacci Extension level at 0.6186. To learn more about Fibonacci techniques, click on the banner below.

AUD/USD DAILY CHART

image1.png


Crude Oil Price Claims the High Ground as Market Scrambles. Higher WTI?

Crude Oil Price Claims the High Ground as Market Scrambles. Higher WTI?

Crude oil made another 10-month high overnight despite some reservations about the outlook for China’s economy and central banks’ tight monetary policy. Nonetheless, the underlying market structure appears intact for now.

The Brent futures contract touched US$ 94.95 bbl and the WTI contract hit US$ 91.36 bbl.

Yesterday at the 24th World Petroleum Congress in Calgary, Canada, Saudi Energy Minister Prince Abdulaziz bin Salman expressed reservations when speaking about China’s demand going forward. He said, “The jury’s still out. This is the fundamental issue – the jury’s still out.”

The world’s second-largest economy has been struggling to reignite growth coming out of the pandemic era.

Recently, the Saudi Arabian national oil company Aramco and the US International Energy Agency (IEA) lowered their forecasts for global oil demand.

The backdrop to the current price action has been the tightening of many of the major central banks’ monetary policy to rein in high inflation. The concern is that global growth will need to slow to a point that could see oil demand undermined down the track.

Last week the European Central Bank (ECB) hiked its target rate again by 25 basis points (bp) to 4.00% and lowered its economic growth outlook.

The Federal Reserve meets tomorrow but is anticipated to keep rates on hold at this meeting, as is the Bank of Japan on Friday.

On Wednesday however, the Bank of England is forecast to lift its cash rate by 25 bp to 5.50%. To learn about the impact of central banks on markets, click on the banner below.

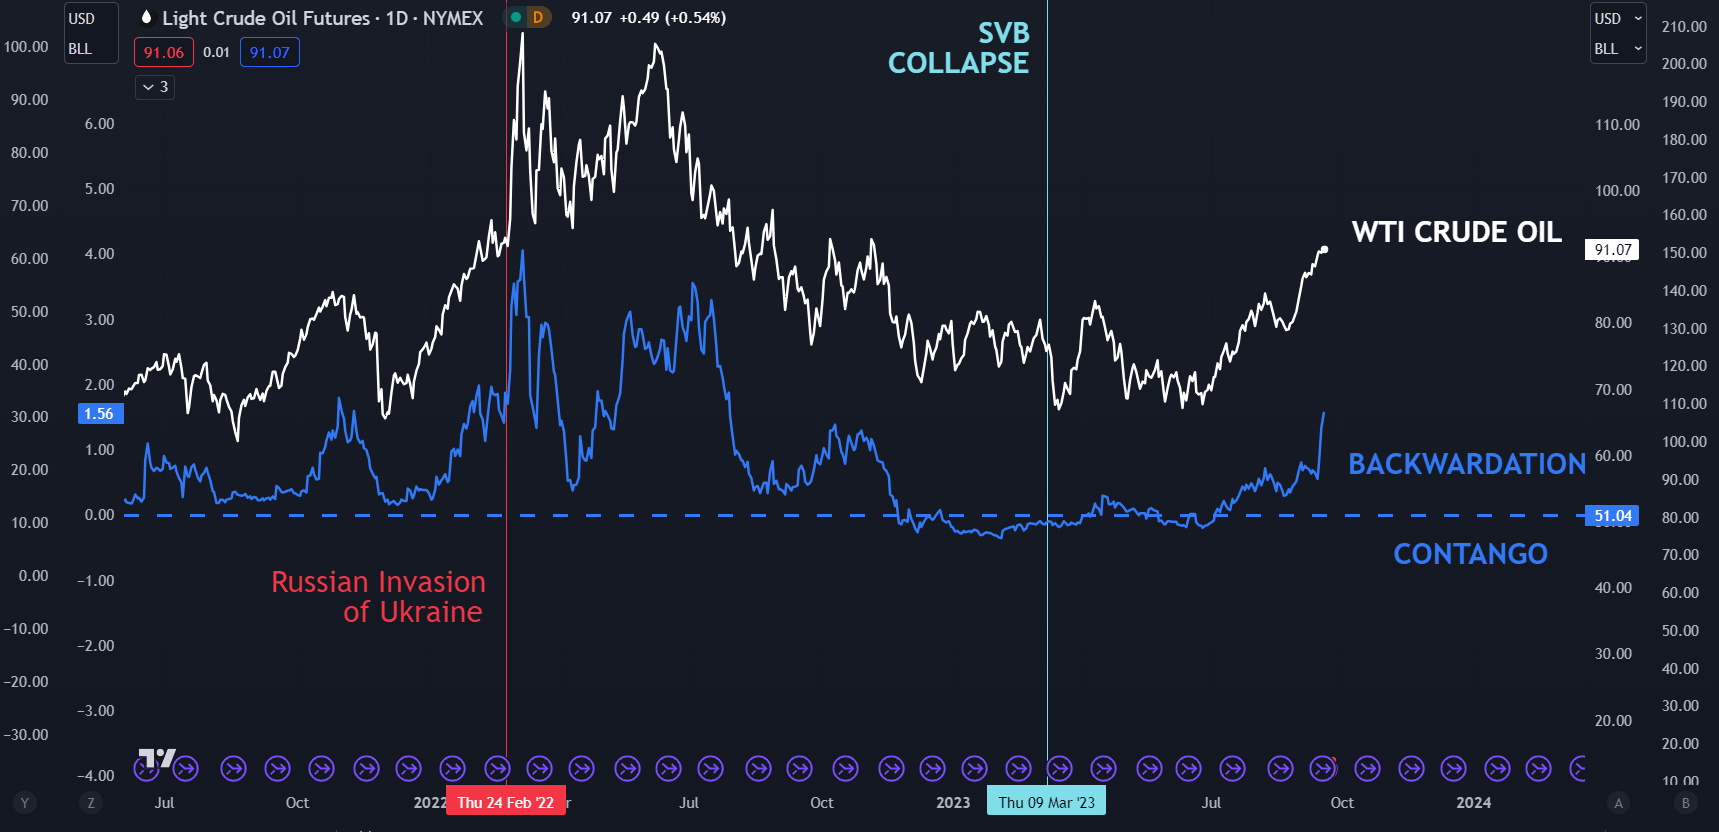
Despite all this, crude oil continues to surge higher. An indication of underlying supply and demand dynamics within the oil market is backwardation and contango.

Backwardation occurs when the futures contract closest to settlement is more expensive than the contract that is settling after the first one. It highlights a willingness by the market to pay more to have immediate delivery, rather than having to wait.

Sometimes referred to as a ‘time-spread’ between futures contracts with different expiry dates by traders.

Which particular contracts to look at is a personal preference, but looking at the front two contracts, backwardation has accelerated of late. If this remains the case, it might be revealing that demand remains robust, despite the higher prices.

Stockpile data from the American Petroleum Institute (API) later today and the EIA tomorrow might give further clues on the state of the balance of supply and demand in the market.

WTI CRUDE OIL AND BACKWARDATION

image1.png


Euro Could Be Due for a Minor Bounce: EUR/USD, EUR/JPY, EUR/GBP, Price Setups

Euro Could Be Due for a Minor Bounce: EUR/USD, EUR/JPY, EUR/GBP, Price Setups

The euro looks deeply oversold and could be set to recoup some of the recent losses against some of its peers ahead of the US Federal Reserve’s interest rate decision. How sustainable the bounce turns out to be remains a question.

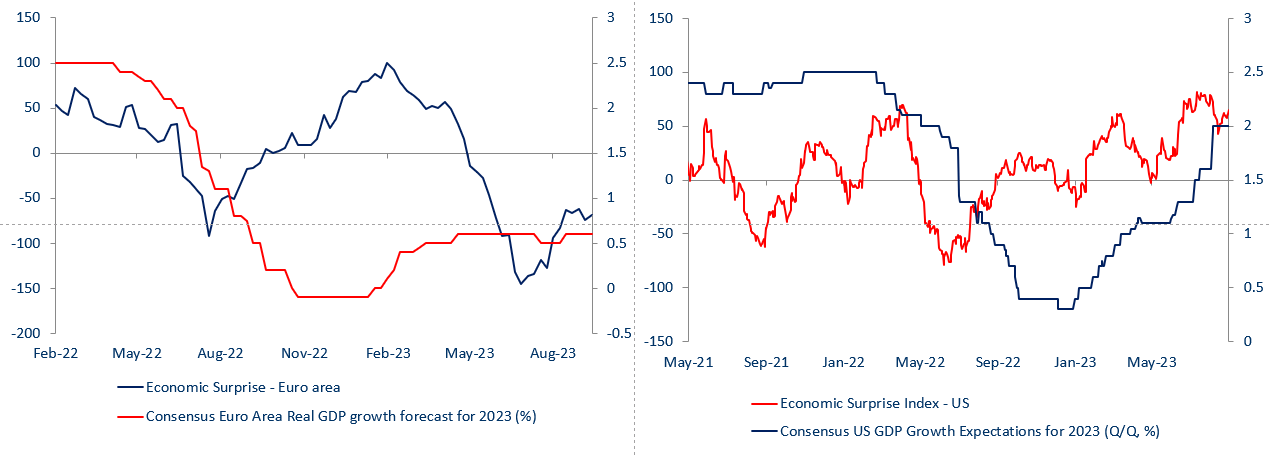
Hawkish comments from several ECB officials are supporting the single currency for now and a potential skip by the Fed could provide the much-needed boost. EUR came under pressure last week after the ECB raised interest rates but indicated that policy rates are peaking. Money markets are currently pricing in around a 25% chance of one more ECB rate hike by the year-end.

Economic Surprise Index – Euro Area and US

image1.png

Meanwhile, the US central bank is widely expected to keep the federal funds rate steady this week, while Powell is likely to be balanced in his assessment, emphasizing data-dependency about the near-term path of policy. The key focus will be on the Summary of Economic Projections (SEP) which will be released along with the September FOMC statement. In particular, the 2023 and 2024 median policy rates. For more details, see “How Will the US Dollar React to Fed Rate Decision Next Week?” published September 15.

Having said that, for any bounce to be sustainable, the economic growth outlook for the Euro area needs to improve. The outperformance of US growth has been supporting the greenback globally as monetary policy outlooks converge.

EUR/USD Weekly Chart

image2.png

EUR/USD: At major support

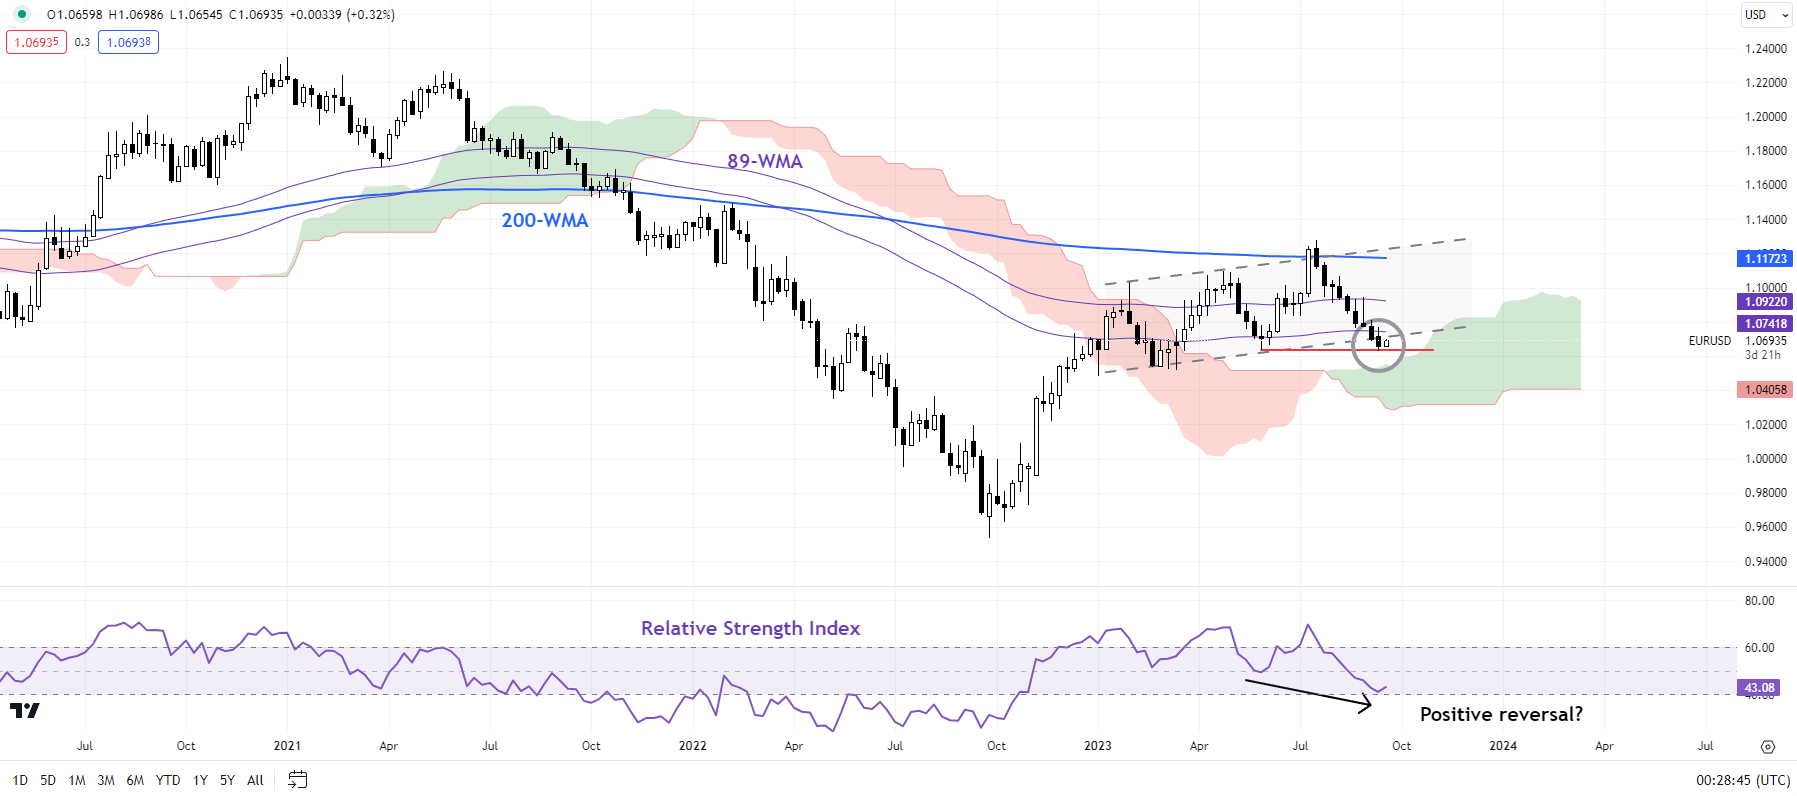
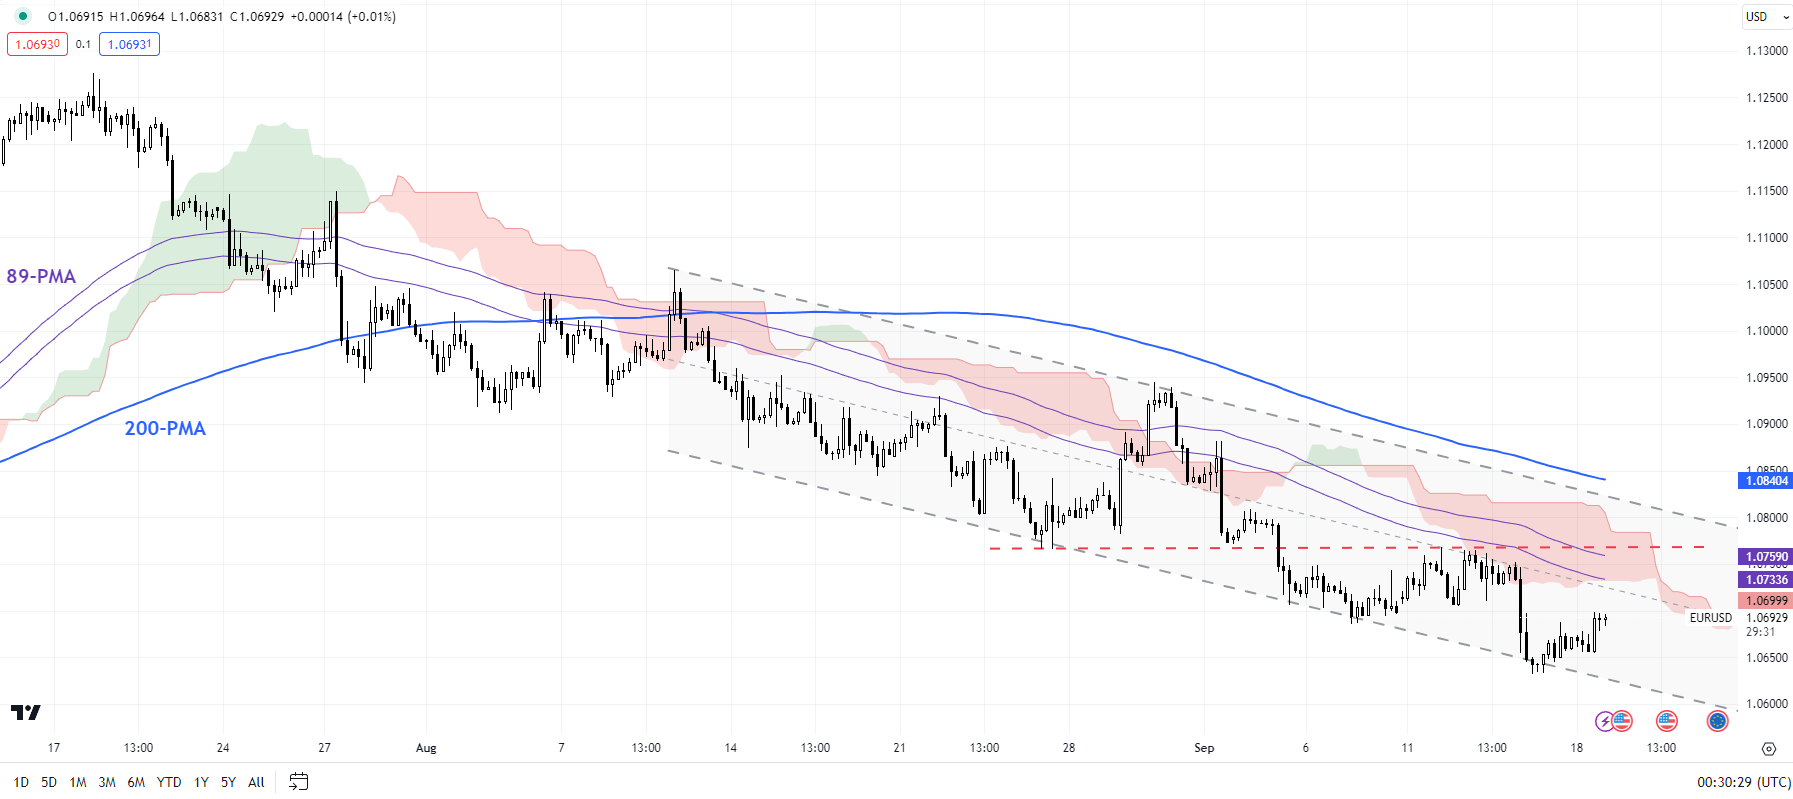
On technical charts, EUR/USD is testing a major cushion at the June low of 1.0633. Back-to-back weeks of decline, oversold conditions, and a positive reversal on the weekly charts raise the odds of a short-term bounce. This support is strong and is unlikely to break cleanly, at least in the first attempt.

EUR/USD 240-Minute Chart

image3.png

Having said that, the pair lacks upward momentum. On the 240-minute charts, a break above the initial barrier at last week’s high of 1.0770 is needed for the immediate downside risks to fade. A break above the August high of 1.0945 would be even more significant raising the odds that the two-month-long downtrend was over. For more discussion, see “Euro’s Downside Cushioned Ahead of Euro Area CPI, US PCE: EUR/USD, EUR/GBP Action,” published August 30.

EUR/GBP Daily Chart

image4.png

EUR/GBP: Flexes muscles

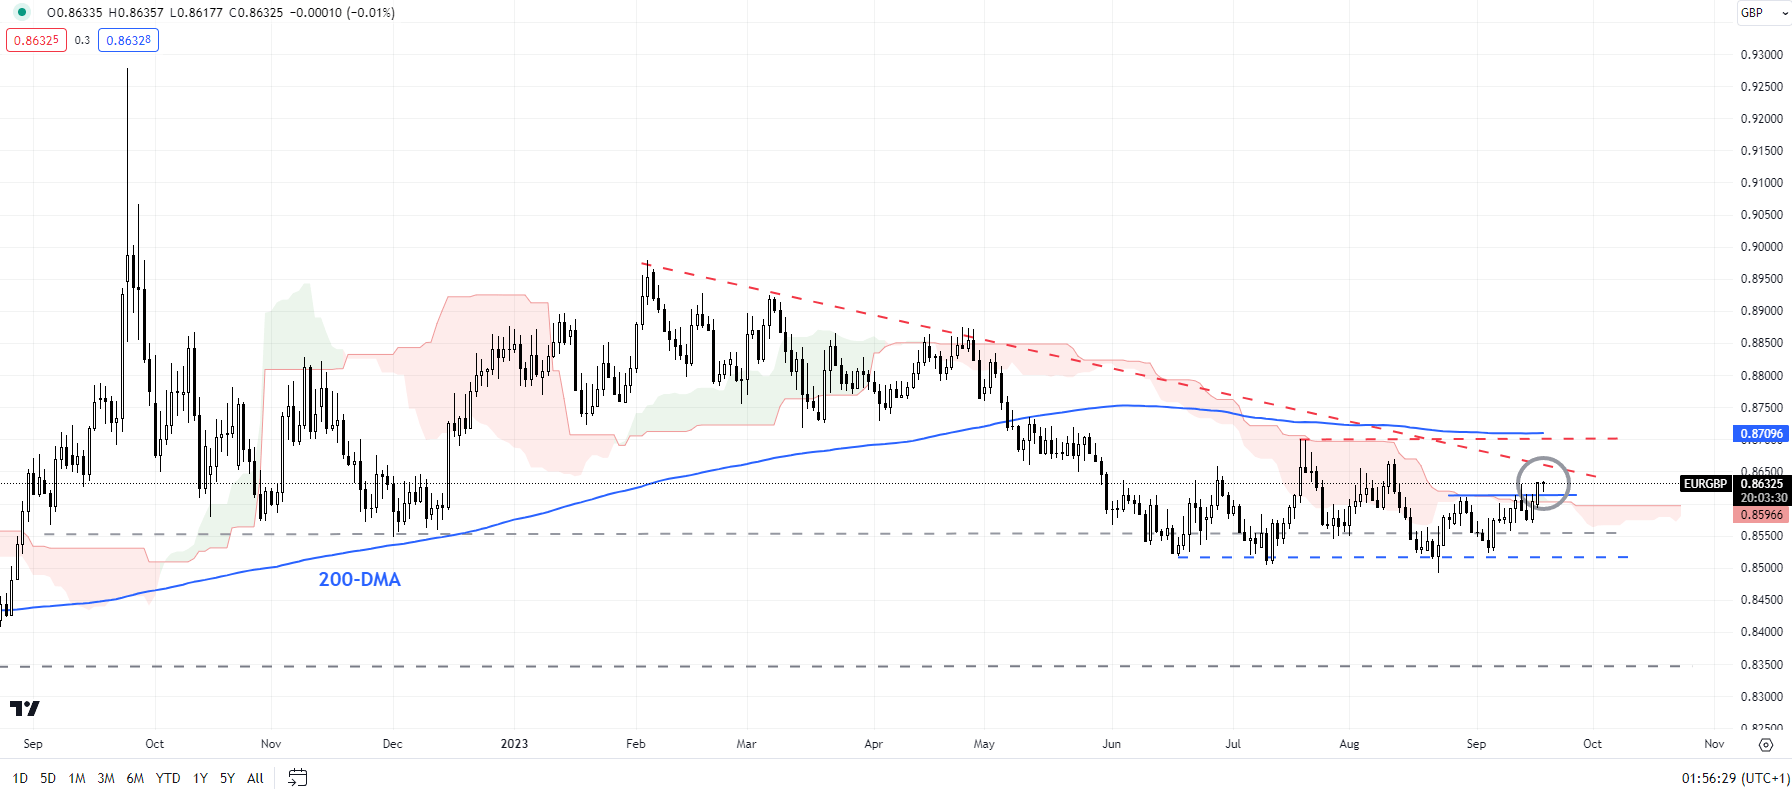
EUR/GBP appears to be flexing muscles as it tries to break above minor resistance at the August high of 0.8610. While important, a break above the July high of 0.8700 and coinciding with the 200-day moving average would be far more significant. Such a break could pave the way toward the April high of 0.8875.

EUR/JPY 240-Minute Chart

image5.png

EUR/JPY: Looks heavy

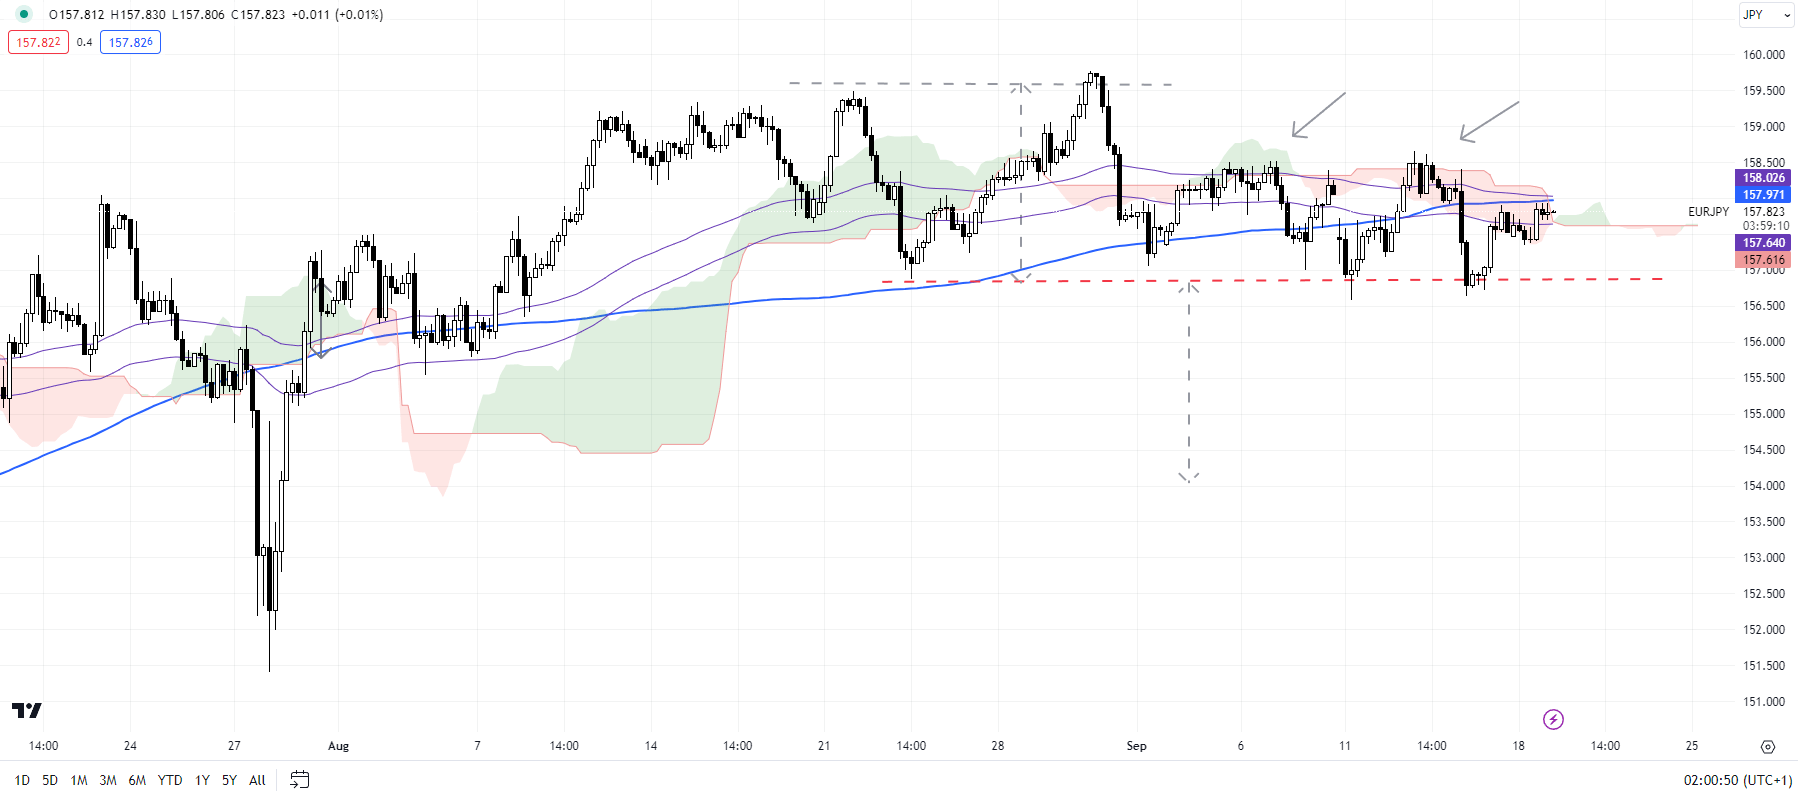
EUR/JPY is testing quite strong horizontal trendline support from August (at about 156.85-157.00). As highlighted in the previous update, any break below would trigger a double top (the August highs), with a potential price objective of around 154.00. See “Japanese Yen’s Slide Pauses but for How Long? USD/JPY, EUR/JPY, MXN/JPY Price Setups,” published September 4. Having said that, any retreat is unlikely to pose a threat to the broader EUR/JPY uptrend while the cross holds above the July low of 151.50.

British Pound Technical Update: GBP/USD, EUR/GBP Show that Sterling Remains Pressured

British Pound Technical Update: GBP/USD, EUR/GBP Show that Sterling Remains Pressured

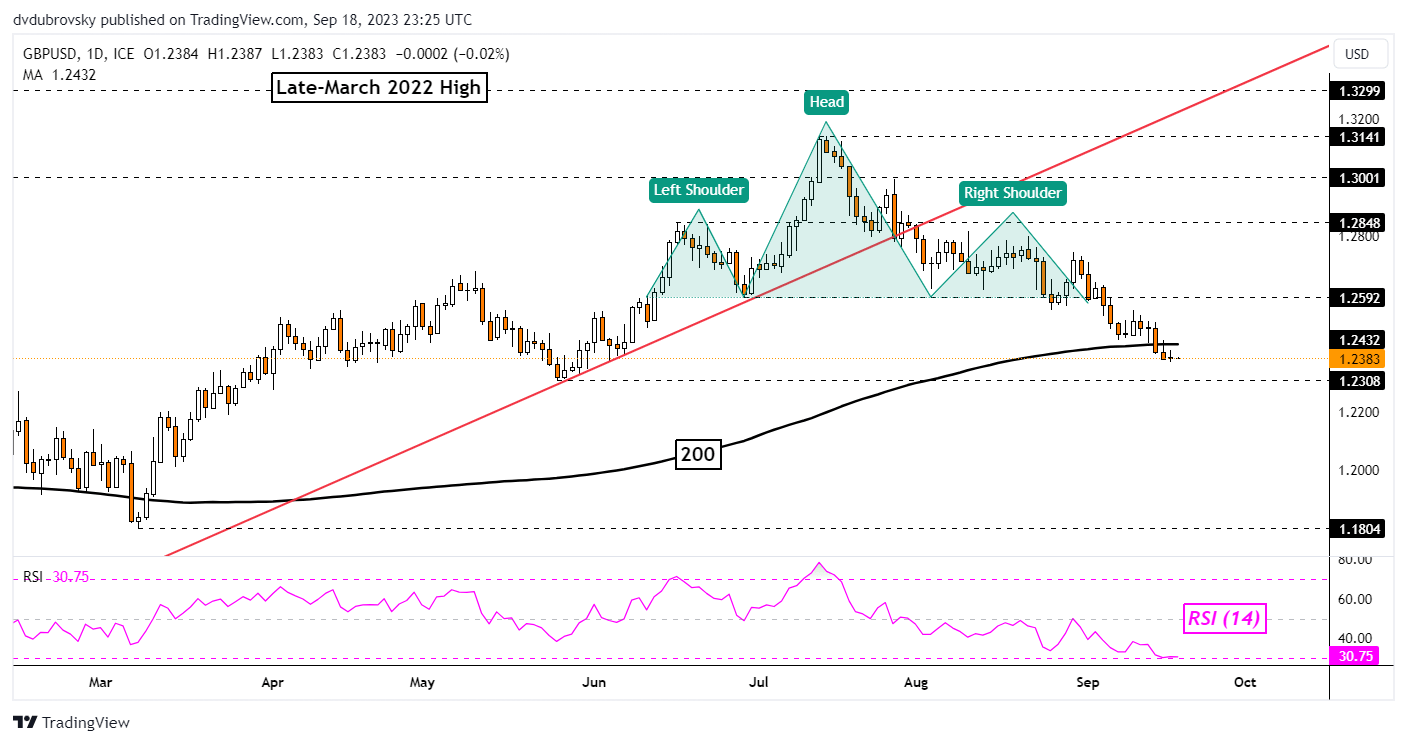
The British Pound may be readying to extend its losing streak against the US Dollar. For context, GBP/USD has been aiming lower since breaking under a bearish Head & Shoulders chart formation, opening the door to an increasingly downward technical bias. Now, prices have confirmed a breakout under the 200-day Moving Average.

That is further underscoring the bearish GBP/USD view, placing the focus on immediate support which is now the May low of 1.2308. This will likely be the next key test. Pushing lower underscores, the near-term bearish bias. Otherwise, a turn higher places the focus back on the neckline of the Head & Shoulders, which is around 1.2592.

image1.png

Chart Created in TradingView

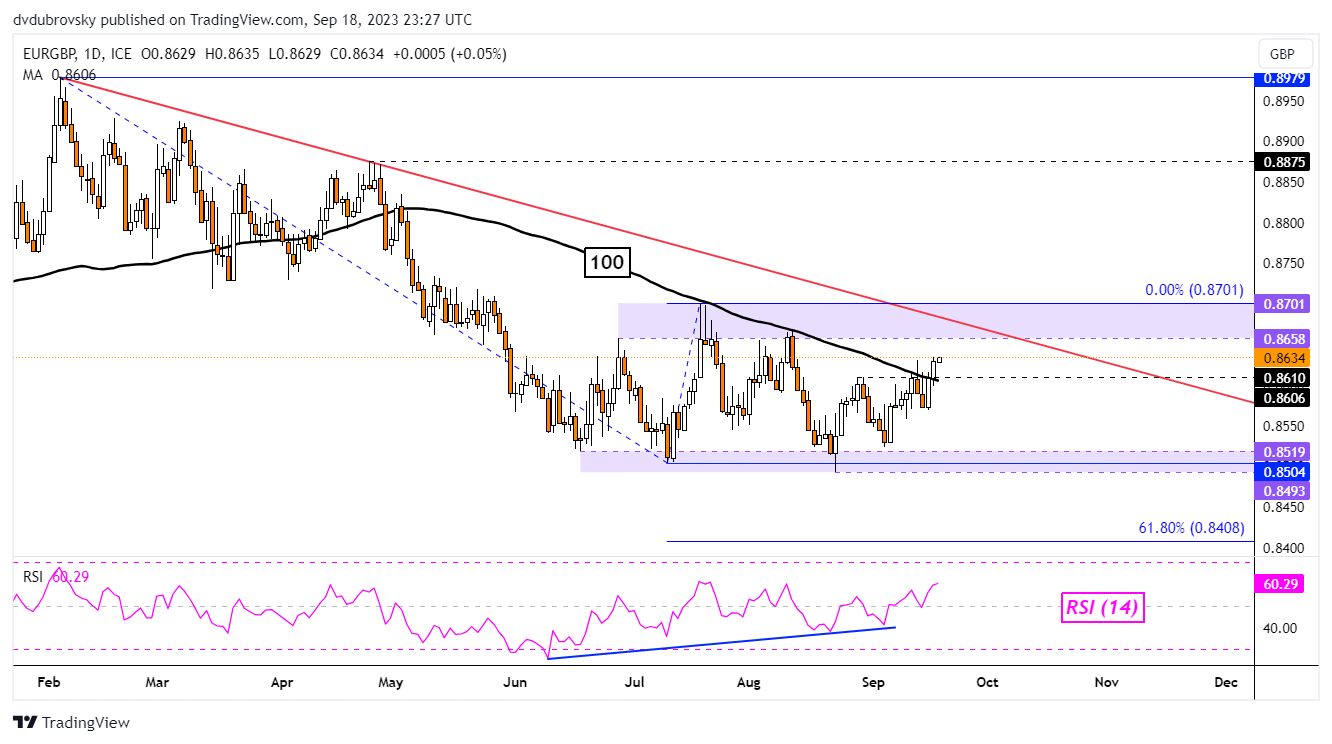
Meanwhile, the British Pound is also losing ground to the Euro. On the daily chart below, EUR/GBP is attempting to confirm a breakout above the 0.861 inflection point and the 100-day Moving Average. While this could open the door to a stronger bullish technical bias for the exchange rate, the broader horizon remains neutral.

EUR/GBP remains in a consolidative setting between resistance (0.8658 – 0.8701) and support (0.8493 – 0.8519). Recent progress does open the door to revisiting the former, as well as the broader falling trendline from February. These could hold as resistance. As such, there is more work for EUR/GBP to do before shifting to a stronger bullish technical bias.

The Fundamentals of Breakout Trading

The Fundamentals of Breakout Trading
Recommended by Daniel Dubrovsky
The Fundamentals of Breakout Trading
Get My Guide

image2.png

Chart Created in TradingView