DAX Index: The US Labor Market to Take Center Stage Pre-Fed

DAX Index: The US Labor Market to Take Center Stage Pre-Fed

DAX Tuesday Overview

The DAX rose by 0.64% on Tuesday. Following a 0.20% gain on Monday, the DAX ended the day at 14,810.

German Retail Sales and Eurozone GDP Disappoint

German retail sales figures unexpectedly declined in September, fueling bets on a prolonged economic recession. GDP figures from France and for the Eurozone also disappointed.

Trading Derivatives carries a high level of risk to your capital and you should only trade with money you can afford to lose. Trading Derivatives may not be suitable for all investors, so please ensure that you fully understand the risks involved, and seek independent advice if necessary. A Product Disclosure Statement (PDS) can be obtained either from this website or on request from our offices and should be considered before entering into a transaction with us. Raw Spread accounts offer spreads from 0.0 pips with a commission charge of USD $3.50 per 100k traded. Standard account offer spreads from 1 pips with no additional commission charges. Spreads on CFD indices start at 0.4 points. The information on this site is not directed at residents in any country or jurisdiction where such distribution or use would be contrary to local law or regulation.

However, corporate earnings countered the disappointing economic indicators. BASF rallied despite a fall in Q3 core earnings and a downgrade to its full-year outlook. Investors showed relief on fears of worse results and a more significant downgrade to the outlook. Qiagen also contributed with better-than-forecasted earnings and revenues.

US economic indicators failed to send the DAX into negative territory despite inflationary signals. Market bets on the Fed holding interest rates unchanged at 5.5% on Wednesday supported riskier assets.

On Tuesday, the Dow rose by 0.38%. The Nasdaq Composite Index and the S&P 500 gained 0.48% and 0.65%.

The Tuesday Market Movers

BASF and Qiagen ended the session with gains of 5.31% and 4.45%, respectively. Siemens AG and Siemens Healthineers were also front-runners, rising by 1.02% and 1.20%. Restructuring plans for Siemens Energy offered support. However, Siemens Energy AG declined by 0.78% on plans to sell some of its stake in Siemens Ltd, an Indian-listed company.

The auto sector had a mixed session. Mercedes Benz Group fell further following the disappointing earnings results. Mercedes Benz Group declined by 0.27%, with BMW falling by 0.09%. However, Porsche and Volkswagen saw gains of 0.48% and 0.70%, while Daimler Truck Holding ended the day flat.

Focus Shifts to the Federal Reserve

On Wednesday, the US labor market will be in focus ahead of the Fed interest rate decision. ADP employment change and JOLTs Job Openings will garner investor interest. Better-than-expected figures could fuel inflationary jitters after the numbers from Tuesday.

Economists forecast the ADP to report a 150k increase in employment. However, economists expect JOLTs Job Openings to fall from 9.61 million to 9.25 million.

The numbers are out before the Fed interest rate decision and press conference. Market bets on the Fed holding interest rates unchanged could continue supporting riskier assets.

There are no economic indicators from the euro area to influence investor sentiment.

Beyond the economic calendar, the US earnings calendar also needs consideration. CVS Health Corp. (CVS), The Estee Lauder Companies Inc. (EL), and Kraft Heinz Co. (KHC) are among the big names releasing earnings results.

The futures markets point to a mixed start to the Wednesday session. The DAX gained 48 points, while the Nasdaq mini fell by 21 points.

Short-Term Forecast

Near-term trends depend on the Fed’s interest rate decision. A hawkish Fed could affect DAX-listed stock buyer appetite amid a worsening macroeconomic environment.

DAX Technical Indicators

Daily Chart

The DAX sat below the 50-day and 200-day EMAs, sending bearish price signals.

A DAX break above the 14,957 resistance level would support a return to 15,000. Bets on the Fed holding interest rates at 5.5% and Fed caution ahead would drive demand for riskier assets.

However, better-than-expected US labor market figures could test sentiment toward Fed monetary policy.

A break below the 14,575 support level would support a move toward the 14,200 support level.

The 14-day RSI reading of 37.56 suggests DAX fall to the 14,575 support level before entering oversold territory.
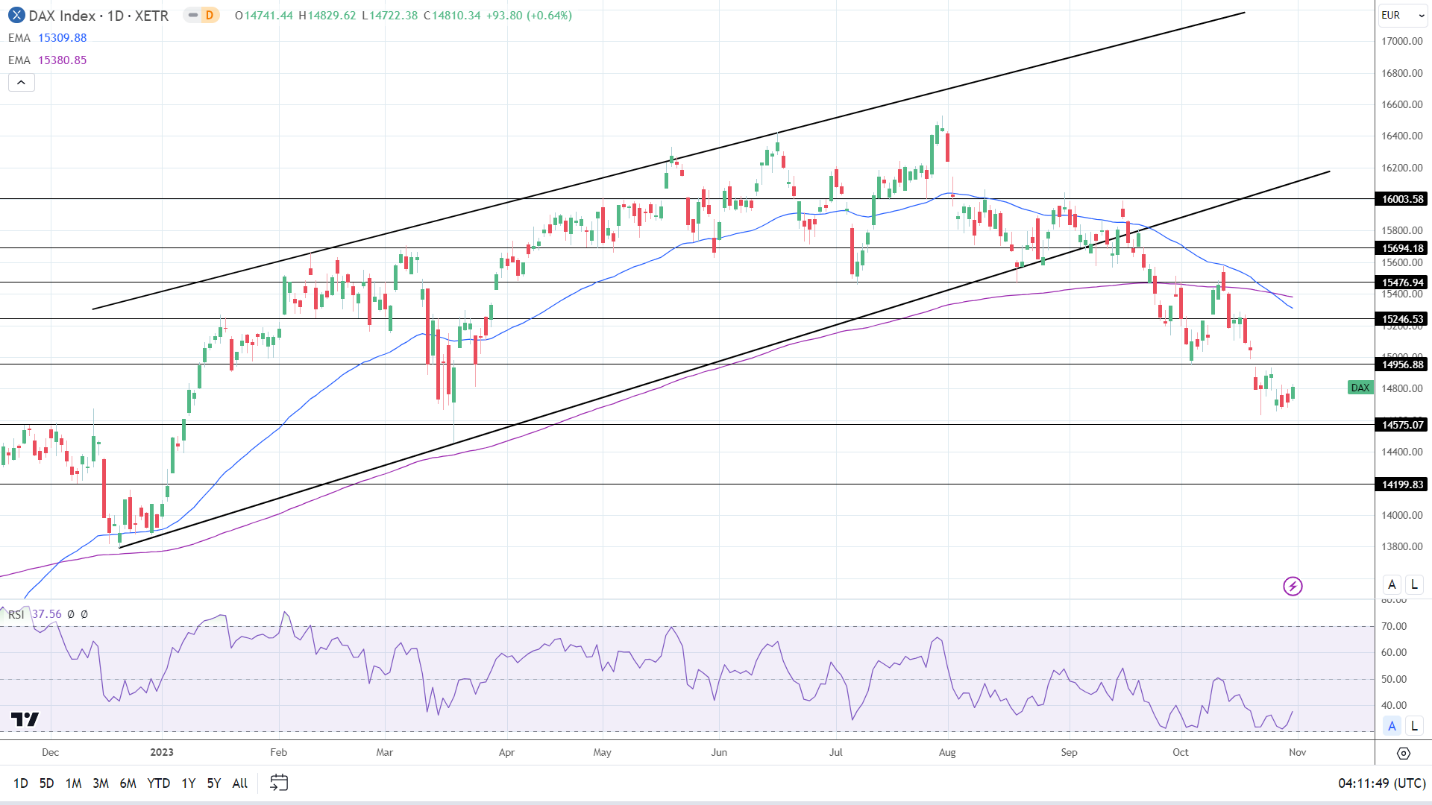
DAX Daily Chart sends bearish price signals.
DAX 011123 Daily Chart

4-Hourly Chart

The DAX sits below the 50-day and 200-day EMAs, affirming bearish price signals. A DAX move through the 14,957 resistance level and the 50-day EMA would signal a return to 15,000. Selling pressure will likely intensify at 14,900. The 50-day EMA is confluent with the 14,957 resistance level.

However, a break below the 14,575 support level would bring the 14,200 support level into play.

The 46.73 14-4 hour RSI reading suggests a DAX drop below the 14,575 support level before entering oversold territory.
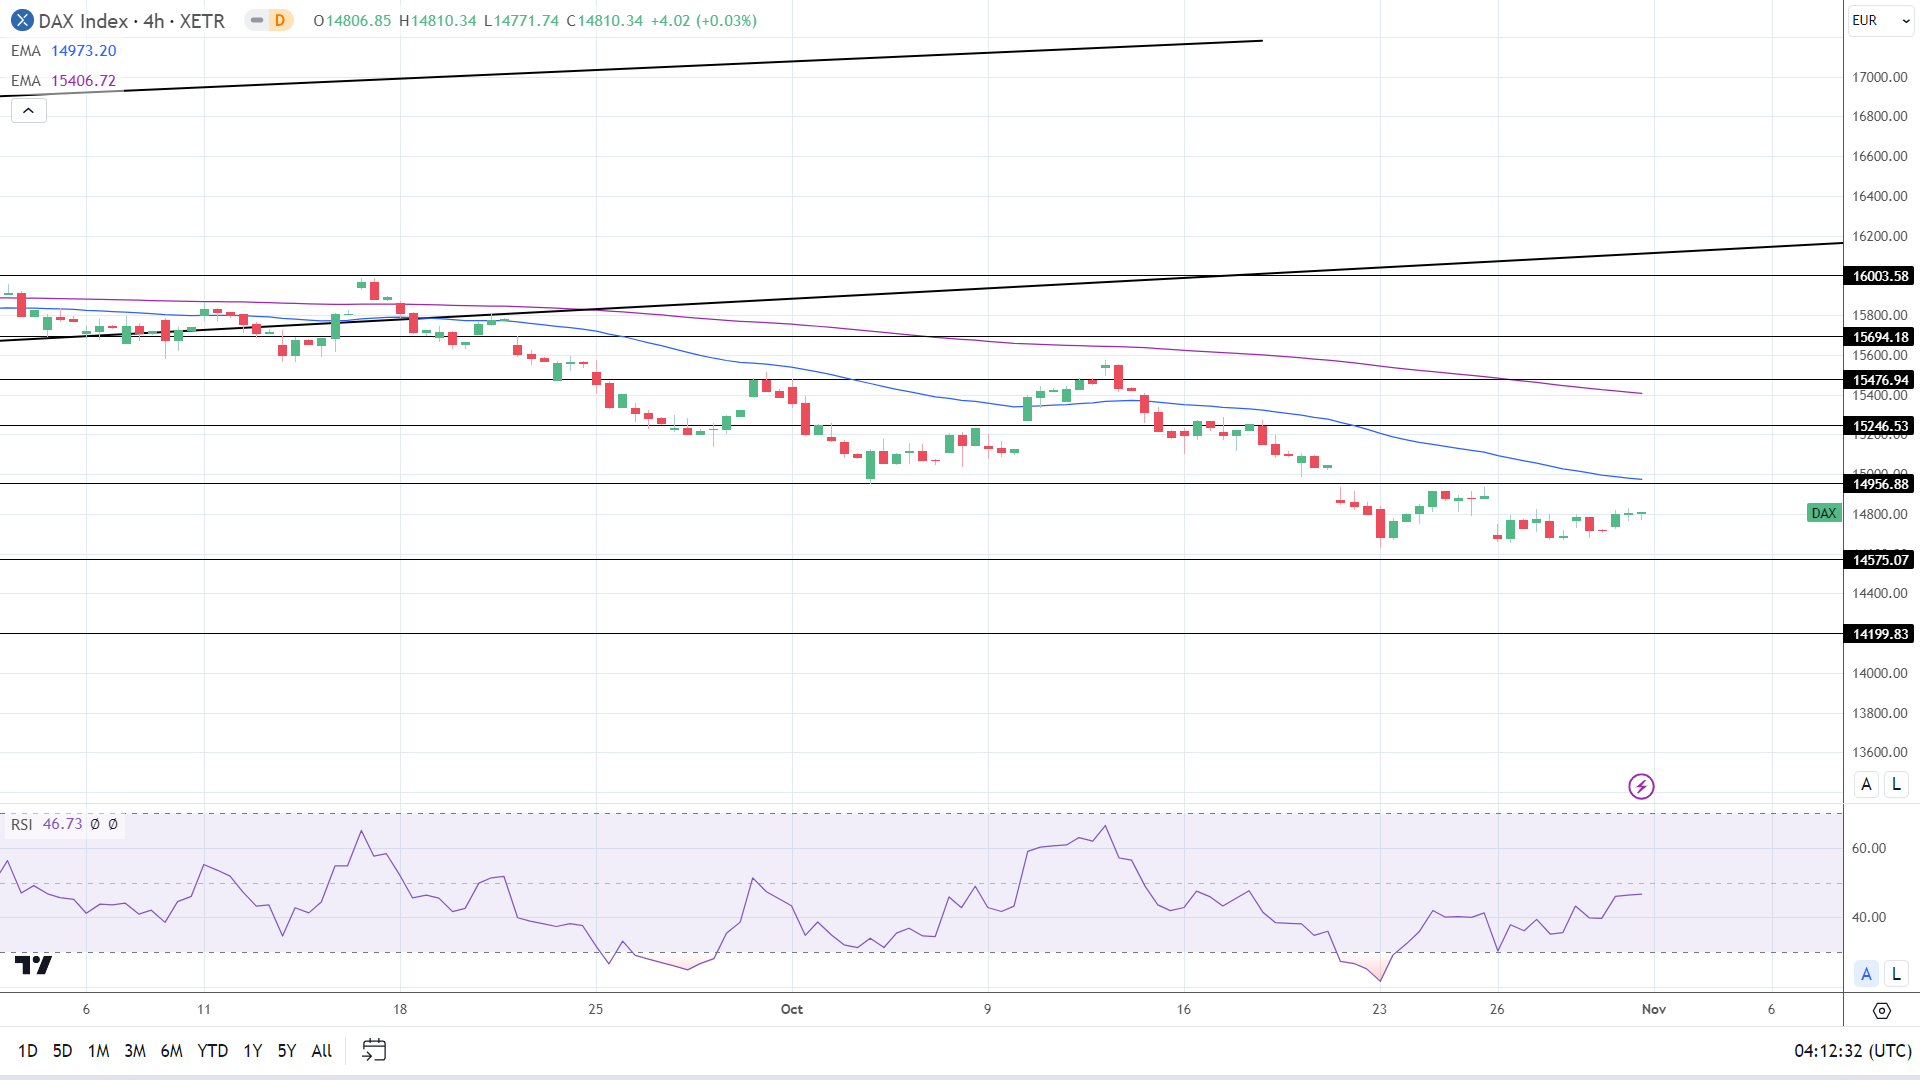
4-Hourly Chart affirms bearish price signals.
DAX 011123 4-Hourly Chart
Crypto News: SEC Chair Gary Gensler Targets Cryptos in Halloween Message

Crypto News: SEC Chair Gary Gensler Targets Cryptos in Halloween Message

SEC Chair Gary Gensler Sparks Crypto Community Ire

On Tuesday, SEC Chair Gary Gensler tweeted Halloween messages targeting the digital asset space.

Trading Derivatives carries a high level of risk to your capital and you should only trade with money you can afford to lose. Trading Derivatives may not be suitable for all investors, so please ensure that you fully understand the risks involved, and seek independent advice if necessary. A Product Disclosure Statement (PDS) can be obtained either from this website or on request from our offices and should be considered before entering into a transaction with us. Raw Spread accounts offer spreads from 0.0 pips with a commission charge of USD $3.50 per 100k traded. Standard account offer spreads from 1 pips with no additional commission charges. Spreads on CFD indices start at 0.4 points. The information on this site is not directed at residents in any country or jurisdiction where such distribution or use would be contrary to local law or regulation.


“If Satoshi Nakamoto went as Satoshi Nakamoto for Halloween, would we be able to tell? Happy 15th Anniversary to Satoshi’s famous white paper that started crypto. Any crypto companies that are tricking investors should start treating them to compliance with securities laws.”

The SEC Chair posted a second tweet, saying,

“Avoid getting tricked out of your money: Make sure you’re dealing with a registered investment professional. Take time when making investment decisions. Don’t fall for ‘can’t miss’ opportunities.”

Ripple Chief Legal Officer Stuart Alderoty responded to the Gensler snipes, saying,

“While Mr. Gensler is making bad Halloween jokes on X, his agency is being shamed for ignoring the law […].”

Alderoty referenced a federal agency analysis of SAB 121, where the SEC allegedly circumvented the rule-making process.

Illicit Use of Cryptos? Lawmakers Responded Further to the WSJ Article

On Tuesday, US Senator Cynthia Lummis reacted further to the WSJ Article stating Hamas raised millions in crypto.

Senator Cynthia Lummis had this to say about the WSJ claims,

“An inaccurate report last week claimed Hamas raised nearly $100 million via crypto assets. In reality, it was less than $500,000. This encapsulated the misconception that crypto is a tool for illicit finance when it accounts for less than 1% of global illicit finance activity.”

Senator Lummis shared the stats, which put total illicit finance at $2.9 trillion vs. $20 billion for crypto, 0.69%.

Senator Lummis went on to say,

“After the reports that Binance and Tether engaged in illicit activities, I sent a letter encouraging the DOJ to finish its investigation, follow the evidence, and consider criminal charges. Because illegal activity is illegal no matter who does it.”

Senator Lummis concluded,

“Make no mistake, crypto assets are NOT the problem. Bad actors, who exist in every sector, are. The future for crypto assets in America is brighter than ever.”

Coinbase Showcases the Success of StandWithCrypto

Coinbase (COIN) CEO Brian Armstrong reposted a Coinbase progress report on the StandWithCrypto movement. The statistics demonstrated the level of support for the US digital asset space. According to Coinbase,

    • 100k+ crypto advocate signups.
    • $2M+ in pro-crypto donations.
    • 16k+ calls and emails to Congress.

In September, Coinbase launched the StandWithCrypto campaign to expedite crypto regulations. The campaign highlighted 52 million Americans holding crypto.

Coinbase is in a legal battle with the SEC. Investors await a court ruling on the Coinbase motion to dismiss (MTD). A ruling in favor of Coinbase could materially alter the anti-crypto landscape.

In August, Senator Cynthia Lummis filed an Amicus Curiae brief supporting the MTD.

Technical Analysis

Bitcoin Analysis

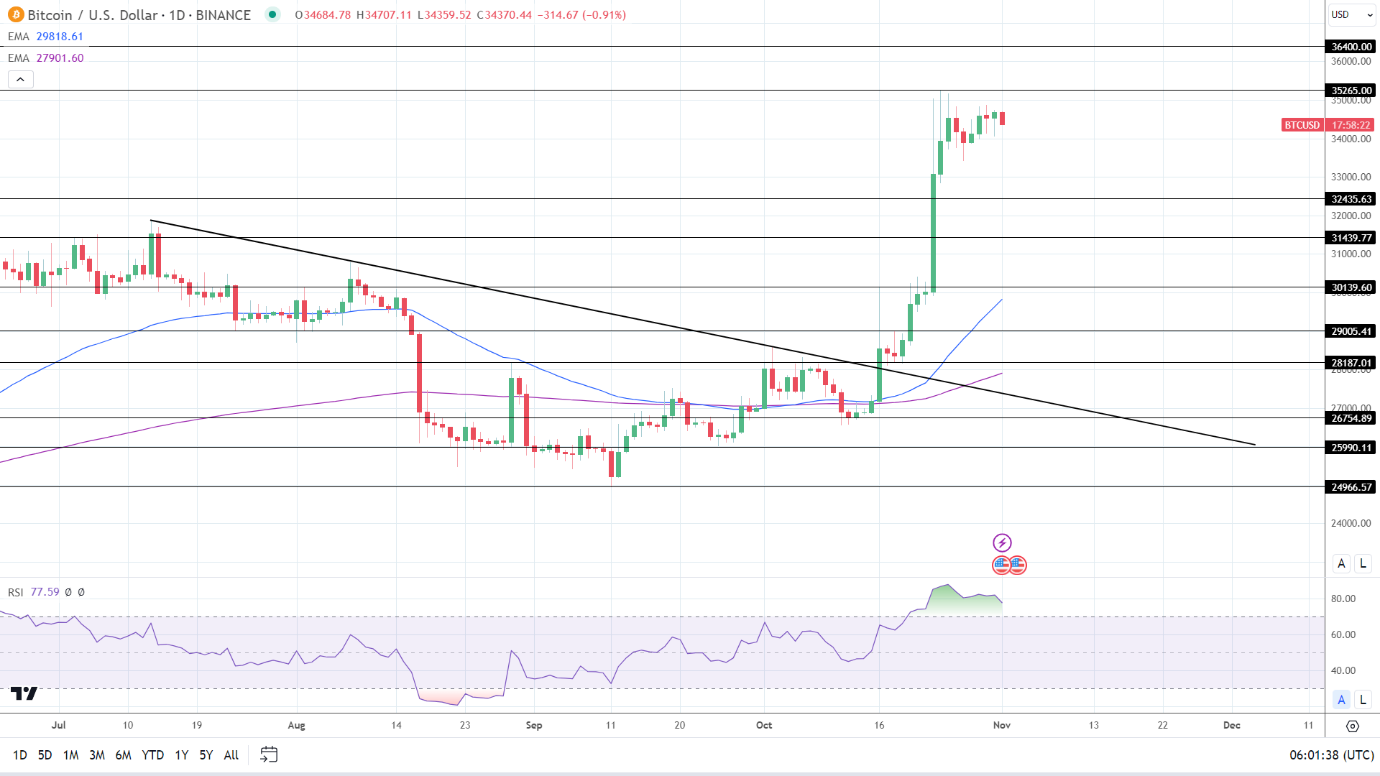
BTC held above the 50-day and 200-day EMAs, sending bullish price signals.

A BTC break above the October 24 high of $35,264 and the $35,265 resistance level would support a move to the $36,400 resistance level. BTC-spot ETF application-related news and SEC activity remain the focal points.

However, a BTC drop below $34,000 would give the bears a run at the $32,436 support level.

The 14-Daily RSI reading of 77.37 shows BTC sitting in overbought territory, suggesting intensifying selling pressure.

BTC Daily Chart sends bullish price signals.

BTCUSD 011123 Daily Chart

Ethereum Analysis

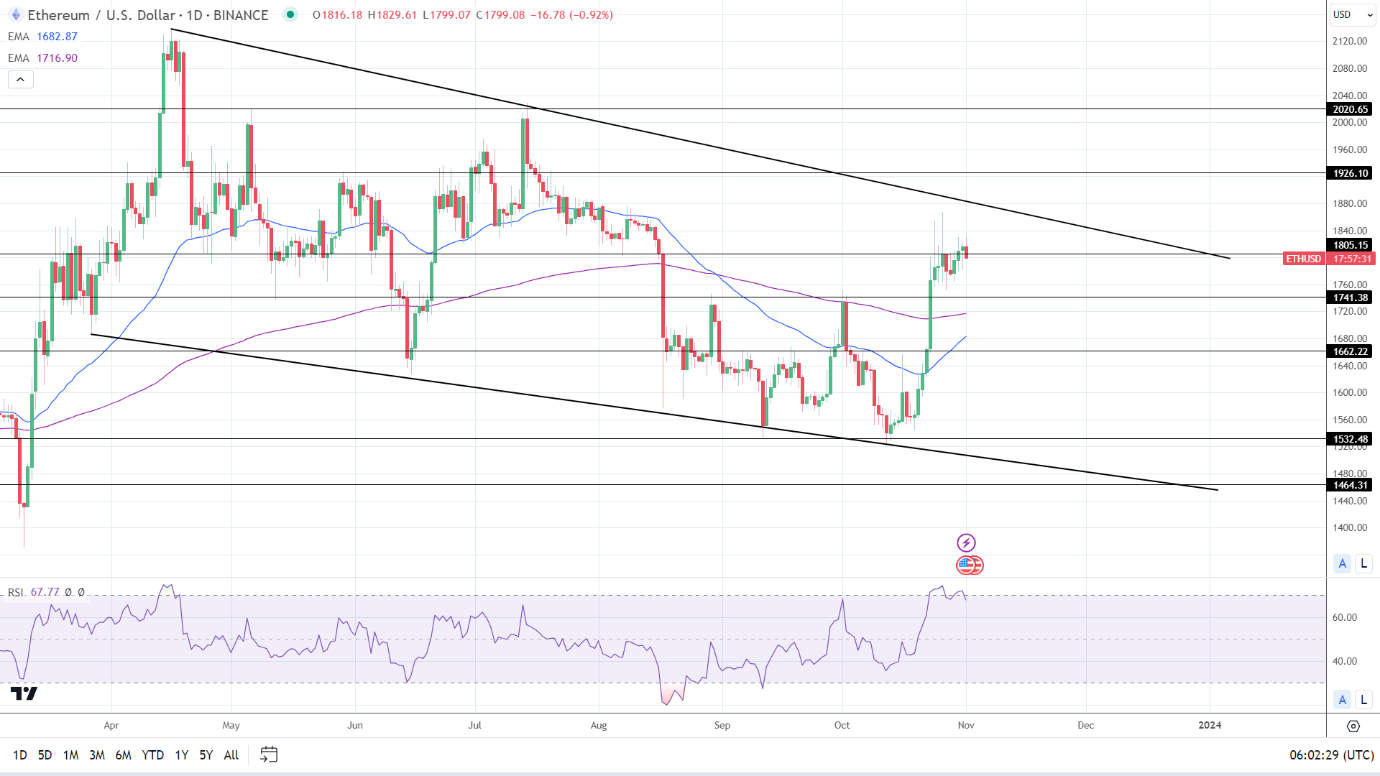
ETH remained above the 50-day and 200-day EMAs, affirming bullish price signals.

An ETH break above the $1,805 resistance level would support a move to the October 26 high of $1,868. A move through $1,868 would bring the trend line and the $1,926 resistance level into play.

SEC activity and ETH-spot ETF news are the focal points on Wednesday pre-Fed.

Failure to break above the $1,805 resistance level would give the bears a run at the $1,741 support level and the 200-day EMA.

ETH sits on the border of overbought territory with a 14-Daily RSI reading of 67.77. Seller pressure could intensify at $1,830.

ETH Daily Chart sends bullish price signals.
ETHUSD 011123 Daily Chart
Silver Prices Forecast: Hawkish Fed Worries Driving Early Weakness

Silver Prices Forecast: Hawkish Fed Worries Driving Early Weakness

Silver Prices in the Crosshairs of Fed Decision and Middle East Tensions

As November commences, silver (XAG/USD) has remained under pressure, shadowing the market fatigue evident in its more illustrious counterpart, gold. While gold briefly touched the $2,000 mark last month, lifted by geopolitical tensions in the Middle East, silver failed to ride the coattails of this surge with the same vigor.

Key Role of the Federal Reserve

Investors are keeping a keen eye on the upcoming policy decision by the U.S. Federal Reserve. While no one anticipates a change in interest rates, there is palpable tension around the Fed’s forthcoming commentary on the U.S. economy and its monetary policy roadmap. This could either alleviate or exacerbate existing market anxieties, potentially serving as a pivot for silver prices in the short term.

Trading Derivatives carries a high level of risk to your capital and you should only trade with money you can afford to lose. Trading Derivatives may not be suitable for all investors, so please ensure that you fully understand the risks involved, and seek independent advice if necessary. A Product Disclosure Statement (PDS) can be obtained either from this website or on request from our offices and should be considered before entering into a transaction with us. Raw Spread accounts offer spreads from 0.0 pips with a commission charge of USD $3.50 per 100k traded. Standard account offer spreads from 1 pips with no additional commission charges. Spreads on CFD indices start at 0.4 points. The information on this site is not directed at residents in any country or jurisdiction where such distribution or use would be contrary to local law or regulation.

Middle East Crisis Looms Large

The geopolitical unease emanating from the Middle East remains a pivotal factor in the commodity market. Recent Israeli airstrikes in Gaza, which resulted in substantial casualties, have thrown another wrench into an already volatile situation. Should the conflict escalate or draw in other players, it could serve as a catalyst for sudden shifts in the precious metals market, including silver.

Troubles in Asian Manufacturing

An additional layer of complexity is the downturn in manufacturing activity across Asia, primarily in China. This contraction poses risks to the demand dynamics for silver, especially as Asia’s key exporters face mounting pressures from weakening global demand and rising operational costs.

Short-Term Outlook Appears Cautiously Bearish

Considering the amalgamation of these variables—the Federal Reserve’s impending decision, persistent geopolitical risks, and the shrinking manufacturing sector in Asia—the market sentiment skews toward a cautiously bearish stance for silver.

With no expected shift in the Federal Reserve’s interest rates and persisting uncertainties in both geopolitical and economic landscapes, investors should exercise caution in their silver market activities for the immediate future.

Technical Analysis

Daily Silver (XAG/USD)

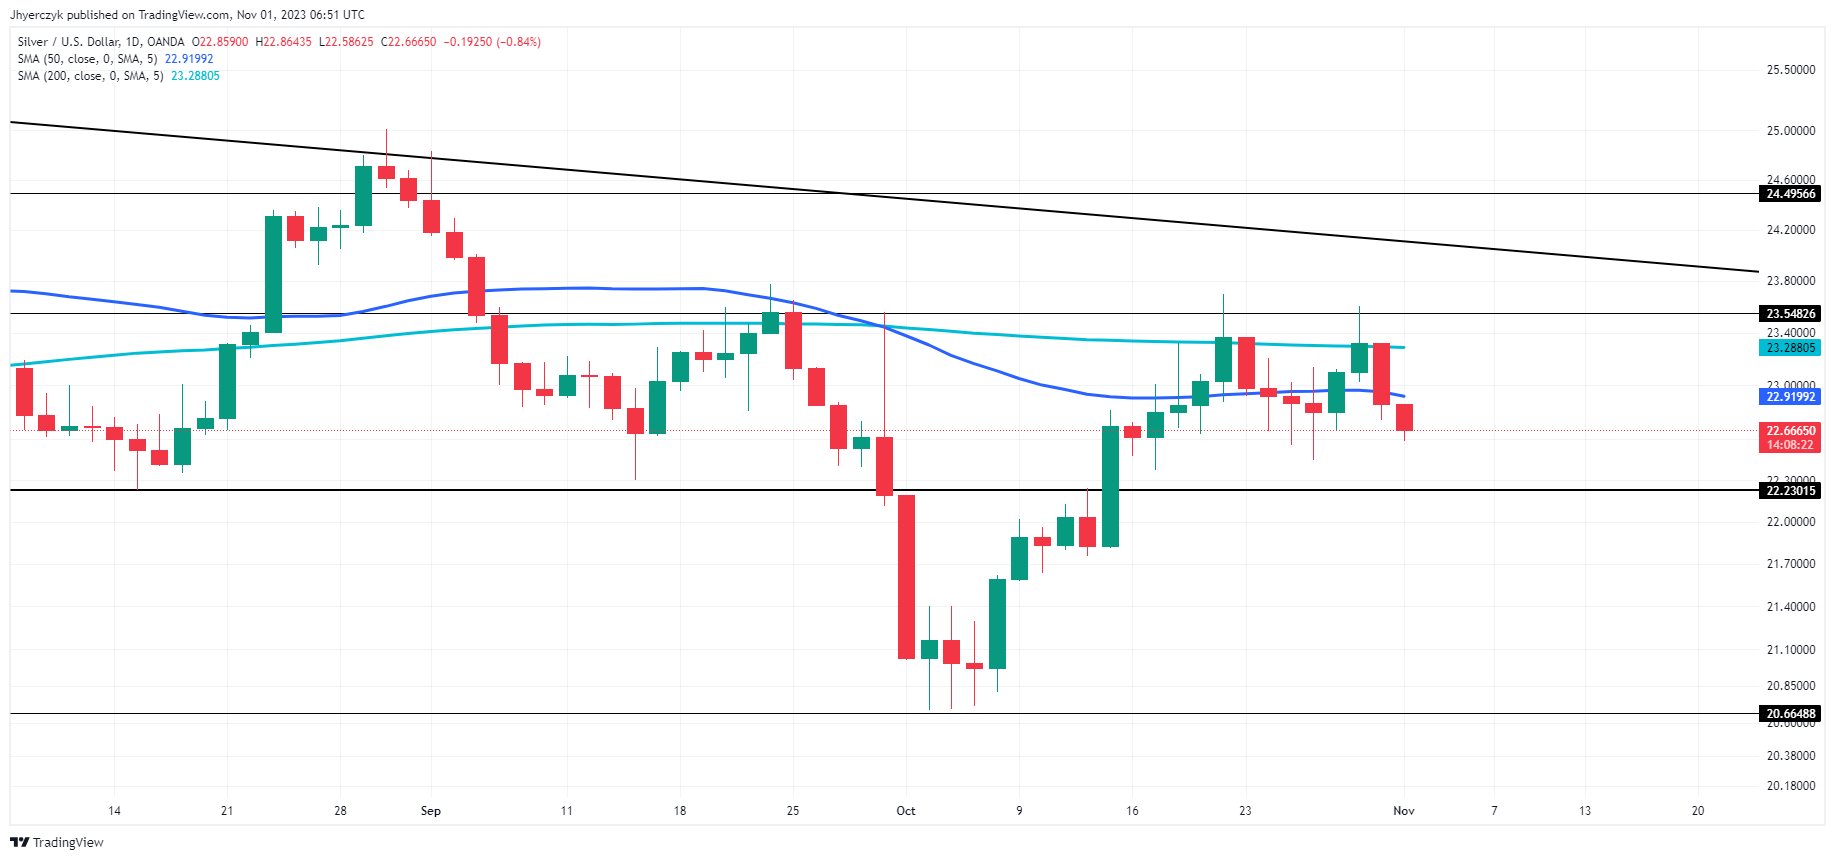
The current daily price of silver (XAG/USD) at $22.65 is slightly below its 50-day moving average of $22.92 and also below its 200-day moving average of $23.29, indicating a bearish sentiment in the market.

While the precious metal is trading close to its trend line support at $22.23, it’s well below both minor and major resistance levels at $23.55 and $24.50, respectively.

The asset also has room to fall before hitting its main support at $20.66. Given that XAG/USD is trading below both the 50-day and 200-day moving averages and is closer to its support levels rather than resistance, the short-term market sentiment for silver appears to be cautiously bearish.

Gold Prices Forecast: Subdued Trade as Federal Reserve Decisions Loom

Gold Prices Forecast: Subdued Trade as Federal Reserve Decisions Loom

Gold’s Luster Dims Ahead of Key Federal Reserve Decision

Spot gold (XAU/USD) entered November on shaky ground, as markets fixate on the U.S. Federal Reserve’s upcoming policy announcement. Last month, geopolitical unrest in the Middle East propelled the metal above the coveted $2,000 an ounce mark.

espite the previous surge, the gold market appears to be treading water, exhibiting signs of fatigue after a 7.3% rally in October. Currently, the asset is trading at $1,978.36, with U.S. gold futures also witnessing a 0.4% drop to $1,987.00.

Trading Derivatives carries a high level of risk to your capital and you should only trade with money you can afford to lose. Trading Derivatives may not be suitable for all investors, so please ensure that you fully understand the risks involved, and seek independent advice if necessary. A Product Disclosure Statement (PDS) can be obtained either from this website or on request from our offices and should be considered before entering into a transaction with us. Raw Spread accounts offer spreads from 0.0 pips with a commission charge of USD $3.50 per 100k traded. Standard account offer spreads from 1 pips with no additional commission charges. Spreads on CFD indices start at 0.4 points. The information on this site is not directed at residents in any country or jurisdiction where such distribution or use would be contrary to local law or regulation.

Federal Reserve Takes Center Stage

Investors are keenly awaiting the Fed’s interest rate decision, expected to remain unchanged. The central bank’s assessment of the U.S. economy and its future monetary policy will be closely scrutinized. Fed Chair Jerome Powell’s press conference, following the meeting’s conclusion, will also be in the spotlight. Although the majority of policymakers have indicated that they don’t expect rates to climb further, they have been citing tighter financial conditions due to higher Treasury yields as a significant concern.

Geopolitical Factors in the Balance

Geopolitical tensions in the Middle East, specifically Israeli airstrikes in Gaza, have been the other key driver for gold prices. At least 50 Palestinians, including a Hamas commander, were killed, adding more uncertainty to the already volatile market. If the conflict escalates with new players entering the fray, it could jolt the commodity market further.

Asian Manufacturing Woes

Adding another layer of complexity is the contraction of factory activity in China, Asia’s manufacturing hub. With global demand already subdued and input costs rising, the shrinking manufacturing activity could affect gold’s demand dynamics, particularly from one of its largest consumers.

Short-Term Outlook

Given the looming Federal Reserve decision, persistent geopolitical risks, and weakening Asian manufacturing, the market sentiment appears cautious. Despite the soft start to November, gold’s potential to serve as a safe-haven asset amid geopolitical strife keeps its bullish prospects alive, albeit fragile. Therefore, a bearish undertone is palpable, but the asset remains sensitive to any sharp turns in macroeconomic and geopolitical narratives.

Technical Analysis

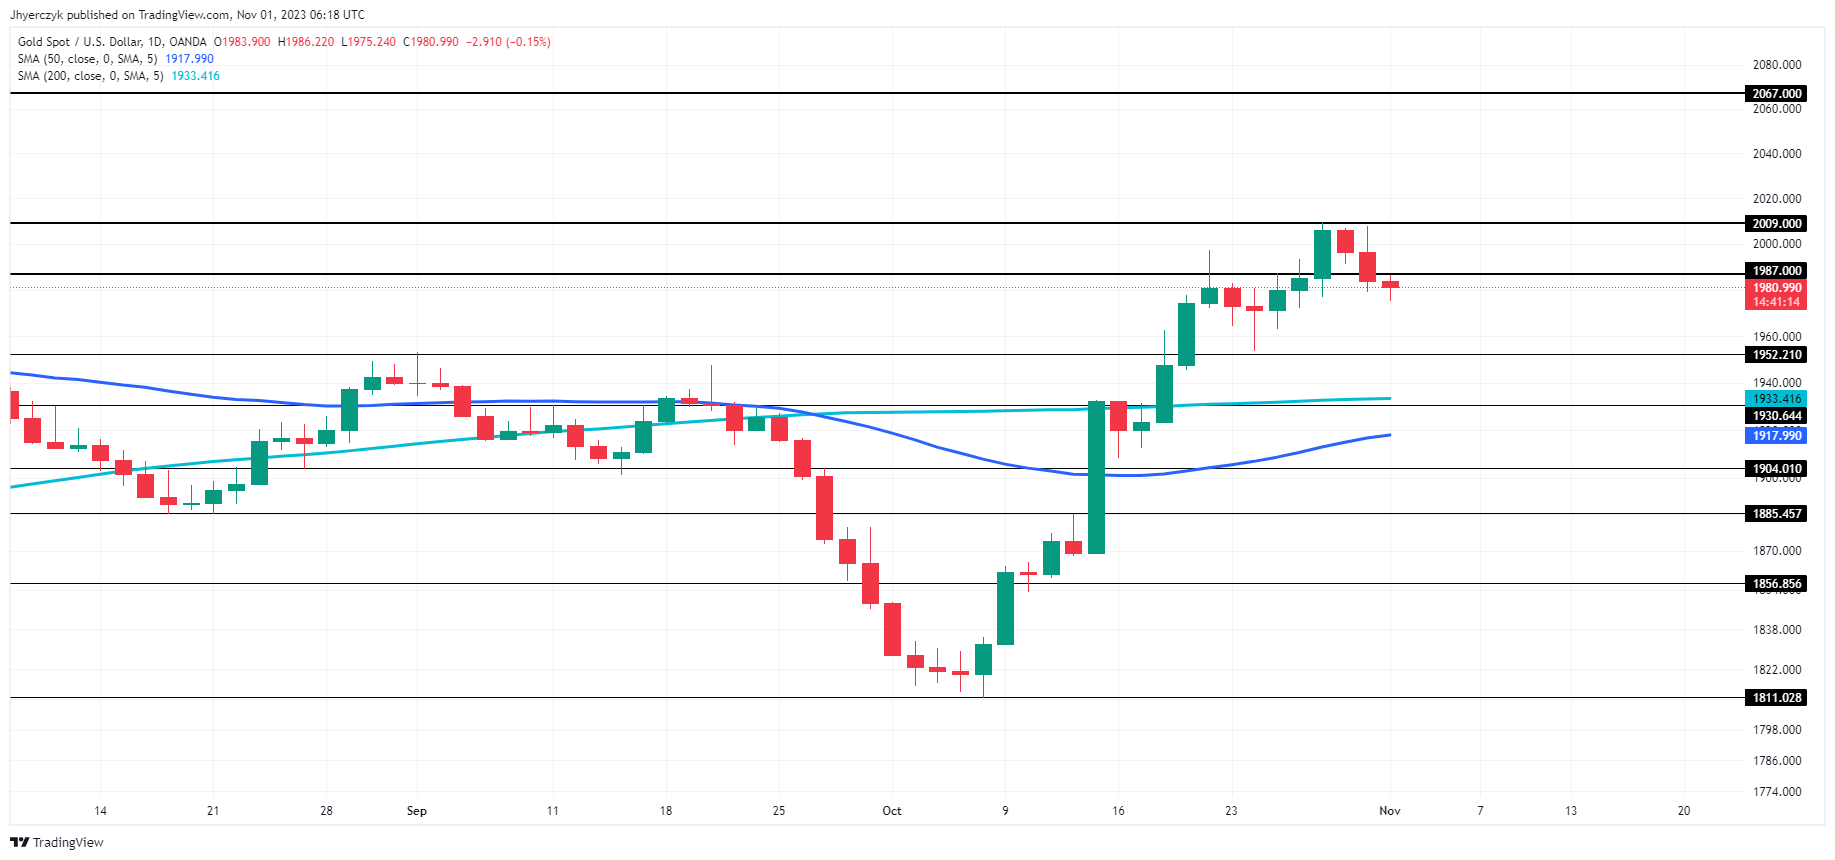
Daily Gold (XAU/USD)The current daily price of gold at $1980.75 is trading above both the 200-day moving average of $1933.41 and the 50-day moving average of $1917.98, suggesting a bullish posture in the near term.

However, the asset is facing some resistance near the $1987.00 mark, marginally above its current level. The main resistance is still further away at $2009.00.

On the downside, strong support levels lie at $1930.64 and $1952.21. These indicators collectively signal a cautious bullish sentiment, but traders should watch for a possible breakout above the minor resistance to confirm upward momentum or a retreat towards support levels as a bearish sign.

China Caixin Manufacturing PMI Drops Below 50 on Weak Overseas Demand

China Caixin Manufacturing PMI Drops Below 50 on Weak Overseas Demand

China Caixin Manufacturing PMI Drops Below 50

On Wednesday, the China Caixin Manufacturing PMI was in focus after weaker NBS PMI numbers on Tuesday. The Caixin Manufacturing PMI unexpectedly fell from 50.6 to 49.5 in October. Economists forecast an increase to 50.8.

According to the October Survey,

  • Production fell for the first time in three months, weighing on the headline PMI.
  • New orders increased for the third consecutive month, albeit marginally.
  • Firms attributed a weak macroeconomic environment and high prices to lackluster demand.
  • New export orders fell for the fourth consecutive month.
  • The Weak demand environment and a pullback in production impacted purchasing activity, which declined for the first time since July.
  • Manufacturers cut staffing levels for the second successive month. The rate of job cutting was the most marked since May. Firms cited weak demand and cost-cutting efforts for staff layoffs.
  • Input prices increased at the most marked pace since January, leading to higher factory gate prices.
  • Business confidence waned in October, with the outlook for the next 12 months hitting the lowest level since September 2022.

The latest manufacturing PMI figures will raise concerns over the external forces on the Chinese economy and the effectiveness of recent stimulus measures.

On Tuesday, the NBS Manufacturing PMI fell from 50.2 to 49.5, painting a similar picture of the Chinese manufacturing sector.

The AUD/USD Reaction to the China Caixin Manufacturing PMI

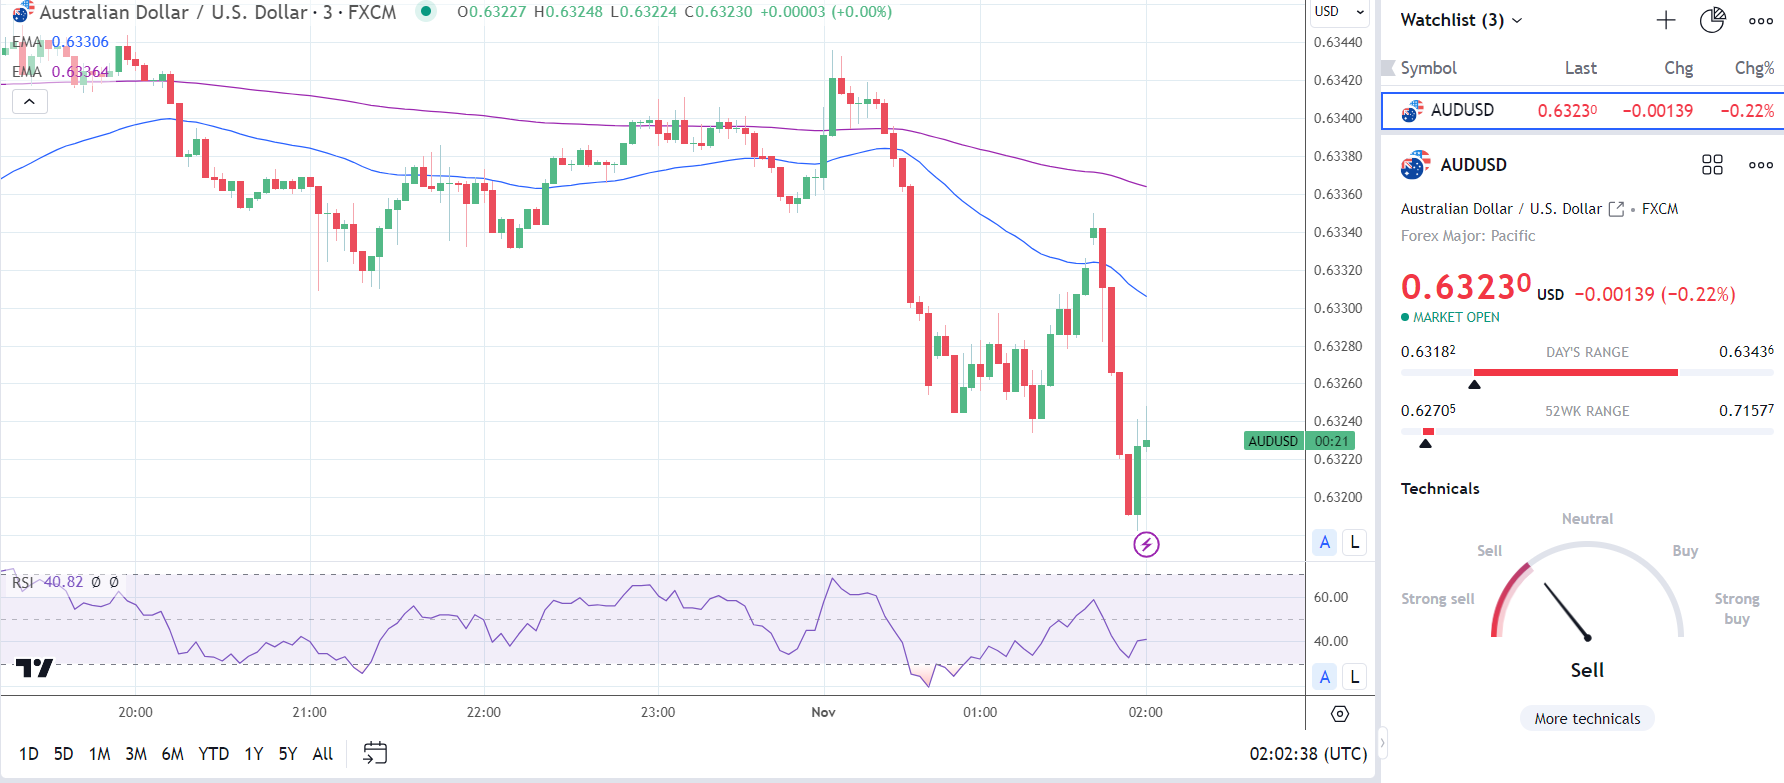
Ahead of the PMI release, the AUD/USD reached $0.63436 before dropping to $0.63234.

However, in response to the PMI numbers, the Aussie dollar tumbled from 0.63343 to a low of $0.63182.

This morning, the Aussie dollar was down 0.22% to $0.63230.

China Caixin Manufacturing PMI impacts the Aussie Dollar
011123 AUDUSD 3 Minute Chart

Next Up

Later in the Wednesday session, ADP nonfarm and JOLTs Job Openings will garner investor attention. Tighter labor market conditions would fuel bets on a more hawkish Fed rate path. Economists expect the ADP to report a 150k increase in employment in October. However, economists expect JOLTs Job Openings to decrease from 9.61 million to 9.25 million in September.

While the numbers will draw interest, the Fed interest rate decision and press conference will be the main event. Economists expect the Fed to leave interest rates unchanged at 5.50%. Barring a surprise Fed rate hike, the focus will be on the Fed press conference. A hawkish Fed Chair Powell and rising bets on a December Fed rate hike would impact market risk sentiment.

Japanese Yen Craters after BoJ Fails to Appease Bears, USD/JPY & EUR/JPY Soar

Japanese Yen Craters after BoJ Fails to Appease Bears, USD/JPY & EUR/JPY Soar

The Japanese yen suffered large losses against the U.S. dollar and euro on Tuesday following Bank of Japan’s monetary policy announcement. In early afternoon trading in New York, USD/JPY was up about 1.5% to 151.35, a level it had not reached since October last year. Meanwhile, EUR/JPY was up around 1.2%, breaking above the 160.00 threshold and hitting its highest mark in 15 years.

The BoJ maintained its benchmark rate unchanged at -0.10% and tweaked its yield curve control program, indicating that it would take a more flexible approach to controlling long-term rates. Under the new scheme, the institution would allow the 10-year government bond yield to rise above 1.0%, characterizing this level as a reference point rather than a rigid cap as previously considered.

If you are puzzled by trading losses, download our guide to the “Traits of Successful Traders” and learn how to overcome the common pitfalls that can lead to missteps.

While the BoJ’s action is a step in the direction of dismantling its controversial accommodative position of the past decade, the measure didn’t live up to expectations after a media leak on Monday suggested that the institution, under Kazuo Ueda’s leadership, was prepared to implement a more substantial and meaningful change to its current strategy.

The yen’s drop was worsened by news that the Ministry of Finance had stayed out of FX markets recently. Traders believed that the government had taken measures to support the currency earlier this month, but official data contradicts this claim. This means that the high volatility experienced a few weeks ago, when USD/JPY broke above 150.00, was probably the result of trading algorithms.

With the BoJ not yet ready to exit its ultra-dovish stance altogether and the Japanese government not doing much to contain FX weakness, rampant speculative activity could keep driving USD/JPY and EUR/JPY higher in the near term. This could mean fresh multi-year highs for both pairs heading into November.

For a comprehensive view of the Japanese yen’s fundamental and technical outlook, make sure to download our free Q4 trading forecast today.

USD/JPY TECHNICAL ANALYSIS

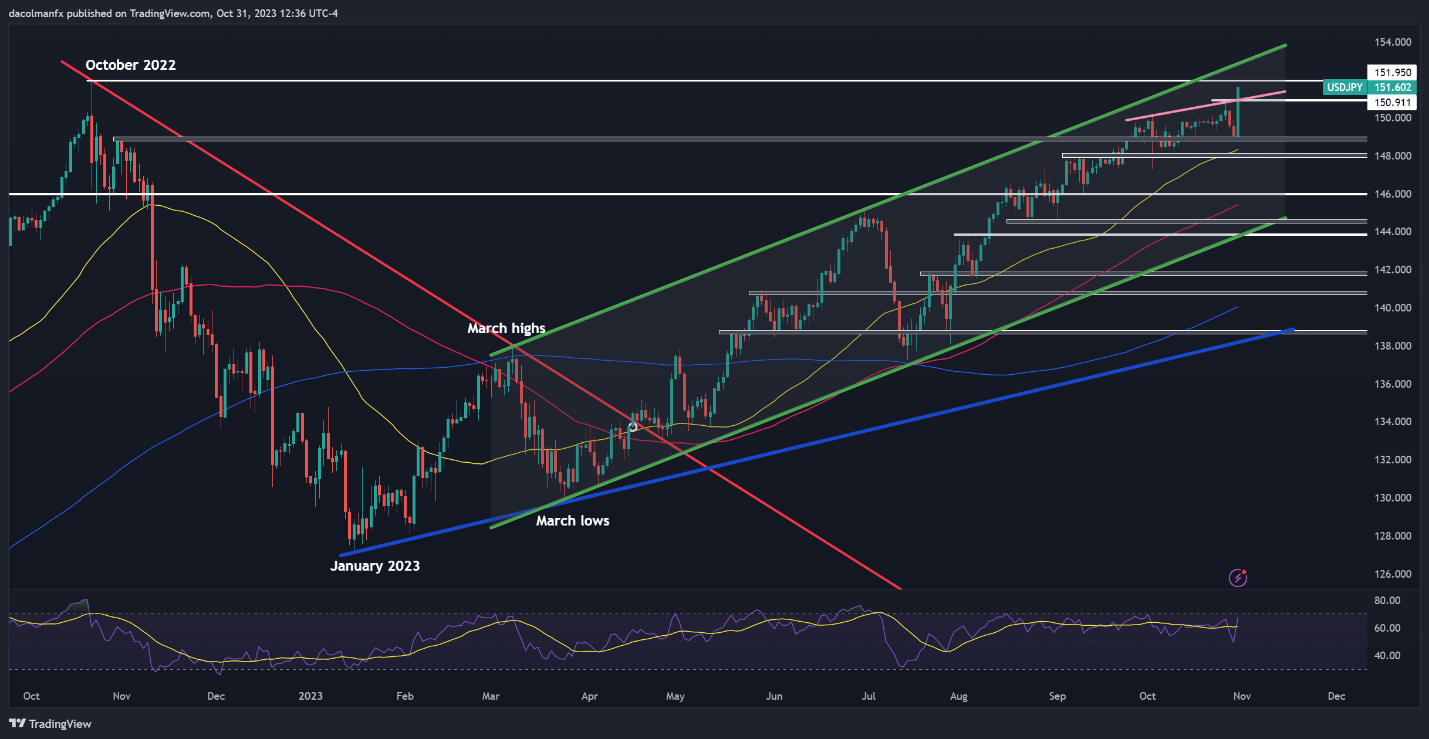
USD/JPY broke out on the topside, clearing the 151.00 handle on Tuesday hitting its highest level in more than 12 months. With bullish momentum on its side, the pair could soon challenge a key ceiling at 151.95, which corresponds to last year’s peak. On further strength, the focus shifts to channel resistance at 152.85.

On the flip side, if the bears return and trigger a pullback, initial technical support becomes visible at 150.95. Breaching this floor could entice new sellers to enter the market, setting the stage for a retracement towards 148.90. Below this area, traders’ attention turns to the psychological 148.00 handle, followed by 146.00.

USD/JPY TECHNICAL CHART

A screen shot of a graph  Description automatically generated


Bitcoin (BTC/USD) Technical Outlook: Golden Cross Pattern Fails to Inspire Higher Prices, What Next?

Bitcoin (BTC/USD) Technical Outlook: Golden Cross Pattern Fails to Inspire Higher Prices, What Next?

Bitcoin prices have taken a bit of a breather since the expansive rally that broke above the $35k mark last week Tuesday. Since then, it appears to be a case of uncertainty and rangebound trade but Bitcoin remains underpinned by hopes of the BlackRock Spot Bitcoin ETF approval.

Supercharge your trading prowess with an in-depth analysis of gold‘s outlook, offering insights from both fundamental and technical viewpoints. Claim your free Q4 trading guide now!

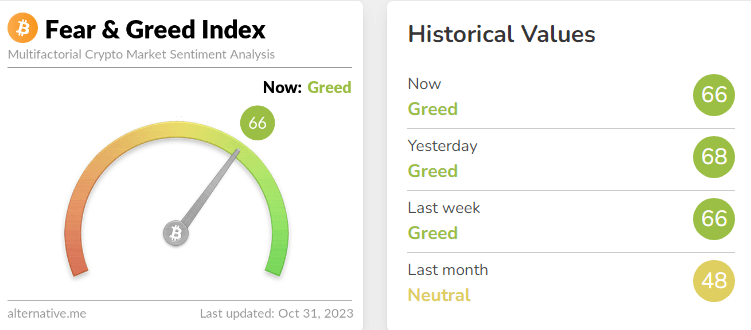
A sign of the strength and confidence from bulls is the lack of a significant pullback despite a resurgence in the DXY. The resurgence which has see many FX pairs and Gold lose ground to the Greenback has had very little impact on the price of Bitcoin. There has been a sizeable shift in market sentiment around Crypto markets and Bitcoin in particular over the past month or so. This is reflected in the image below as the crypto fear and greed index has risen from 48 a month ago to 66 today, which keeps it in “Greed” territory.
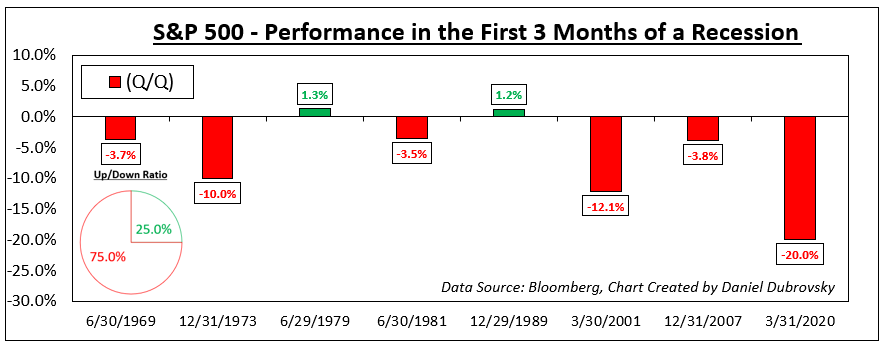
image1.png

The world’s largest cryptocurrency ad crypto markets faced calls that it was dying toward the back end of 2022 before becoming the best performing asset of 2023. It does appear however that Crypto and blockchain technology are on their way to mainstream adoption. This is evidenced by the countless number of global institutions like JPMorgan, BNP Paribas and Santander are among those who are currently involved in various blockchain projects.

The hype around the ETF is justified as we have heard comments from many asset managers and CEOs confirming they are fielding many enquiries and calls regarding diversification into Crypto. This hype seems to be underpinning Bitcoin right now so if we do have a rejection of the BlackRock Bitcoin ETF then we could be in for a deeper retracement. Right now, it does appear that that markets are leaning on the side of an approval, will we get it though?

image2.png

TECHNICAL OUTLOOK AND FINAL THOUGHTS

From a technical standpoint BTCUSD is currently stuck in a 2k range between the $33.3k and $35.3k. Price action is choppy as we appeared ready to make a new high before a bearish doji candle close yesterday hinting at a fresh low. However today we have seen the $34177 support area hold firm with the daily candle looking likely too close as a hammer candlestick. The question will be whether we can push on to make a fresh high above the $35.3k.

Of course, we have the US FOMC meeting tomorrow evening which could stoke some volatility. However, looking at the resilience in Bitcoin today, I’m hesitant to say that a hawkish Fed will push Bitcoin prices lower. Today saw a sizeable rally in the DXY and still Bitcoin prices have held the high ground, a sign of the buying pressure still present.

Nasdaq 100, EUR/USD Forecast: Fed Policy Outlook to Dictate Market Trend

Nasdaq 100, EUR/USD Forecast: Fed Policy Outlook to Dictate Market Trend

The Federal Reserve will disclose its penultimate monetary policy decision of the year tomorrow. Wall Street analysts expect the central bank to keep its benchmark rate unchanged in its current range of 5.25% to 5.50%. This puts the spotlight on forward guidance, particularly Chairman Powell’s remarks during his press conference.

In September, the Fed left open the possibility of additional policy firming this year, but conviction around further tightening has been waning of late, with several key officials indicating that the bond market is doing the work for them by tightening financial conditions via rising yields. Traders should closely heed Powell’s views on this matter.

If Powell expresses preference for another quarter-point hike in 2023, the Nasdaq 100 could take a strong hit. For its part, the U.S. dollar could climb sharply against the euro as traders reprice higher the Fed’s terminal rate. With the economy holding up remarkably well and inflation displaying notable stickiness, this scenario should not be completely ruled out at this stage.

Conversely, if the FOMC chief adopts a more cautious stance and signals that the hawkish hiking campaign that began in 2022 has ended, there is scope for the Nasdaq 100 to stage a solid rally. The EUR/USD may also see an upturn, but any gains would be curtailed by the macroeconomic challenges confronting the Eurozone economy, including the potential threat of a recession.

Keen to understand the role of retail positioning in EUR/USD’s price action dynamics? Our sentiment guide delivers all the essential insights. Get your free copy today!

EUR/USD TECHNICAL ANALYSIS

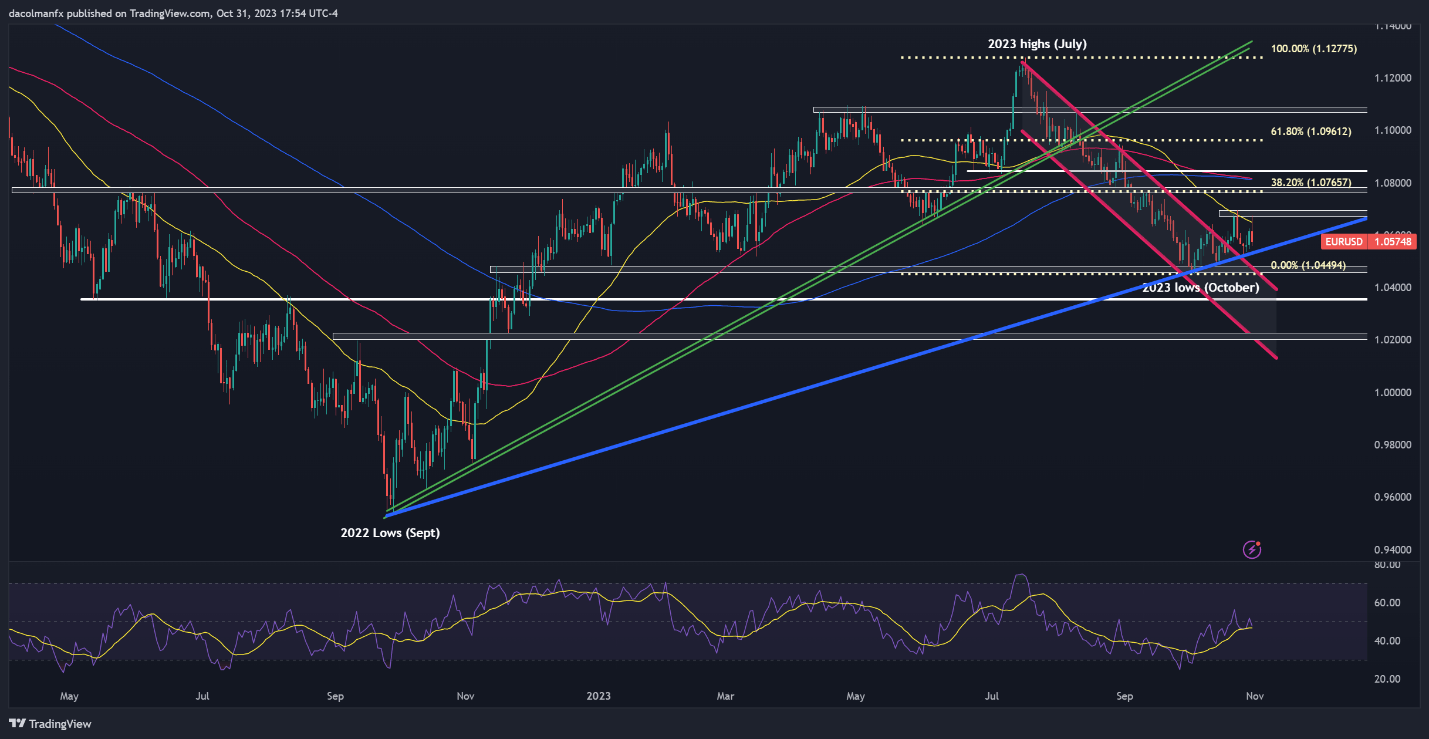
EUR/USD retreated on Tuesday after failing to clear its 50-day simple moving average near 1.0695, with sellers back at the steering wheel at the time of writing. If weakness intensifies in the upcoming days, trendline support at 1.0535 may provide a buffer against further losses, unless a breakdown unfolds, in which case, we could witness a move toward the 1.0500 handle.

On the flip, if the bulls engineer a strong resurgence and manage to push prices higher, initial resistance stretches from 1.0670 to 1.0695. Upside clearance of this region could rekindle upward momentum, paving the way for a move towards 1.0765, an important ceiling that corresponds to the 38.2% Fibonacci retracement of the July/October pullback.

Curious to know the likely trajectory for EUR/USD and the market catalysts that should be on your radar? Find all the information you need in our Q4 euro trading forecast. Download it now!

EUR/USD TECHNICAL CHART

A screenshot of a computer screen  Description automatically generated

If you are looking for a comprehensive outlook of U.S. equity indices, our Q4 stock market trading guide is packed with great fundamental and technical insights. Download it now!

NASDAQ 100 TECHNICAL ANALYSIS

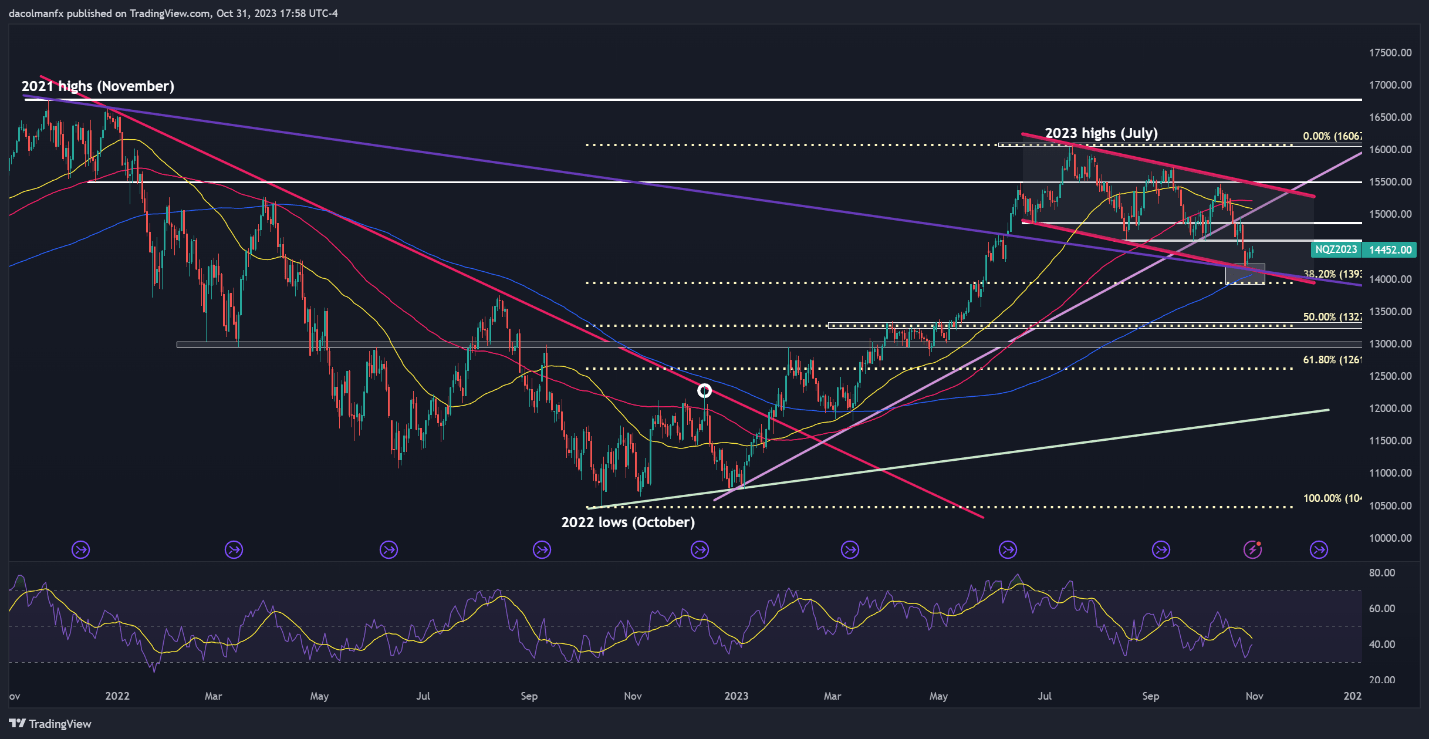
The Nasdaq 100 has rebounded from an area of cluster support that spans from 14,150 to 13,930, where the lower limit of the short-term descending channel aligns with the 200-day SMA and the 38.2% Fibonacci retracement of the October 2022/July 2023 rally.

To create a potential route for a bullish comeback, confluence support in the 14,150/13,930 range must hold – failure to do so could set in motion a substantial pullback, potentially leading prices to 13,270, the 50% Fibonacci retracement.

In the event that the bulls succeed in driving the Nasdaq 100 higher, initial resistance is located at 14,600. Successfully piloting above this barrier could boost buying interest, setting the stage for a climb towards 14,860. On further strength, the focus shifts to 15,100.

NASDAQ 100 TECHNICAL CHART

A screen shot of a graph  Description automatically generated


EUR/USD Price Forecast: Euro Looks Vulnerable as All Eyes Shift to FOMC

EUR/USD Price Forecast: Euro Looks Vulnerable as All Eyes Shift to FOMC

EURO FUNDAMENTAL BACKDROP

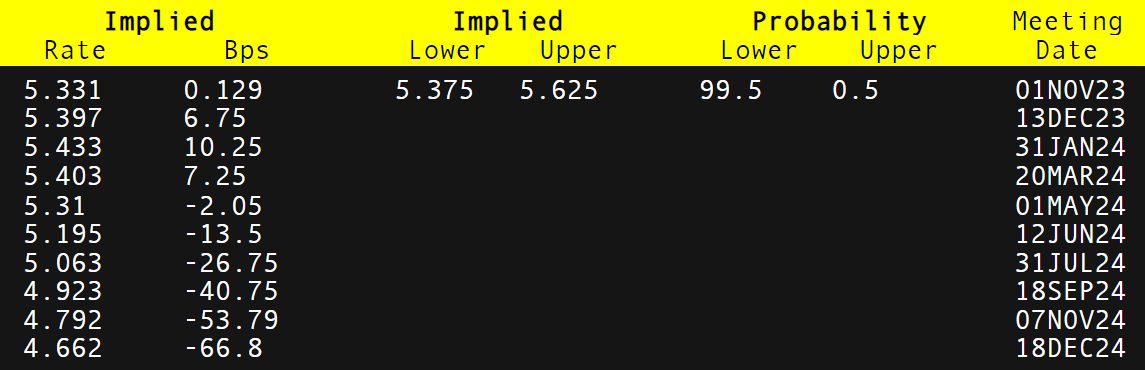
The euro faces the Federal Reserve interest rate decision later today (see economic calendar below). Although expectations for a rate pause are almost certain (99.5%) as shown via the implied Fed funds futures table, recent US economic data has been relatively robust. Strong GDP, persistent inflation pressures and a resilient labor market should maintain the ‘higher for longer’ message. That being said, high US Treasury yields could reduce the need for additional hikes. In summary, if we see no change to rates the US dollar could remain relatively stable leaving the EUR depressed.

IMPLIED FED FUNDS FUTURES

image1.png

From a euro perspective, recent weak Chinese PMI’s will weigh negatively on the EUR and with bleak growth prospects within the region, the USD is unlikely to lose its attractiveness. In addition, the ongoing geopolitical issues (Israel-Hamas war) will keep the greenback’s safe haven attraction alive.

Want to stay updated with the most relevant trading information? Sign up for our bi-weekly newsletter and keep abreast of the latest market moving events!

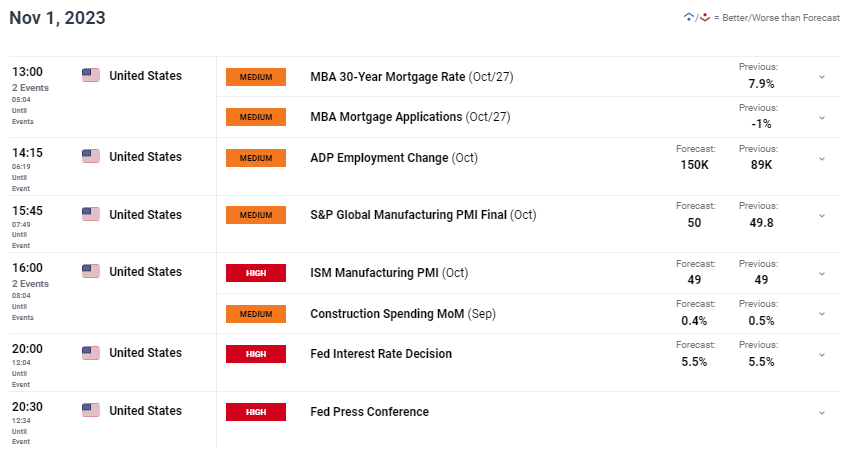
Another key data point to look out for today will be the ISM manufacturing report which includes JOLTs data alongside the ADP release. This information will be key moving forward but should not have much bearing on todays rate decision.

ECONOMIC CALENDAR (GMT+02:00)

image2.png

TECHNICAL ANALYSIS

EUR/USD DAILY CHART

image3.png

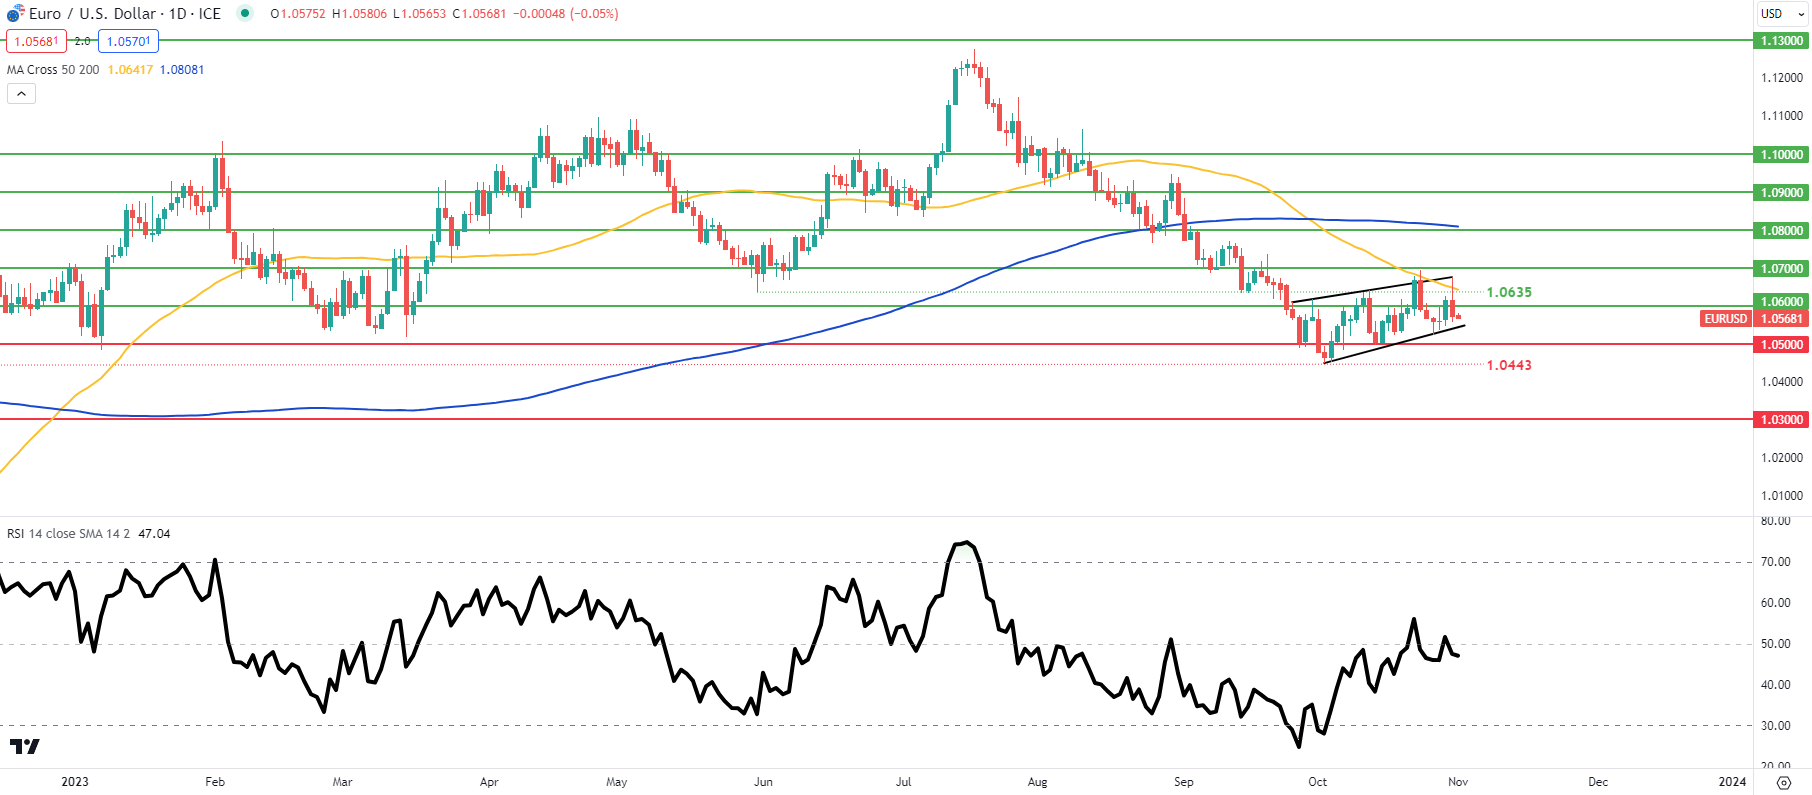
The daily EUR/USD daily chart above trades within a developing rising wedge/bear flag pattern (black) that may hint at subsequent downside should price breach wedge/flag support. Bulls were unable to push above the 50-day moving average (yellow) and the upcoming Fed catalyst could spark a pattern breakout. The Relative Strength Index (RSI) currently hovers around its midpoint zone thus indicating no preference for bullish nor bearish momentum (hesitancy).

Resistance levels:

  • 1.0635/50-day MA
  • 1.0600

Support levels:

  • 1.0500
  • 1.0443
  • 1.0300

IG CLIENT SENTIMENT DATA: BEARISH

IGCS shows retail traders are currently neither NET LONG on EUR/USD, with 68% of traders currently holding long positions (as of this writing).

How Do the US Dollar, Gold, S&P 500, and More Trade at the Onset of Recessions?

How Do the US Dollar, Gold, S&P 500, and More Trade at the Onset of Recessions?

The onset of recessions in the United States typically results in reoccurring financial market trading patterns. While not all of them will be the same, we can look back and see how key assets have performed. This is a special report that analyzes how the US Dollar, gold, S&P 500, Australian Dollar and 10-year Treasury yield traded during the first 3 months of economic downturns.

The length and severity of each recession will vary. This means the usual reaction you might expect from an asset during the onset of a downturn will not always repeat perfectly. For example, during the 2000s housing crash, the US entered a recession in Q4 of 2007. While the stock market declined during these 3 months as one might have expected, peak market volatility occurred much later towards the end of 2008.

Before diving into this topic, I need to set the ground rules, starting with the definition of a recession. In this study, I will be using a GDP-based recession indicator, which attempts to assign dates to downturns based on a mathematical model. This is as opposed to the NBER’s Business Cycle Dating Committee playbook, which can at times be subjective. You can learn more about the indicator I am referencing here.

This definition is also different from the widely referenced two consecutive quarters of negative growth, which is unofficial and often too simplistic, failing to capture other economic trends. For example, in 2022, the economy experienced 2 quarters of negative growth in Q1 and Q2. But, the labor market outperformed.

For analyzing the US and Australian Dollars, I will be using a correlation-weighted currency index instead of an exchange rate. This helps us capture the broader direction of a currency against the world rather than any individual unit. Otherwise, comparing AUD/USD with the DXY Dollar Index runs the risk of placing too much emphasis on the greenback.

Average Snapshot

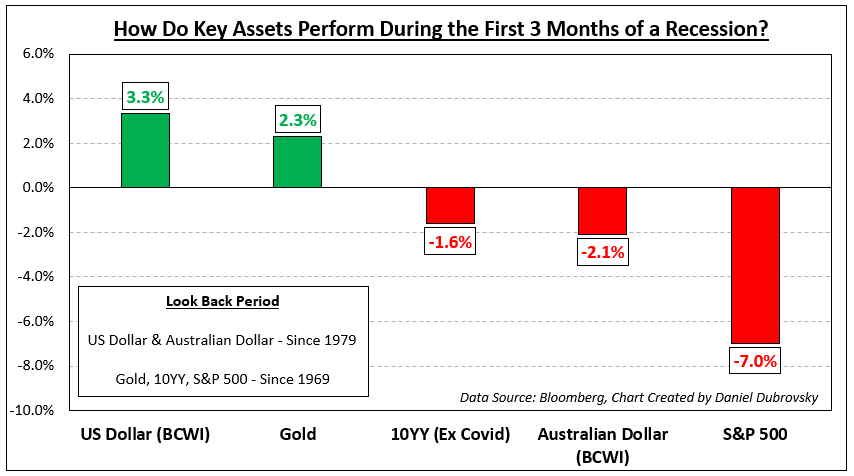
The chart below is a snapshot of how these assets performed during the onset of recessions ordered from best performing to the worst. The sequence is as follows: US Dollar, gold, 10-year Treasury yield, Australian Dollar and S&P 500. The availability of currency data meant I could only look back to 1979. For the rest of the assets, I was able to look back to 1969. The remainder of this article breaks down the individual performance beginning with the US Dollar.

Average Snapshot

US Dollar

Looking back to recessions since 1979, which adds up to 6, the Bloomberg Correlation-Weighted US Dollar Index rose 3.3% on average in the first 3 months of economic downturns. That is not to say each time it climbed. The up/down ratio is 50%. But, as you can see in the chart below, when the dollar rallies, it tends to do so strongly. During periods when the currency fell, the downside reaction was much weaker. This should come as little surprise. In the currency spectrum, the US Dollar functions as a haven given its status as the world’s reserve currency.

US Dollar

Gold

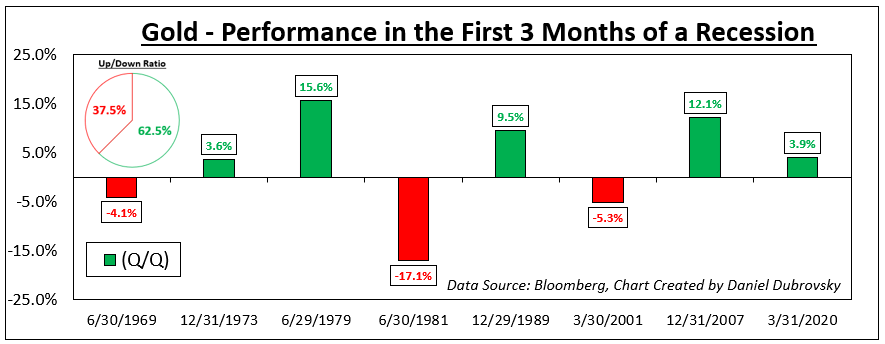
Meanwhile, gold also tends to perform decently at the onset of recessions going back to 1969. On average, the yellow metal returned +2.3% with a win/loss ratio of about 62.5%. Like the US Dollar, the wins were stronger than your average losses, excluding the early 1980s recession (-17.1%). Does this make gold a haven? Remember that gold is not as liquid as a currency. XAU/USD tends to function as an anti-fiat instrument. When the return on cash dwindles, which is what usually happens during recessions, gold becomes relatively more attractive and vice versa.

Gold

10-Year Treasury Yield

From this point forward, we are moving on to assets that underperform. Since 1969, the 10-year Treasury yield has declined by -1.6% on average during the onset of recessions (excluding Covid, which was a major negative outlier that skews the mean). Factoring in Covid though, the up/down ratio is about 29%. Bonds tend to receive a high amount of demand during economic uncertainty due to perceived safety, pushing up the price at the cost of yields.

10-Year Treasury Yield

Australian Dollar

Looking at the Bloomberg Correlation-Weighted Australian Dollar Index, the Aussie returned on average -2.1% during the first 3 months of a US recession since 1979. AUD also has a depressingly low win/loss rate of 16.7%. In currency markets, the Aussie is known for its sentiment-linked status, often closely following equities. Australia’s economy is closely tied to the global business cycle due to commodity exports, making it important to watch growth in the United States. When the latter sneezes, the world can catch a cold, driving up market volatility and negatively impacting the Australian Dollar.

Australian Dollar

S&P 500

Finally, we arrive at the S&P 500, which is one of the key US benchmark stock indices. Unsurprisingly, the S&P 500 has returned on average -7.0% at the onset of recessions since 1969. But, unlike the Australian Dollar, the win/loss ratio is slightly better at 25%. This is unsurprising. Depending on the severity of the recession, uncertainty plays a key role in how much the stock market declines and how fast it does.

Recessions raise the risk that companies can go out of business and/or lay off workers, resulting in stock market crashes. Often, a bubble popping can lead to a recession, such as the dotcom bust in the early 2000s and the housing market leading in 2008. There are also leading indicators of a recession that you might be interested to learn about.

S&P 500