DAX Index: German Trade and Corporate Earnings in Focus Pre-US Jobs Report

DAX Index: German Trade and Corporate Earnings in Focus Pre-US Jobs Report

DAX Thursday Overview

The DAX rallied 1.48% on Thursday. Following a 0.76% rise on Wednesday, the DAX ended the day at 15,144.

US Federal Reserve and US Labor Market Delivered Support

On Thursday, the European markets reacted to the Fed interest rate decision and Fed Chair Powell press conference.

Trading Derivatives carries a high level of risk to your capital and you should only trade with money you can afford to lose. Trading Derivatives may not be suitable for all investors, so please ensure that you fully understand the risks involved, and seek independent advice if necessary. A Product Disclosure Statement (PDS) can be obtained either from this website or on request from our offices and should be considered before entering into a transaction with us. Raw Spread accounts offer spreads from 0.0 pips with a commission charge of USD $3.50 per 100k traded. Standard account offer spreads from 1 pips with no additional commission charges. Spreads on CFD indices start at 0.4 points. The information on this site is not directed at residents in any country or jurisdiction where such distribution or use would be contrary to local law or regulation.

Investors brushed aside German unemployment and euro area manufacturing PMI numbers. However, US labor market figures provided late support. Weaker-than-expected unit labor costs and jobless claims eased bets on a December Fed rate hike.

On Thursday, the S&P 500 rallied 1.89%, with the Dow and the Nasdaq Composite Index rising by 1.70% and 1.78%.

The Thursday Market Movers

Tech stocks and the auto sector were among the front-runners, supported by easing bets on Fed rate hikes.

Volkswagen rallied 3.20%, with Mercedes Benz Group and Porsche rising by 2.77% and 2.59%. BMW ended the session up 2.35%.

However, Siemens Energy led the way, surging by 6.40%. Favorable assessments on selling the stake in Siemens Ltd contributed to the session gains.

However, Zalando tumbled by 6.29% on a weak clothing demand outlook and weaker-than-expected revenue.

German Trade Data in the Spotlight

On Friday, German trade data will set the tone for the European session. A marked narrowing in the trade surplus could fuel bets on a prolonged German recession. Economists forecast the German trade surplus to narrow from €16.6 billion to €16.3 billion in September. While the headline figure will influence, investors must consider exports and trade terms with the main trading partners.

Later in the morning session, Eurozone unemployment figures also need consideration. However, barring an expected rise in the unemployment rate, the numbers should have a limited impact on the DAX.

Beyond the economic calendar, corporate earnings results will move the dial. BMW, Vonovia, and Fresenius will release earnings results.

US Labor Market and Services in Focus

On Friday, the US Jobs Report and ISM Services PMI could close the door on the Fed rate hike cycle. Softer wage growth and a modest increase in nonfarm payrolls could give the Fed reason to hit the brakes in raising interest rates. The US GDP Report and labor market numbers from Thursday showed early signs of weakness in labor market conditions.

On Wednesday, Fed Chair Powell talked about needing softer labor market conditions to provide price stability.

Later in the European session, the US ISM Services PMI also warrants attention. An unexpected contraction in the US services sector could fuel fears of a hard landing.

The futures markets point to a mixed start to the Friday session. The DAX gained 77 points, with the Nasdaq mini down 41 points.

Short-Term Forecast

Corporate earnings and market sentiment toward central bank monetary policy remain the key drivers. Upbeat earnings and softer US labor market conditions could continue to support buyer demand for DAX-listed stocks.

DAX Technical Indicators

Daily Chart

The DAX sat below the 50-day and 200-day EMAs, sending bearish price signals.

A DAX break above the 15,247 resistance level and 50-day EMA would support a move to the 200-day EMA.

German corporate earnings, trade data and US stats will be the focal points.

However, a drop below 15,000 would give the bears a run at the 14,957 support level.

The 14-day RSI reading of 51.93 suggests a DAX break above the 50-day EMA before entering overbought territory.
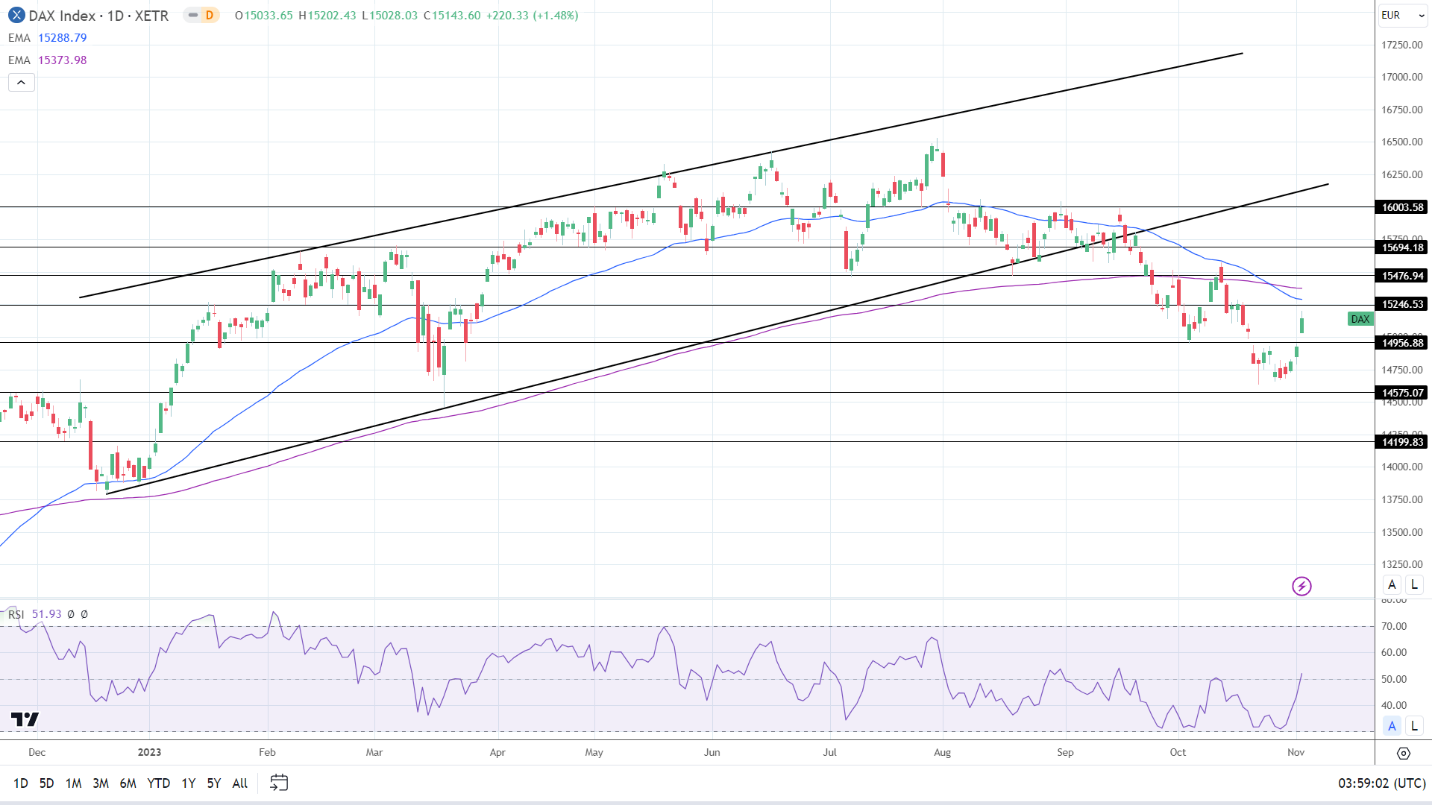
DAX Daily Chart sends bearish price signals.
DAX 031123 Daily Chart

4-Hourly Chart

The DAX sits above the 50-day EMA while remaining below the 200-day EMA, sending bullish near-term but bearish longer-term price signals. A DAX break above the 15,247 resistance level would support a run at the 200-day EMA.

However, a fall through the 50-day EMA would bring sub-15,000 and the 14,957 support level into play.

The 65.58 14-4 hour RSI reading suggests a DAX break above the 15,247 resistance level before entering overbought territory.
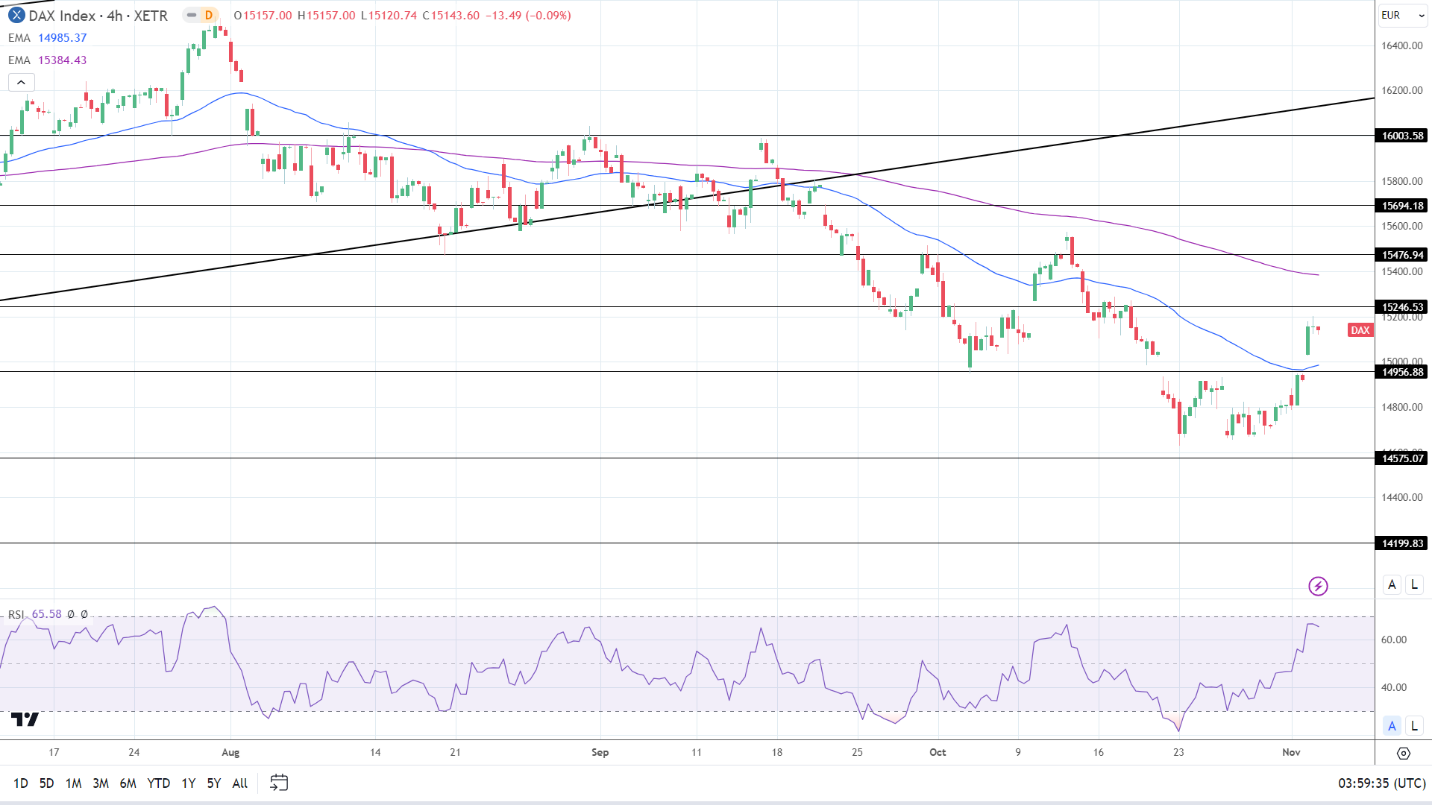
4-Hourly Chart sends bullish near-term price signals.
DAX 031123 4-Hourly Chart
EUR/USD Forecast: German Trade and US Jobs Report in Focus Pre-US ISM Services

EUR/USD Forecast: German Trade and US Jobs Report in Focus Pre-US ISM Services

Thursday Overview

The EUR/USD gained 0.49% on Thursday. Reversing a 0.04% slip from Wednesday, the EUR/USD ended the day at $1.06216. The EUR/USD fell to a low of $1.05645 before rising to a high of $1.06675.

German Trade and Eurozone Unemployment in Focus

On Friday, German trade data will kick-start the European session. Economists forecast the trade surplus to narrow from €16.6 billion to €16.3 billion in September. Beyond the headline figure, investors must consider exports. Recent manufacturing PMI numbers signaled a deteriorating demand environment. New business inflows fell at the most marked pace since May 2020.

Trading Derivatives carries a high level of risk to your capital and you should only trade with money you can afford to lose. Trading Derivatives may not be suitable for all investors, so please ensure that you fully understand the risks involved, and seek independent advice if necessary. A Product Disclosure Statement (PDS) can be obtained either from this website or on request from our offices and should be considered before entering into a transaction with us. Raw Spread accounts offer spreads from 0.0 pips with a commission charge of USD $3.50 per 100k traded. Standard account offer spreads from 1 pips with no additional commission charges. Spreads on CFD indices start at 0.4 points. The information on this site is not directed at residents in any country or jurisdiction where such distribution or use would be contrary to local law or regulation.

German exports of goods and services accounted for over 50% of the GDP. A weakening demand environment could raise fears of a prolonged German recession.

Other stats include French industrial production and unemployment figures for Italy and the Eurozone. However, the numbers are unlikely to materially influence the appetite for the EUR/USD, barring a surprise spike in unemployment.

The US Jobs Report and Services PMI in Focus

On Friday, the US Jobs Report and service sector PMI numbers will garner investor attention. Fed Chair Powell discussed needing softer labor market conditions for price stability. Labor market numbers on Thursday eased bets on Fed rate hikes. More modest wage growth and lower-than-expected nonfarm payrolls could close the door on Fed rate hikes.

A deteriorating labor market environment impacts wage growth, disposable income, and consumer confidence. The net effect is a pullback in spending, easing demand-driven inflationary pressures.

However, the ISM Services PMI will also move the dial. A slump in service sector activity could fuel fears of a hard landing. The US services sector contributes over 70% to the US economy. A slowdown in activity amidst a weakening consumption outlook may impact the appetite for the US dollar.

Short-Term Forecast:

EUR/USD trends hinge on the US labor market. A deterioration in labor market conditions could close the door on Fed rate hikes and give the EUR/USD a run at $1.07. However, concerns about the euro area economy remain headwinds for the EUR. Recent economic indicators demonstrated a deteriorating macroeconomic environment.

EUR/USD Price Action

Daily Chart

The EUR/USD sat below the 50-day and 200-day EMAs, sending bearish price signals.

A EUR/USD break above the $1.06342 resistance level and 50-day EMA would support a move to the 200-day EMA. German trade data and the US economic indicators will be the focal points on Thursday.

However, a EUR/USD fall below $1.06 would give the bears a run at the $1.05173 support level. Hotter-than-expected US wage growth and a pickup in US service sector activity could sink the EUR.

The 14-period Daily RSI, 53.15, indicates a EUR/USD return to $1.07 before entering overbought territory.
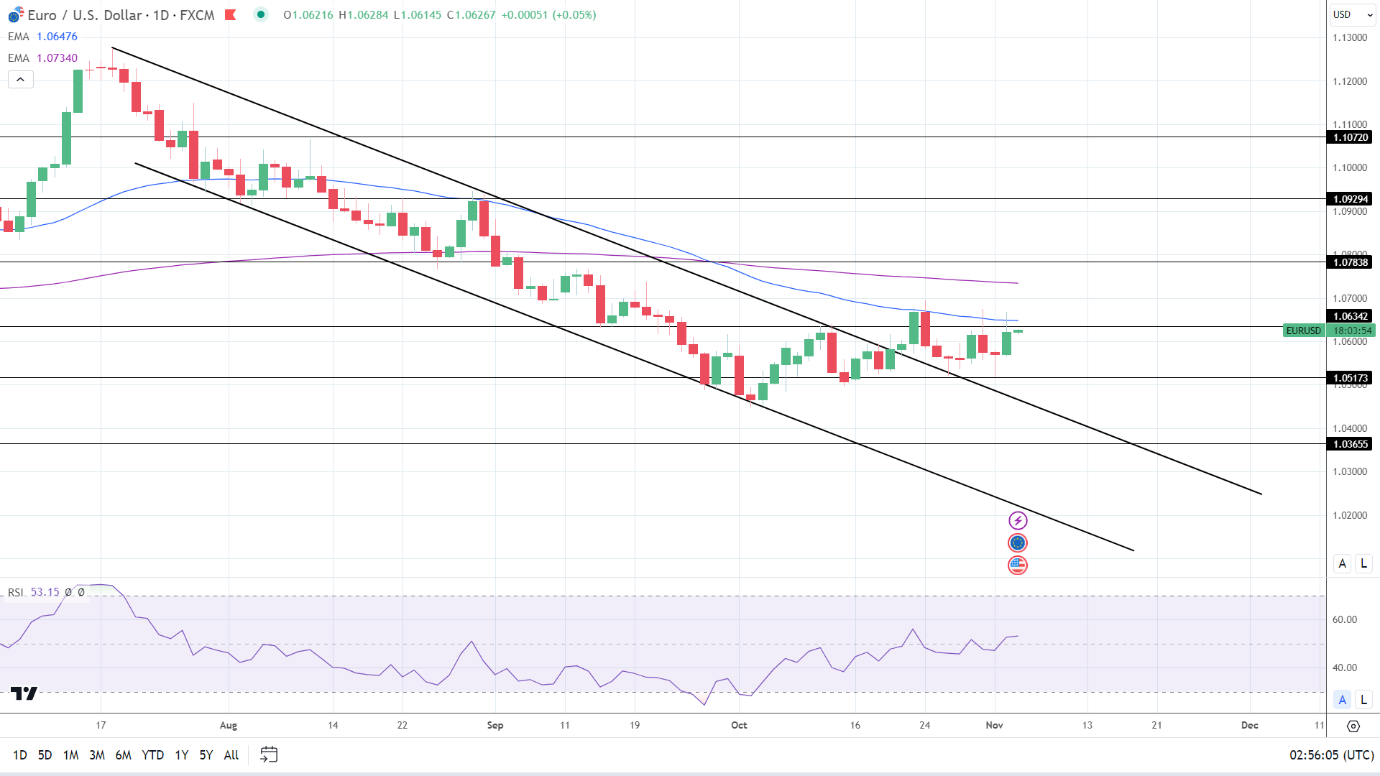
EUR/USD Daily Chart sends bearish price signals.
EURUSD 031123 Daily Chart

4-Hour Chart

The EUR/USD hovers above the 50-day and 200-day EMAs, sending bullish price signals.

A EUR/USD break above the $1.06342 resistance level would support a move to $1.07.

However, a fall through the 200-day and 50-day EMAs would give the bears a run at the $1.05173 support level.

The 14-period RSI on the 4-hour chart, 56.62, suggests a EUR/USD move to $1.07 before entering overbought territory.
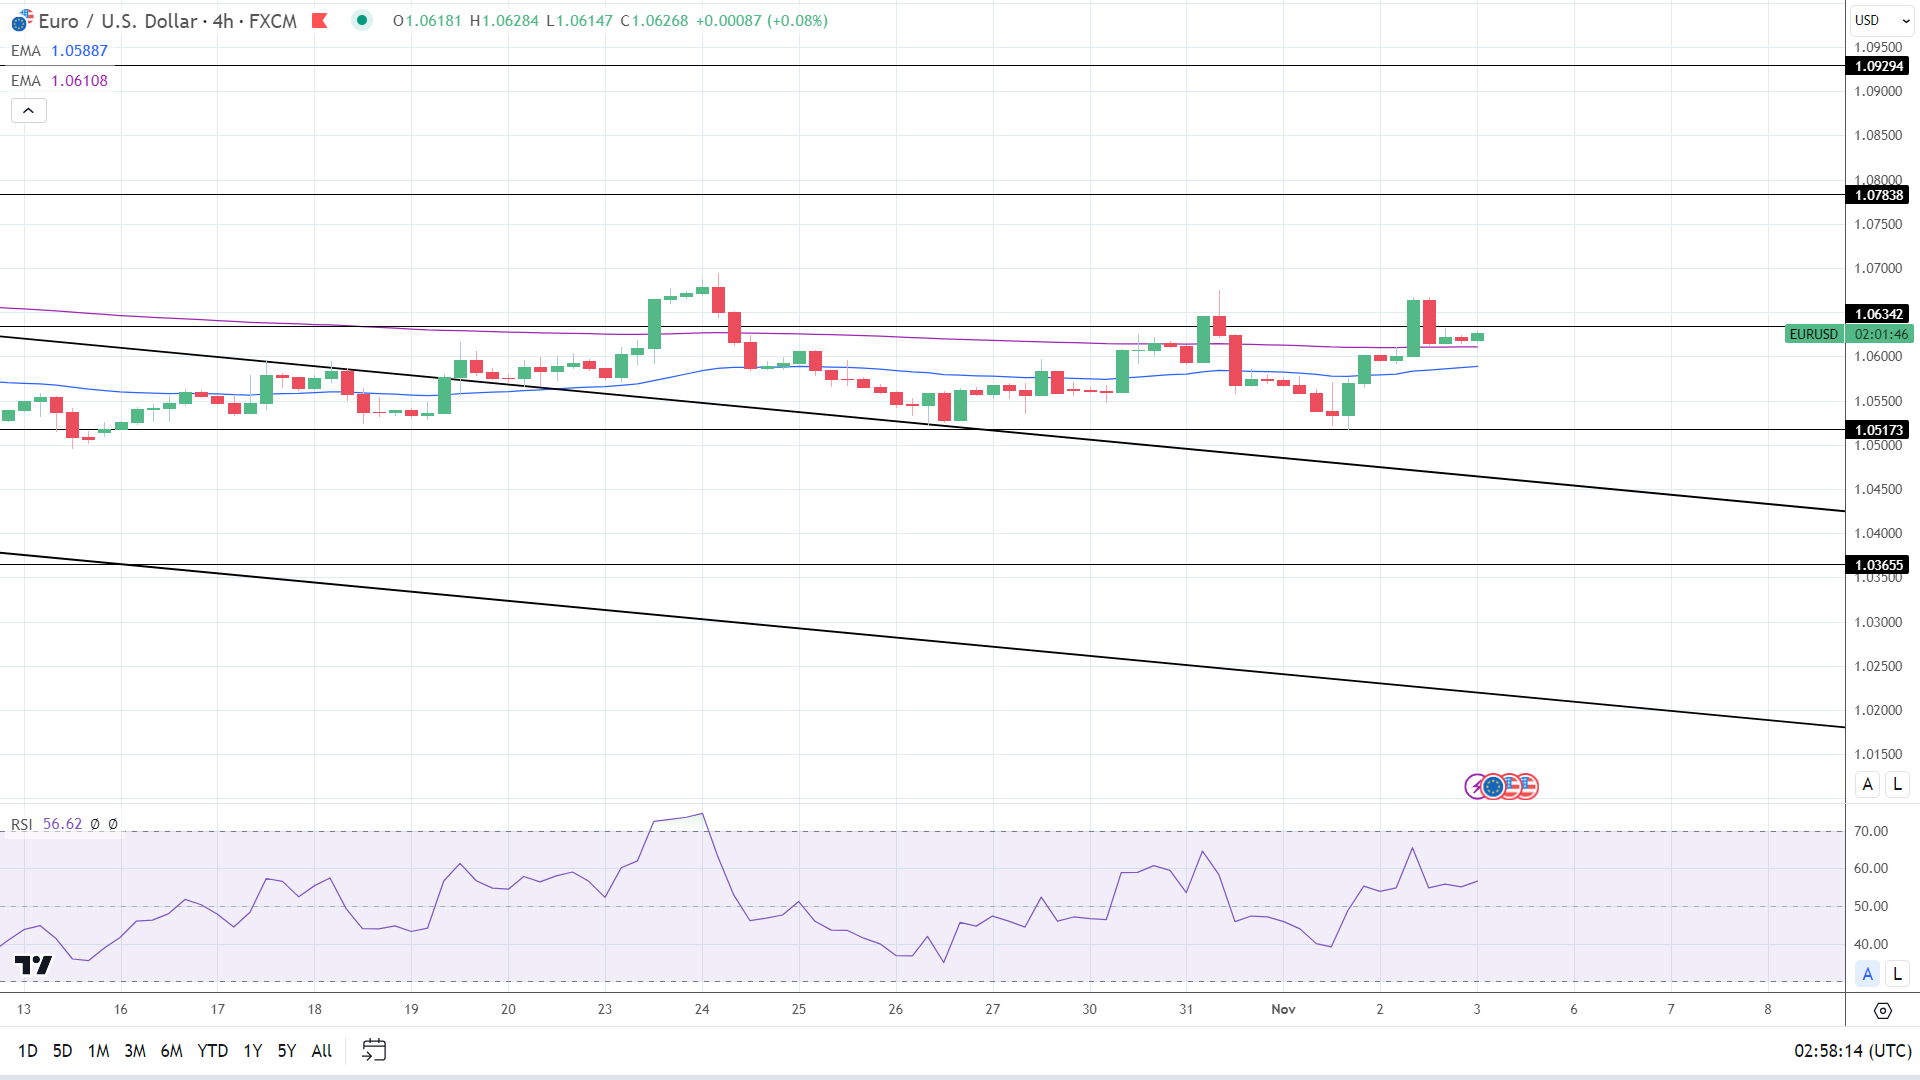
4-Hourly Chart sends bullish price signals.
EURUSD 031123 4 Hourly Chart
Gold Prices Forecast: Investors Eye Non-Farm Payrolls Data for XAU/USD Price Cues

Gold Prices Forecast: Investors Eye Non-Farm Payrolls Data for XAU/USD Price Cues

Gold Traders Awaiting Payrolls Data

Gold prices are currently in limbo, with investors holding their positions in anticipation of the upcoming U.S. October non-farm payrolls report. Spot gold remains relatively static at $1,986.49 per ounce, and futures similarly steady at $1,994.10.

Fed Decisions and Economic Indicators

The market’s inertia reflects broader uncertainty regarding the Federal Reserve’s next move on interest rates. This week’s status quo on rates has led to a lower dollar and Treasury yields, following recent signs of easing inflation and a softening labor market. These factors support a possible cessation of the Fed’s rate hikes for the year, with labor costs unexpectedly dipping and weekly jobless claims rising slightly.

Trading Derivatives carries a high level of risk to your capital and you should only trade with money you can afford to lose. Trading Derivatives may not be suitable for all investors, so please ensure that you fully understand the risks involved, and seek independent advice if necessary. A Product Disclosure Statement (PDS) can be obtained either from this website or on request from our offices and should be considered before entering into a transaction with us. Raw Spread accounts offer spreads from 0.0 pips with a commission charge of USD $3.50 per 100k traded. Standard account offer spreads from 1 pips with no additional commission charges. Spreads on CFD indices start at 0.4 points. The information on this site is not directed at residents in any country or jurisdiction where such distribution or use would be contrary to local law or regulation.

Investor Sentiment and Rate Outlook

Despite gold’s struggle to maintain its momentum beyond the pivotal $2,000 threshold, there is a latent optimism as markets speculate on an 80% probability that rates will remain unchanged in December. However, Fed Chairman Jerome Powell has maintained that the journey to subdue inflation is far from over, not discounting further rate hikes.

Upcoming Non-Farm Payrolls Report

Attention now pivots to the non-farm payrolls data, a potential catalyst for market movement. The forecast suggests an addition of 180,000 jobs, but a weaker than expected report could press Treasury yields lower, potentially propelling gold prices past the notable $2,000 mark.

Short-Term Gold Forecast

In the short term, gold’s direction is hinging on the payrolls outcome. A significantly softer labor market could undermine the Fed’s hawkish stance, offering bullion a chance to reclaim its recent peak. Conversely, a strong jobs report might reinforce the likelihood of further rate hikes, challenging gold’s safe-haven appeal amidst higher opportunity costs for holding the metal.

Technical Analysis

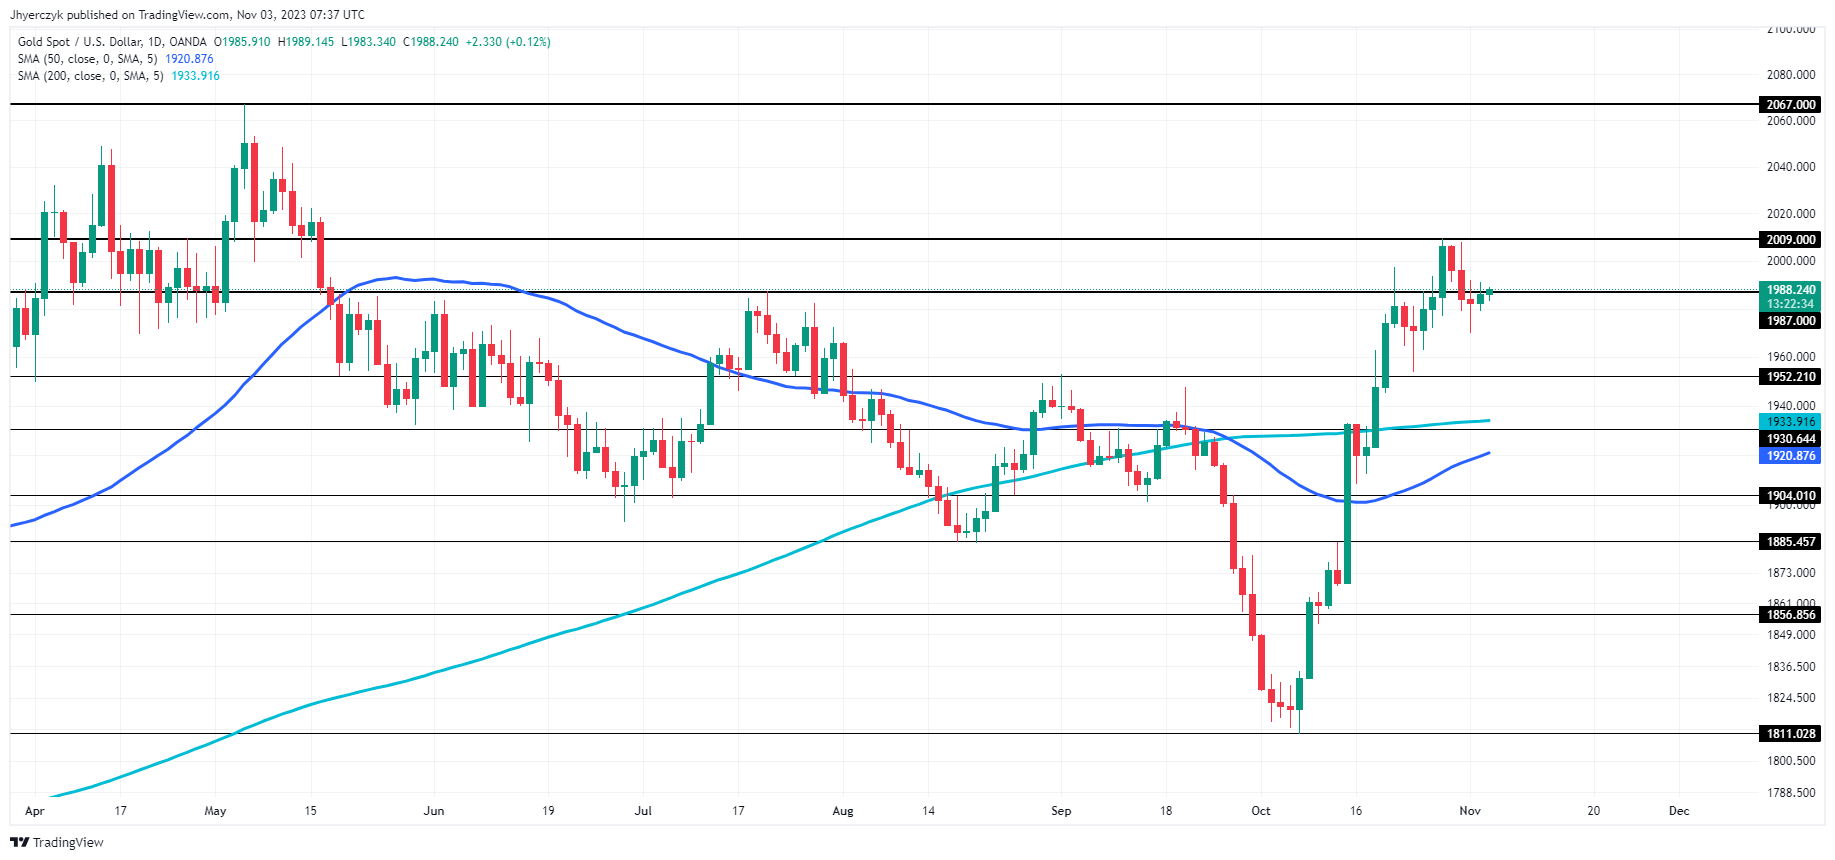
Daily Gold (XAU/USD)Gold (XAU/USD) is currently trading above both the 200-day and 50-day moving averages, suggesting a bullish bias in the medium to long term.

The current price of 1988.495 is marginally higher than the previous close, indicating a slight uptrend continuation. However, if it approaches minor resistance at 2009.00, the momentum might be tested. Breaching this could signal further upside potential towards the main resistance at 2067.00.

Conversely, should the price retreat, the main support at 1952.21 could serve as a crucial threshold to maintain the bullish outlook.

Current positioning favors cautiously optimistic sentiment with trader reaction to 1987.00 and the outcome of the U.S. Non-Farm Payrolls report setting the tone for the day.

Oil Prices Forecast: Lower for Second Week Amid Middle East, China Concerns

Oil Prices Forecast: Lower for Second Week Amid Middle East, China Concerns

Overview

Oil prices remained relatively stable on Friday, but they are poised for a second consecutive week of losses. The key drivers behind these developments are concerns over supply disruptions in the Middle East, a significant oil-producing region, and uncertainties surrounding the demand outlook, particularly in China, the world’s largest crude importer.

Key Facts

Brent crude futures experienced a modest uptick of 29 cents, equivalent to 0.3%, reaching a price of $87.14 per barrel by 0658 GMT. At the same time, U.S. West Texas Intermediate crude futures saw gains of 36 cents, or 0.4%, settling at $82.82 per barrel.

Trading Derivatives carries a high level of risk to your capital and you should only trade with money you can afford to lose. Trading Derivatives may not be suitable for all investors, so please ensure that you fully understand the risks involved, and seek independent advice if necessary. A Product Disclosure Statement (PDS) can be obtained either from this website or on request from our offices and should be considered before entering into a transaction with us. Raw Spread accounts offer spreads from 0.0 pips with a commission charge of USD $3.50 per 100k traded. Standard account offer spreads from 1 pips with no additional commission charges. Spreads on CFD indices start at 0.4 points. The information on this site is not directed at residents in any country or jurisdiction where such distribution or use would be contrary to local law or regulation.

Despite significant gains exceeding $2 per barrel on Thursday, Brent crude is currently on track to post weekly losses of approximately 4%, while West Texas Intermediate (WTI) is expected to conclude the week with a 3% decline compared to the previous week.

Oil prices have been influenced by the prevailing risk environment, with market participants cautiously optimistic that the U.S. Federal Reserve is nearing the conclusion of its interest rate hiking cycle. However, lingering reservations persist regarding the demand for oil, specifically in light of recent developments in China.

China’s PMI and Economic Concerns

In October, China’s manufacturing activity exhibited unexpected contraction, as the official purchasing managers’ index (PMI) dropped from 50.2 to 49.5, falling below the critical 50-point threshold that separates expansion from contraction. This decline underscores uncertainties surrounding demand revival in the country.

A private sector survey conducted on Friday revealed that China’s services sector experienced slightly faster growth in October. However, sales registered the softest rate in ten months, and employment stagnated, reflecting a decline in business confidence.

Short-term Forecast

In the immediate future, the oil market is expected to maintain a cautious stance, leaning more towards a bearish sentiment. This outlook is influenced by the easing of supply concerns in the Middle East and lingering uncertainties in China’s demand dynamics. With Brent crude potentially posting weekly losses of around 4% and WTI facing a 3% decline compared to the previous week, market participants should remain vigilant for potential fluctuations in the coming days.

Technical Analysis

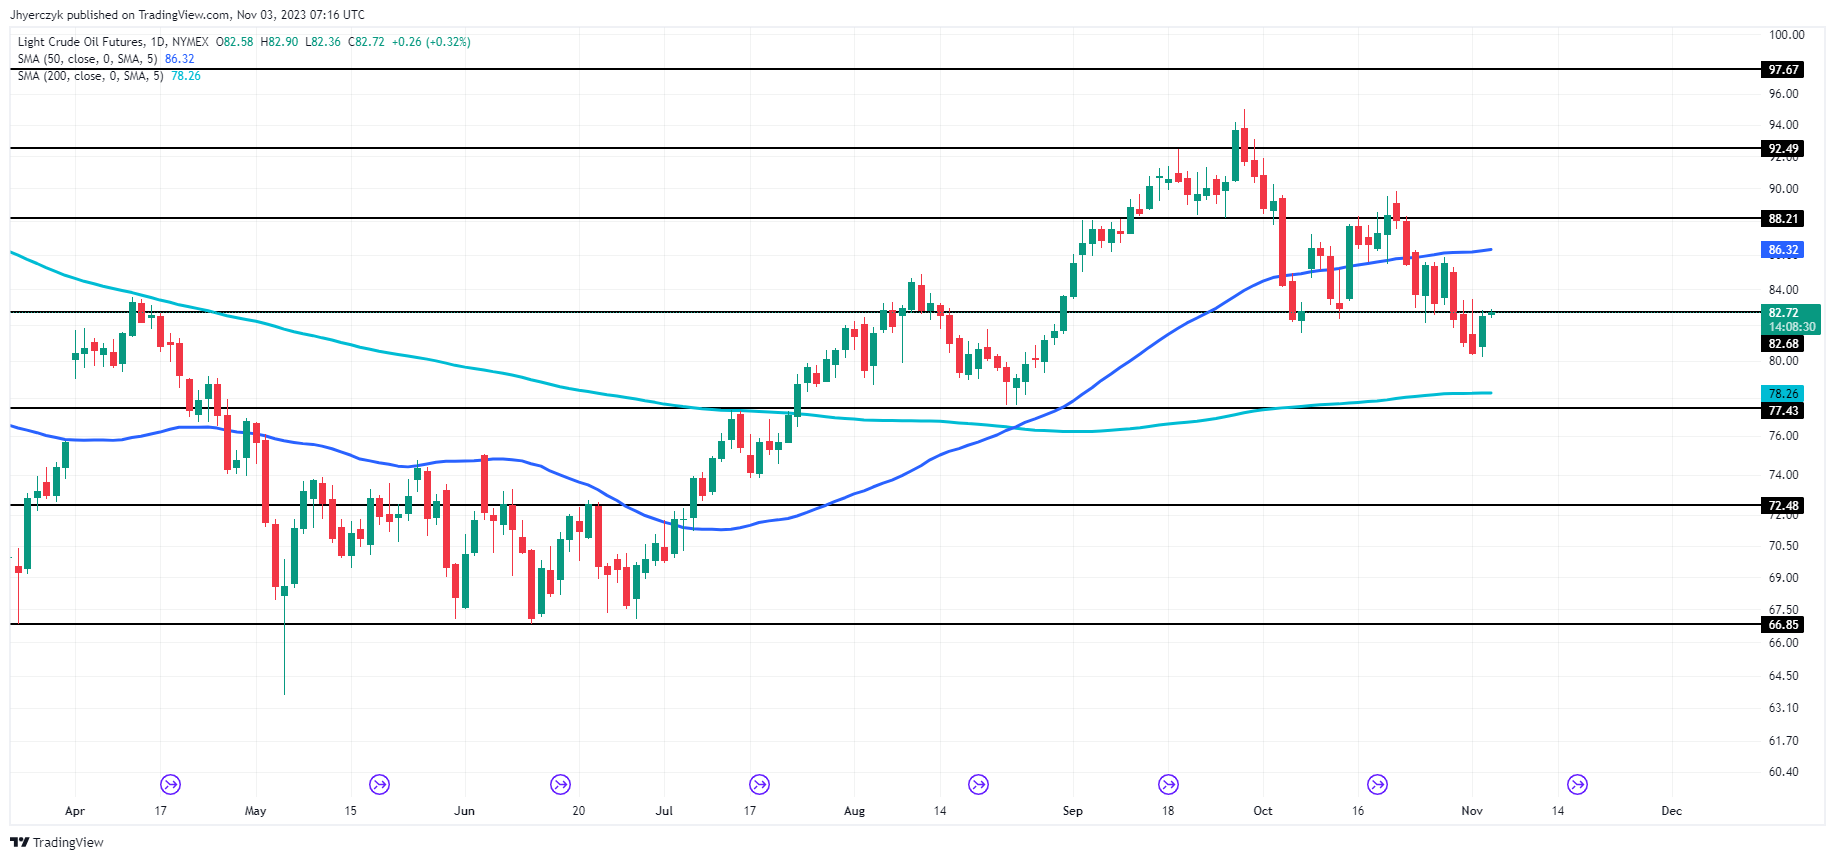
Daily Light Crude Oil FuturesLight crude oil futures edged marginally higher, trading at $82.69, just above the previous close of $82.46.

Currently, the price hovers above the minor resistance turned support at $82.68, suggesting a potential shift in sentiment.

The price remains nestled between the 200-day and 50-day moving averages, signaling a neutral zone but leans toward a bullish bias as it’s closer to the shorter-term 50-day MA at $86.32.

The proximity to minor resistance hints at a cautious optimism among traders.

Hang Seng Index, ASX 200, Nikkei 225: US Labor Market Stats Send Favorable Signals

Hang Seng Index, ASX 200, Nikkei 225: US Labor Market Stats Send Favorable Signals

Overview of the Thursday Session

On Thursday, the Nikkei led the Hang Seng Index and the ASX 200 into positive territory. Asian market investors reacted to the Fed interest rate decision and press conference.

Before the Fed interest rate decision, US economic indicators were market-friendly. The ADP reported a lower-than-expected increase in employment, with the ISM Manufacturing PMI also reflecting a softer labor market.

Trading Derivatives carries a high level of risk to your capital and you should only trade with money you can afford to lose. Trading Derivatives may not be suitable for all investors, so please ensure that you fully understand the risks involved, and seek independent advice if necessary. A Product Disclosure Statement (PDS) can be obtained either from this website or on request from our offices and should be considered before entering into a transaction with us. Raw Spread accounts offer spreads from 0.0 pips with a commission charge of USD $3.50 per 100k traded. Standard account offer spreads from 1 pips with no additional commission charges. Spreads on CFD indices start at 0.4 points. The information on this site is not directed at residents in any country or jurisdiction where such distribution or use would be contrary to local law or regulation.

The US equity markets responded to stats and the Fed, with the Nasdaq Composite Index rallying 1.64%. On Wednesday, the Dow and S&P 500 ended the Wednesday session up 0.67% and 1.05%, respectively.

From the Asian economic calendar on Thursday, weaker-than-expected Australian housing and trade data failed to spook investors,

The Services Sector in Focus with One Eye on China

Overnight US economic indicators from Thursday and the US equity markets will set the tone. The US labor market was in focus. Weaker-than-expected jobless claims and unit labor costs supported bets on the Fed ending its rate hike cycle. Corporate earnings were also in the spotlight, with Apple Inc. (AAPL) among the big names releasing results.

On Thursday, the S&P 500 rallied 1.89%, with the Nasdaq Composite Index and Dow gaining 1.78% and 1.70%, respectively.

However, the Asian economic calendar also needs consideration on Friday. Service sector PMI numbers from Australia and China will garner investor interest. An unexpected contraction in China’s services sector would impact market risk sentiment. Economists forecast the China Caixin Services PMI to increase from 50.2 to 50.4 in October.

Finalized figures revealed that the Australian Judo Bank Services PMI tumbled from 51.8 to 47.9 in October.

Away from the economic calendar, earnings will also be in the spotlight, with Alibaba (9988) releasing earnings results.

In the futures markets on Friday, the ASX 200 was up 85 points. The Japanese markets are closed for Culture Day.

ASX 200

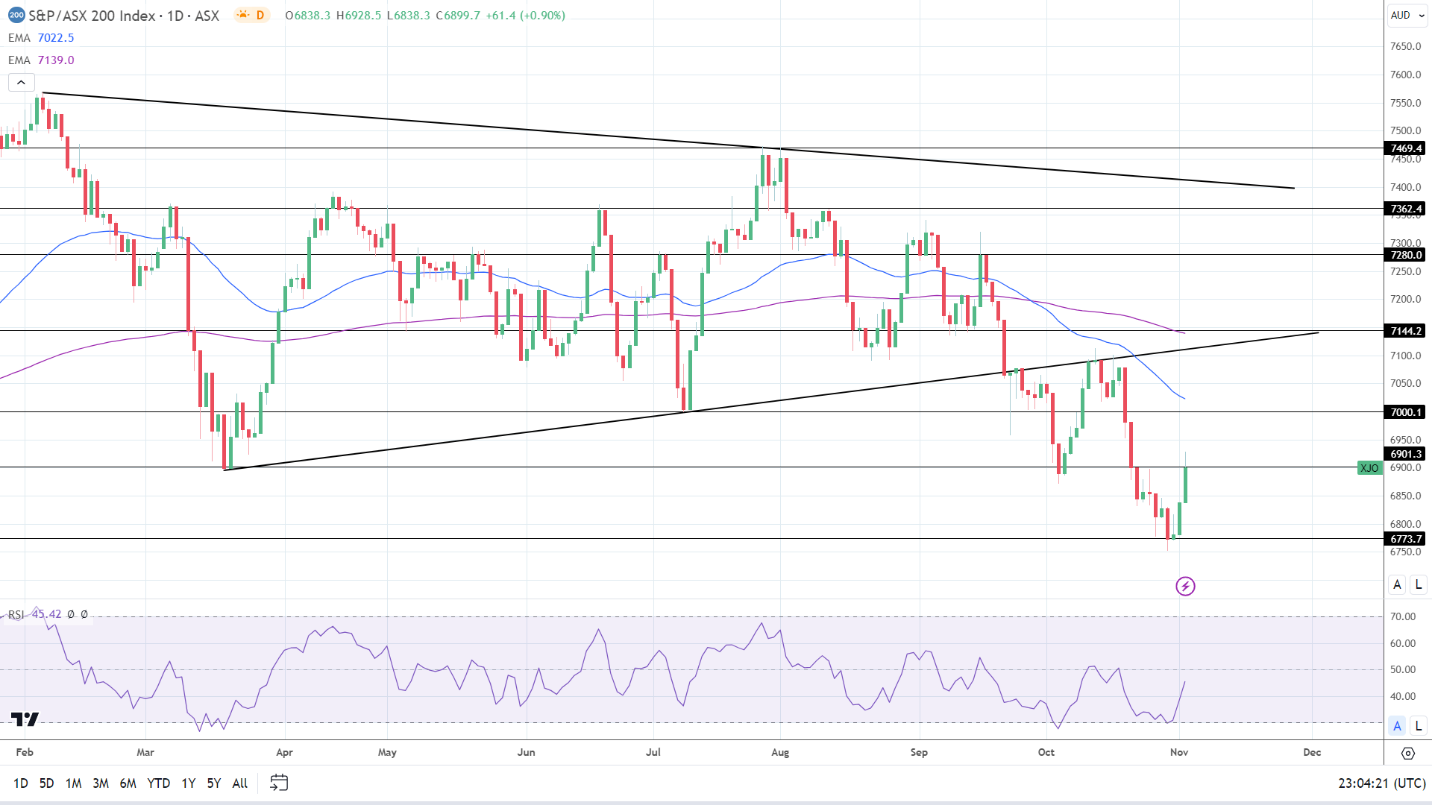
ASX 200 enjoyed a bullish Thursday.

ASX200 031123 Daily ChartThe ASX 200 rallied by 0.90% on Thursday. Tech stocks led the way, with the S&P/ASX 200 Information Technology Index (XIJ) rallying 3.71%. The S&P/ASX 200 All Technology Index (XTX) surged by 3.81%.

Bank stocks also enjoyed a positive session. ANZ Group Holdings Ltd (ANZ) and Westpac Banking Corp. (WBC) ended the day up 2.01% and 2.07%. The Commonwealth Bank of Australia (CBA) and National Australia Bank Ltd. (NAB) rose by 1.61% and 1.46%.

Mining stocks contributed to the positive session. BHP Group Ltd (BHP) and Rio Tinto Ltd. (RIO) saw gains of 0.42% and 1.10%. Fortescue Metals Group Ltd. (FMG) gained 1.71%.

However, oil stocks bucked the broader market trend. Woodside Energy Group Ltd (WDS) and Santos Ltd (STO) ended the day with losses of 2.48% and 2.97%, respectively. On Thursday, the Federal Court suspended work on the Barossa Gas Project pipeline until November 13.

Hang Seng Index

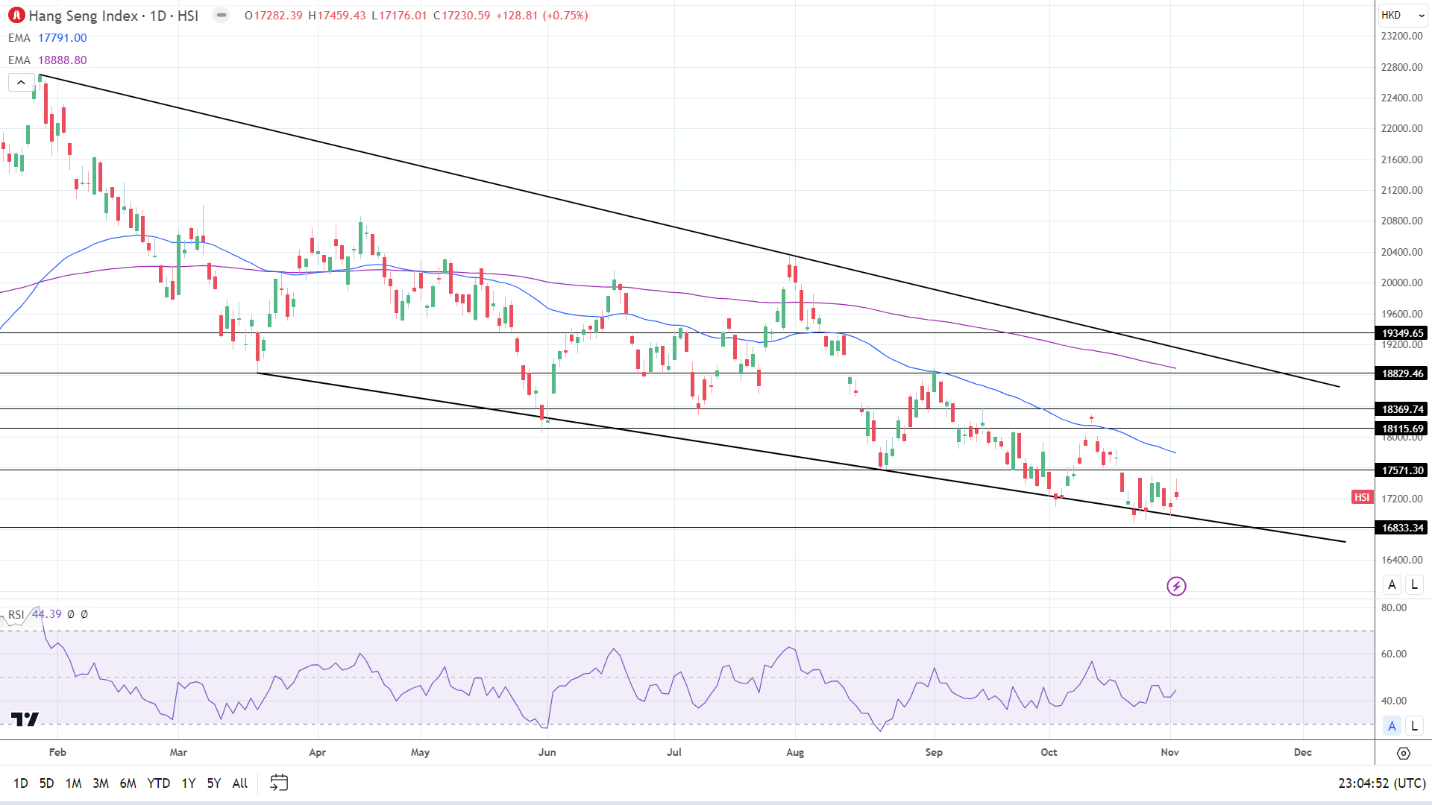
Hang Seng Index joins the broader market in positive territory.

HSI 031123 Daily ChartThe Hang Seng Index gained 0.78% on Thursday as investors responded to the HKMA holding interest rates unchanged.

Alibaba (9988) and Tencent (0700) ended the day up 1.13% and 0.56%, respectively.

However, bank stocks had a mixed session. HSCB (0005) and China Construction Bank (0939) ended the day up 0.18% and 0.45%. Industrial and Commercial Bank (1398) ended the day down 0.53%.

The Nikkei 225

Nikkei led the way on Thursday.

Nikkei 031123 Daily Chart(Graph for reference purposes only)

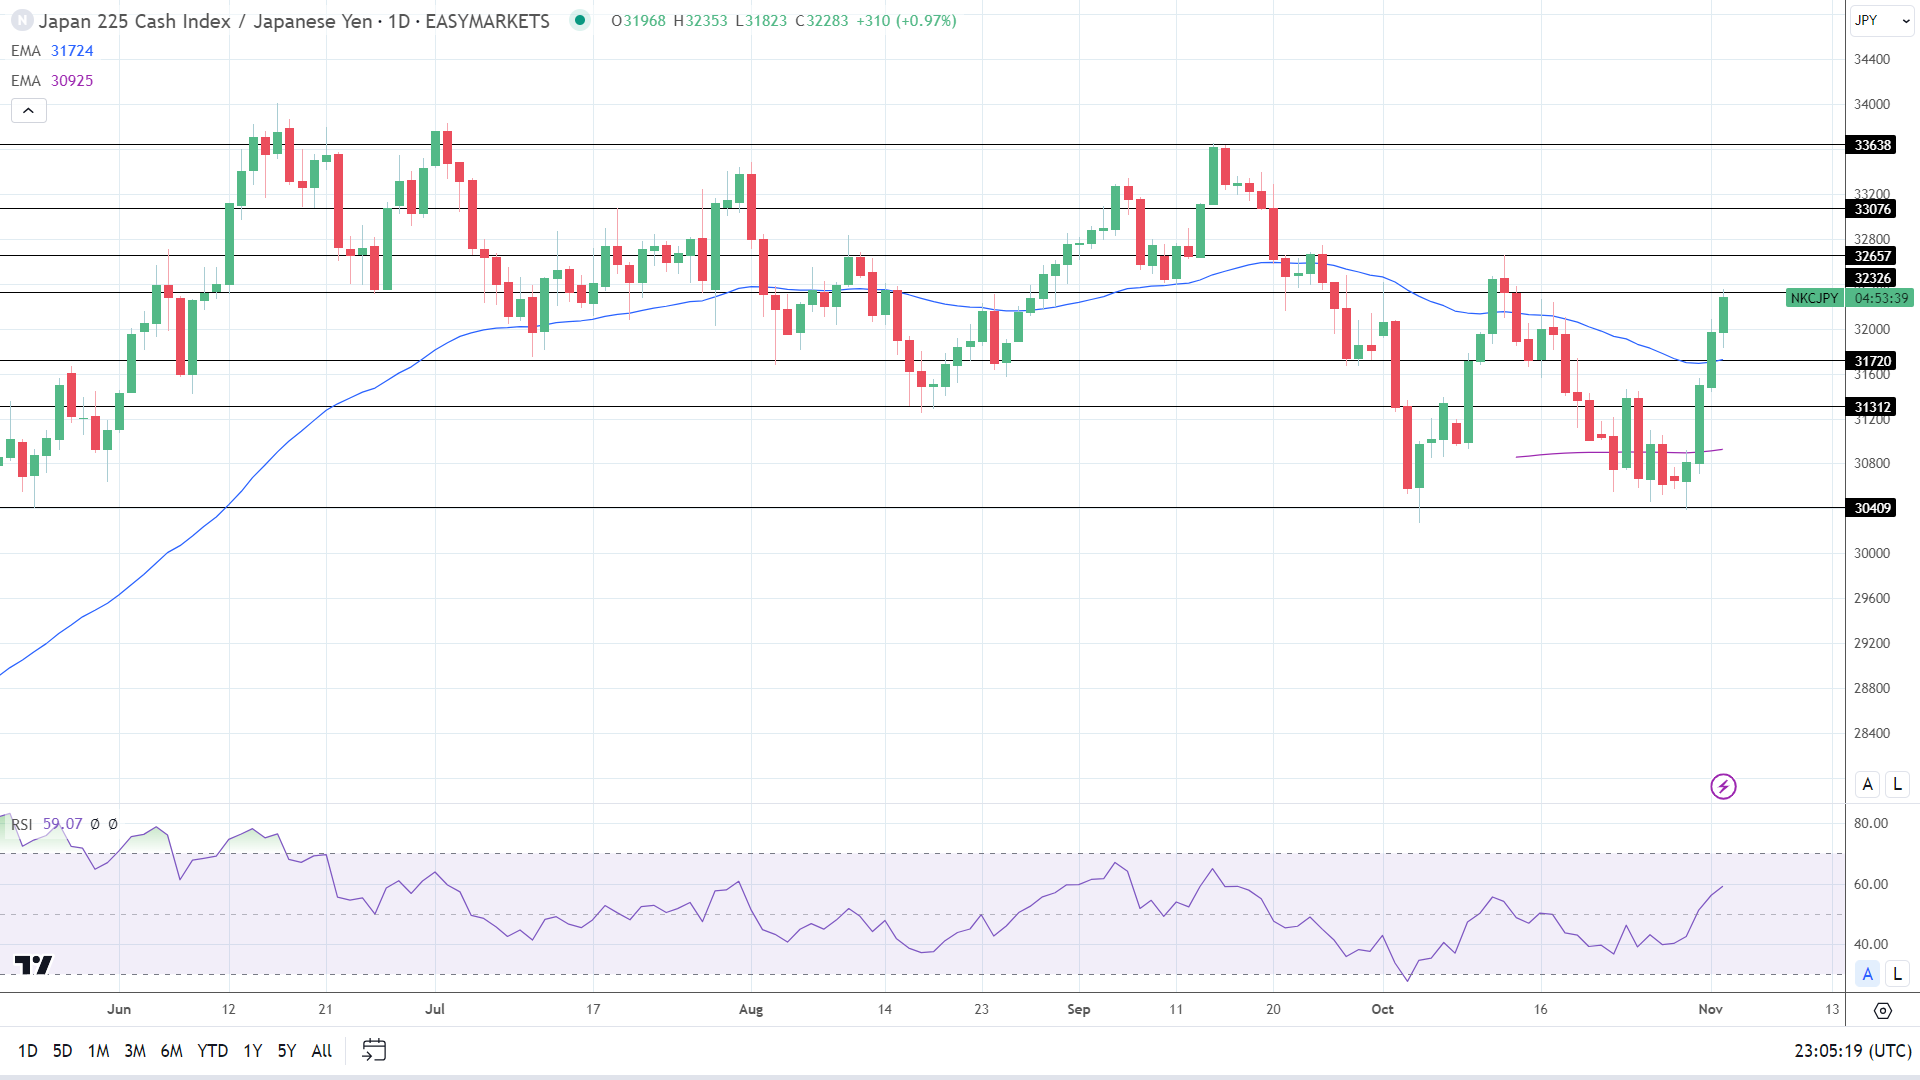
The Nikkei rallied 1.10% on Thursday. New stimulus measures to boost wages and demand contributed to the gains. The Japanese government rolled out a ¥17 trillion stimulus package on Thursday.

Sumitomo Mitsui Financial Group (8316) and Mitsubishi UFJ Financial Group (8306) rose by 0.50% and 0.12%.

Tokyo Electron (8035) surged by 3.29%, with Softbank (9984) and Fast Retailing (9983) seeing gains of 1.50% and 1.09%. Sony Corp rose by 0.43%, while KIDDI Corp. (9433) declined by 1.74%.

XRP News: XRP Gets Dubai Financial Services Authority Approval

XRP News: XRP Gets Dubai Financial Services Authority Approval

The Thursday Overview

On Thursday, XRP declined by 0.44%. Following a 1.42% gain on Wednesday, XRP ended the day at $0.6058. Notably, XRP ended a five-session winning streak.

XRP Gets Green Light for the Dubai International Financial Center

On Thursday, Ripple announced the approval of XRP under the virtual asset regime of the Dubai Financial Services Authority (DFSA), saying,

Trading Derivatives carries a high level of risk to your capital and you should only trade with money you can afford to lose. Trading Derivatives may not be suitable for all investors, so please ensure that you fully understand the risks involved, and seek independent advice if necessary. A Product Disclosure Statement (PDS) can be obtained either from this website or on request from our offices and should be considered before entering into a transaction with us. Raw Spread accounts offer spreads from 0.0 pips with a commission charge of USD $3.50 per 100k traded. Standard account offer spreads from 1 pips with no additional commission charges. Spreads on CFD indices start at 0.4 points. The information on this site is not directed at residents in any country or jurisdiction where such distribution or use would be contrary to local law or regulation.

“Today, the Dubai Financial Services Authority (DFSA) approved XRP under its virtual assets regime – allowing licensed firms in the Dubai International Financial Centre (DIFC) to incorporate XRP into their virtual asset services.”

According to the official announcement,

“Since the DFSA opened up external applications, XRP is the first virtual asset to be approved by the regime. XRP joins BTC, ETH, and LTC as the assets previously approved under the DFSA’s virtual asset regime. XRP now stands to benefit from legal and regulatory clarity in the DIFC, and will be available for use by institutions located in the DIFC to accelerate faster, more efficient global value exchange.”

Ripple CEO Brad Garlinghouse said,

“Dubai continues to demonstrate global leadership when it comes to the regulation of virtual assets and nurturing innovation. It’s refreshing to see the DFSA encourage the adoption and use of digital assets such as XRP to position Dubai as a leading financial services hub, intent on attracting foreign investment and accelerating economic growth.”

Garlinghouse added,

“Ripple will continue to double down on its presence in Dubai and we look forward to continuing to work closely with regulators to realize crypto’s full potential.”

Ripple Chief Legal Officer Stuart Alderoty had this to say about the news,

“Doing business in the DIFC free zone puts you under a regulator (DFSA) that is providing clear guidance and rulebooks – no wonder entrepreneurs are flocking to Dubai.”

Dubai: A World Apart from the SEC and the US Crypto Regulatory Landscape

On Thursday, there were no SEC v Ripple case-related updates for investors to consider. Notably, the news from Dubai contrasts with the lack of progress toward a regulatory framework in the US. The US digital asset space remains at the mercy of the SEC and its regulation-by-enforcement mantra.

SEC Chair Gary Gensler echoed the anti-crypto stance of the US Administration during the Halloween holidays. Despite the lack of a definitive law placing cryptos in the securities basket, Gensler targeted the US crypto space, saying,

“If Satoshi Nakamoto went as Satoshi Nakamoto for Halloween, would we be able to tell? Happy 15th Anniversary to Satoshi’s famous white paper that started crypto. Any crypto companies that are tricking investors should start treating them to compliance with securities laws.”

SEC Chair Gensler’s anti-crypto rhetoric may continue to push the crypto market beyond US borders.

XRP Price Action

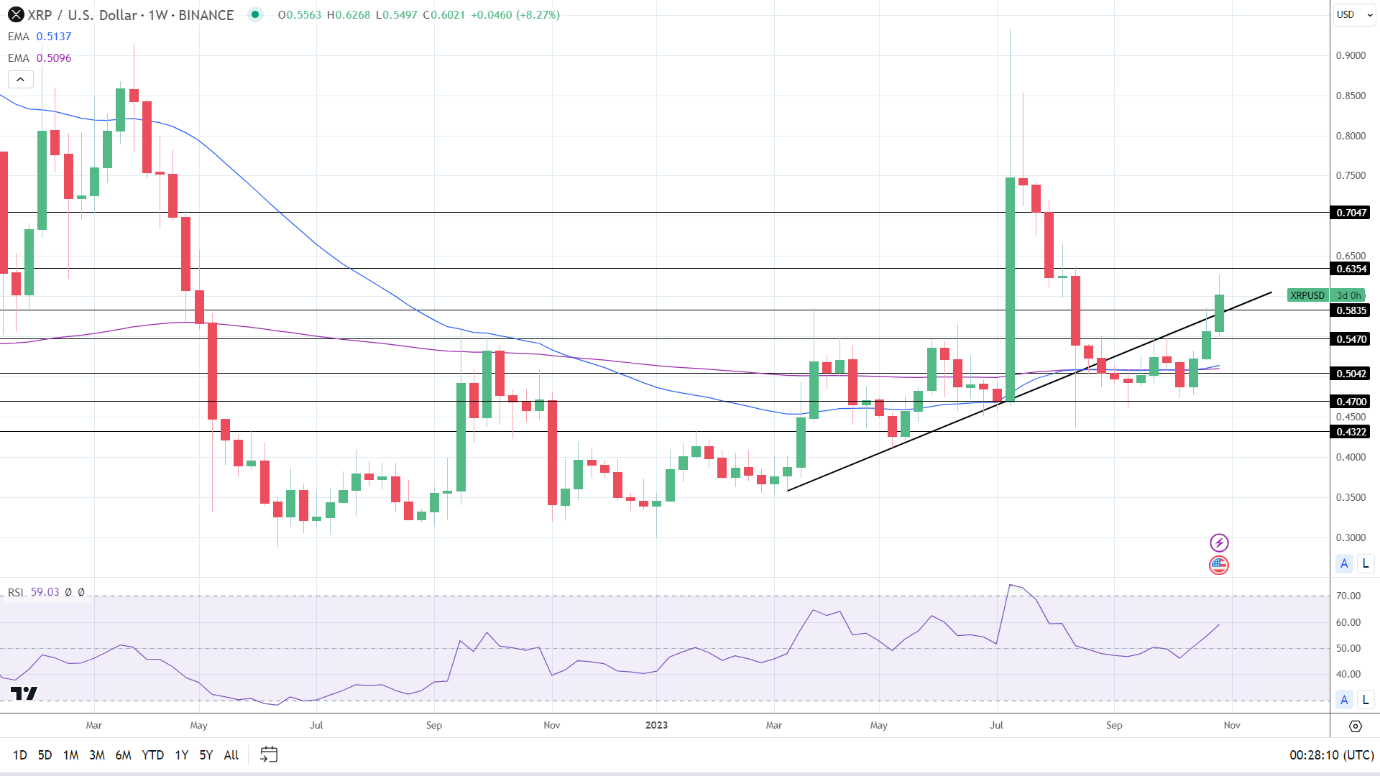
Weekly Chart sends bullish price signals.
XRPUSD 031123 Weekly Chart

Daily Chart

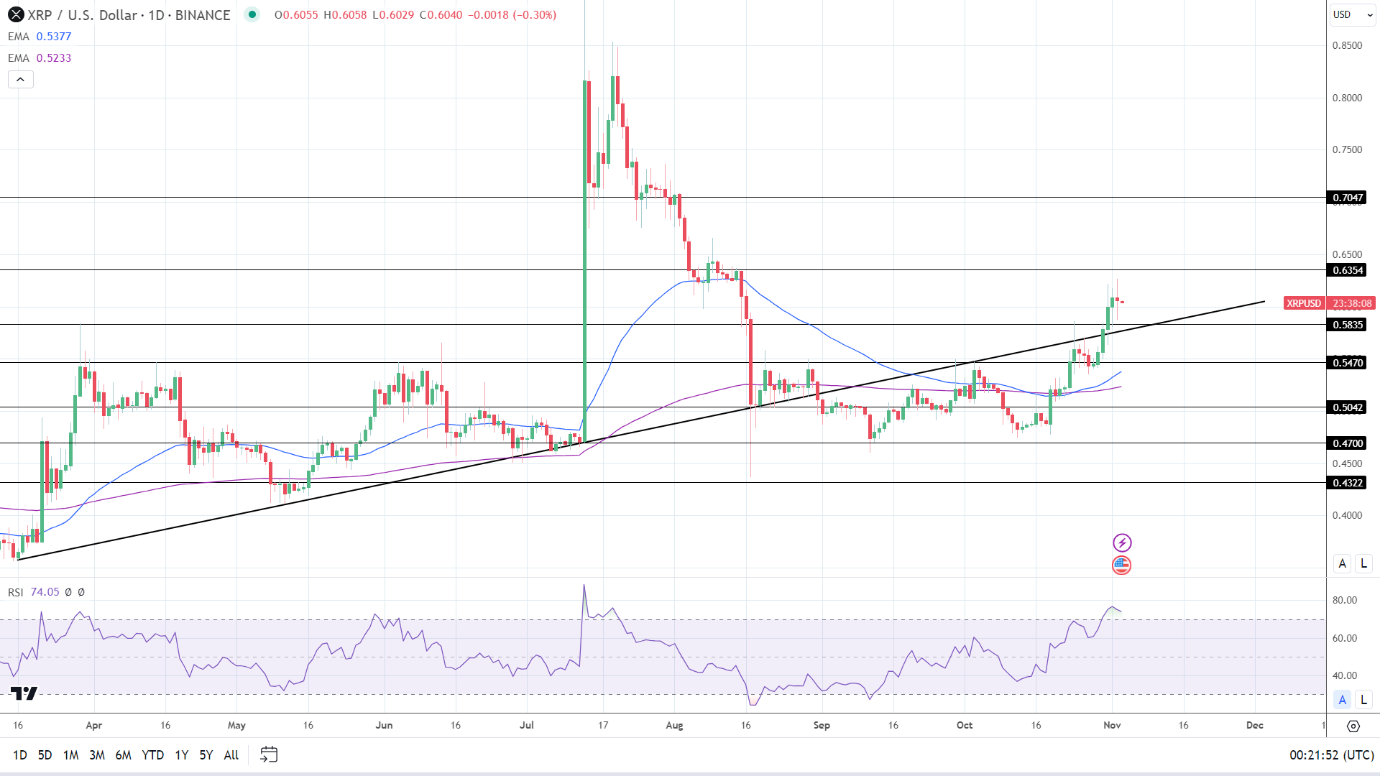
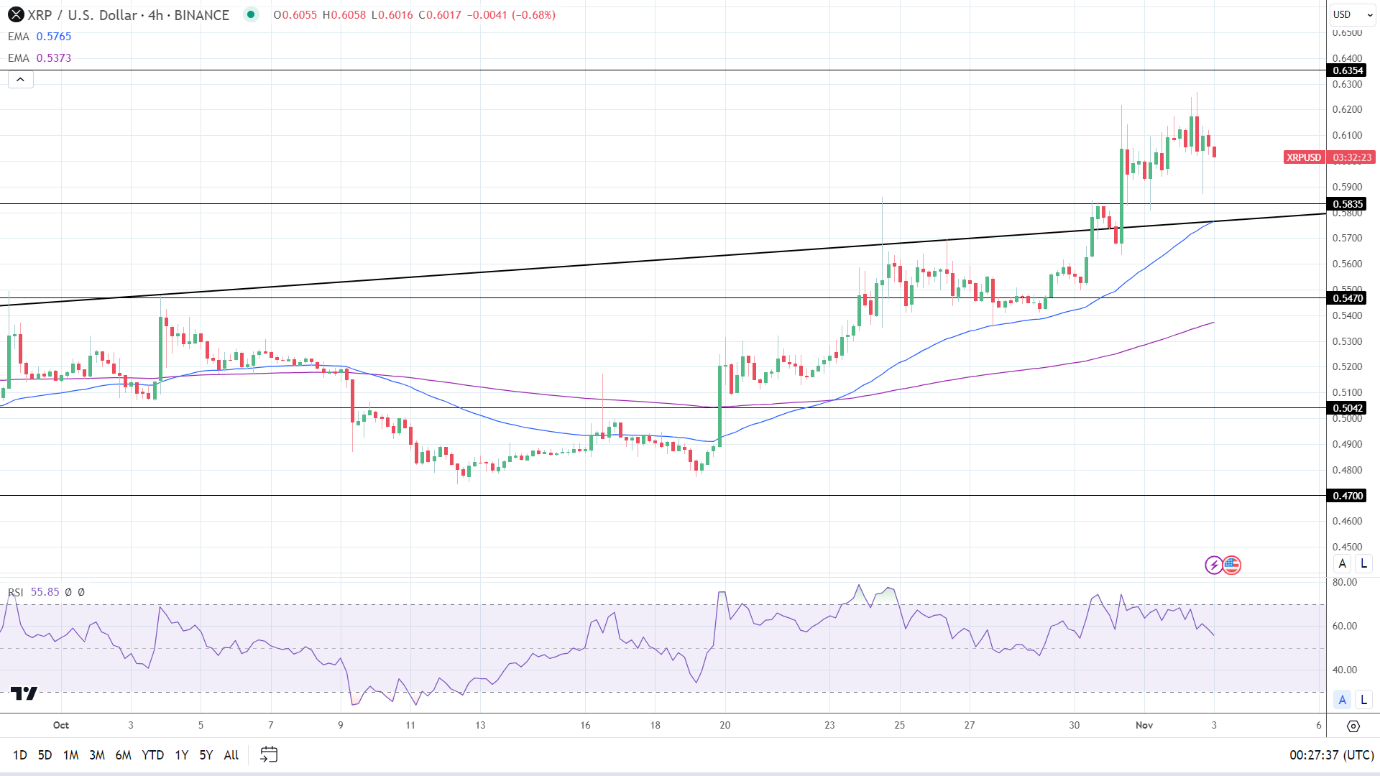
XRP remained above the 50-day and 200-day EMAs. An XRP move through the Thursday high of $0.6268 would give the bulls a run at the $0.6354 resistance level.

SEC activity and crypto-spot ETF-related news will remain focal points.

An XRP break below the $0.5835 support level and the trend line would bring the $0.5470 support level into play.

The 74.05 14-day RSI reading shows XRP in overbought territory. XRP may succumb to increasing selling pressure, barring a market catalyst.

XRP Daily Chart sends bullish price signals with the EMAs.
XRPUSD 031123 Daily Chart

4-Hourly Chart

In the 4-hourly Chart, XRP holds above the 50-day and 200-day EMAs, sending bullish price signals.

An XRP return to $0.63 would support a move to the $0.6354 resistance level.

However, a fall through the $0.5835 support level would give the bears a run at the trend line and the 50-day EMA. Buying pressure may intensify at $0.5765. The 50-day EMA is confluent with the trend line.

The 4-hourly RSI, with a reading of 55.85, suggests an XRP return to $0.62 before entering overbought territory.

XRP 4-Hourly Chart reaffirms bullish price signals.
XRPUSD 031123 4-Hourly Chart
Fibonacci in the Forex Market

Fibonacci in the Forex Market

Fibonacci in the Forex Market

Forex traders utilize Fibonacci retracements to aid in identifying possible key levels of support and resistance. These levels are used as guidelines for traders looking to enter or exit the market along with appropriate risk management techniques.

How to Create a Fibonacci Retracement on a Forex Pair

Before delving deeper into practical examples, traders need to have a basic view of the overall market being analyzed (EUR/USD or USD/ZAR etc.). This starts by identifying the trend; this can be long, medium or short-term depending on trading style. There are various methods that can be used to identify the trend such as simple price action, indicators like Moving Averages (MA) , as well as other methods. The reason why identifying the trend is important is because the Fibonacci tool itself does not determine a trend bias, rather it identifies key support and resistance levels.

Further your knowledge on trend trading

Implementing the Fibonacci retracement requires identifying a large move either up/down on the forex price chart. This will produce key levels using Fibonacci metrics. The dueling nature of a forex pair has the tendency for mean reversion, which can produce major moves from which Fibonacci retracements can be drawn.

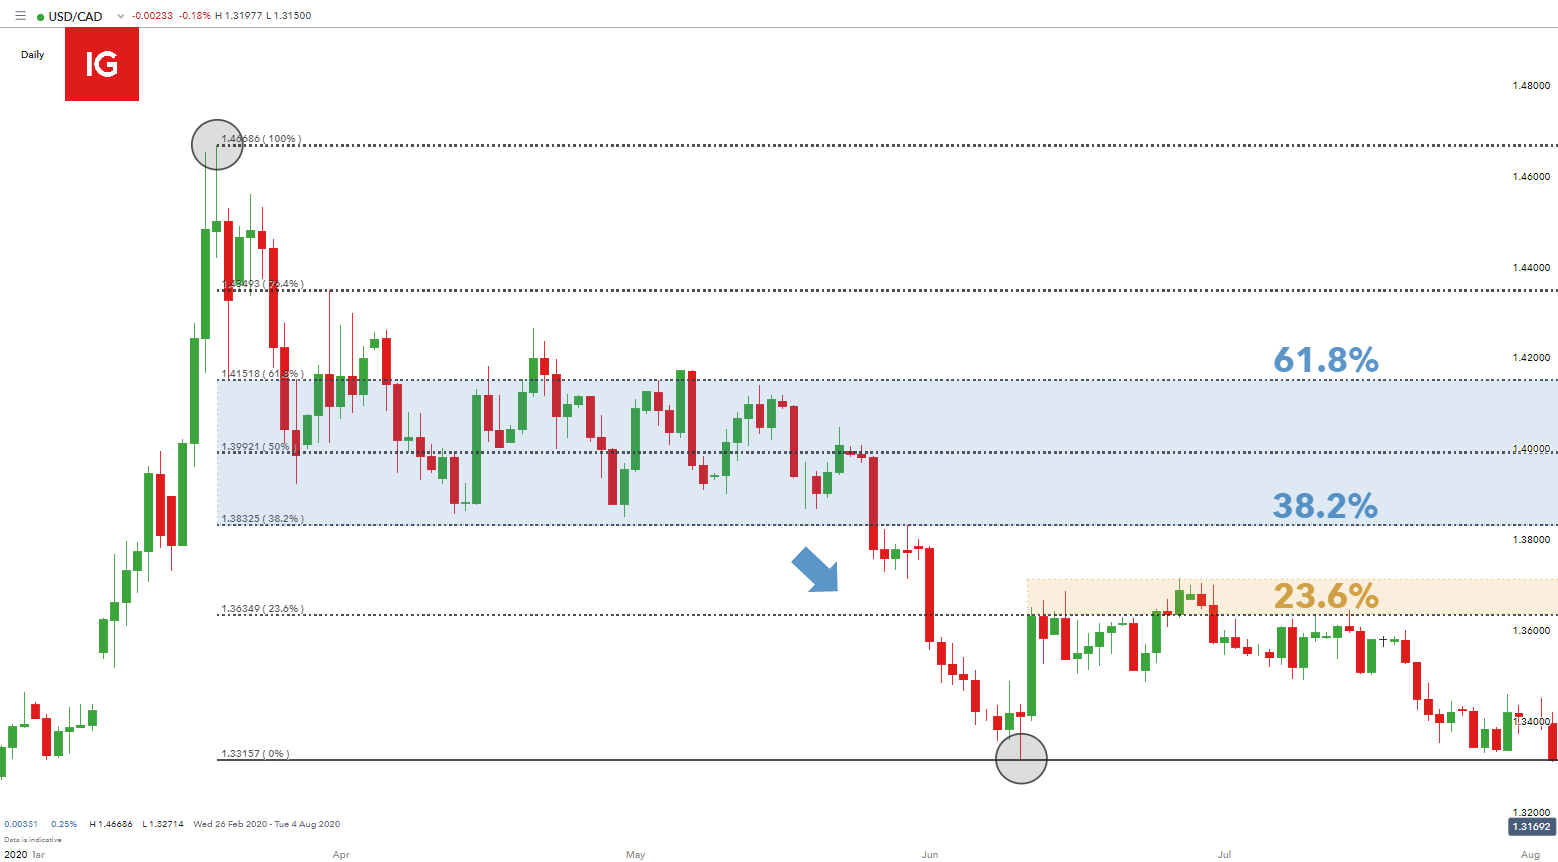
The key levels to look out for are the 38.2% and 61.8% respectively. The 50% level is not technically a Fibonacci level but is often included in charting packages and regarded as an important threshold. This level simply marks half the market move between the initial high and low or vice versa. The chart below shows a simple implementation of the Fibonacci retracement on a GBP/ZAR daily chart. Highlighted in black are the respective low to high points which are used to plot the Fibonacci levels.

GBP/ZAR daily chart – uptrend:

Once the Fibonacci retracement is drawn, traders can use these price levels for possible entry and exit signals. The USD/CAD example below shows how price action tends to revert to the various Fibonacci levels. The blue rectangle highlights the area between the 61.8% and 38.2% Fibonacci levels. It is evident that price respects these two key support and resistance points. Traders may look to enter into short positions at the 61.8% – as a result of the preceding downward trend, with initial support coming from the 38.2% level.

It is important to note that the Fibonacci points should not be seen as concrete levels but rather guidelines or reference points. Price will not always trade at these exact levels. It is common to see price just falling short or pushing passed a level which can frustrate traders who look at exact levels. With reference to stop and limit orders, traders should give themselves some leeway for potential price fluctuations around the Fibonacci level. The chart below shows an example of this above the 23.6% level (yellow) where bulls are seen pushing price up but quickly reverting back down below the 23.6% level.

USD/CAD daily chart:

This is the most simplistic form of the Fibonacci retracement within forex markets. The versatility of the Fibonacci retracement function means that it is not limited to one time frame as seen above. A more complicated approach involves several Fibonacci retracements across different time frames. Instituting multiple time frame analysis can allow for multiple Fibonacci retracements drawn from major moves. The next article in the Fibonacci series will go into more depth with and practical examples to show how exactly traders can implement this strategy.

Fibonacci Retracements to Help to See the Bigger Picture

Forex traders often make the mistake of relying solely on Fibonacci levels to take positions in the market but this can be detrimental as this can make them too one dimensional. Additional support from other indicators, chart patterns, candlestick patterns and fundamentals are essential to formulate a better overall strategy; and ultimately a well-informed trade decision. The Fibonacci can be an extremely powerful tool in forex trading so fully understanding its foundations can be beneficial to any trader looking to implement the tool within their trading strategy.

Gold Price Forecast – Gold Markets Recover Slightly on Thursday

Gold Price Forecast – Gold Markets Recover Slightly on Thursday

Gold Market Technical Analysis

Gold markets rallied a bit during the trading session on Thursday, as we continue to flirt with the $2000 level. The $2000 level is a large, round, psychologically significant figure, and an area where a lot of people will be paying close attention to. We have sliced through here a couple of times, so it may have lost some of its efficacy, but at the end of the day it certainly looks as though the market is trying to do everything you can to go higher.

Trading Derivatives carries a high level of risk to your capital and you should only trade with money you can afford to lose. Trading Derivatives may not be suitable for all investors, so please ensure that you fully understand the risks involved, and seek independent advice if necessary. A Product Disclosure Statement (PDS) can be obtained either from this website or on request from our offices and should be considered before entering into a transaction with us. Raw Spread accounts offer spreads from 0.0 pips with a commission charge of USD $3.50 per 100k traded. Standard account offer spreads from 1 pips with no additional commission charges. Spreads on CFD indices start at 0.4 points. The information on this site is not directed at residents in any country or jurisdiction where such distribution or use would be contrary to local law or regulation.

If we do break down below the support candlestick on Thursday, the market is likely to continue to go much lower, perhaps reaching down to the 50-Day EMA, and of course the $1950 level. All things being equal, this is a market that I think has plenty of buyers underneath, and therefore it’s likely that we will continue to see a lot of noisy behavior. With this being the case, and the fact that the interest rates in America continue to jump around, I anticipate that the gold market will continue to be very noisy.

All things being equal, I think you do continue to see a lot of noise, and then of course you have the jobs number that come out on Friday in America which will have a major influence. After all, a lot of traders will be looking to see whether or not the employment situation is slowing down, or if it’s going to continue to be aggressive and positive, perhaps driving inflation even further to the upside.

With that being said, gold markets will continue to be noisy but it’s obvious that they are very bullish in general, and therefore I think you’ve got a situation where you continue to buy dips. We certainly have seen that over the last 48 hours and I think it is probably only a matter of time before we do break to a fresh, new high. However, if we were to break down below the 50-Day EMA, it would be very negative, opening up the possibility of a move down to the 200-Day EMA. With this, I think you continue to see a lot of choppy and difficult trading.

Bank of England Pauses Rate Hikes Amid Economic, Inflation Concerns

Bank of England Pauses Rate Hikes Amid Economic, Inflation Concerns

Interest Rates Decision

The Bank of England’s Monetary Policy Committee (MPC) made a significant move, halting its streak of 14 consecutive rate hikes. By a 6-3 vote, the committee chose to keep the interest rates unchanged at 5.25%, a decision influenced by their assessment of the economic landscape and its foreseeable effect on inflation.

Economic and Inflationary Landscape

Recent data paint a picture of a UK economy losing steam. GDP growth recorded a standstill in Q3 2023 and forecasts suggest a paltry 0.1% rise in Q4. Concurrently, the labor market appears to be loosening its grip. Employment growth is on a downward trend, with certain sectors still grappling with skills shortages. On the inflation front, the rate hovers at an elevated 6.7%, substantially overshooting the MPC’s 2% target. However, a silver lining appears as projections anticipate a drastic decline, aligning it closer to the target by 2025’s end.

Global Influences and Risks

Several external factors are casting shadows on the UK’s economic landscape. The tumultuous events in the Middle East have precipitated a surge in oil futures, stoking global inflationary fires. Additionally, a notable rise in long-term government bond yields across major economies signals a recalibration in global investor sentiment. The MPC is candid about the potential pitfalls in their projections, especially concerning inflation. Chief among the concerns are lingering second-round effects on domestic prices and wages, combined with potential energy price shocks on the world stage.

Outlook on Future Monetary Policy

In the midst of these challenges, the MPC reiterates its stance that the prevailing monetary policy is tight, especially in light of the Bank Rate’s significant elevation. With an unwavering commitment to steer inflation back to the 2% mark over the medium term, the committee hints that if persistent inflationary pressures arise, they might consider further tightening.

Conclusion and Market Implications

The MPC’s decision to hold the rate resonates with the broader narrative of a decelerating economy juxtaposed with stubborn inflationary pressures. While a cautious optimism surrounds the prospect of inflation rates nearing the target in coming years, the erratic dance of global events and domestic economic trends could sway future MPC decisions. For traders and investors, keeping a keen eye on unfolding economic data and Bank communications will be pivotal in anticipating upcoming policy shifts.

Unit Labour Costs Decline As Productivity Improves

Unit Labour Costs Decline As Productivity Improves

On November 2, U.S. released Initial Jobless Claims report, which indicated that 217,000 Americans filed for unemployment benefits in a week. Analysts expected Initial Jobless Claims of 210,000.

Continuing Jobless Claims increased from 1.78 million to 1.82 million, compared to analyst consensus of 1.8 million.

Importantly, Unit Labour Costs declined by 0.8% in the third quarter, while analysts expected that they would grow by 0.7%. Non Farm Productivity increased by 4.7%, compared to analyst consensus of 4.1%.

U.S. Dollar Index tested session lows after the release of the reports. Traders continue to digest Powell’s words and bet that Fed will not raise rates again. Treasury yields are moving lower, and the yield of 10-year Treasuries has already declined towards the 4.65% level. Falling yields put additional pressure on the American currency.

Gold moved towards the $1990 level, supported by weaker dollar and lower Treasury yields. Demand for safe-haven assets also provides support to gold markets as traders stay focused on the developments in the Middle East.

SP500 futures moved towards the 4280 level in premarket trading. The market sentiment is bullish as traders bet on a less hawkish Fed.

For a look at all of today’s economic events, check out our economic calendar.