AUD/USD Price Forecast: Aussie Dollar Looks to RBA for Guidance

AUD/USD Price Forecast: Aussie Dollar Looks to RBA for Guidance

AUSTRALIAN DOLLAR FUNDAMENTAL BACKDROP

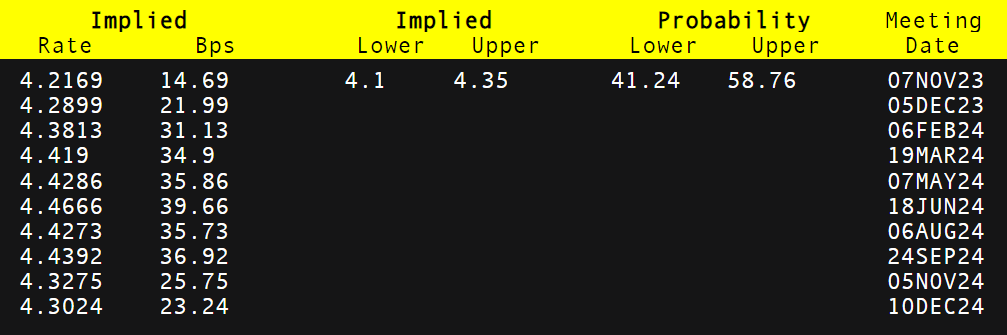
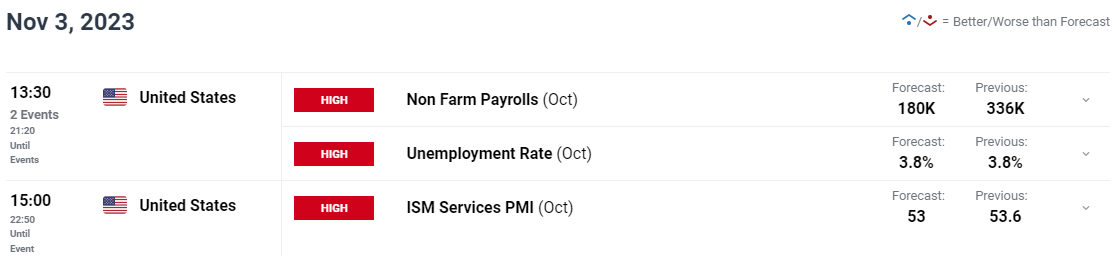
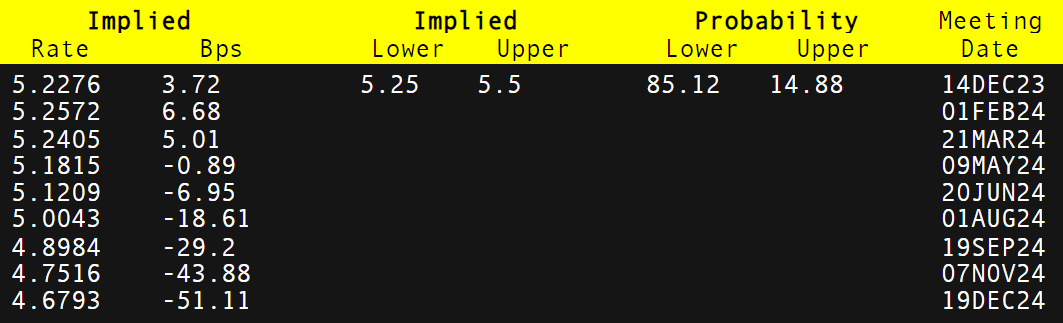
The Australian dollar has held onto last week’s gains after the US Non-Farm Payroll (NFP) report missed estimates causing a dip in US Treasury yields. Implied Fed funds futures show a dovish repricing of interest rate expectations to roughly 95bps of cumulative rate cuts by December 2024 vs 60bps just a few weeks ago. This may an overreaction as one data print does not make a trend and further confirmation will be required in the coming months.

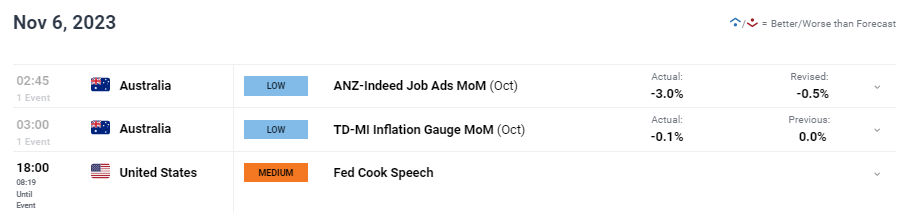
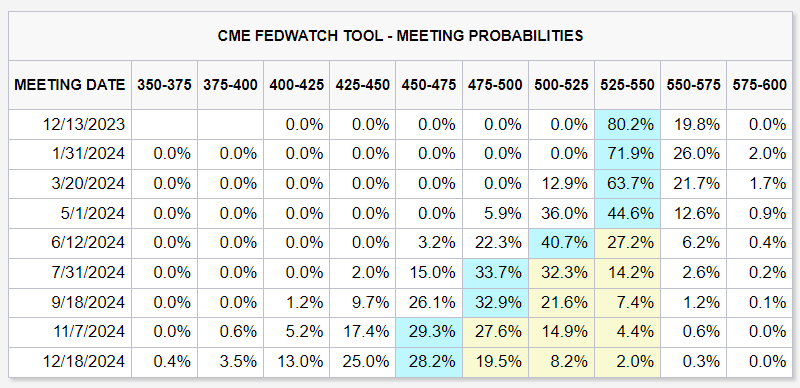
Earlier this morning (see economic calendar below), Australian job ads and inflation gauge figures slumped and could point to turnaround in the economy as tight monetary policy take ahold. Although low impact data, this could have an impact on tomorrow’s Reserve Bank of Australia’s (RBA) rate decision that currently has money markets pricing in a 60% chance of a rate hike (refer to table below).

Consensus is for a rate hike after persistent high inflation plagues the economy but with global recessionary fears gaining traction, will this deter central bank officials from hiking again? After keeping rates on hold (4.1%) from June this year, a jump could see the AUD back up around the 0.6600 level.

AUD/USD ECONOMIC CALENDAR (GMT +02:00)

image1.png

RBA INTEREST RATE PROBABILITIES

image2.png

TECHNICAL ANALYSIS

AUD/USD DAILY CHART

image3.png

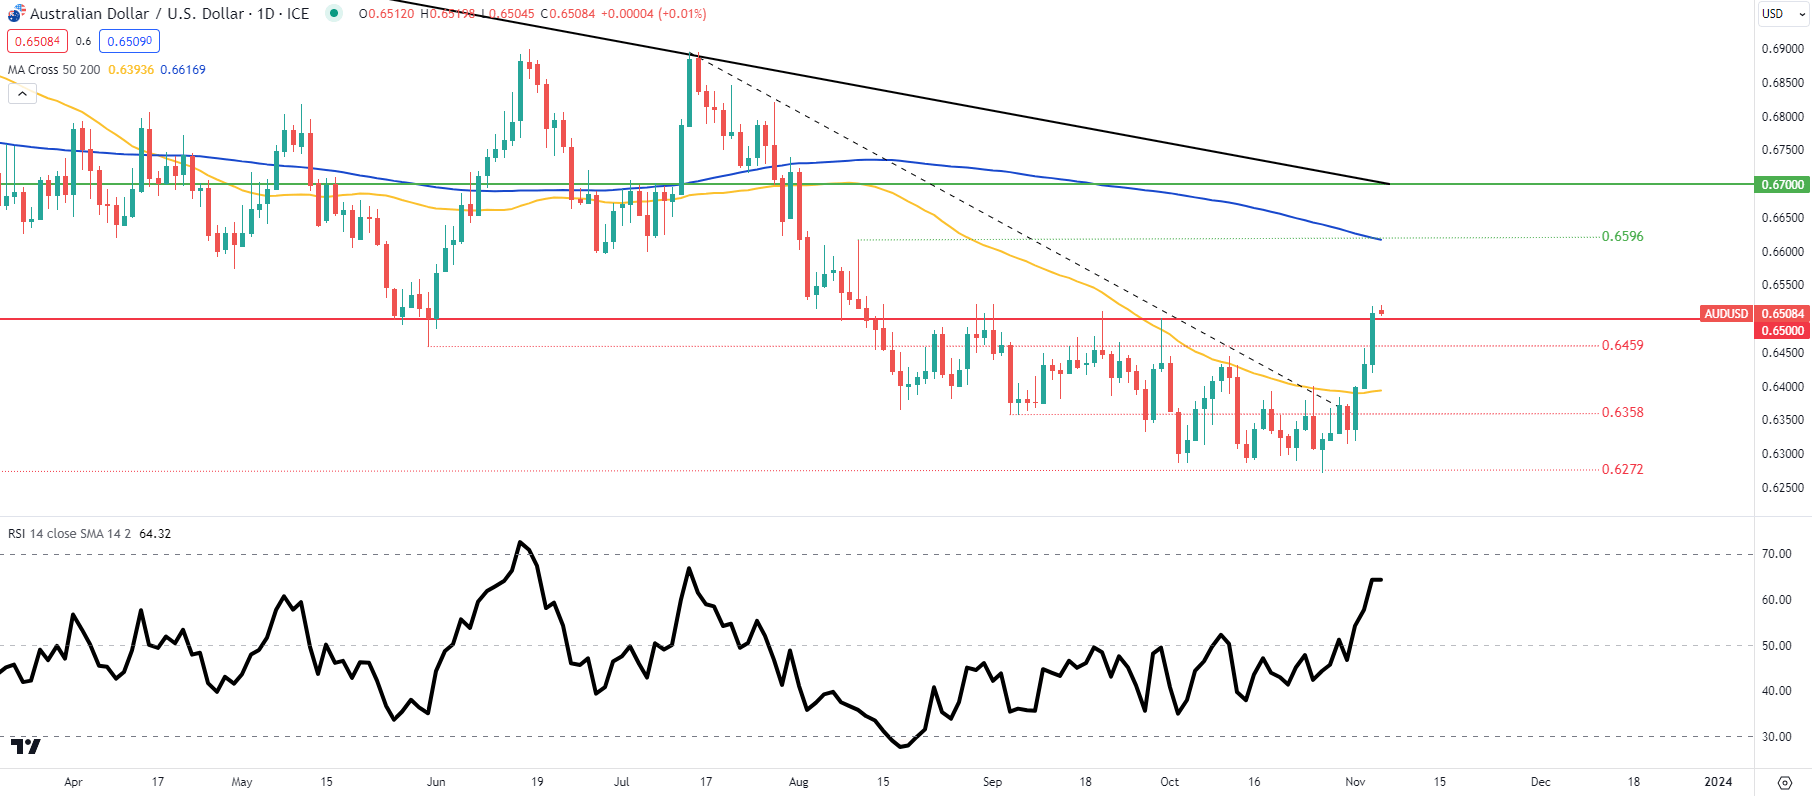
Daily AUD/USD price action above is slowly approaching the overbought zone as measured by the Relative Strength Index (RSI) but has more room to appreciate. As mentioned above, short-term directional bias will be determined by the RBA tomorrow. A rate pause could see the pair slip back below 0.6500 once more and a hike could bring into consideration the 200-day moving average (blue)/0.6596 resistance zone respectively.

Key resistance levels:

  • 0.6596/200-day MA

Key support levels:

  • 0.6500
  • 0.6459
  • 50-day moving average (yellow)
Trading the Gold-Silver Ratio: Strategies and Tips

Trading the Gold-Silver Ratio: Strategies and Tips

WHAT IS THE GOLD-SILVER RATIO?

The gold-silver ratio is simple. It is the number of silver ounces you would need to trade to receive one ounce of gold at current market prices. For example, when gold price is trading at $1000 per ounce and silver price is trading at $16.67 per ounce the gold-silver ratio will be equivalent to 60.

  • The gold to silver ratio has averaged around 60 from 2001 to 2017. With highs breaching 80 (ounces of silver to one ounce of gold) and lows sinking to around 40.
  • The ratio tends to increase during times of economic distress. The cause of this relationship is due to gold generally outperforming silver during recessions, leading to increases in the ratio.
  • The ratio peaked at 100 in 1991 when silver prices dropped to extreme lows.

HOW THE GOLD-SILVER RATIO WORKS

  • When the gold price increases faster than the silver price the ratio will increase .
  • When the silver price increases faster than the gold price the ratio will decrease .
  • When the gold price decreases faster than the silver price the ratio will decrease.
  • When the silver price decreases faster than the gold price the ratio will increase.

The graph above shows the gold to silver ratio for the past several decades. In 1991 silver was trading at extremely low prices- causing a peak in the gold-silver ratio, denoted by the blue circle in the graph above.

It is also worth noting the spike in the ratio during the 2008 subprime-mortgage crisis, caused by surging gold prices and silver not performing as well. This is denoted by the red circle in the graph above.

HOW TO TRADE THE GOLD-SILVER RATIO

There are many ways to use the ratio to your advantage. Keep reading for the top two strategies on trading the gold-silver ratio.

1) USING THE GOLD-SILVER RATIO TO DETERMINE THE METAL WITH THE STRONGEST TREND AND TRADE IT:

Traders can use the gold-silver ratio to determine which metal may outperform the other and then place a trade accordingly.

A trader could use these five steps to enter a trade on either gold or silver using the ratio:

1) Determine the trend on a gold-silver ratio chart by adding trend lines to the chart. You can use FX’s chart to view the gold-silver ratio by entering “XAUUSD/XAGUSD” in the search bar.

2) Using the time-frame of your choice, determine the trend on gold and silver individually.

3) Use this table to help you determine a bias:

Gold-Silver RatioUptrend Gold and silver inUptrend
Gold-Silver RatioUptrend Gold and Silver inDowntrend
Gold-Silver RatioDowntrend Gold and Silver inUptrend
Gold-Silver RatioDowntrend Gold and Silver inDowntrend

4) Identify trading opportunities using price action or technical indicators time entries in the direction of the trend.

5) Identify a trade size appropriate for the account size and set stop-losses and take-profits and execute the trade.

Here’s an example using the five steps:

1) Let’s say we open our gold to silver ratio chart on 8 February 2016.We draw our trend lines and the trend lines indicate that the ratio is in a current uptrend as shown in the chart below showing a four-hourly timeframe.

2) Our next step is to determine the individual trend for gold and silver. So, we open the charts and draw our trend lines and notice that both gold and silver are trending upwards as shown in the charts below.

3) The table above indicates that when the gold-silver ratio is trending upwards and gold and silver are both in an uptrend we should buy gold because it has been outperforming silver.

GOLD-SILVER RATIO UPTREND GOLD AND SILVER IN UPTREND BUY GOLD

4) Since the beginning of February, gold has increased drastically in price. We should wait for a modest pull-back before attempting to enter the market. Once we do enter the market, we can place our stop-loss below the trend line and our take-profit above the previous high to ensure a positive risk-reward ratio on the trade.

5) We determine an appropriate trade size for our account, execute the trade and set our stop-loss and take profit.

2) TRADING THE HIGHS AND LOWS OF THE GOLD-SILVER RATIO:

There may be times when the ratio reaches historic extremes. When it is near these points, a reversal of the ratio is at risk. For example, when the gold-silver ratio reaches for historical highs (from 80 to 100) the idea is that the price of gold is expensive relative to the price of silver. When the gold-silver ratio reaches for historical lows (from 60 to 40) gold is seen as cheaper relative to silver.

Because the metals are correlated though driven by different factors, they tend to be limited in their willingness to run beyond a gold-silver ratio north of 80-100 or below 60-40, and those tend to be at turning points because the ratio has picked up on a likely abrupt turning points in markets.

The chart below shows times when the ratio was at all-time highs- red circles and all-time lows-blue circles.

Traders can use the table below as a guide to trade the metals when the gold-silver ratio at risk for a reversal:

GOLD-SILVER RATIO EXTREME GOLD AND SILVER TREND TRADE SIGNAL
Gold-Silver RatioHistorical High Gold and Silver inUptrend Long Silver
Gold-Silver RatioHistorical High Gold and Silver inDowntrend Short Gold
Gold-Silver RatioHistorical Low Gold and Silver inDowntrend Short Silver
Gold-Silver RatioHistorical Low Gold and Silver inUptrend Long Gold

It is very seldom that the gold-silver ratio reaches for these historic highs and lows, but when it does, it could offer good opportunities. Still, it is important to manage your risk because the ratio has been known to breach these historical levels.

GOLD TO SILVER RATIO TRADING: TOP TIPS

  • The gold to silver ratio could indicate investors’ appetite for safe-haven assets. If the gold-silver ratio is peaking, it could indicate investors are more risk-averse.
  • The gold to silver ratio could indicate the state of the world economy. If the ratio is at a low point, it could show that the world economy is in a growth phase.
  • Use the gold-silver ratio in conjunction with the individual price trends to determine the stronger trend to trade.
  • When the ratio approaches its historical highs -100 and historical lows -40 it is at risk for a reversal.
  • When making a trade, implement good habits such as incorporating a positive risk to reward ratio.
How to Manage the Emotions of Trading

How to Manage the Emotions of Trading

The Importance of Controlling Emotions While Trading

The importance of day trading emotional control cannot be overstated.

Imagine you’ve just taken a trade ahead of Non-Farm Payrolls (NFP) with the expectation that if the reported number is higher than forecasts, you will see the price of EUR/USD increase quickly, enabling you to make a hefty short-term profit.

NFP comes, and just as you had hoped, the number beats forecasts. But for some reason, price goes down!

You think back to all the analysis you had done, all the reasons that EUR/USD should be going up – and the more you think, the further price falls.

As you see the red stacking up on your losing position, emotions begin to take over – this is the ‘Fight or Flight’ instinct.This impulse can often prevent us from accomplishing our goals and, for traders, this issue can be very problematic, leading to knee-jerk reactions.

Professional traders don’t want to take the chance that a rash decision will damage their account – they want to make sure that one knee-jerk reaction doesn’t ruin their entire career. It can take a lot of practice, and many trades, to learn how to minimize emotional trading.

The 3 Most Common Emotions Traders Experience

Some of the most common emotions traders experience include fear, nervousness, conviction, excitement, greed and overconfidence.

Fear/Nervousness

A common cause of fear is trading too big. Trading with improper size magnifies volatility unnecessarily and causes you to makemistakes you normally wouldn’t make if you weren’t under the stress of risking larger losses than normal.

Another culprit for fear (or nervousness) is you are in the ‘wrong’ trade, meaning one that doesn’t fit your trading plan.

Conviction/Excitement

Conviction and excitement are key emotions you’ll want to feed off, and you should feel these in every trade you enter. Conviction is the final piece of any good trade, and if you don’t have a level of excitement or conviction then there is a good chance you are not in the ‘right’ trade for you.

By ‘right’ we mean the correct trade according to your trading plan. Good trades can be losers just as bad trades can be winners. The idea is to keep yourself winning and losing on only good trades. Making sure you have conviction on a trade will help ensure this.

Greed/Overconfidence

If you find yourself only wanting to take trades that you deem as possible big winners, you could be getting greedy. Your greed may have been the result of doing well, but if you aren’t careful you may slip and end up in a drawdown.

Always check that you are using proper trade mechanics (i.e. sticking to stops, targets, good risk/management, good trade set-ups). Sloppy trading as a result of overconfidence can end a strong run.

S&P 500, NAS 100 Approaching Key Confluence Area. Can the Rally Continue?

S&P 500, NAS 100 Approaching Key Confluence Area. Can the Rally Continue?

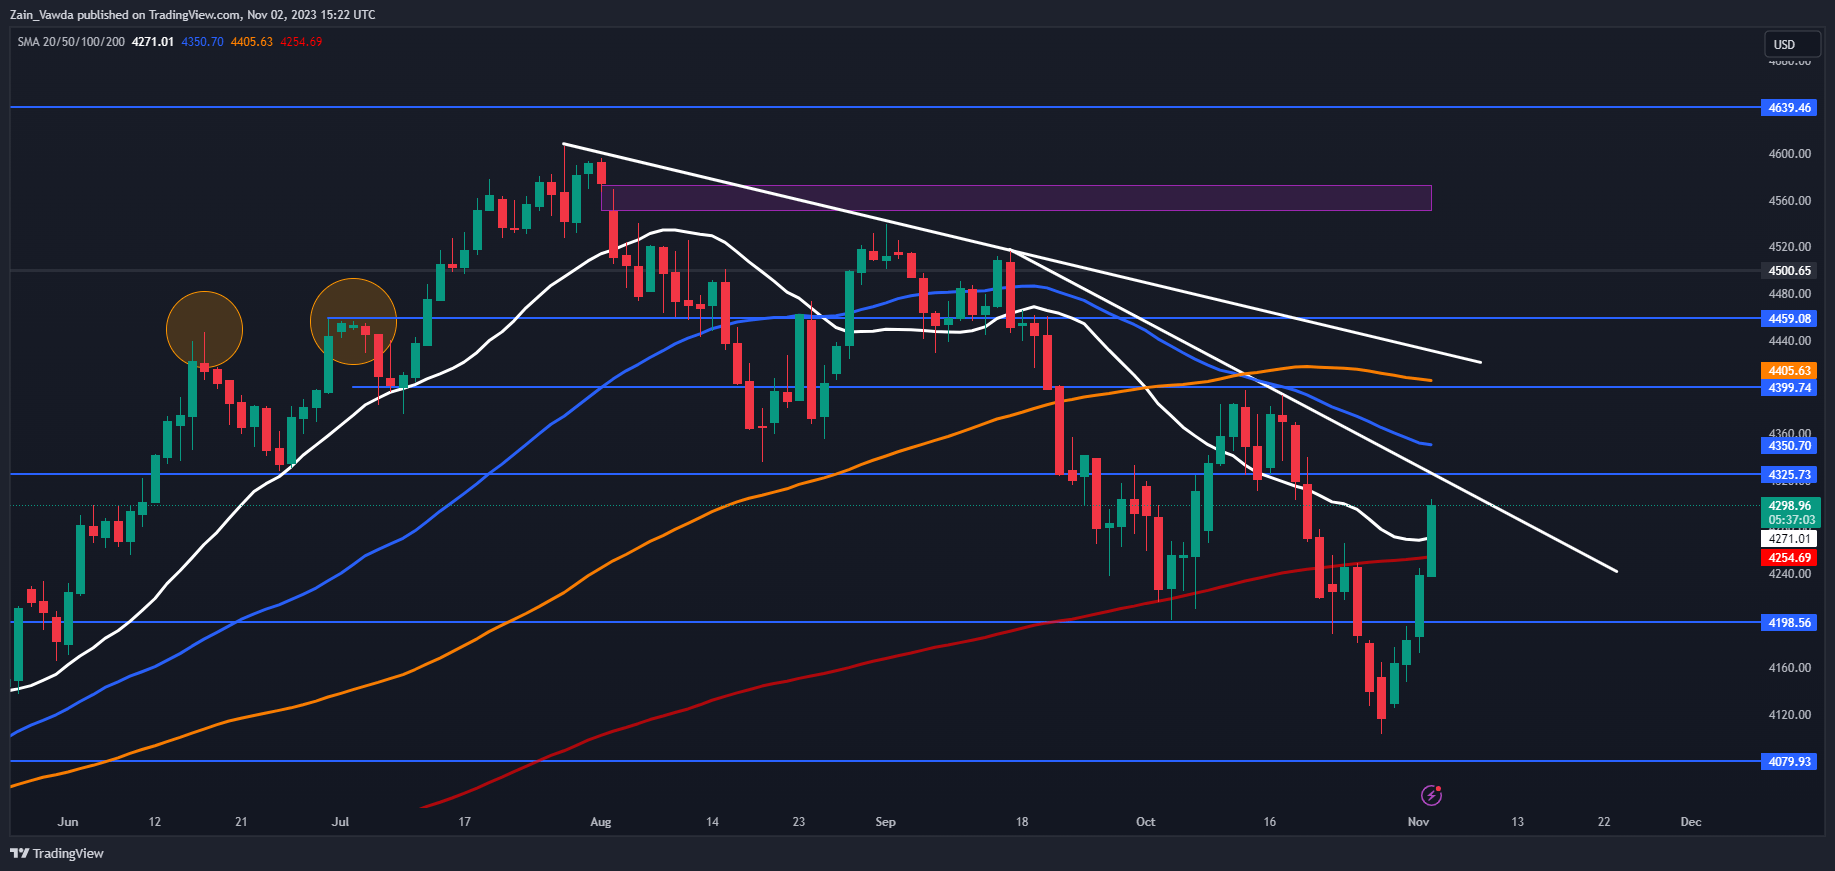
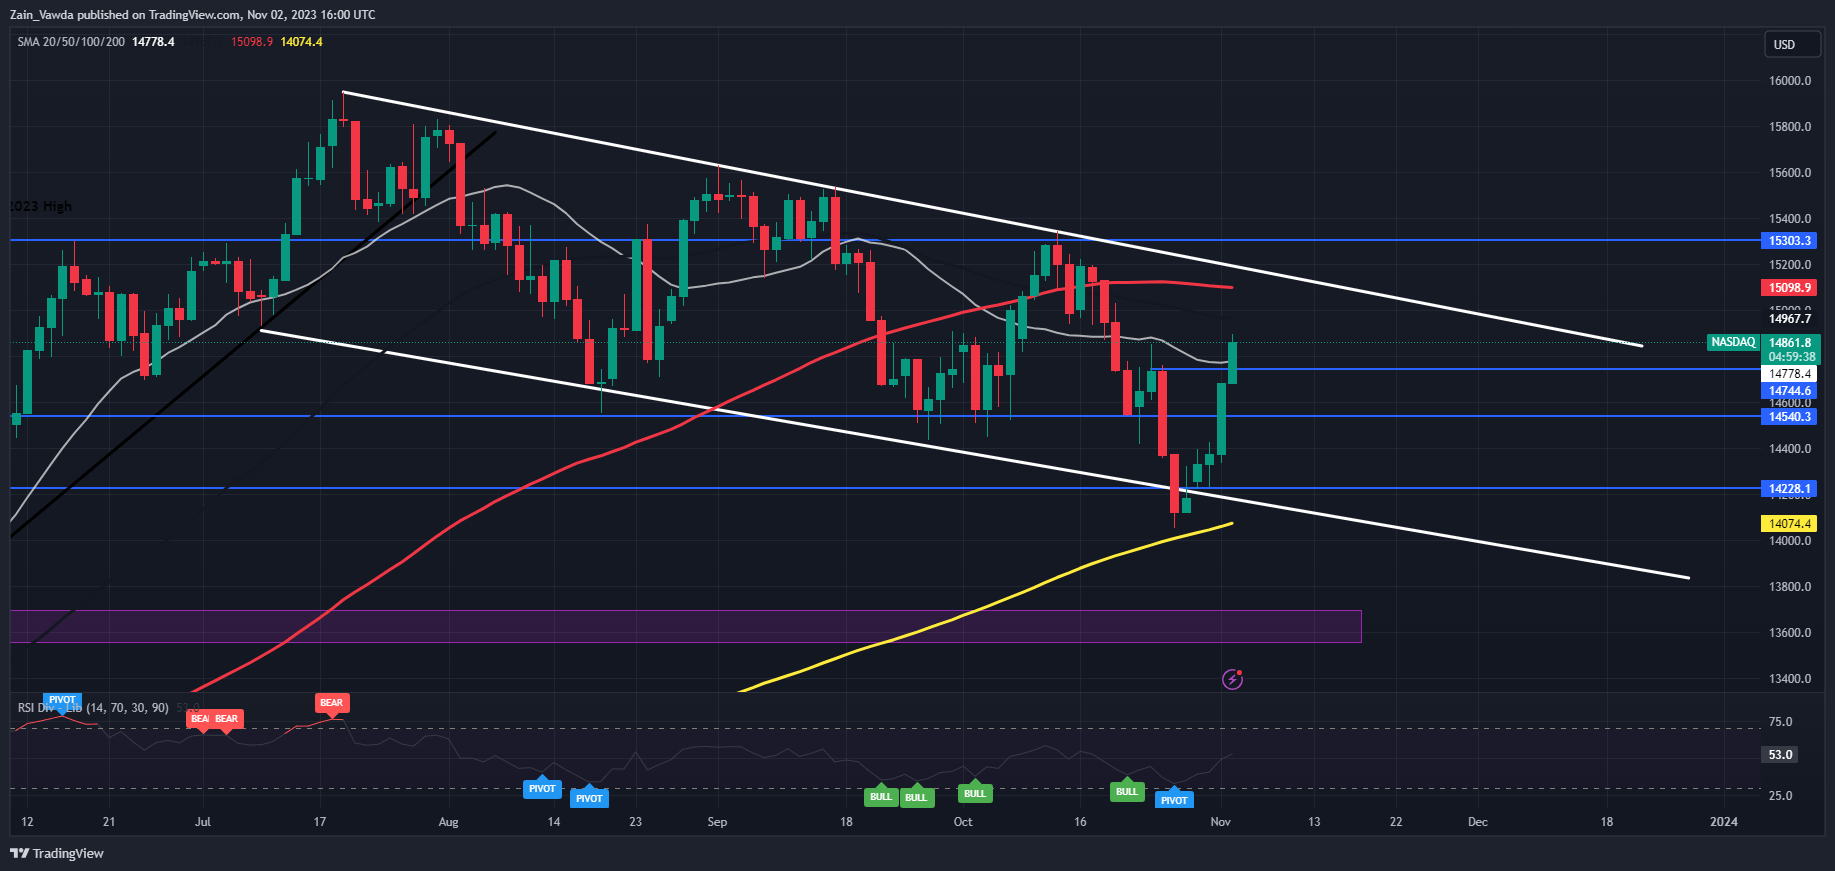
US Indices are enjoying a stellar recovery this week with the SPX up around 4.7% and the NAS 100 up around 5.7%. This is in stark contrast of the recent slide which had put the SPX and the Nasdaq in correction territory following 10% of losses from the recent highs printed in mid-July.

The rally received a further boost the lack of certainty provided by Federal Reserve and the Bank of England (BoE) had market participants betting that peak rates have been reached. Neither Central Bank openly saying as much, however, market participants are apparently seeing light at the end of the tunnel.

image1.png

Fed Chair Powell reiterated his commitment to the 2% inflation target saying that he believes current policy should get the Fed to target but leaving the door open for the Fed to tighten should the need arise. The probability for rate cut in June 2024 have risen to a high of 70% following the FOMC meeting and could in part explain the upbeat mood we are seeing today.

EARNINGS AND MORE US DATA AHEAD

Today after market close, we get one of the most hotly anticipated earnings report as Apple will report on its quarterly performance. Expectations are for a 1% decrease in quarterly revenue, and this could hold some extra importance as Apple is a bellweather for consumer demand and the tech sector. This report and any hints at what to expect for Q4 could be intriguing given recent murmurs around poor sales in China for recent Apple product releases.

Tomorrow and all eyes will be focused on the US employment data with NFP, the unemployment rate and of course the all-important average earnings number. Any sign of labor market softening and a drop in average earnings could further embolden bulls and result in gains for the SPX, NAS 100 and risk assets as a whole.

image2.png

TECHNICAL OUTLOOK AND FINAL THOUGHTS

The SPX rally to the upside has been gaining traction throughout the week and breaking through some key areas of resistance. Despite the excellent gains this week the index is still in a downtrend until the 4399 swing high isn’t broken.

However, there is a key confluence area approaching before the previous swing high can be reached and this may prove a stumbling block for the S&P. The 4325 level which is a resistance area lines up perfectly with the descending trendline and we also have the 50-day MA just above this level adding a further layer of resistance. My hesitance about this level also stems from the fact that the weekend is approaching and following the size of the rally this week we could see some profit taking ahead of the weekend which could see the SPX experience a retracement tomorrow. The middle east tension has seen market participants unwilling to hold positions open over the weekend and I think this will continue for a while longer.

The NAS100 has been on a similar tear as the SPX but has gained about 1% more. The charts look very similar with the Nasdaq also facing a key confluence area up ahead. The 15000-15100 area promises to be key for the Nasdaq if the bullish momentum is set to continue as this confluence area has the 100-day MA as well as the descending trendline. Above this area we have another resistance area around 15300.

A rejection here will bring immediate support around the 14740 mark into focus before 14540 and then the recent lows may come into focus. As I mentioned with the SPX, we could see market participants do some profit taking ahead of the weekend and this could keep the Nasdaq under pressure tomorrow assuming US data doesn’t throw any upbeat surprises on the labor market data release.

US Dollar Forecast: USD/JPY Slips but AUD/USD Breaks Out After Fed, NFP Ahead

US Dollar Forecast: USD/JPY Slips but AUD/USD Breaks Out After Fed, NFP Ahead

The U.S. dollar depreciated broadly on Thursday after the Federal Reserve kept interest rates unchanged and did little to guide markets toward another potential hike. While the FOMC maintained a tightening bias in its statement, Chairman Powell fail to strongly endorse further policy firming, leading traders to conclude that the terminal rate has been reached and the hiking campaign is effectively over.

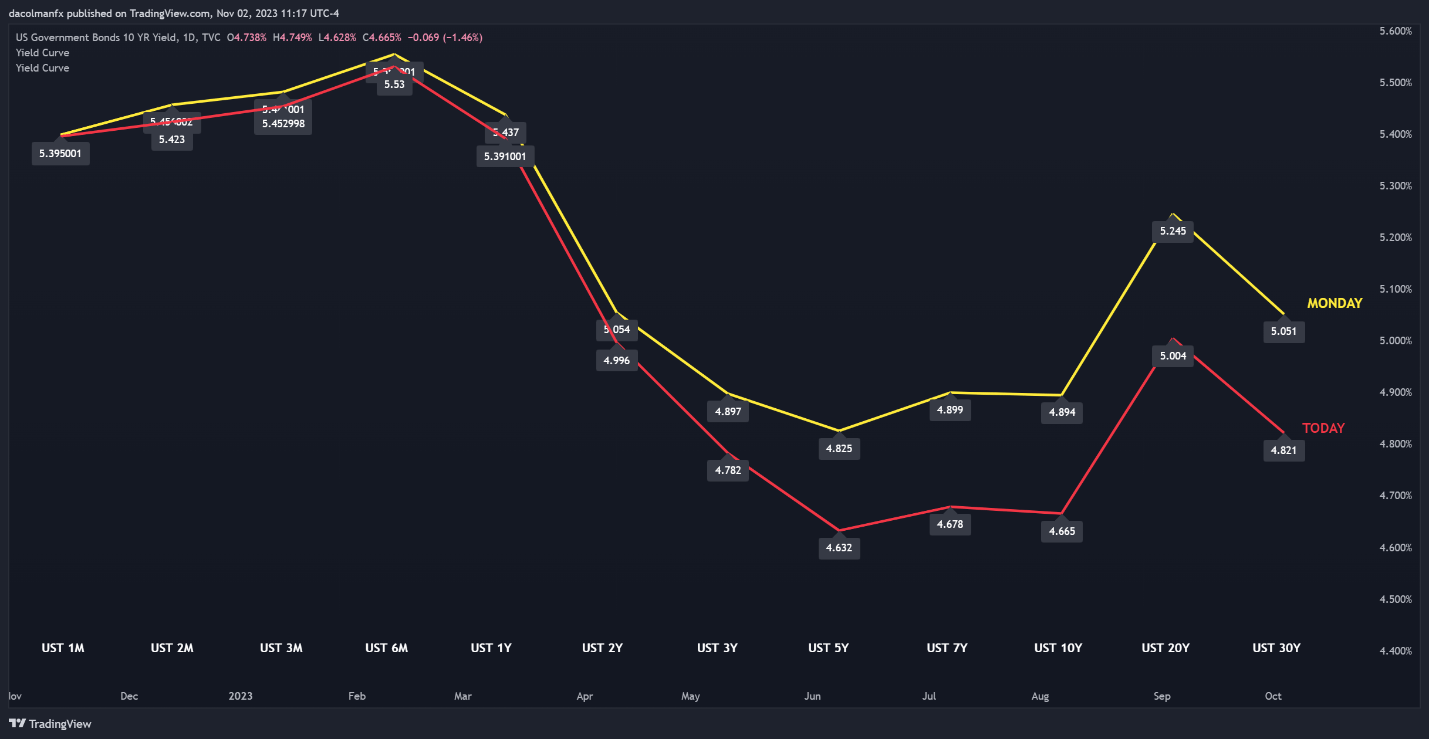
U.S. economic data released this morning accelerated the greenback’s descent after reinforcing the pullback in Treasury yields. For context, U.S. labor costs showed a surprising contraction in the third quarter, falling 0.8% versus expectations for a 0.7% increase, indicating that wage pressures are easing at a time of rising productivity, an encouraging development for the central bank.

US TREASURY CURVE TODAY VERSUS MONDAY

A graph on a computer screen  Description automatically generated

Seeking actionable trading insights? Download our top trading opportunities guide packed with interesting technical and fundamental trading setups!

US DATA AT A GLANCE

image2.png

With the Fed pledging to proceed carefully, perhaps in recognition that the full impact of past actions has yet to be felt, the U.S. dollar may soon undergo a prolonged downward correction, especially if sentiment stabilizes. To trust this assessment, however, incoming data will have to confirm that the economic outlook is deteriorating under the weight of overly restrictive financial conditions.

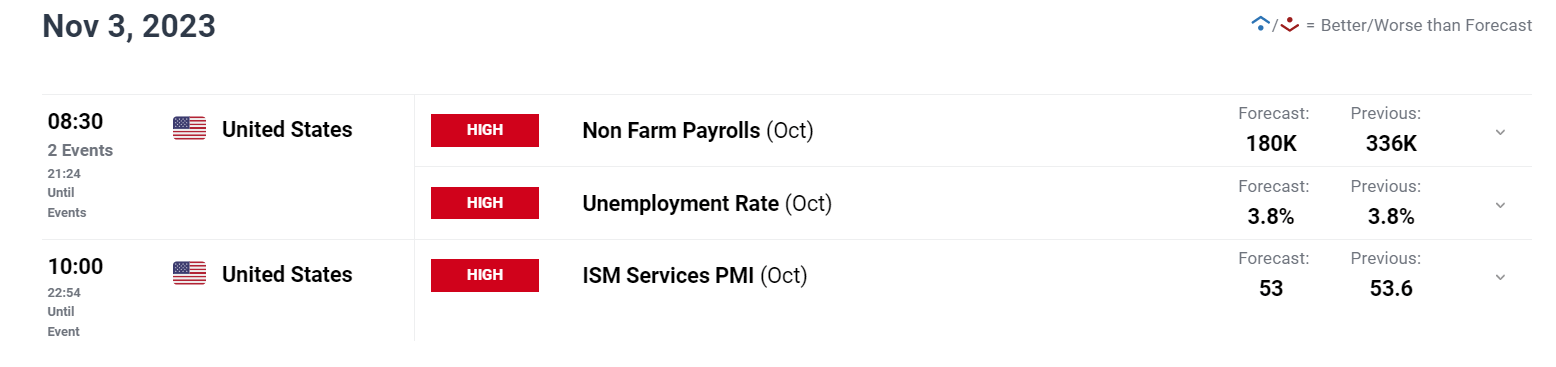
Traders will have a chance to gauge the health of the overall economy on Friday when the U.S. October nonfarm payrolls numbers and the ISM services PMI survey are unveiled. If both reports surprise to the downside, in a manner reminiscent of ISM manufacturing activity earlier this week, the U.S. dollar could take a big hit, resulting in a sharp pullback for USD/JPY and a meaningful rally for AUD/USD.

The figure below reflects investors’ outlook for both releases

image3.png

For a comprehensive view of the Japanese yen’s fundamental and technical outlook, grab a copy of our Q4 trading forecast today. It’s totally free!

USD/JPY TECHNICAL ANALYSIS

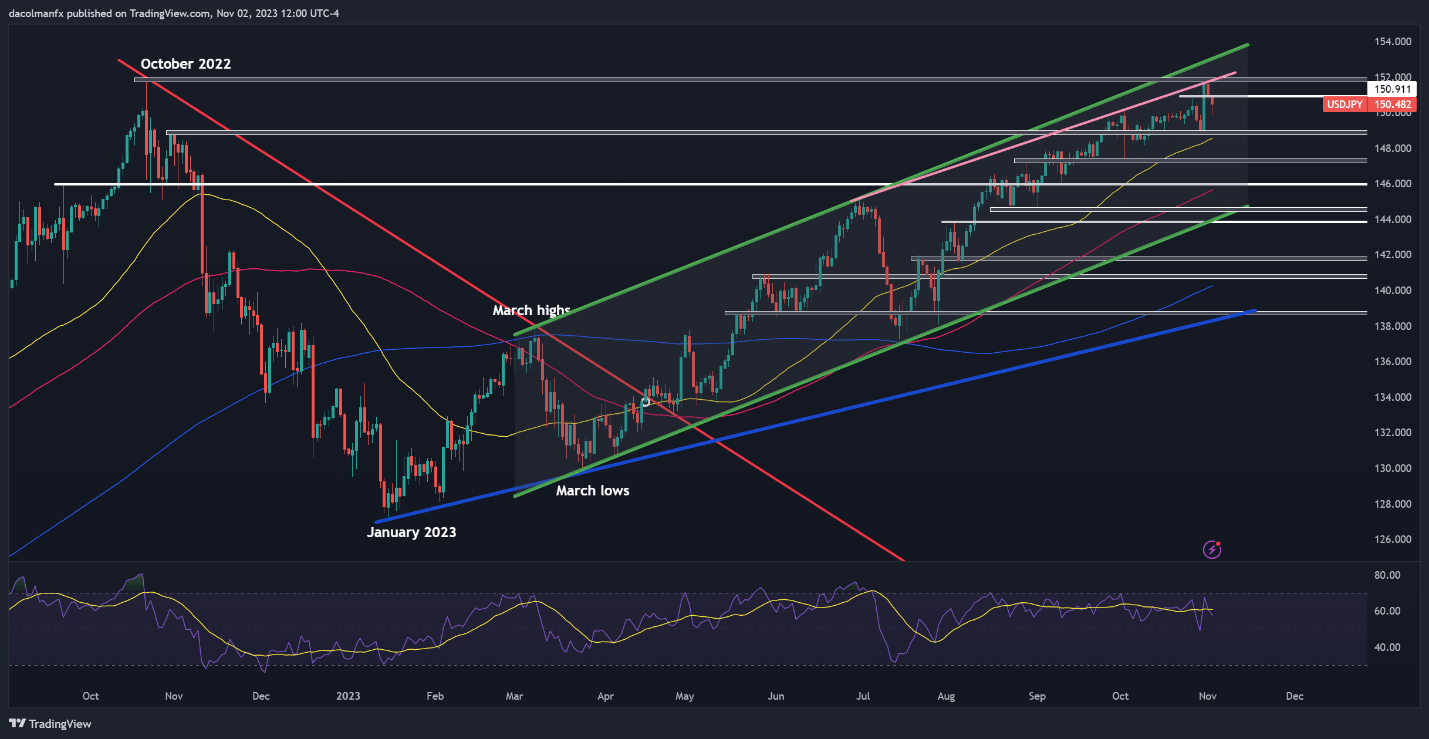
USD/JPY fell on Thursday, extending losses for the second straight day after failing to clear resistance around the psychological 152.00 level earlier in the week. If the decline extends further in the coming sessions, support is seen at 148.75. While the pair may establish a base in this area on a pullback, a breakdown might entice new sellers into the market, potentially resulting in a drop toward 147.30.

On the other hand, if the bullish camp reasserts dominance and initiates an upward reversal, technical resistance stretches from 151.95 to 152.00, where this year’s high aligns with the 2022 peak. If strength is maintained, we could see a potential rally towards 153.00, which corresponds to the upper boundary of a medium-term rising channel, as shown in the daily chart below.

USD/JPY TECHNICAL CHART

A screenshot of a computer screen  Description automatically generated

Looking for informative insights into where the Australian Dollar is headed and the crucial market drivers to keep on your radar? Explore the answers in our Q4 trading guide. Download a free copy today!

AUD/USD TECHNICAL ANALYSIS

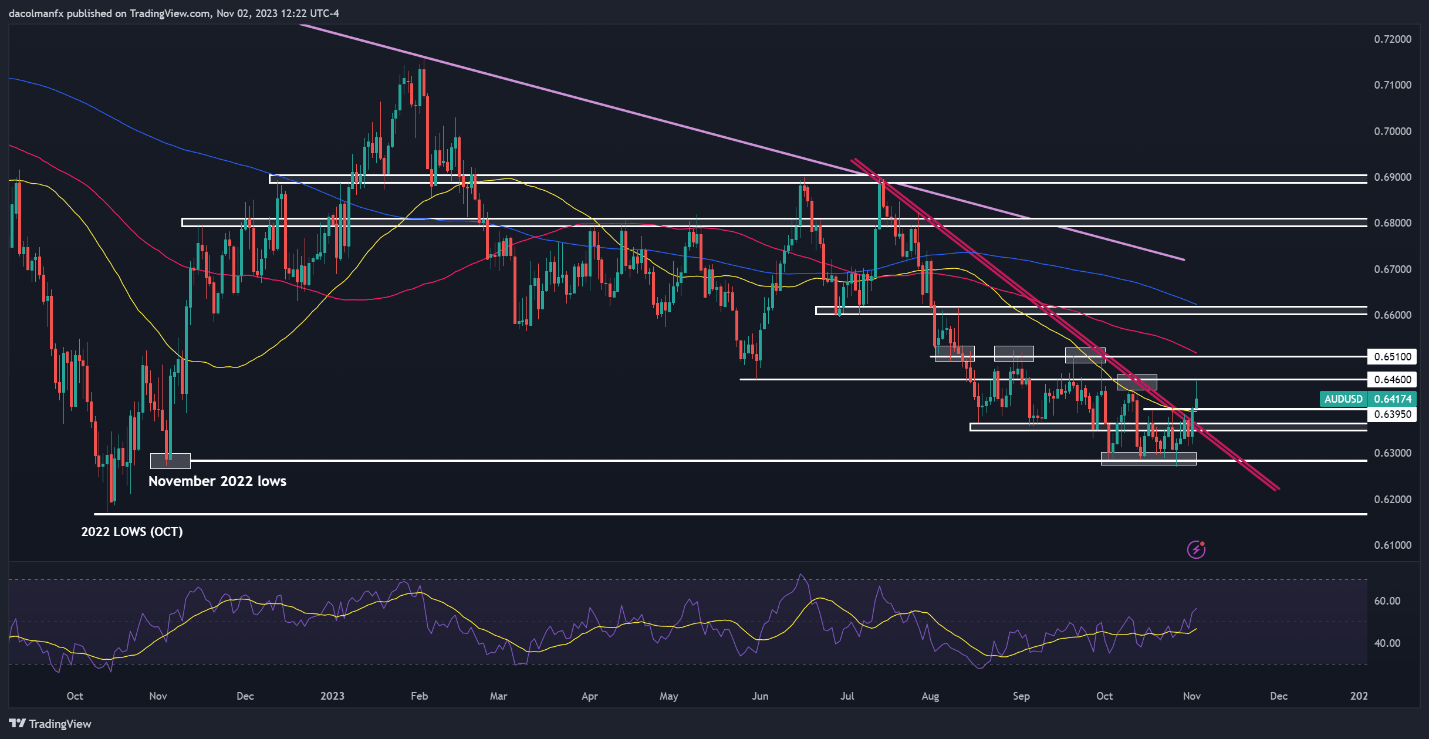
AUD/USD has been in a prolonged downtrend, with sharp declines since mid-July, as shown in the chart below. Late last week, however, prices managed to find support near the 0.6275 area before staging a moderate comeback in the days that followed. This rebound took the pair above trendline resistance and the 50-day simple moving average, creating a more constructive backdrop for the Australian dollar.

For AUD/USD’s outlook to improve further, bulls need to take out overhead resistance at 0.6460. If this scenario plays out, we could see a rally towards 0.6510. On further strength, buyers could be emboldened to launch an attack on the 0.6600 handle. Conversely, if sellers return and regain the upper hand, initial support appears at 0.6395, followed by 0.6360. Below this area, attention turns to the 2023 lows.

AUD/USD TECHNICAL CHART

A screenshot of a computer screen  Description automatically generated

USD/CAD Price Forecast: 1.3900 Holds Firm as DXY Retreats, Will 20-Day MA Provide Support?

USD/CAD Price Forecast: 1.3900 Holds Firm as DXY Retreats, Will 20-Day MA Provide Support?

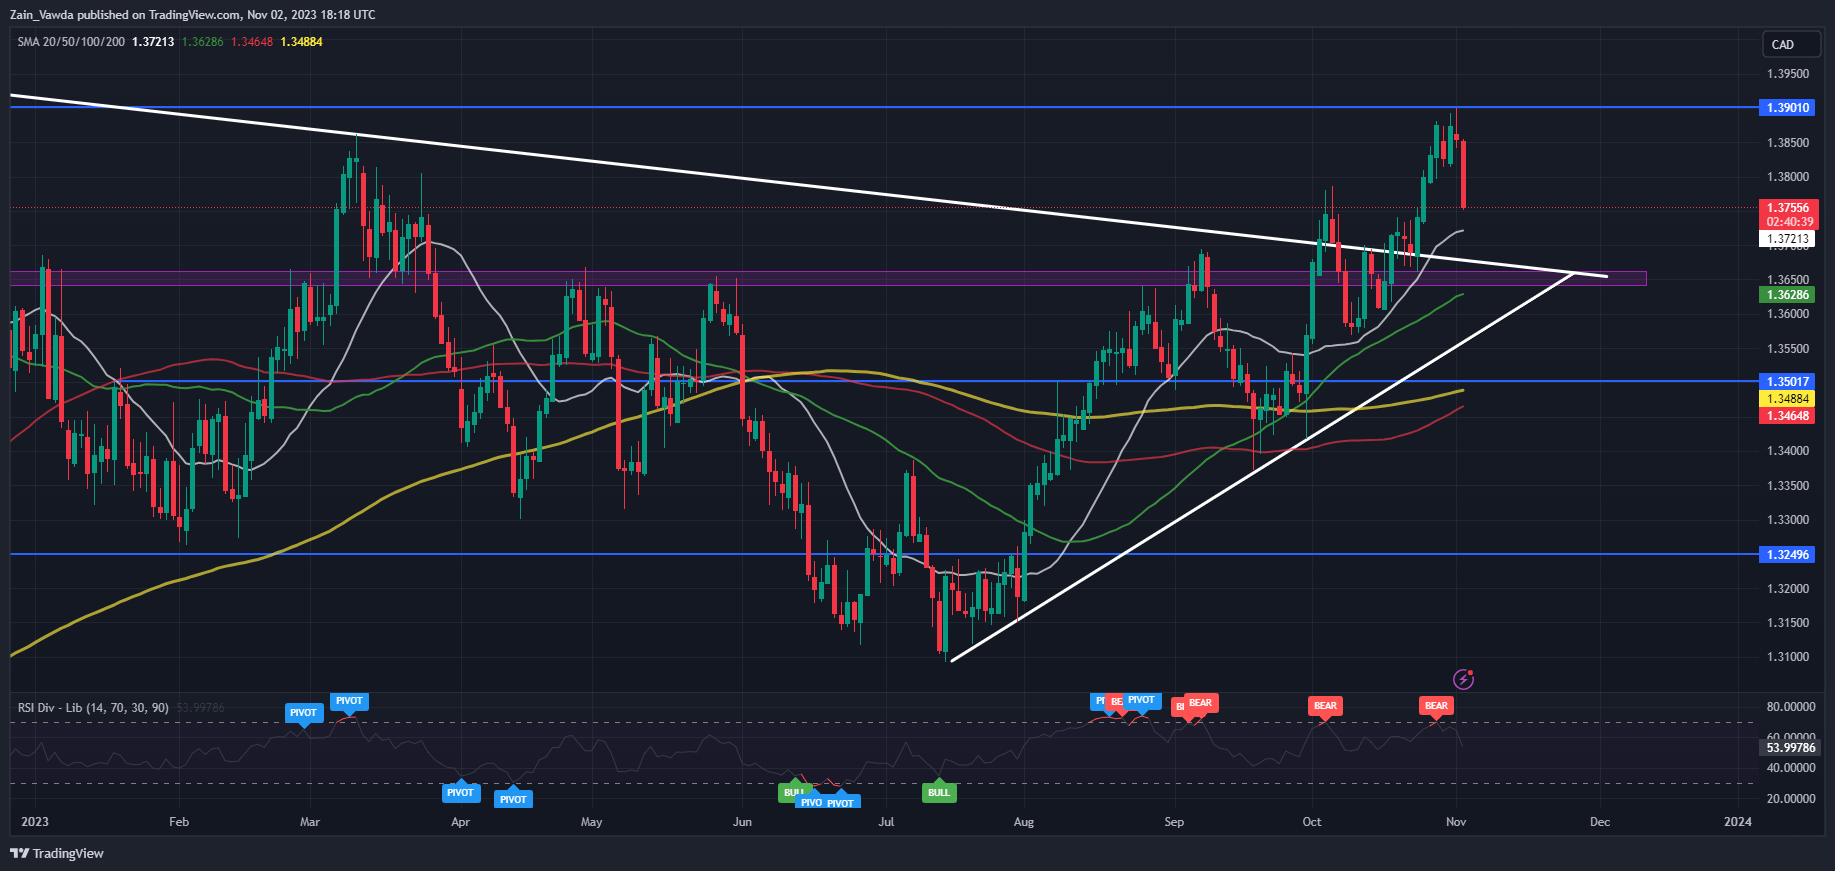
USDCAD has continued to selloff today following a rejection at the 1.3900 resistance level. The decline in the DXY has helped USDCAD push lower as well in what will be a welcomed by the Bank of Canada and Canadian consumers. In October the Canadian Dollar was the third worst performing G10 currency as it lost ground against the Greenback, the rise in Oil prices not even able to support the CAD.

USD INDEX AND US, CANADIAN DATA AHEAD

The Dollar Index continues to struggle at the key resistance area around the 1.0680-1.0720 area. The failure to break higher yesterday was bolstered by the FOMC meeting which saw the FED maintain their current policy path and outlook despite robust US data. The result saw market participants pin their hopes on the idea that the Fed is now done with hiking and the next move likely to be a rate cut, with participants now seeing a 70% chance of a rate cut in June of 2024.

DXY Daily Chart

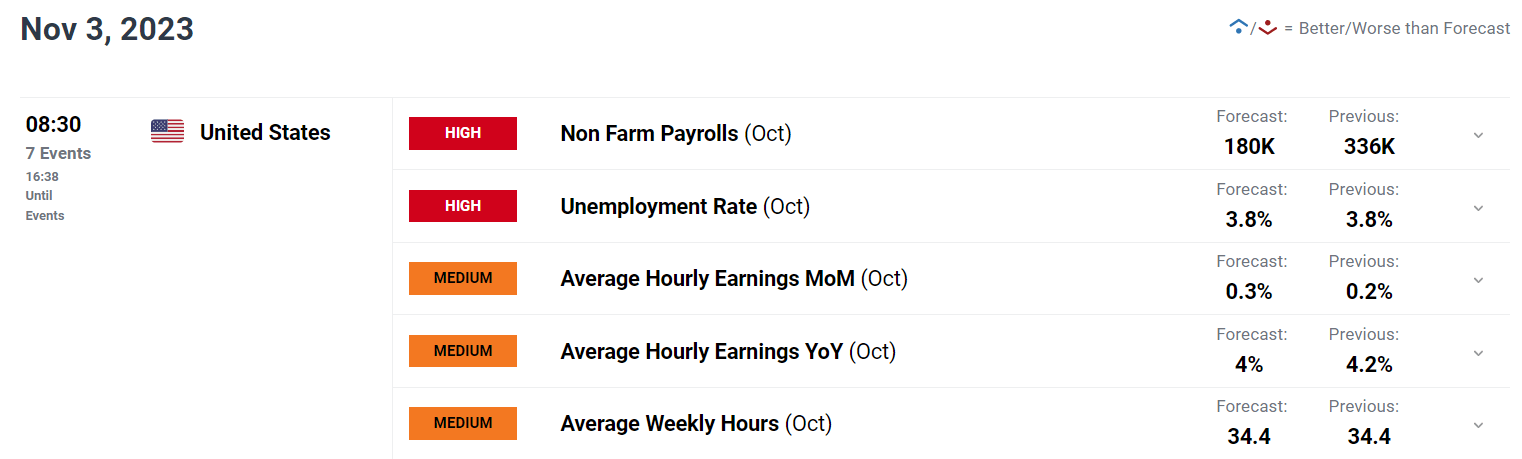
Data tomorrow could be key for USDCAD as we have releases from both the US and Canada. Canadian Unemployment and average hourly wage data will be released but is likely to be overshadowed by the release of the US NFP and labor data release. The NFP is even more interesting this month following a blockbuster print last month, with market participants keeping a close watch to gauge whether that was a one off or whether the strong hiring of late will continue.

image1.png

TECHNICAL ANALYSIS USDCAD

USDCAD failed in its attempts to pierce through the 1.3900 resistance area closing yesterday with a shooting star candle close and followed by another bearish day. A candle close as we stand now would see the pair print an evening star candlestick pattern which is strong reversal pattern and could signal further downside ahead.

Immediate support is provided by the 20-day MA around 1.3720 which hovers just above the recent descending trendline break and support around the 1.3650 mark. Alternatively, if we are to rally higher tomorrow post the NFP release and break above the recent high at 1.3900 then focus will shift to the psychological 1.4000 handle as a key area of resistance.

Key Levels to Keep an Eye On:

Support levels:

  • 1.3720
  • 1.3650
  • 1.3500

Resistance levels:

  • 1.3820
  • 1.3900
  • 1.4000

USD/CAD Daily Chart

IG CLIENT SENTIMENT

Taking a look at the IG client sentiment data and we can see that retail traders are currently net SHORT with 68% of Traders holding short positions. Given the contrarian view adopted here at DailyFX to Client Sentiment will USDCAD revisit recent highs at 1.3900?

US Jobs Report Preview: Forecast for EUR/USD and GBP/USD

US Jobs Report Preview: Forecast for EUR/USD and GBP/USD

Wall Street will be on high alert Friday morning when the U.S. Bureau of Labor Statistics publishes its most recent employment survey. With the potential to alter the Federal Reserve’s monetary policy outlook, this report is set to draw substantial attention and scrutiny, possibly resulting in greater market volatility heading into the weekend.

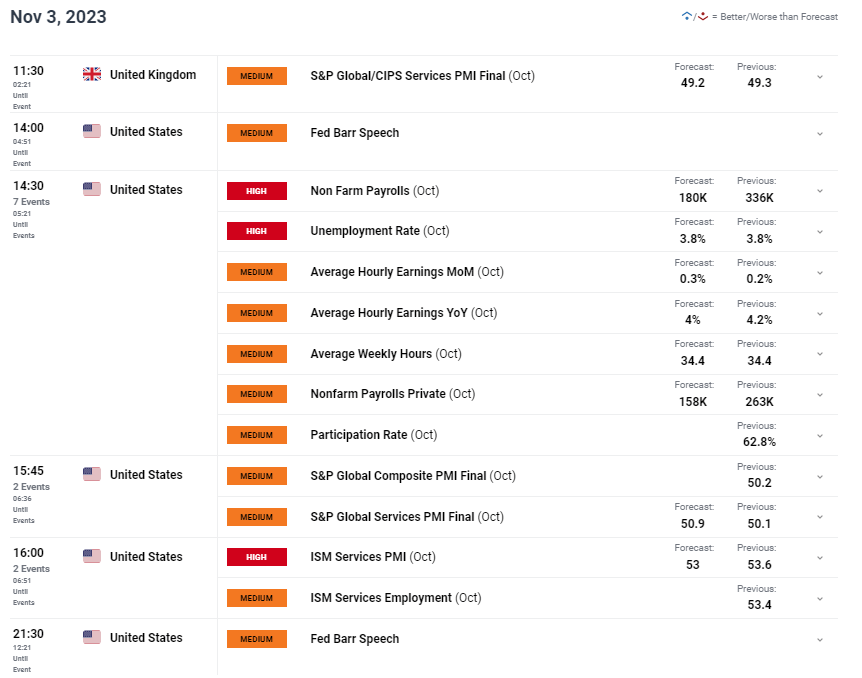
Consensus forecasts suggest that U.S. employers increased payrolls by 180,000 in October, following the addition of 336,000 jobs in September. Separately, household data is expected to reveal that the unemployment rate remained unchanged at 3.8%, highlighting the persistent tightness in labor market conditions.

Focusing on compensation, average hourly earnings are seen rising 0.3% monthly, which would result in an annual reading of 4.3%. For the Federal Reserve, pay growth is a critical metric, serving as an indicator of inflationary trends. Therefore, it is of utmost importance to observe the progression of wages in the broader economy and assess their compatibility with the 2.0% inflation target.

Take your trading skills to the next level and gain a competitive edge. Download the U.S. dollar’s Q4 forecast today for exclusive insights into the pivotal catalysts that should be on every trader’s radar.

UPCOMING US LABOR MARKET DATA

image1.png

POSSIBLE MARKET SCENARIOS

Fed Chair Powell has maintained the possibility of additional policy tightening for the current cycle, but has not firmly embraced this scenario, pledging to proceed carefully in the face of growing uncertainties. This suggests that policymakers will rely heavily on incoming information to formulate future decisions.

Looking at implied probabilities, the odds of a quarter-point rate rise at the December Fed meeting sits at roughly 20% at the time of writing. Market pricing has been in a state of flux lately, but the likelihood of another hike could rise materially if payroll numbers beat projections by a wide margin. Any NFP headline figure above 275,000 could have this effect on expectations.

Generally speaking, a very hot employment survey could spark a hawkish repricing of the Fed’s policy path, creating the right conditions for U.S. Treasury yields to resume their ascent after their recent pullback. This scenario could give the U.S. dollar a boost against its top peers such as the euro and the British pound.

On the other hand, if hiring activity disappoints and confirms that the economic outlook is deteriorating, rates could continue their retrenchment, sending the broader U.S. dollar lower. This scenario would be supportive of EUR/USD and GBP/USD, allowing both pairs to extend their nascent recovery. Anything below 100,000 jobs should be bearish for the American currency.

Keen to understand the role of retail positioning in EUR/USD’s price action dynamics? Our sentiment guide delivers all the essential insights. Get your free copy today!

FOMC MEETING PROBABILITIES

image2.png

Discover what sets the best apart and unlock the secrets of trading consistency: download our comprehensive guide on the traits of successful traders and step up your game!

EUR/USD TECHNICAL ANALYSIS

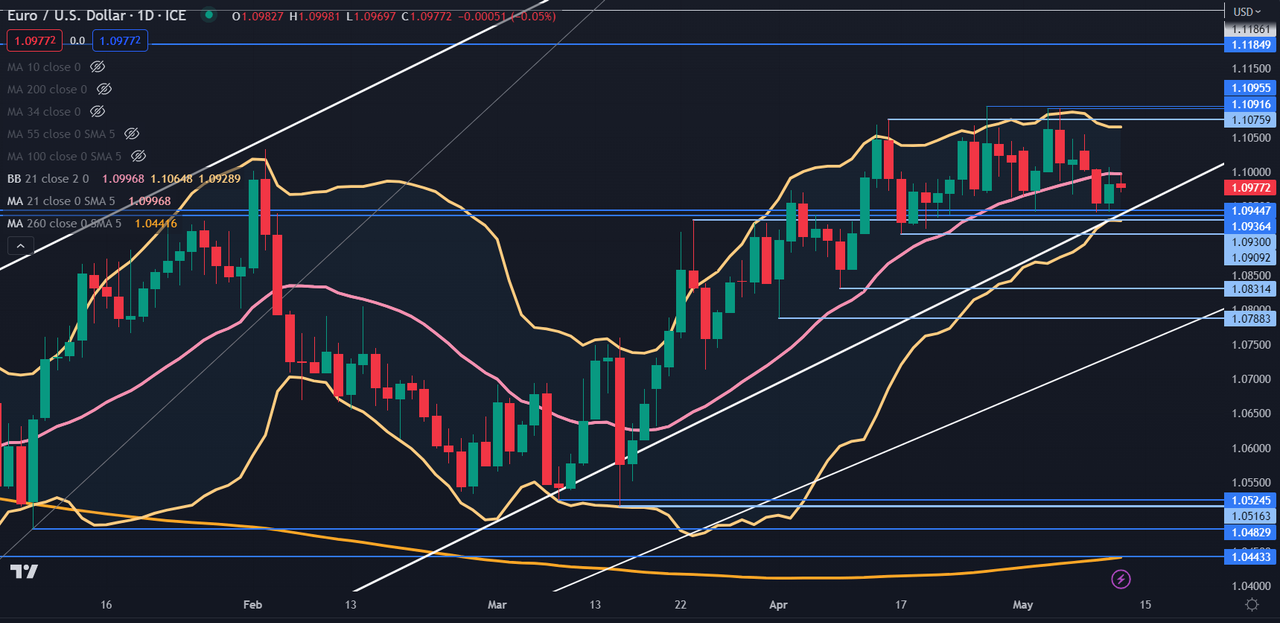
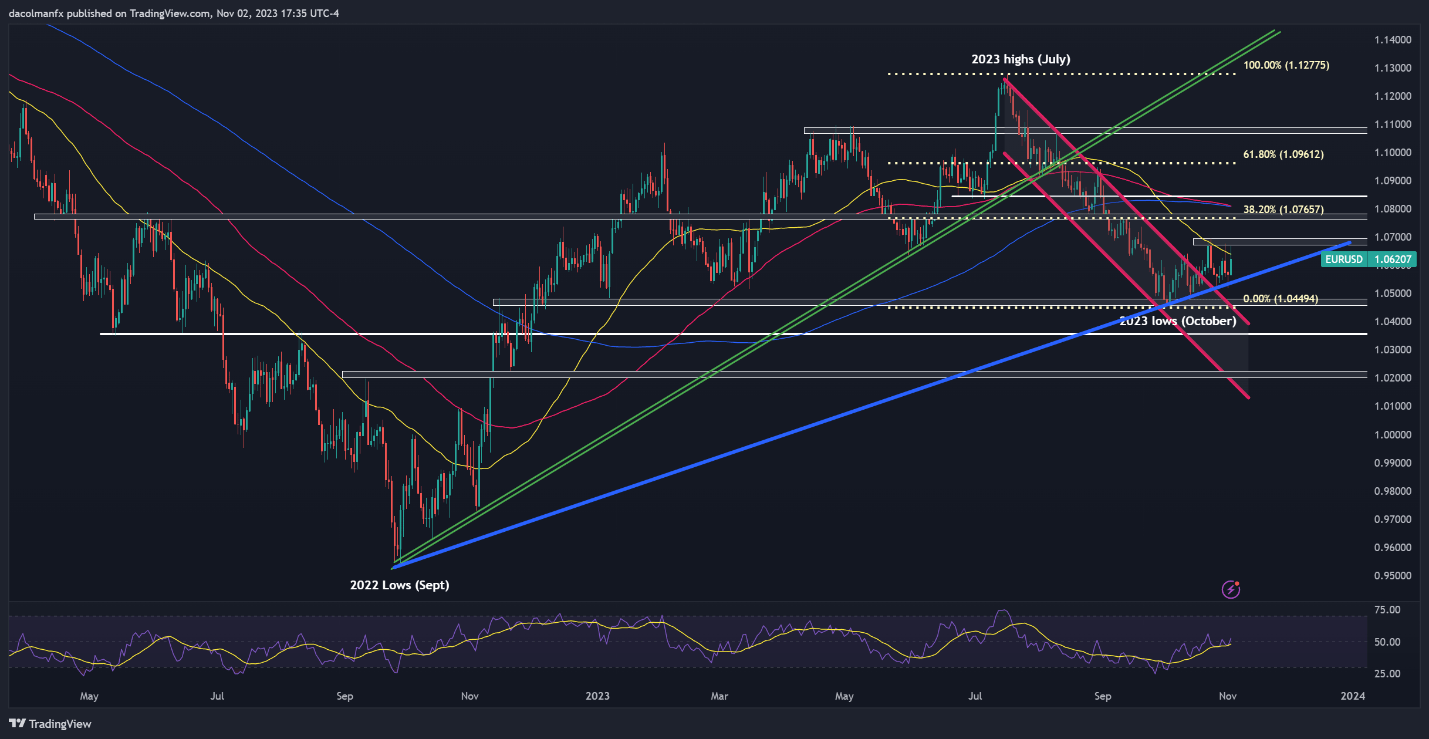
EUR/USD rebounded on Thursday amid broad-based U.S. dollar weakness, but fell short of taking out overhead resistance stretching from 1.0670 to 1.0695. For confidence to improve further, we need to see a clear and clean move above 1.0670/1.0695 in the coming days. If this scenario unfolds, the bullish camp may reassert dominance, paving the way for a rally towards 1.0765, the 38.2% Fibonacci retracement of the July/October selloff.

On the other hand, if sellers regain the upper hand and drive prices below trendline support at 1.0535, downward momentum could intensify, opening the door for a drop toward the 1.0450. Below this region, the next area of interest is located at 1.0355.

Curious about the expected path for EUR/USD and the market catalysts that should be on your radar? Explore all the details in our Q4 euro trading guide. Download it now!

EUR/USD TECHNICAL CHART

A screen shot of a graph  Description automatically generated

GBP/USD TECHNICAL ANALYSIS

The British pound has b

een weakening against the U.S. dollar since mid-July, with GBP/USD steered to the downside by a well-defined bearish trendline and marking impeccable higher lows and lower lows during its slide. Earlier in the week, cable made a push towards trendline resistance at 1.2200, but failed to clear it decisively, a sign that the bulls have not yet developed the necessary momentum for a breakout.

For a clearer picture of the short-term prospects for GBP/USD, it’s vital to assess how prices behave around crucial levels over the next few days, taking into account two potential scenarios.

Scenario one: Breakout

If cable manages to breach dynamic resistance at 1.2200, we could see a move towards 1.2330. On further strength, the focus shifts to the 200-day simple moving average near 1.2450.

Scenario two: Bearish rejection

If cable gets repelled lower from its current position, the pair could head toward its yearly lows at 1.2075, where the 38.2% Fibonacci retracement of the 2022/2023 rally aligns with several swing lows. Maintaining this technical support is of utmost importance; any breach could trigger a decline towards the 1.1800 handle.

Wondering how retail positioning can shape the short-term trajectory of GBP/USD? Our sentiment guide has all the relevant information you need. Grab a free copy now!

GBP Price Forecast: Pound Clinging to Post-BoE Gains

GBP Price Forecast: Pound Clinging to Post-BoE Gains

GBPUSD FUNDAMENTAL BACKDROP

The British pound has held onto yesterday’s gains after the Bank of England (BoE) decided to keep interest rates on hold. A quick summary of the meeting included BoE Governor Andrew Bailey reiterating the need to maintain rates at current levels for a longer period of time to bring down inflation in the UK. With lagged effects from prior hikes, keeping monetary policy conditions tight can ensure further declines in inflation and the UK jobs market respectively.

Money market pricing (see table below) shows December 2024 expectations for additional rate cuts being increased to 51bps from 40bps earlier this week. This pricing is incongruent with Governor Bailey’s messaging as well as the BoE’s inflation forecasts. Time and more data will give traders a more accurate picture of the potential trajectory of the BoE.

BOE INTEREST RATE PROBABILITIES

image1.png

The economic calendar (below) is largely centered around US specific data but UK services PMI will impact cable first. Moving into contractionary territory over the last two months, forecasts suggest this may remain below the 50 mark for October and shouldn’t have much of an influence on the pair. Volatility will likely pick up later in the trading session via the Non-Farm Payroll (NFP) report after weaker jobs data through ADP employment change and jobless claims earlier this week. Average earnings will be monitored closely to see whether or not recent declines continue or not.

ISM services PMI is another crucial statistic for the US being a primarily services driven economy. Unlike the UK, the US has managed to remain within the expansionary zone for this metric. Fed speakers are also scattered throughout the day and will provide their thoughts post-FOMC.

GBP/USD ECONOMIC CALENDAR (GMT +02:00)

image2.png

TECHNICAL ANALYSIS

GBP/USD DAILY CHART

image3.png

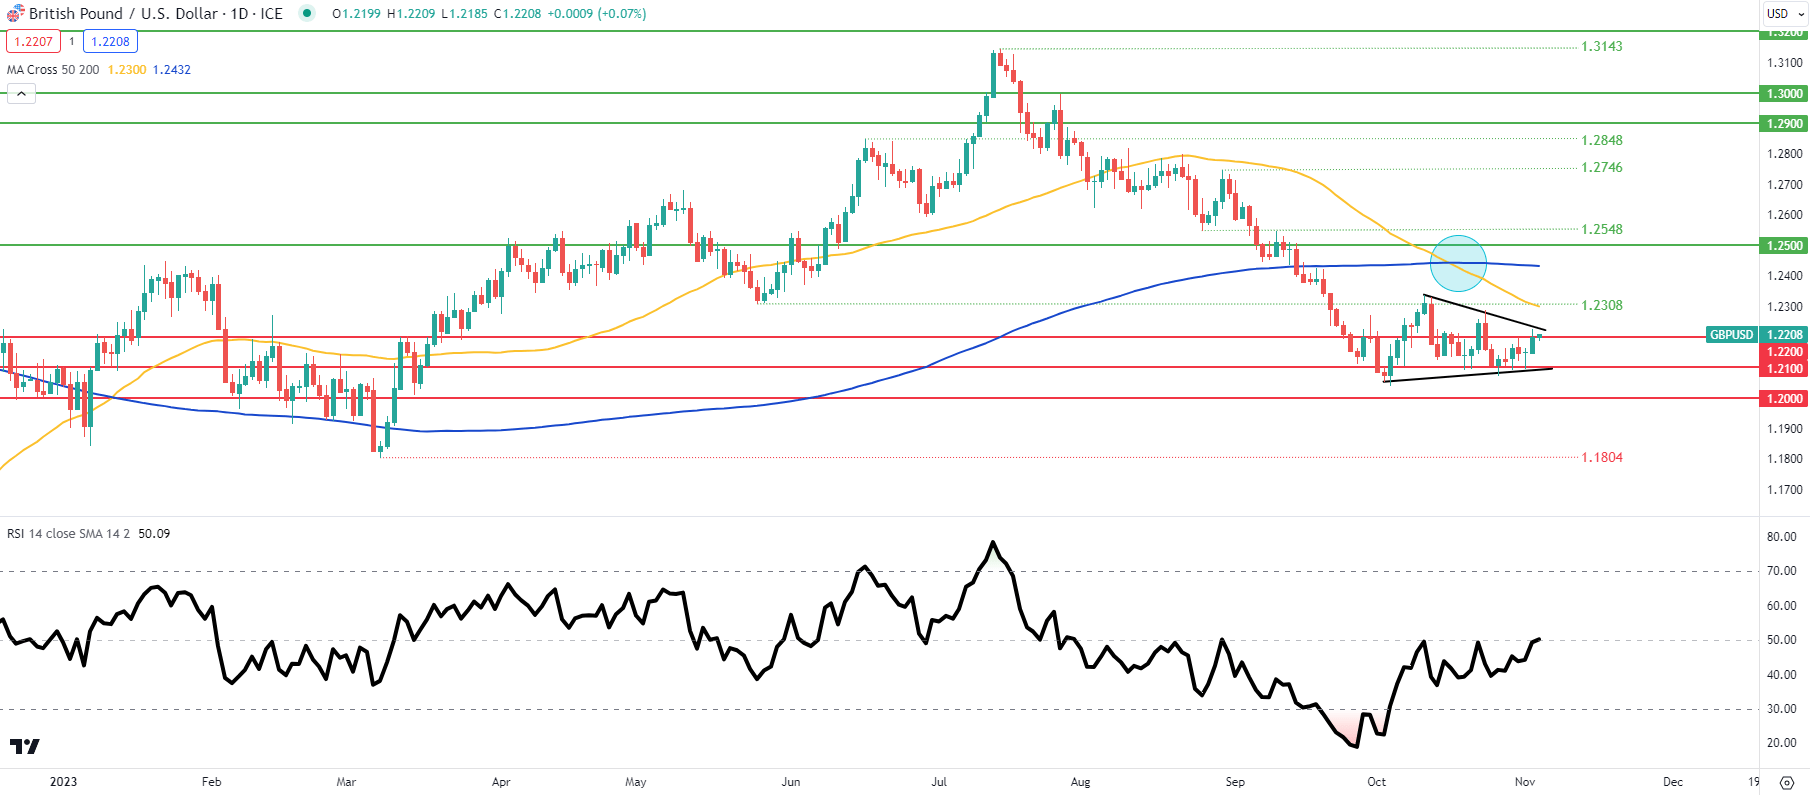
GBP/USD price action above shows the pair trading within a symmetrical triangle pattern (black) that traditionally tends to follow the preceding trend – downtrend in this case. That being said, a confirmation close and breakout above triangle resistance could invalidate this outlook. The short-term directional bias will likely be determined by the aforementioned US data which should keep investors cautious ahead of the announcements. The Relative Strength Index (RSI) supplements this viewpoint as the 50 level suggests market hesitancy favoring neither bullish nor bearish momentum.

Key resistance levels:

  • 200-day MA (blue)
  • 1.2308/50-day MA (yellow)
  • Triangle resistance

Key support levels:

  • 1.2200
  • 1.2100/Triangle support
  • Trendline support
  • 1.2000
  • 1.1804

BULLISH IG CLIENT SENTIMENT (GBP/USD)

IG Client Sentiment Data (IGCS) shows retail traders are currently net LONG on GBP/USD with 67% of traders holding long positions (as of this writing).

Curious to learn how market positioning can affect asset prices? Our sentiment guide holds the insights—download it now!

Understanding Inflation and its Global Impact

Understanding Inflation and its Global Impact

What is Inflation?

Inflation is the rise in prices of goods and services in an economy over a period of time, and is often displayed in percentage form. For example, if inflation is 2%, this suggests that prices are (on average) 2% higher than the previous period. Therefore, if a bottle of water cost $1 last year then this year it should be around $1.02. Inflation can result in significant costs to an economy as the purchasing power of individuals fall.

Deflation

Deflation is the opposite of inflation where prices fall. This suggests low demand for goods and services and often leads low interest rates. Deflation is atypical amongst developed countries.

Stagflation vs Hyperinflation

Stagflation occurs when an economy is stagnant (low growth) but inflation is still prevalent. This can occur when external factors impact an economy such as the price of oil.

Hyperinflation is an extremely high rate of inflation within an economy. Hyperinflation can be caused by an increase in money supply which consequently results in increased consumer spending and higher demand for goods and services.

Both deflation and hyperinflation can be detrimental to an economy and can result in higher rates of unemployment and lower growth. This makes the role of central banks critically important to control inflation as a lack of stability may have the potential for destructive penalties.

Measuring Inflation

Consumer Price Index (CPI)

This is one of the more common ways of measuring inflation, calculating inflation is based on a basket of goods and services which are often referred to as a ‘cost-of-living index’. Common cost-of-living indexes are the Consumer Price Index (CPI) and Retail Price Index (RPI). These measures relate to inflation experienced by consumers on a daily basis. Each central bank faces unique headwinds in selecting appropriate items to include within their inflation calculation.

Core CPI vs Headline CPI:

Two common phrases when dealing with inflation is ‘core’ and ‘headline’ CPI. This differentiating factor between the two terms is quite simple. Core CPI refers to the omission of food and energy prices from the Consumer Price Index while headline CPI includes both food and energy prices.

Producer Price Index (PPI)

The Producer Price Index (PPI) focuses on inflation at the early stages of production which can provide essential information for manufacturers and industry. The chart below shows the historical comparison between the different inflation measures (CPI, PPI and GDP Deflator). It is clear that PPI is the most volatile which can be explained in part by producers being unable to pass on relatable costs to the consumer in difficult periods such as the global financial crisis.

GDP Deflator

Another way to measure inflation is via the GDP deflator which takes into account domestic goods only while CPI and/or RPI includes foreign goods, as well. A second key difference is that the GDP deflator method encompasses all goods and services while CPI and/or RPI only measures the price of goods and services bought by consumers. Because the GDP deflator is not restricted by a fixed basket of goods, it has an advantage over the others.

GDP Deflator = (Nominal GDP/Real GDP) x 100

Each measure has bespoke properties that may appeal to different individuals. Therefore, there is no ‘best’ way to calculate inflation but rather each measure has unique aspects that will be suited for different requirements and applications.

PPI vs CPI vs GDP Deflator
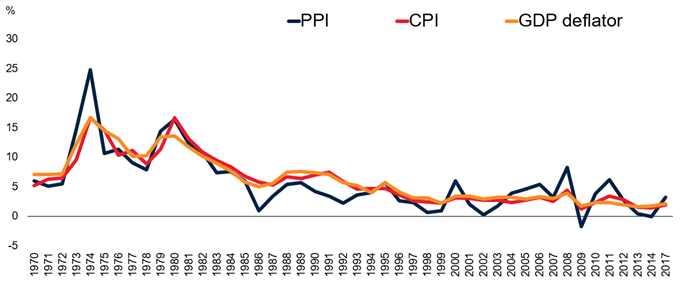
PPI vs CPI vs GDP Deflator

Source: World Bank

Sources of Inflation

Inflation can begin via many avenues in isolation or combination. Below are a few of the primary sources of inflation that can distress any nation across the globe:

Exchange Rates

A weakening local currency means that more local currency is required to purchase imports. This increased cost gets passed on to the end consumer which can contribute to inflation.

Essential Commodity Prices

Most manufacturers require inputs to produce a certain good. These often come in the form of commodities such as iron ore or oil. If these inputs increase in price due, then those costs can be passed on to consumers and the higher costs are a form of inflation.

Interest Rates

Lower interest rates theoretically lead to more spending by consumers, ultimately resulting in greater demand and cost of goods; which should lead to inflation, all factors held equal.

Government Debt

Increases in government debt may infer that there is a greater potential of a government default, which leads to higher yields on treasury securities to compensate potential investors for the higher risk. The effect this has on the public is that more tax revenue will be allocated to the higher interest payments on government debt obligations which reduces living standards. Businesses in turn increase the prices of goods and services to offset the lessened government expenditures, and this can lead to inflation.

The sources listed above generally fall into two broad categories of inflation which are:

  1. Demand-Pull Inflation – This type of inflation comes as a result of an increase in aggregate demand inclusive of households, governments, foreign buyers and businesses.
  2. Cost-Push Inflation – Supply is the driver of inflationary pressure for cost-push inflation. When supply falls due to higher production costs, the outcome is higher final prices for consumers.

Consequences of Inflation

Value of Money

The most obvious penalty of inflation from a consumer point of view is the higher cost of goods and services. This translates to a decrease in the value of money as individuals can now purchase fewer goods and services with the same amount of money prior to an inflationary rise.

Wealth Gaps

The inequitable distribution of inflationary pressure amongst individuals can lead to changes in wealth. For example, individuals with loans during periods of high inflation will benefit as the real value of their debt repayments will fall over time while others may not.

Inflation Volatility

Fluctuating or erratic inflation data complicates business operations as businesses do not know where to set prices, and this can have a negative effect on the economy as both businesses and consumers adjust to the higher rates of inflation. Long-term business deals will also incur higher costs as volatile inflation causes a higher risk premia on hedging costs, which can reduce foreign investor confidence.

Central banks use of Inflation Targeting

Inflation targeting is quite simple in theory as involves a central bank setting a specific inflation goal in percentage terms. This strategy is achieved by manipulating monetary policy. The goal of inflation targeting allows central banks along with the public to have more clarity in terms of future expectations. The reason behind inflation targeting is control with regards to price stability, and price stability can be attained by governing inflation.

Generally an inflation target of 1% – 2% is familiar as it allows governments and central banks some flexibility at this low base. As a rule of thumb, any deviation greater than 1% either side of the targeted figure is cause for concern and has generally lead to policy intervention.

How do Governments Control Inflation?

There are many ways governments go about controlling inflation which can have knock-on effects (positive and negative) to the economy depending on current economic conditions. The most common way is via contractionary monetary policy which is used by central banks to curb inflation by restricting liquidity. This is achieved via 3 main avenues:

1. Decrease Money Supply

Decreasing money supply simply gives consumers less money to spend overall and should help limit inflation. One way this can be realized is by increasing interest on sovereign bond payments which can attract more investors to buy bonds.

2. Reserve Constraints

Restricting the amount of money banks are allowed to keep can influence the amount of money being lent to consumers. That is, if banks are required to keep higher amounts of money as a legal threshold, then naturally banks will have less money to lend. This should decrease consumer spending and thus, inflation.

3. Raising Interest Rates

Higher interest rates which result in fewer individuals willing to borrow and therefore leads to a decrease in spending. There’s also a greater opportunity cost of investing capital into a business given the higher rates of return that could be had through capital markets.

Global Inflation and Key Relationships

Advanced vs Developing Economies
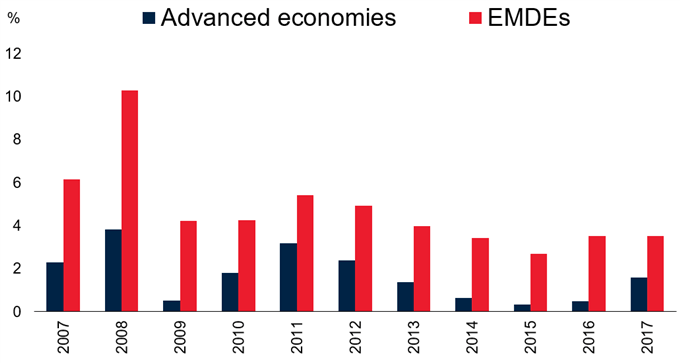
Advanced vs Developing economies

Source: World Bank

The chart above shows a consistent and logical pattern whereby the historical inflation rate in developed countries is generally less than emerging and developing economies (EMDE).There are two primary reasons behind this:

  1. EMDE generally have higher growth rates which can lead to excess demand.
  2. Volatile currencies are present in many EMDE which makes central banks’ management of monetary policy more difficult than those in advanced economies.

The Phillips Curve

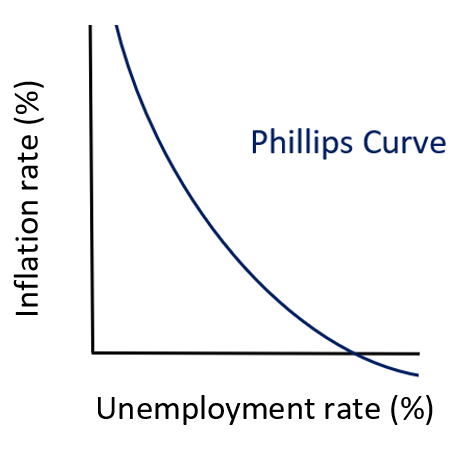
The historical relationship between unemployment and inflation has been largely inverse which means that high levels of unemployment correlates with lower inflation and vice versa. The reason why the inverse relationship exists is best explained with basic economics. For example, an increase in aggregate demand which is a consequence of demand-pull inflation, results in higher prices of goods and services and lower unemployment. This lower unemployment means that there is more income available in the economy to spend on goods and services. Both elements have recurrent effects on one another and is best represented by the basic Phillips Curve (see chart below).
The Phillips Curve

Source: Created by Warren Venketas

Inflation: Conclusion

This article has demonstrated the wide reaching implication of inflation from more concentrated effects to wide-ranging systemic global impacts. Inflation is an important economic tool from a macroeconomic perspective but also can be powerful if understood and implemented within a trading strategy as inflation data can cause changes in price in many financial markets.

Crypto News: Sam Bankman-Fried Guilty on All Counts

Crypto News: Sam Bankman-Fried Guilty on All Counts

Sam Bankman-Fried Guilty on All Counts

The jury wasted no time in returning guilty verdicts on seven charges of securities fraud, wire fraud, money laundering, and conspiracy. Sam Bankman-Fried faces up to 110 years in prison. Significantly, the jury deliberated for just four hours before reaching guilty verdicts on all counts.

According to the Inner City Press, Judge Kaplan set a March 28, 2024 sentencing date. Before sentencing, SBF faces a second trial, set for March 15, 2024. Parties must advise the Court by February 1 if the trial will proceed.

Trading Derivatives carries a high level of risk to your capital and you should only trade with money you can afford to lose. Trading Derivatives may not be suitable for all investors, so please ensure that you fully understand the risks involved, and seek independent advice if necessary. A Product Disclosure Statement (PDS) can be obtained either from this website or on request from our offices and should be considered before entering into a transaction with us. Raw Spread accounts offer spreads from 0.0 pips with a commission charge of USD $3.50 per 100k traded. Standard account offer spreads from 1 pips with no additional commission charges. Spreads on CFD indices start at 0.4 points. The information on this site is not directed at residents in any country or jurisdiction where such distribution or use would be contrary to local law or regulation.

Outside the Courtroom, federal prosecutor Damian Williams reportedly had this to say,

“The crypto industry might be new, the players like Sam Bankman-Fried may be new, but this kind of fraud is as old as time, and we have no patience for it.”

SEC Serves PayPal with Subpoena

On Wednesday, November 1, 2023, the SEC subpoenaed PayPal (PYPL), requesting documents relating to the PayPal USD (PYUSD) stablecoin. In a statement, PayPal said it was cooperating with the SEC.

Investors brushed aside the news. The share price jumped 6.58% on Thursday as investors responded to upbeat full-year profit forecasts.

Coinbase Report Fall in Trading Volumes

On Thursday, Coinbase (COIN) shares rallied 8.73%. However, COIN was down 4.27% in after-hours trading. A slump in trading volumes overshadowed better-than-estimated revenues.

Coinbase CEO Brian Armstrong shared the results on X (formerly Twitter).

Coinbase is in a legal battle with the SEC for allegedly operating as an unregistered securities exchange, broker, and clearing agency. Additionally, the SEC charged Coinbase for the unregistered offering and selling of securities in connection with its staking-as-a-service program.

In August, Coinbase filed a motion to dismiss (MTD). Since then, the SEC filed its opposition, with Coinbase submitting its reply brief. Presiding Judge Katherine Failla set a court date of January 17, 2024, for parties to present oral arguments.

Technical Analysis

Bitcoin Analysis

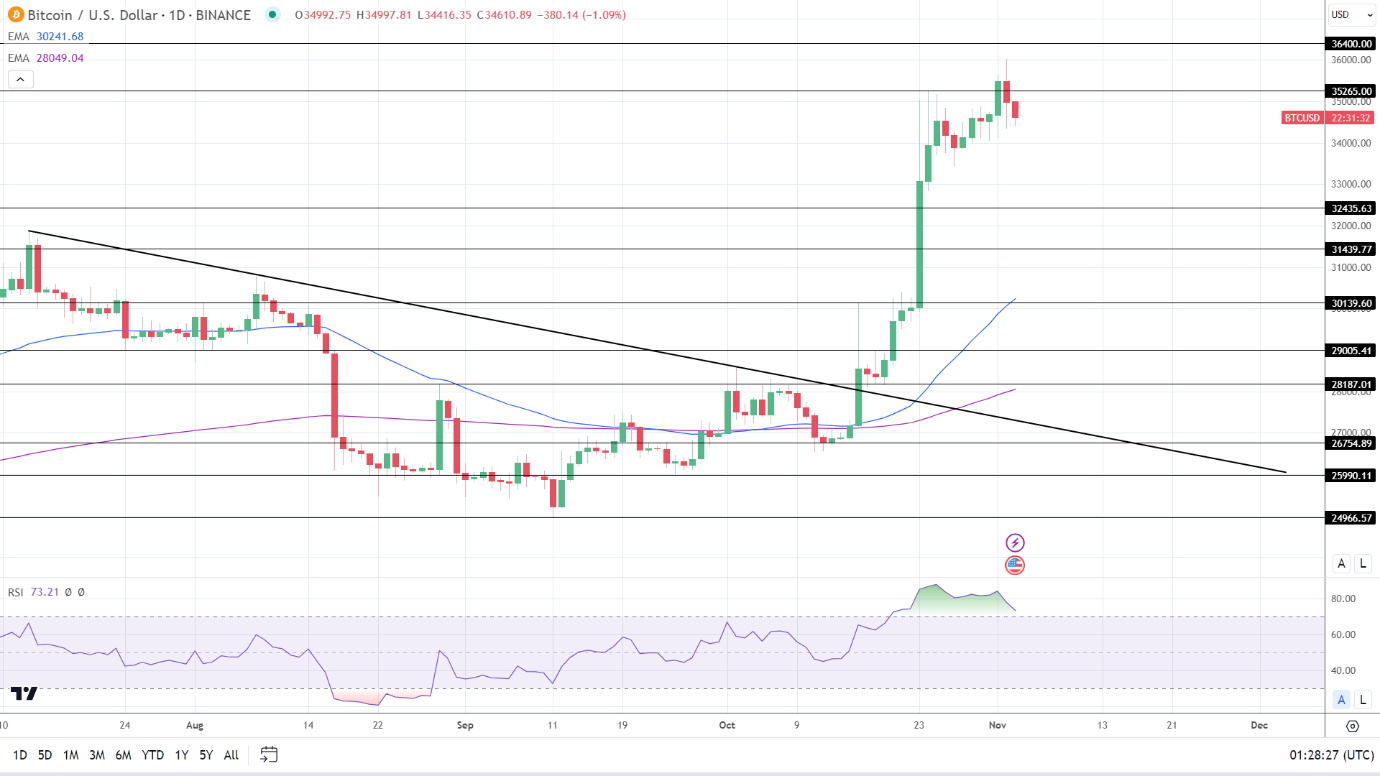
BTC held above the 50-day and 200-day EMAs, affirming bullish price signals.

A BTC break above the $35,265 resistance level would support a move toward the $36,400 resistance level. However, BTC may need a crypto event to break down resistance at the Thursday high of $36,024.

On Friday, BTC-spot ETF-related news and SEC activity will remain the focal points.

A BTC drop below $34,000 would give the bears a run at the $32,436 support level.

The 14-Daily RSI reading of 73.21 shows BTC sitting in overbought territory. Selling pressure may intensify.

BTC Daily Chart sends bullish price signals.

BTCUSD 031123 Daily Chart

Ethereum Analysis

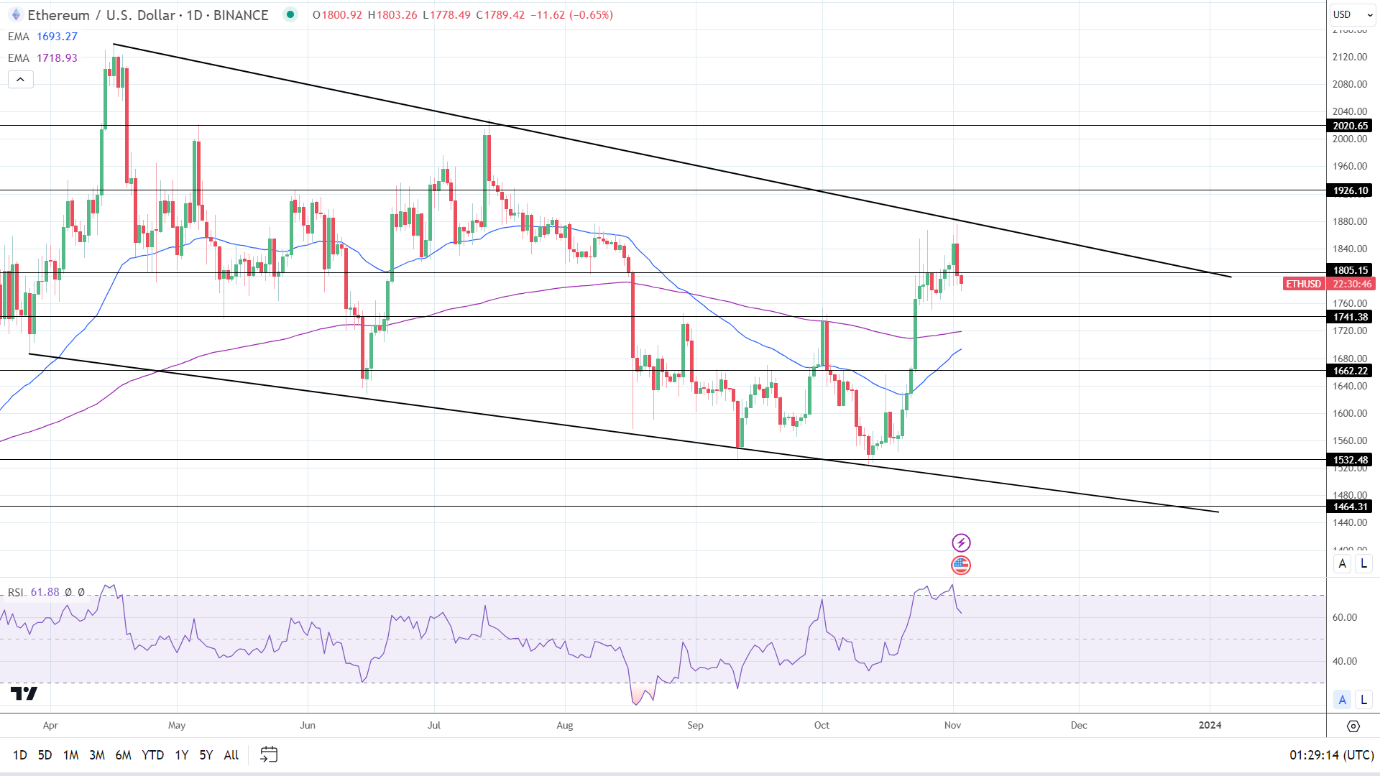
ETH remained above the 50-day and 200-day EMAs, affirming bullish price signals.

An ETH break above the $1,805 resistance level would support a move to the trend line. News updates on the SEC cases against Ripple and Coinbase and ETH-spot ETF-related news will also influence buyer appetite.

Failure to break above the $1,805 resistance level would leave the $1,741 support level and 200-day EMA in play.

The 14-period Daily RSI, 61.88, suggests an ETH break above the $1,805 resistance level before entering overbought territory.

ETH Daily Chart sends bullish price signals.
ETHUSD 031123 Daily Chart