Price Action Support and Resistance
As we look at throughout our education section there’s a plethora of ways to find support and resistance levels. Fibonacci is a popular tool and psychological levels are a significant point of interest. But, if markets don’t acknowledge that support or resistance – what is its point? There isn’t one, right? The only utility for support and resistance is the ability to highlight something that may happen, while allowing the trader to adopt an objective framework for their own activity within a market.
Price action swings can confirm support or resistance levels. Or – they can set the levels themselves if there’s been a significant amount of reaction at a particular price. If you’re watching the .8000 level on AUD/USD, and you see that price runs up to this value, and then finds sellers, you can then walk away knowing that not only is .8000 a level of possible resistance because it’s a psychological level -but that traders and market participants agree and have voiced that opinion with their capital. And as prices drop, more sellers can jump onto that bandwagon, and buyers, on the other side, are getting less and less bullish as price falls, thereby allowing for a further slide.
But, that level of .8000 would not have been resistance if market behaviors hadn’t changed when it came into play. It’d have been a mere speed bump on the way to higher prices as bulls pushed through.
We looked at this concept in our article on price action wicks, highlighting how intra-candle reactions can show the trader a considerable amount of information. It can highlight important levels on longer-term timeframes while removing some of the noise that’s ever-present on shorter-time frames. But, it’s the reactions as shown by wicks that highlight support and resistance levels that traders can use in their approaches.
How to Find Support and Resistance via Price Action
While price action presents a somewhat objective framework for traders to work with, identifying workable zones of support and resistance requires a bit of subjectivity.
The key is to find the areas or price levels in a market where behaviors have changed in the past, thereby highlighting the potential for change in the future. That’s not to say that support will always hold or that resistance will always bring sellers into the picture – but it does highlight areas where traders can look to impart strategy.
There’s a few different types of support and resistance that can be gleamed from price action, as well, which we’ll look at below.
The Touch and Go Long Wick
This is a popular one in fast markets. If some form of capitulation can show, it’ll often stick out in the form of a long wick. The wick of course highlights intra-candle reversals and if this is also matched with an engulf, that can be a powerful indication for near-term momentum. But, for purposes of support and resistance merely the top or bottom of the wick is needed.
In our AUD/USD example above, there was a long wick highlighting that reversal off of the .8000 level. But, even before that there was another as support, highlighting a reversal off of the .5500 level. While support technically did not penetrate the .5500 level, the fact that buyers stepped in 9 pips early shows that there was some defense going on at that price, with buyers ready to step-in before the level even came into play. This would also show that buyers were somewhat aggressive here, looking to buy even before the big figure was tested through.
In both cases identified below, strong continuation followed.
AUD/USD Weekly Chart: Long Wick Reactions – Support and Resistance
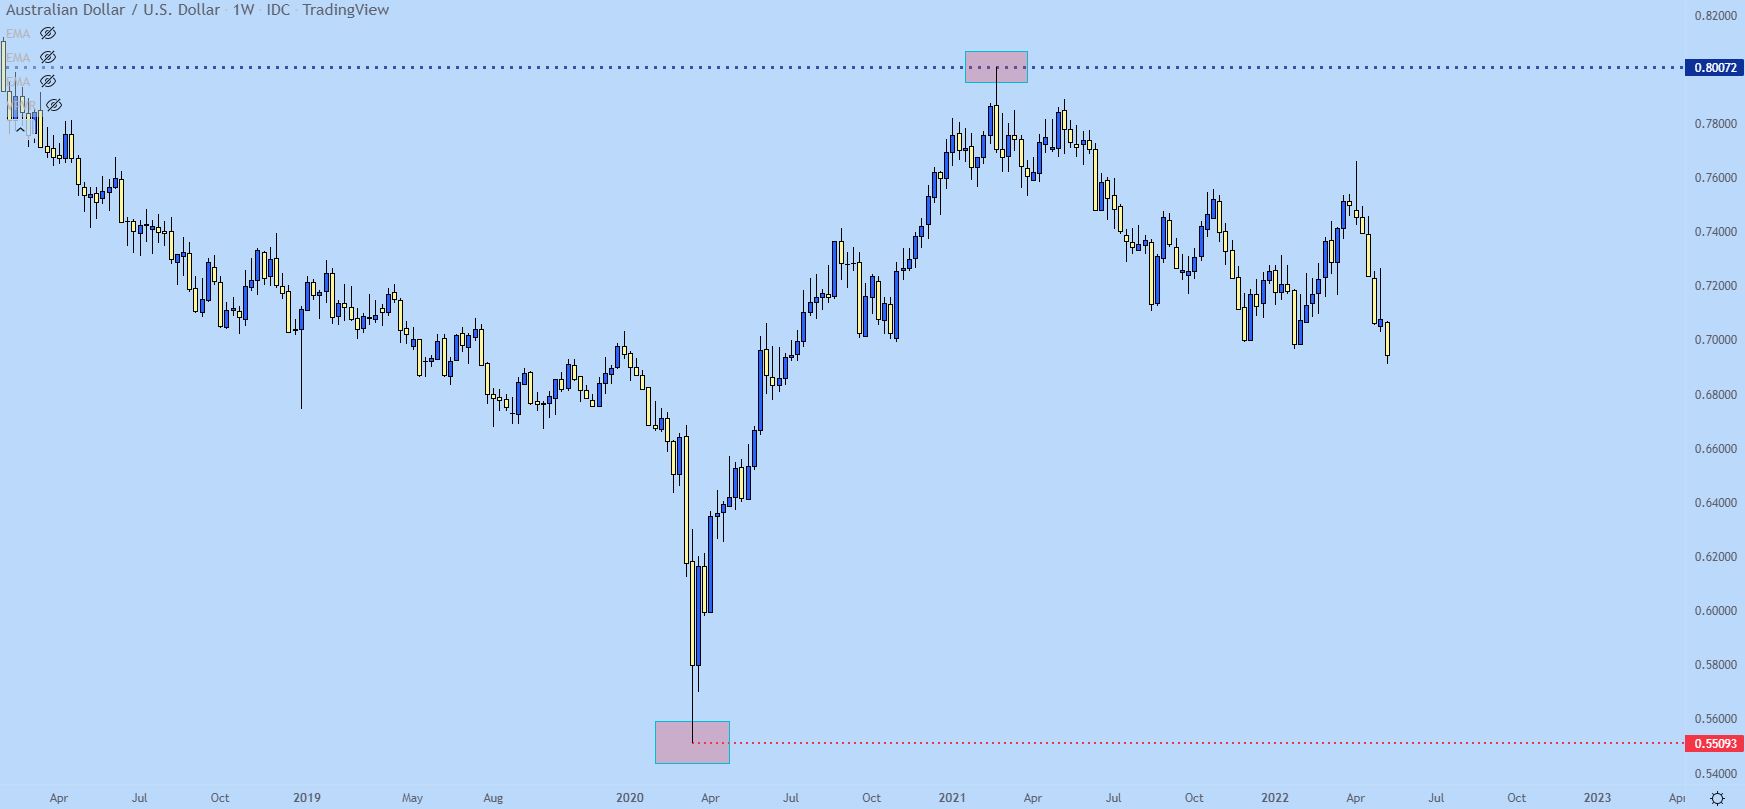
Chart prepared by James Stanley; AUD/USD Weekly chart, April 2019 – April 2022
So the above example shows two strong cases of what I’m referring to but, there’s another long wick on the chart that I haven’t touched on yet, and I don’t want this article to be just cherry picked examples of when things worked out well. So let’s dig a bit deeper…
On the left side of the above chart is a long wick highlighting a reaction, and I’ve added a purple box to this area on the below chart.
AUD/USD Weekly Price Chart
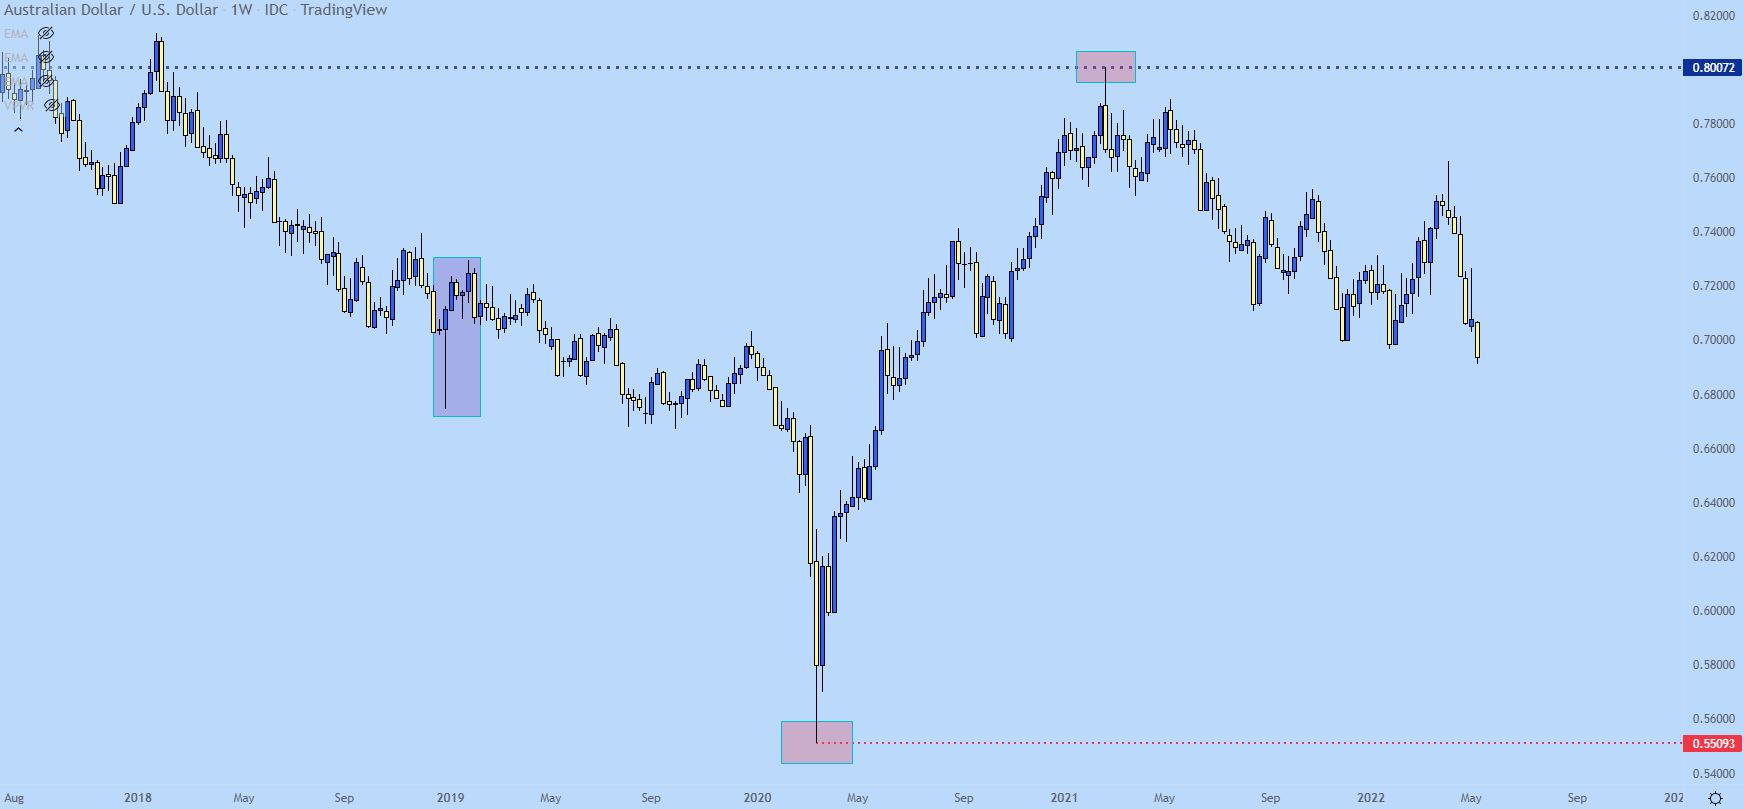
Chart prepared by James Stanley; AUD/USD Weekly chart, Aug 2017 – April 2022
Below I get a bit closer with that item and we’re essentially looking at a low point of the wick at .6743 that was followed by a strong reaction, as that weekly candle closed above the .7000 psychological level.
So, another way of thinking of that candle was that during the week, something bad happened, causing sellers to push prices below the major psychological level until, eventually, capitulation showed at around.6750. That was followed by buyers jumping in and responding to that sell-off, eventually erasing the entirety of the bearish move and then some.
Sounds pretty bullish, right? Well, for the next few weeks, buyers continued to push, eventually setting a fresh high just inside of the .7300 handle (.7295 to be specific). This highlights how long wicks can highlight reversals that could then continue for a bit. But, that’s not why we’re looking at this example. Instead, focus on the point of support as produced by the long wick at .6743.
That price comes back later in the year and for almost three full months – helps to set the low in the pair. I’ve added a dark red box around this area as that support played out.
AUD/USD Weekly Price Chart (Oct 2016 – July 2021)
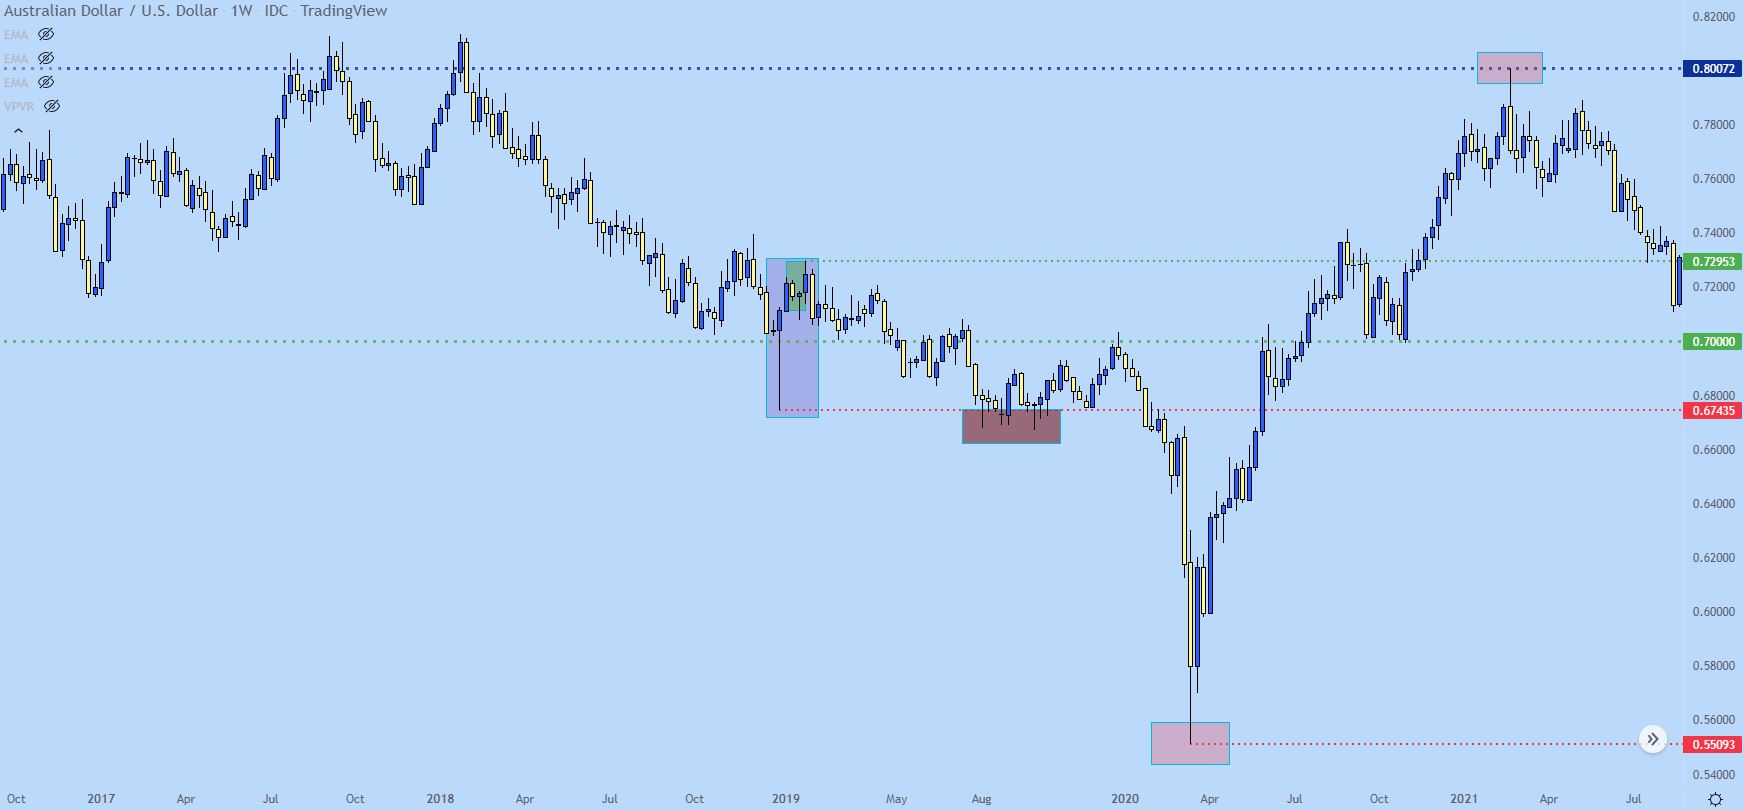
Chart prepared by James Stanley; AUD/USD Weekly chart, Oct 2016 – July 2021
So, in that above example, support as produced by the long wick helped to hold the lows after coming into play in August of 2019. And, to be sure, this is intel that can help traders, spotting support as sellers are pushing more and more, as indicated by the lower highs that showed up between the initial test at .6743 and the latter collection of wicks on the weekly that held the low at that same spot.
But the more exciting setup off of this zone didn’t show up until February of 2020. I’ve added a green box around this area on the chart and during this three-week-period, you can see where prices gyrated around resistance at that prior support level. That led to a breakdown with another fresh low, that was followed by a brutal move of more than 1,000 pips. And the reason, given the timing, was covid, as that was getting priced-in to markets. But, as you can see from the technical backdrop the ground was set for a breakdown and covid just ended up being the reason.
Focus on the green box in the below chart, highlighting the importance of that prior long wick in a) setting support and then b) setting resistance as the breakdown took hold.
AUD/USD Weekly Price Chart
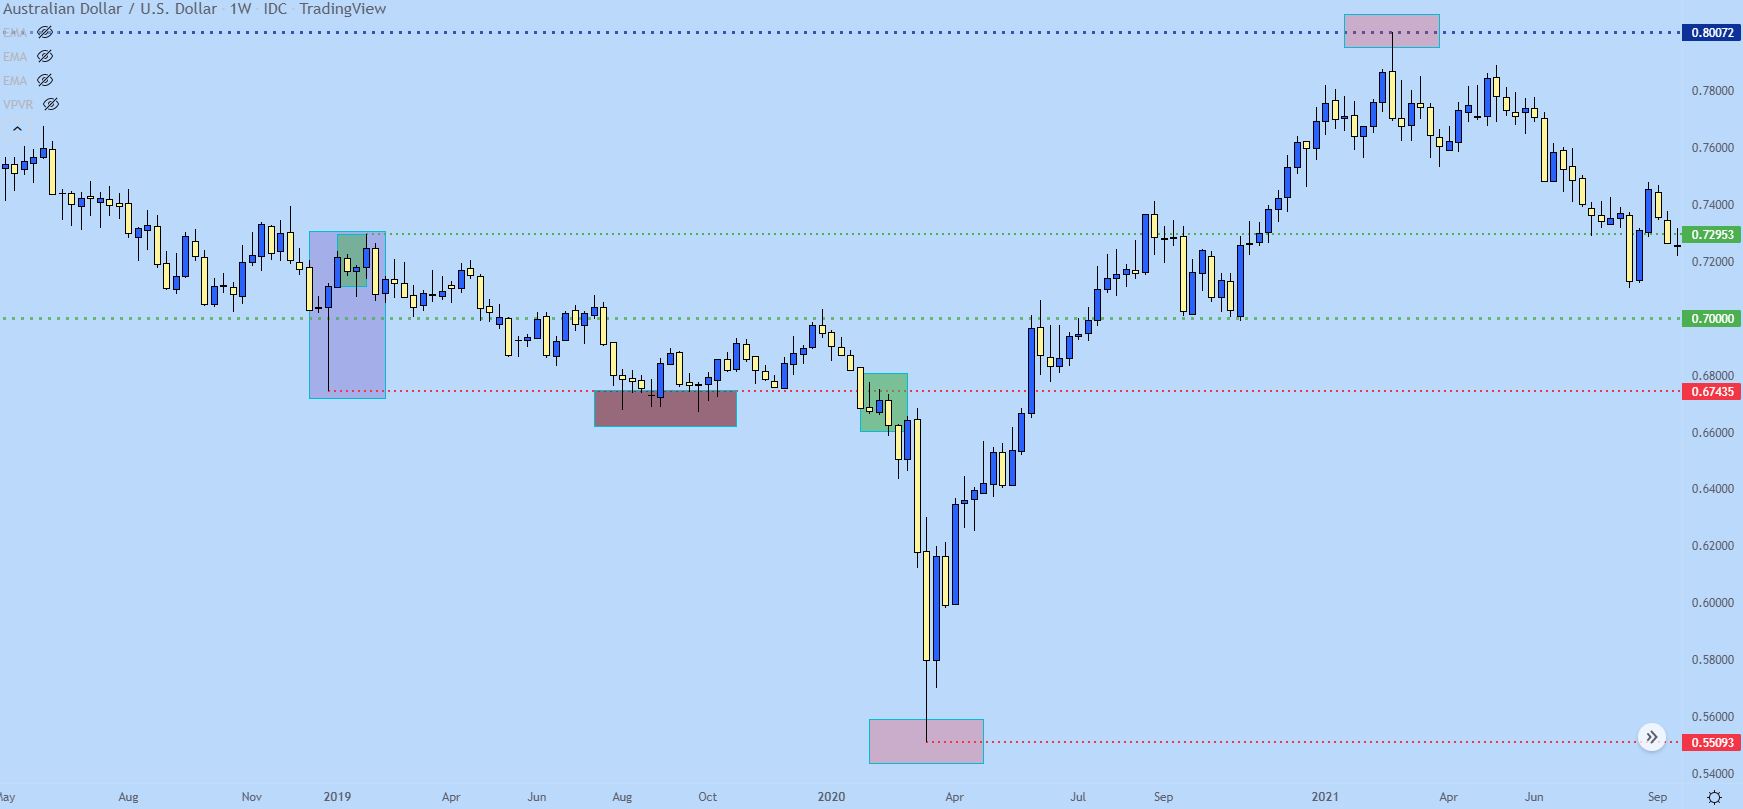
Chart prepared by James Stanley; AUD/USD Weekly chart, May 2018 – Sep. 2021
The Grouping or Collection of Wicks in Tight Proximity











 Chat now!