Pound Sterling Update: GBP/USD Uptrend in Focus

Pound Sterling Update: GBP/USD Uptrend in Focus

GBP/USD Oscillates Around Key Level as New Uptrend Takes Shape

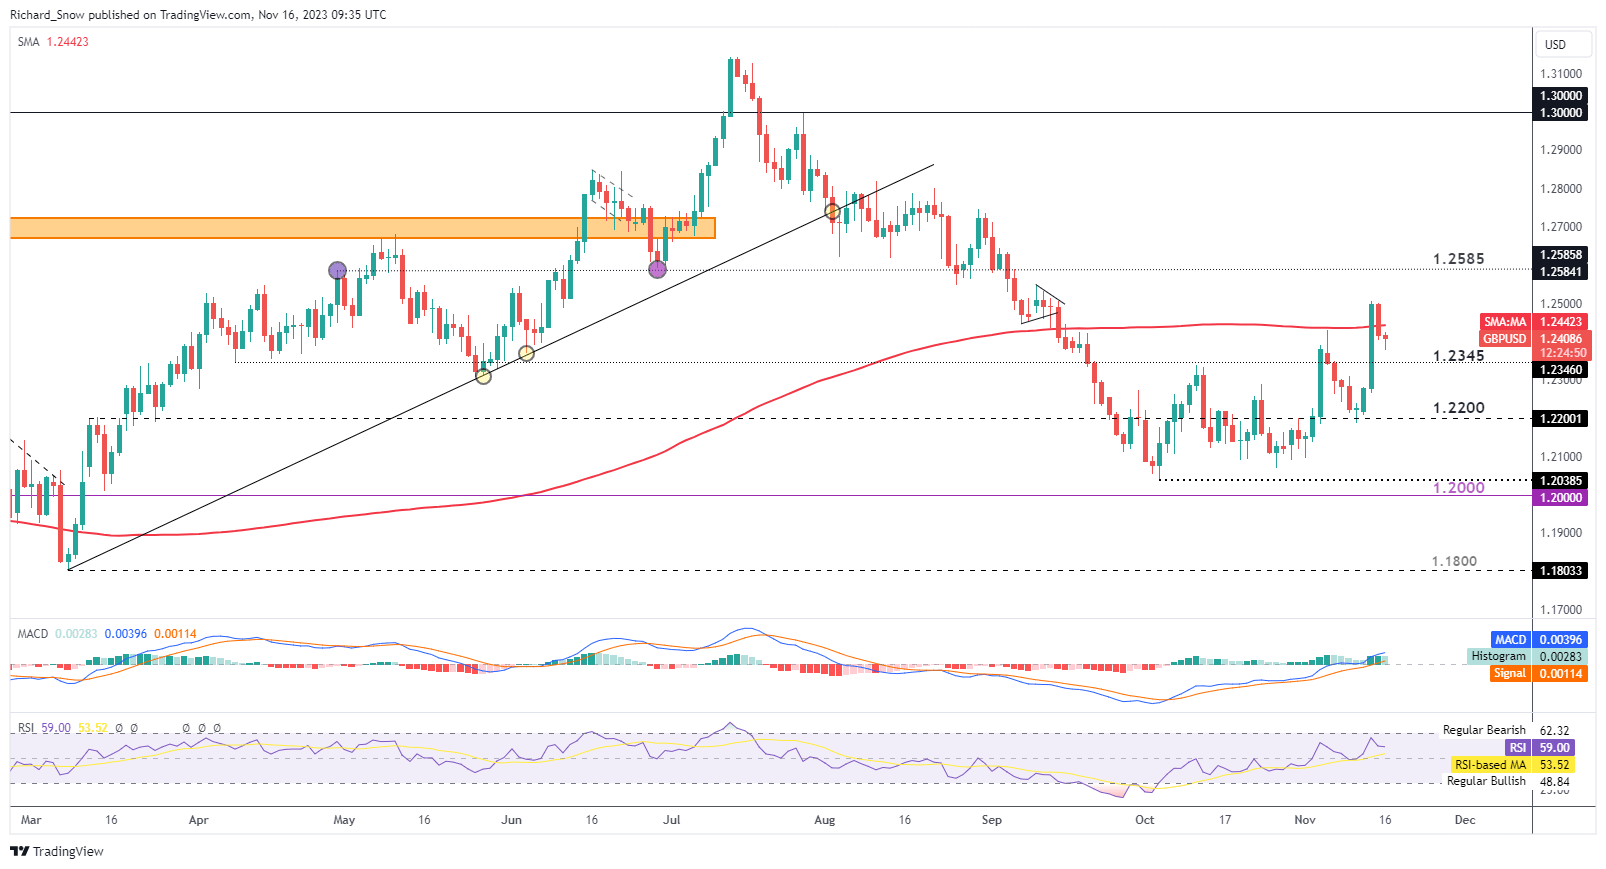
Despite a broad lack of bullish drivers, the pound continues to build a series of higher highs and higher lows, clawing back lost ground after the pair declines for the majority of 2H so far.

Recent spikes to the upside have primarily been driven by USD sell-offs sparked by worsening fundamental data experienced by the world’s largest economy. Once again, the pair has eased lower in the days following the sharp rise on Tuesday after better-than-expected US CPI data.

The 200-day SMA is the new challenge for a bullish extension with a daily close above it boding well for a continued move higher. The pair has put in a series of higher highs and higher lows meaning that from a technical perspective GBP/USD is no longer in a downtrend. Look out for any pushback from Fed officials today regarding the recent risk off sentiment and general loosening in financial conditions which may limit GBP/USD upside.

Resistance appears at 1.2585 with support at 1.2345, followed by 1.2200 flat.

GBP/USD Daily Chart

image1.png

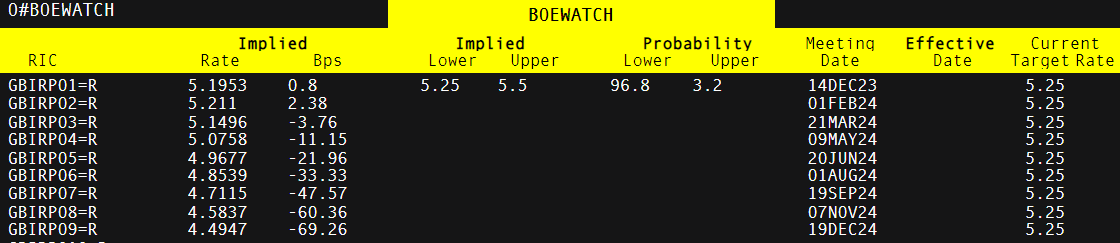
Interest rate markets across the UK, Europe and the US no longer hold out for another potential rate hike and now only consider rate cuts with a high degree of confidence. Sterling may find the slightest bit of enjoyment out of a slightly delayed first rate cut (expected by August) when compared to the US which expects a first cut by June.

Market Implied Probabilities of UK Rate Cuts

image2.png

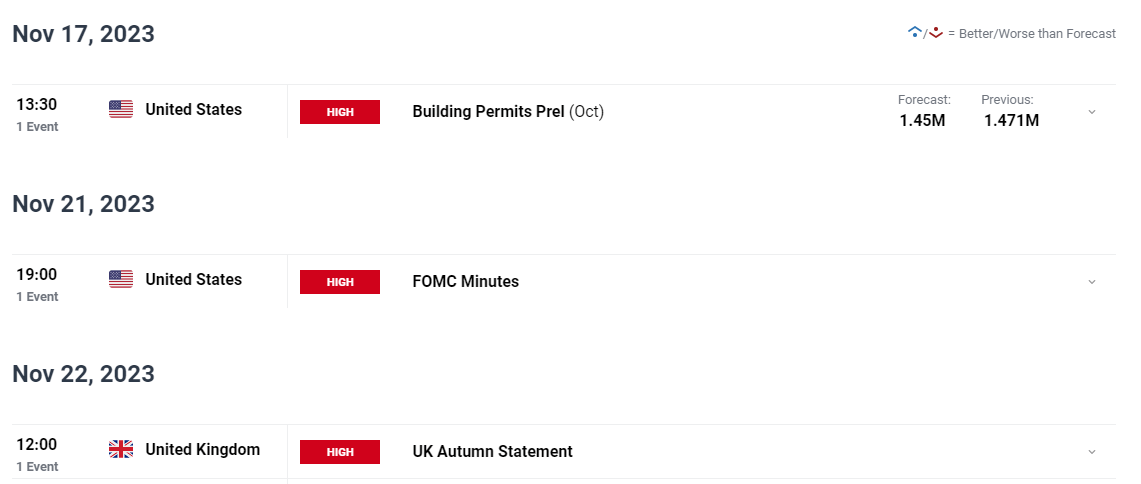
Main Risk Events on the Horizon

Apart from a considerable number of Fed speakers lined up for later today, there is the FOMC minutes next week that could provide intra-day volatility. The highlight for the UK next week is undoubtedly the Autumn Statement to be delivered by Jeremy Hunt. Earlier this week the UK Government highlighted the achievement of halving inflation in the UK before year end and political commentators now wonder if the prospect of tax cuts may be viewed in a more positive light by the Chancellor – particularly ahead of next general election.

image3.png

Crypto News: Circle Eyes 2024 IPO as Investors Await SEC v Coinbase News

Crypto News: Circle Eyes 2024 IPO as Investors Await SEC v Coinbase News

Circle Considers 2024 IPO

On Wednesday, news hit the wires of Circle Internet Financial Ltd. (Circle) considering a 2024 IPO. According to Bloomberg, Circle is in talks with advisers in preparation for a possible IPO. Circle had a valuation of $9 billion in its last attempt to go public in 2022.

Circle is the issuer of USD Coin (USDC), the second largest stablecoin by market capitalization, behind USDT.

Trading Derivatives carries a high level of risk to your capital and you should only trade with money you can afford to lose. Trading Derivatives may not be suitable for all investors, so please ensure that you fully understand the risks involved, and seek independent advice if necessary. A Product Disclosure Statement (PDS) can be obtained either from this website or on request from our offices and should be considered before entering into a transaction with us. Raw Spread accounts offer spreads from 0.0 pips with a commission charge of USD $3.50 per 100k traded. Standard account offer spreads from 1 pips with no additional commission charges. Spreads on CFD indices start at 0.4 points. The information on this site is not directed at residents in any country or jurisdiction where such distribution or use would be contrary to local law or regulation.

Significantly, Circle could issue an IPO ahead of Ripple despite the recent rumors of a Ripple IPO circulating. Ripple is currently in a legal battle with the SEC and would need SEC approval for an IPO. The SEC v Ripple case has been ongoing since December 2020.

SEC v Coinbase Case Update

Coinbase (COIN) went public in April 2021. Despite going public, the SEC took legal action against Coinbase in June 2023. The SEC filed charges against Coinbase for allegedly operating as an unregistered securities exchange, broker, and clearing agency. Additional charges included the unregistered offering and selling of securities in connection with its staking-as-a-service program.

Significantly, Coinbase filed a motion to dismiss (MTD) the charges in August 2023. After the SEC opposition filing to the MTD and the Coinbase reply brief, the two parties must submit a proposed schedule for the January 17 court date for Oral arguments. The court deadline for submissions is November 17.

Anticipation of BTC Spot ETFs

On Tuesday, Bloomberg Intelligence ETF Analyst Eric Balchunas shared the latest the on BTC-spot ETF market, saying,

“SCOOP: Ex-Cantor Execs Launching Crypto Lending Platform for Expected Spot Bitcoin ETFs (which should help Aps).”

According to the Bloomberg report, Cantor Fitzgerald execs launched Digital Prime Technologies Tokenet, a crypto lending platform established to serve operators of BTC-spot ETFs. Tokenet offers the secure and efficient lending of digital assets.

While the markets expect the SEC to approve one, some, or all of the spot ETF applications, the lack of an SEC approval has left BTC in a sideways trend.

Technical Analysis

Bitcoin Analysis

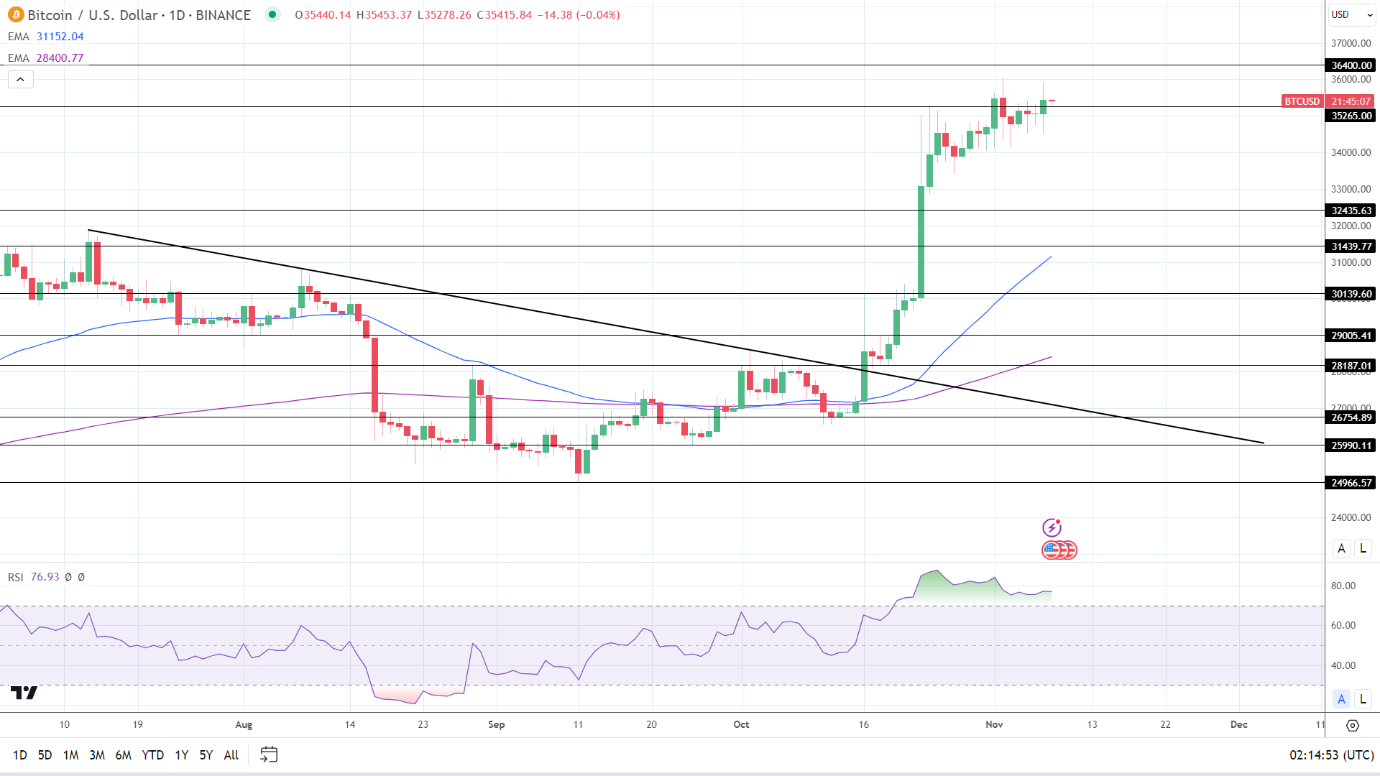
BTC remained above the 50-day and 200-day EMAs.

A BTC move through the November 2 high of $36,024 would support a break above the $36,400 resistance level.

BTC-spot ETF-related news will remain the focal point on Wednesday. News updates from the SEC will need consideration.

A BTC fall through the $35,265 support level would give the bears a run at the $34,000 handle.

The 14-Daily RSI reading of 76.93 shows BTC remaining in overbought territory. Selling pressure could intensify at current levels without favorable BTC-spot ETF-related news.

BTC Daily Chart EMAs send bullish price signals.
BTCUSD 081123 Daily Chart

Ethereum Analysis

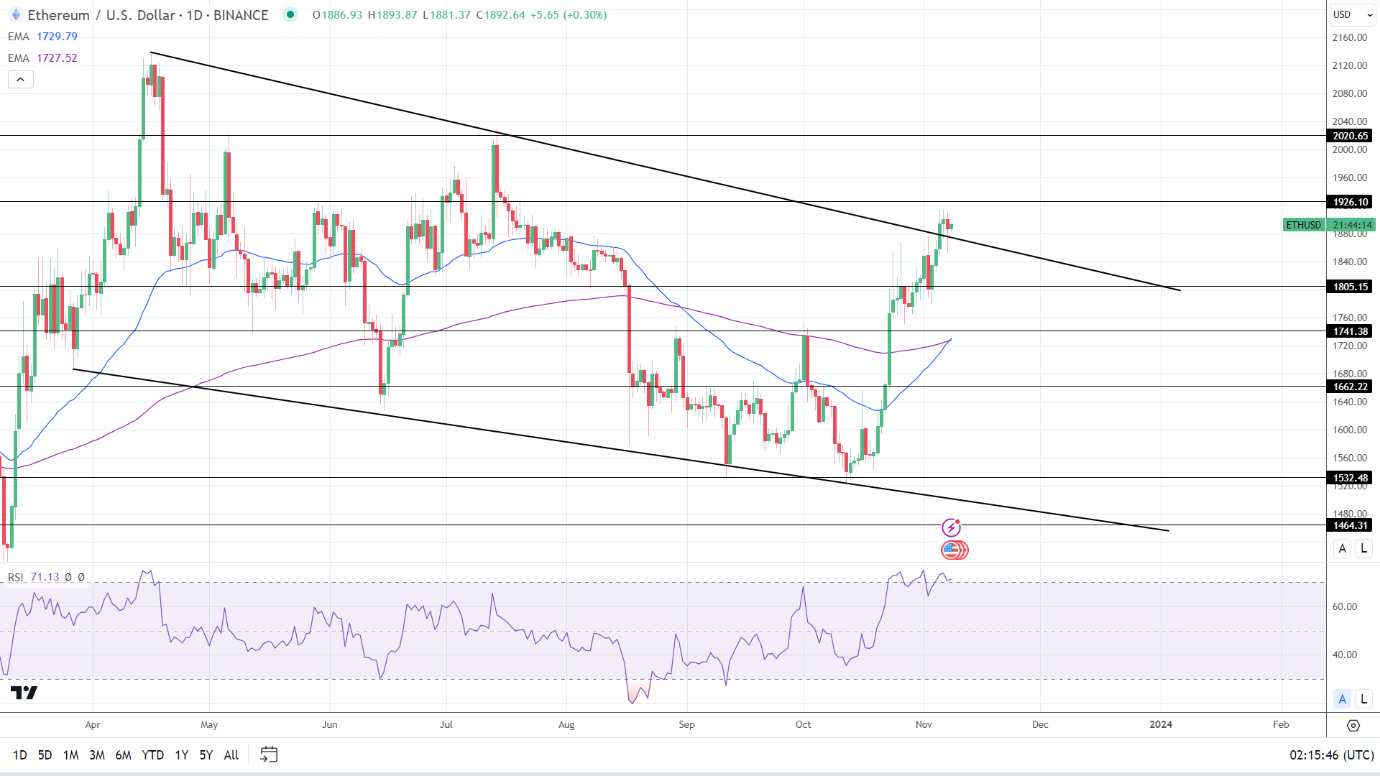
ETH remained above the 50-day and 200-day EMAs. Significantly, a bullish cross of the 50-day EMA through the 200-day EMA sent bullish price signals despite ETH being in oversold territory.

An ETH move through $1,900 would bring the $1,926 resistance level and $2,000 into play.

However, a break below the trend line would give the bears a run at the $1,805 support level.

The 14-period Daily RSI of 71.73 shows ETH in overbought territory. Without a favorable crypto event, selling pressure may intensify at the $1,926 resistance level.

ETH Daily Chart EMAs send bullish price signals.
ETHUSD 081123 Daily Chart
Ripple (XRP) Price Targets $1 as $120 Million Flows into Derivatives Markets

Ripple (XRP) Price Targets $1 as $120 Million Flows into Derivatives Markets

Ripple (XRP) Price Forecast:

  • Ripple (XRP) is trading close to the $0.70 area after making a blistering start to November 2023.
  • Derivatives market data shows that capital inflows in XRP Futures contracts grew by a staggering $120 Million within the last two weeks.
  • After a brief consolidation phase on Tuesday, November 7, on-chain indicators show that the XRP price will likely break down the $0.70 resistance.

Ripple (XRP) price is currently trading around the $0.70 area as the crypto market rallied and entered its second consecutive month. After a consolidation phase, on-chain and technical analytics are flashing signals of another possible leg up.

Advertisement

Crypto Investors Have Moved $100M into XRP Futures Contracts this Month

XRP price made a blistering start to November 2023, rallying 13% over the past week. While XRP whales and institutional investors have grabbed the media attention, derivatives market data shows that Futures Traders are also playing a pivotal role in the XRP price rally.

Trading Derivatives carries a high level of risk to your capital and you should only trade with money you can afford to lose. Trading Derivatives may not be suitable for all investors, so please ensure that you fully understand the risks involved, and seek independent advice if necessary. A Product Disclosure Statement (PDS) can be obtained either from this website or on request from our offices and should be considered before entering into a transaction with us. Raw Spread accounts offer spreads from 0.0 pips with a commission charge of USD $3.50 per 100k traded. Standard account offer spreads from 1 pips with no additional commission charges. Spreads on CFD indices start at 0.4 points. The information on this site is not directed at residents in any country or jurisdiction where such distribution or use would be contrary to local law or regulation.

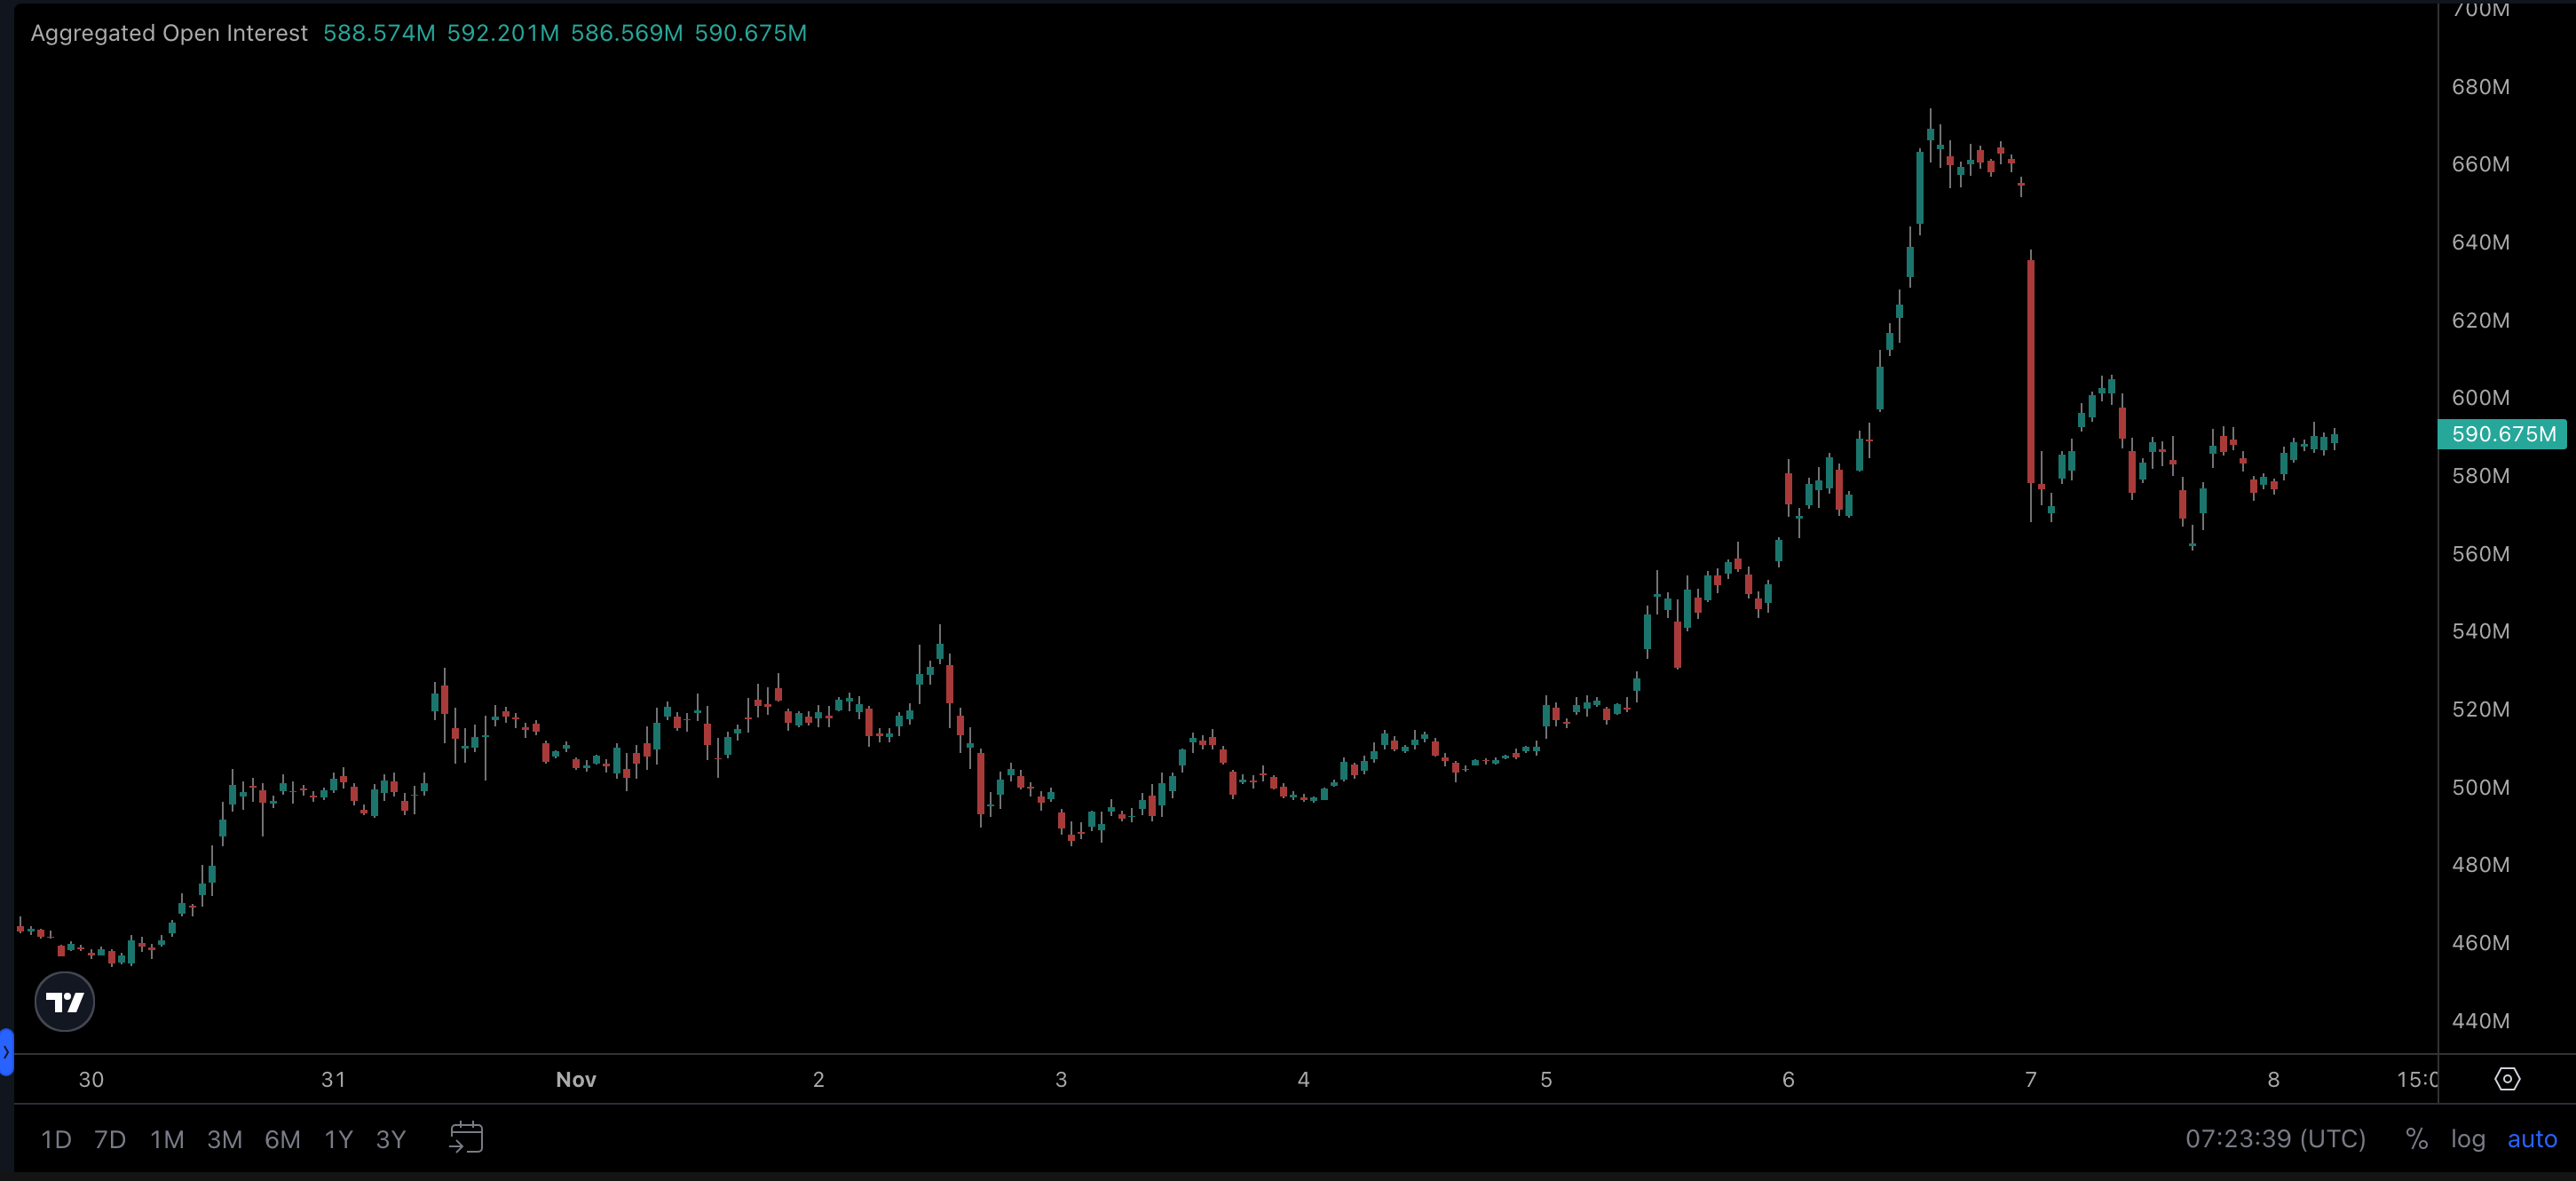
XRP has attracted additional investments worth $120 million within the last two weeks, according to crypto derivatives market data tracker Coinglass. As depicted in the chart below XRP Open Interest was around $470 million at the close of October 30. However, as of November 8, that figure has sykrocketed to $592 million.

Ripple (XRP) Aggregated Open Interest vs. Price
Ripple (XRP) Aggregated Open Interest vs. Price |Source: CoinglassIn the context of futures and options contracts, Open Interest is the total number of outstanding or open positions for a particular asset. It represents the total number of contracts, either long (buy) or short (sell), that exist for a particular crypto asset, financial instrument or derivative at a given point in time.

Typically, when investor bring in fresh capital inflows during a market rally, it suggests that they are increasing confident that the current price trend will continue. Hence, the $100 million increase in XRP Open Interest is a key indicator of growing investor interest and confidence in the market.

If this thesis holds, XRP holders and spot market traders can anticipate more upside in the days ahead.

XRP Price Forecast: Road to $1?

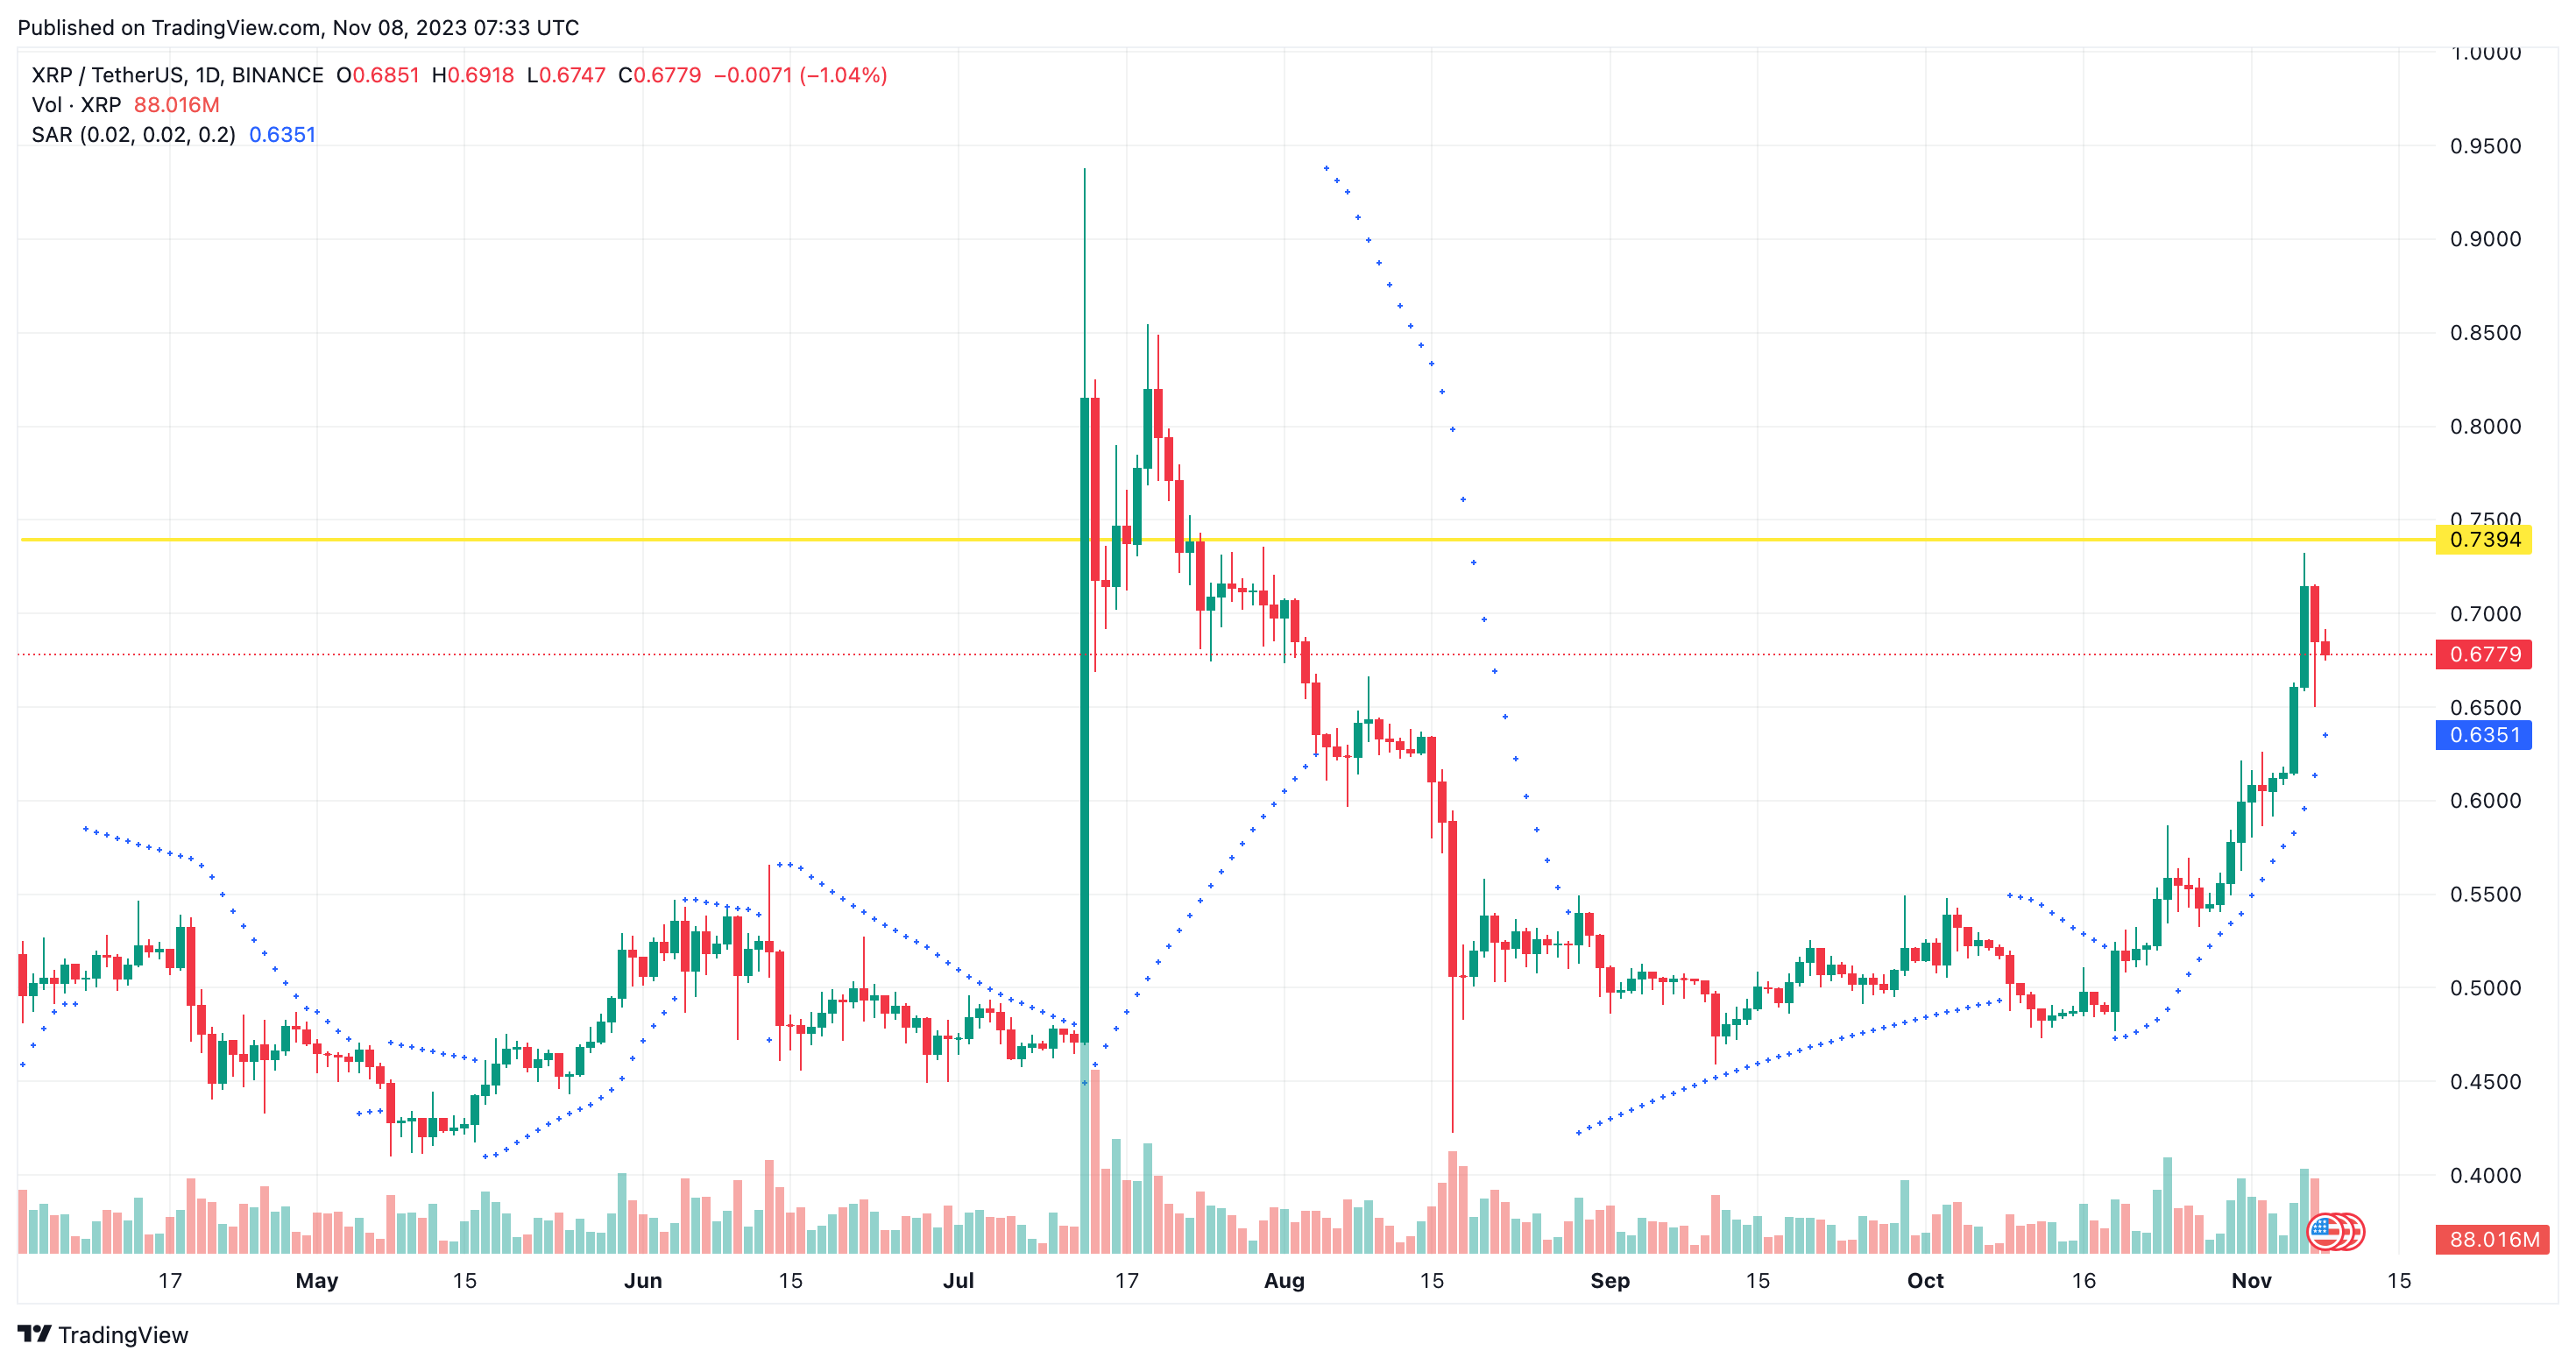
XRP is currently trading at $0.68. Multiple attempts at the $0.70 ,000 in the last 24 hours days appear to have weakened the resistance marginally. Hence XRP looks in prime position to push further toward $1.

In the daily time frame technical analysis, XRP’s current Parabolic Stop and Reverse indicator also confirms this narrative.  As seen below, a decisive breakout above the initial resistance at $0.74 could catapult the XRP price rally further toward $1.

XRP Price Forecast, November 8, 2023
XRP Price Forecast, November 8, 2023 | Source: TradingView The Parabolic SAR (Stop and Reverse) identifies the $0.63 area as potential reversal point in the ongoing market trend. If the bears attempt to force a downswing, the bulls could mount a support buy wall at that range.  This alignment suggests a growing bullish trend.

Hang Seng Index, ASX 200, Nikkei 225: Overnight FOMC Member Speeches to Set the Tone

Hang Seng Index, ASX 200, Nikkei 225: Overnight FOMC Member Speeches to Set the Tone

Overview of the Tuesday Session

On Tuesday, the Nikkei 225 and the Hang Seng Index underperformed the ASX 200 as the Asian equity markets reversed course.

Fed Fear Resurfaced Overnight

Fed fear resurfaced overnight on Monday, leaving the US equity markets with modest gains. After sweeping bets on the Fed ending its rate hike cycle and cutting rates in June 2024, caution resurfaced before a swathe of central bank speeches. A recent pullback in 10-year US Treasury yields from 5% may have spooked investors.

Trading Derivatives carries a high level of risk to your capital and you should only trade with money you can afford to lose. Trading Derivatives may not be suitable for all investors, so please ensure that you fully understand the risks involved, and seek independent advice if necessary. A Product Disclosure Statement (PDS) can be obtained either from this website or on request from our offices and should be considered before entering into a transaction with us. Raw Spread accounts offer spreads from 0.0 pips with a commission charge of USD $3.50 per 100k traded. Standard account offer spreads from 1 pips with no additional commission charges. Spreads on CFD indices start at 0.4 points. The information on this site is not directed at residents in any country or jurisdiction where such distribution or use would be contrary to local law or regulation.


On Monday, the US equity markets ended the day with modest gains. The Nasdaq Composite Index rose by 0.30%, while the S&P 500 and the Dow gained 0.18% and 0.10%, respectively.

The modest overnight gains left the Asian economic calendar to influence market risk appetite on Tuesday.

RBA Raises Cash Rate, Aussie Dollar Sinks

On Tuesday, the RBA raised the cash rate by 25 basis points to 4.35%. However, a lack of commitment to lift rates higher in December and early 2024 sank the Aussie dollar. The ASX 200 recovered from heavy losses to end the session with a modest loss.

Nonetheless, Fed policy uncertainty and China exports weighed on the Hang Seng Index and the Nikkei despite a surge in Chinese imports. A larger-than-expected fall in exports sent mixed signals on demand and productivity.

FOMC Member Speeches to Set the Tone

Fed speakers from the US session on Tuesday will likely set the tone for the Wednesday session. After the Monday retreat, sentiment toward the Fed interest rate path remains the focal point for the Asian markets.

10-year US Treasury yields retreated on Tuesday, supporting the bets on the Fed ending its rate cycle and the US equity markets. The US equity market gains came despite Fed speakers leaving rate hikes on the table on Tuesday. FOMC members Neel Kashkari, Austan Goldsbee, Michelle Bowman, and Christopher Waller delivered hawkish speeches.

The Dow and S&P 500 rose by 017% and 0.28%, with the Nasdaq Composite Index gaining by 0.90%.

On Wednesday, the Asian economic calendar is on the light side. However, the Reuters Tankan Index figures for November could influence Nikkei-listed stocks. The Index unexpectedly rose from 3 to 6. Economists forecast the Reuters Tankan Index to fall from 4 to 3 in November.

In the futures markets on Wednesday, the ASX 200 was down 1 point while the Nikkei was up 200 points.

ASX 200

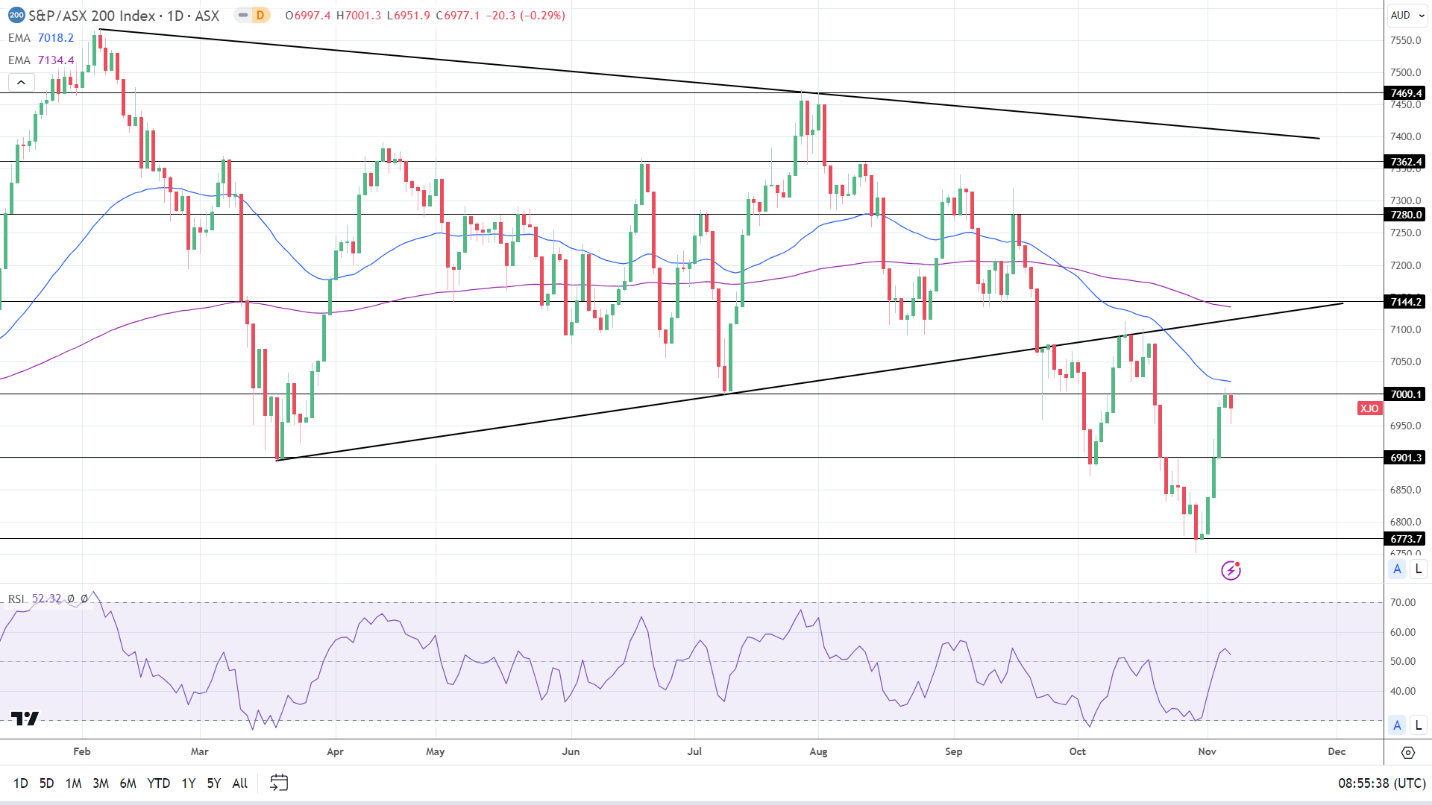
ASX 200 saw red on Tuesday.

ASX200 081123 Daily ChartThe ASX 200 declined by 0.29% on Tuesday, with the big four banks dragging the Index into negative territory.

Westpac Banking Corp. (WBC) tumbled by 2.69%, with the National Australia Bank Ltd. (NAB) and ANZ Group Holdings Ltd. (ANZ) seeing losses of 1.02% and 1.05%. The Commonwealth Bank of Australia (CBA) ended the session down 0.41%.

ANZ and NAB will also release earnings this week.

Mining stocks limited the losses, while oil stocks continued to fall. BHP Group Ltd. (BHP) and Rio Tinto Ltd. (RIO) gained 0.26% and 0.26%, respectively. Fortescue Metals Group Ltd. (FMG) rose by 0.60%.

Woodside Energy Group Ltd. (WDS) and Santos Ltd. (STO) ended the session down 0.62% and 0.81%, respectively.

Gold stocks had a positive Tuesday session. Evolution Mining Ltd. (EVN) and Northern Star Resources Ltd. (NST) gained 0.54 and 0.50%, respectively. However, Gold Spot was in negative territory during the Asian session.

Hang Seng Index

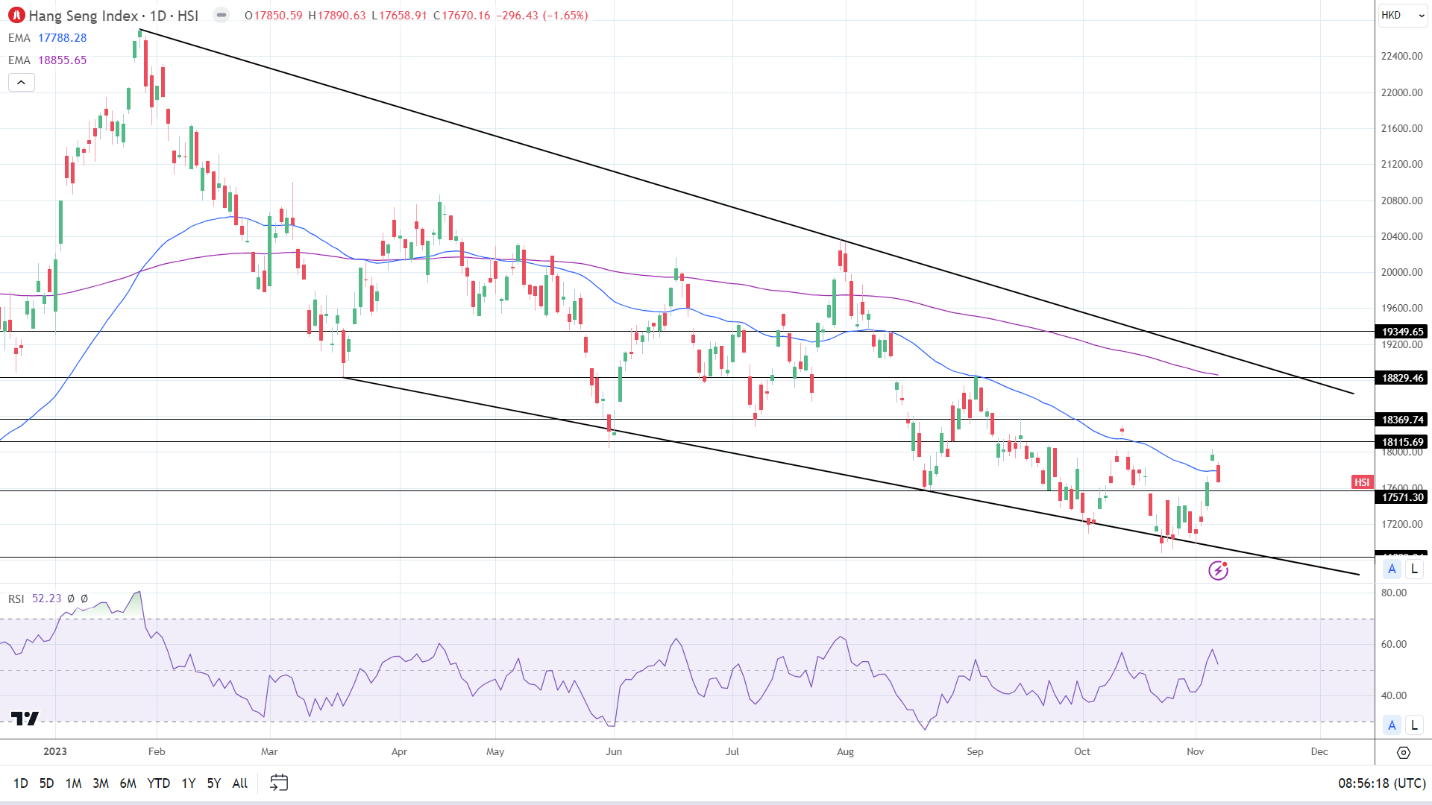
The Hang Seng Index stumbled on Tuesday.

HSI 081123 Daily ChartThe Hang Seng Index slid by 1.65% on Tuesday. A larger-than-expected fall in China exports weighed on investor sentiment.

Alibaba (9988) and Tencent (0700) ended the Tuesday session down 2.00% and 1.28%, respectively.

Bank stocks had a mixed session on Tuesday. HSBC (0005) rose by 0.17%. However, China Construction Bank (0939) and the Industrial and Commercial Bank (1398) ended the day down 2.19% and 1.58%.

The Nikkei 225

Fed fear and China exports weighed on the Nikkei.

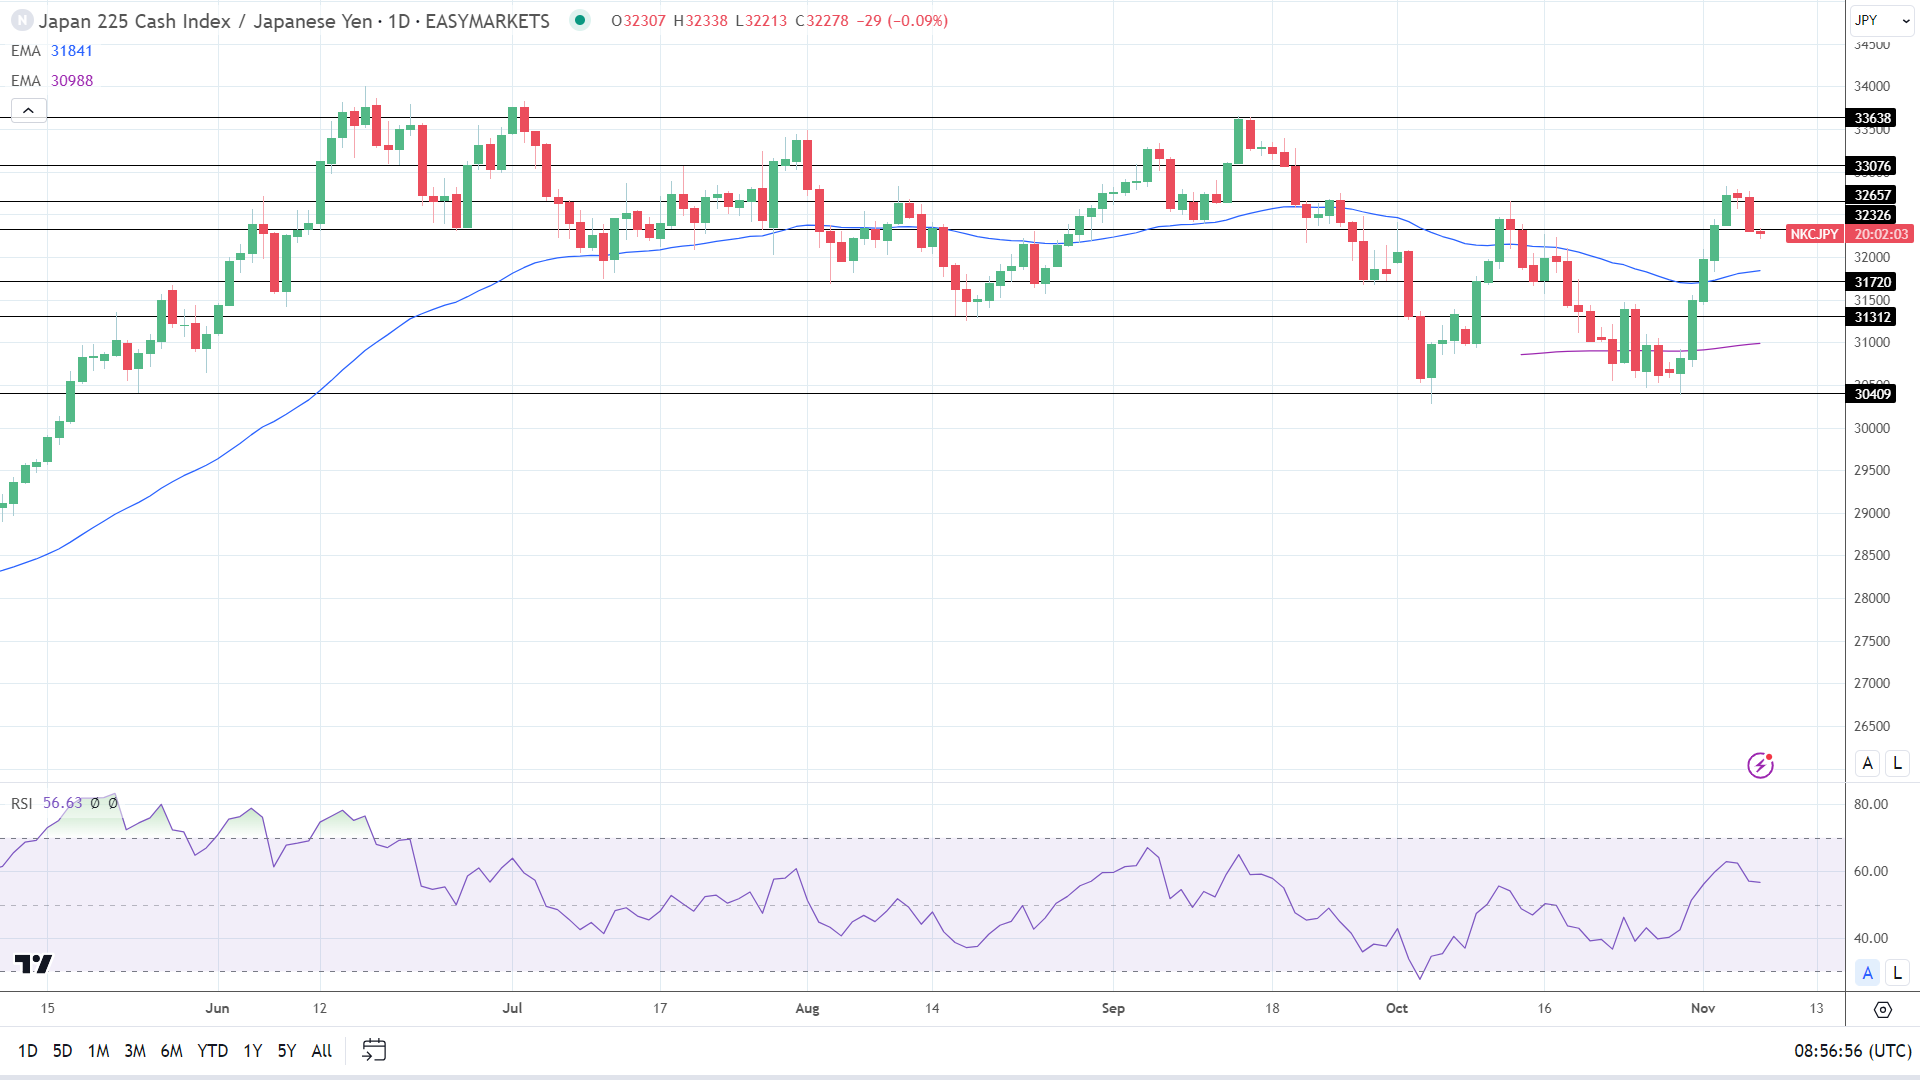
Nikkei 081123 Daily Chart(Graph for reference purposes only)

The Nikkei 225 declined by 1.34% on Tuesday.

Sumitomo Mitsui Financial Group (8316) and Mitsubishi UFJ Financial Group (8306) fell by 0.71% and 0.75%. However, it was a mixed day for the main components of the Nikkei 225.

KIDDI Corp. (9433) slid by 1.93%. Tokyo Electron (8035) and Fast Retailing (9983) ended the session down 1.37% and 0.92%, respectively.

Sony Corp (6758) and Softbank (9984) bucked the trend, gaining 0.53% and 0.28%. Softbank releases earnings results on Wednesday.

XRP News: Uncertainty Prevails as SEC Gears Up for Potential Appeal

XRP News: Uncertainty Prevails as SEC Gears Up for Potential Appeal

The Tuesday Overview

On Tuesday, XRP slid by 4.10%. After an 8.14% surge on Monday, XRP ended the day at $0.6856.

Caution Hits XRP Ahead of November 9 Deadline

There were no SEC v Ripple case-related updates for investors to consider on Tuesday. On October 24, the court ordered both parties to jointly agree to a briefing schedule by November 9. The order raised investor hopes of the SEC and Ripple agreeing to remedies relating to the sale of XRP to institutional investors.

Trading Derivatives carries a high level of risk to your capital and you should only trade with money you can afford to lose. Trading Derivatives may not be suitable for all investors, so please ensure that you fully understand the risks involved, and seek independent advice if necessary. A Product Disclosure Statement (PDS) can be obtained either from this website or on request from our offices and should be considered before entering into a transaction with us. Raw Spread accounts offer spreads from 0.0 pips with a commission charge of USD $3.50 per 100k traded. Standard account offer spreads from 1 pips with no additional commission charges. Spreads on CFD indices start at 0.4 points. The information on this site is not directed at residents in any country or jurisdiction where such distribution or use would be contrary to local law or regulation.

However, the lack of progress toward a briefing schedule increases the chance of a contested one. The court would arrange a contested briefing schedule if the two parties cannot settle. Significantly, a contested briefing schedule also raises the possibility of an unfavorable settlement for Ripple.

Investor caution was evident on Tuesday, with XRP falling to a session low of $0.6518 before steadying.

The size of the disgorgement could be a stumbling block if the two sides engaged in remedial talks.

In recent sessions, attorneys Jeremy Hogan and John E. Deaton outlined reasons for Ripple to settle under favorable terms. In contrast, the SEC is eyeing a $770 million disgorgement, which Ripple may not agree to.

On November 5, amicus curiae attorney Deaton raised his doubts about the two parties agreeing to a briefing schedule, saying,

“There are NO current or ongoing settlement talks between Ripple and the SEC.”

However, Deaton pointed out that he had “Zero insider information.”

Uncertainty toward the outcome of the SEC v Ripple case will remain a headwind. There may also be the fear that Ripple may be unable to convince the SEC to accept the Programmatic Sales ruling as part of the settlement.

Contested Briefing Schedule Paves the Way to an SEC Appeal

Failure to settle before the November 9 deadline means the court will arrange a contested briefing schedule. While the size of the penalty will be the focal point, the matter of the Programmatic Sales ruling may also feature. Ripple could agree to a higher penalty if the SEC agrees not to appeal the Programmatic Sales ruling. However, the Programmatic Sales ruling may have more significance for the SEC.

The consensus is that the SEC is fast-tracking the case to appeal the Programmatic Sales ruling. By law, the SEC must wait until the end of the case to contest any court rulings. On October 3, the court rejected the SEC motion to file an interlocutory appeal.

Notably, an interlocutory appeal would stop progress in the SEC v Ripple case until the end of the appeal process. Since the court ruling, the SEC has taken steps to expedite the SEC v Ripple case, suggesting intentions to appeal the Programmatic Sales ruling.

Uncertainty toward the outcome of an appeal would become a headwind for XRP and the broader crypto market.

XRP Price Action

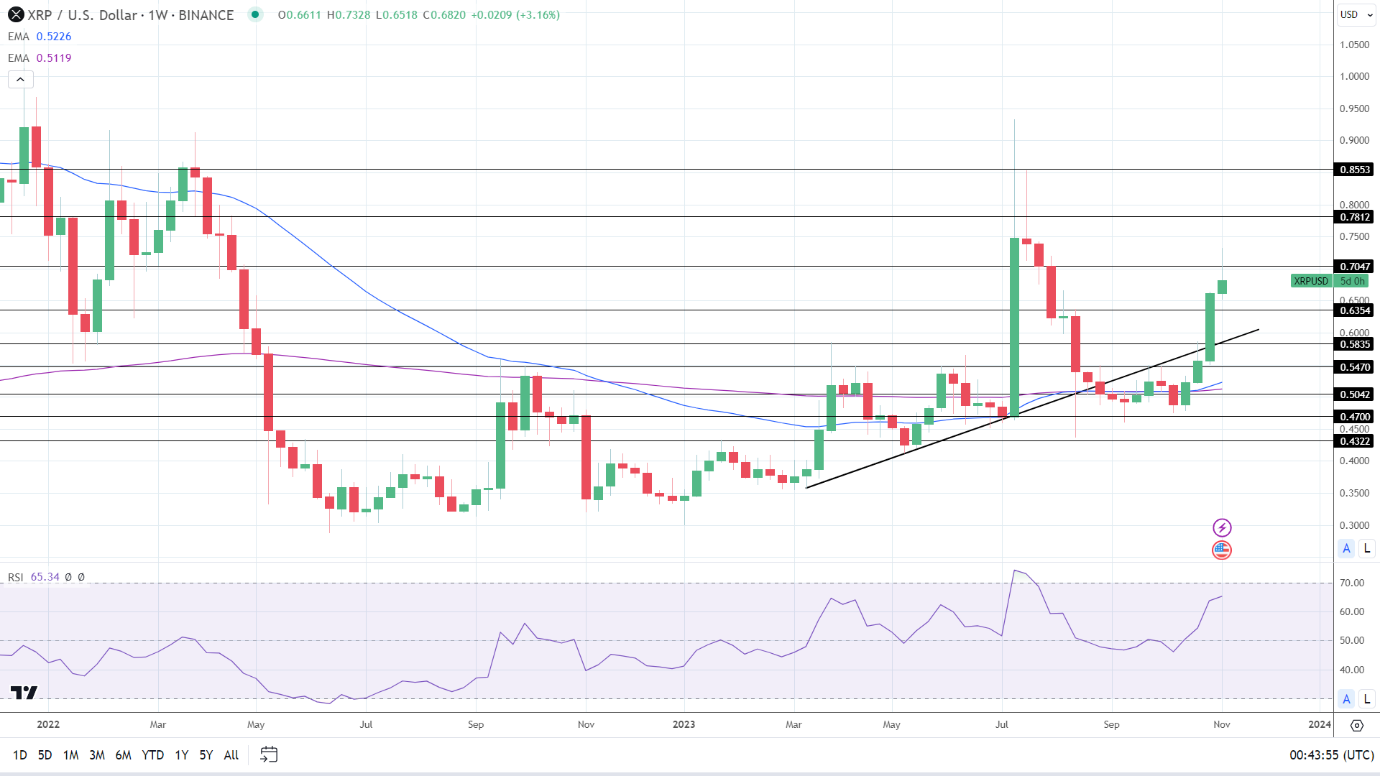
Weekly Chart sends bullish price signals.
XRPUSD 081123 Weekly Chart

Daily Chart

XRP remained above the 50-day and 200-day EMAs.

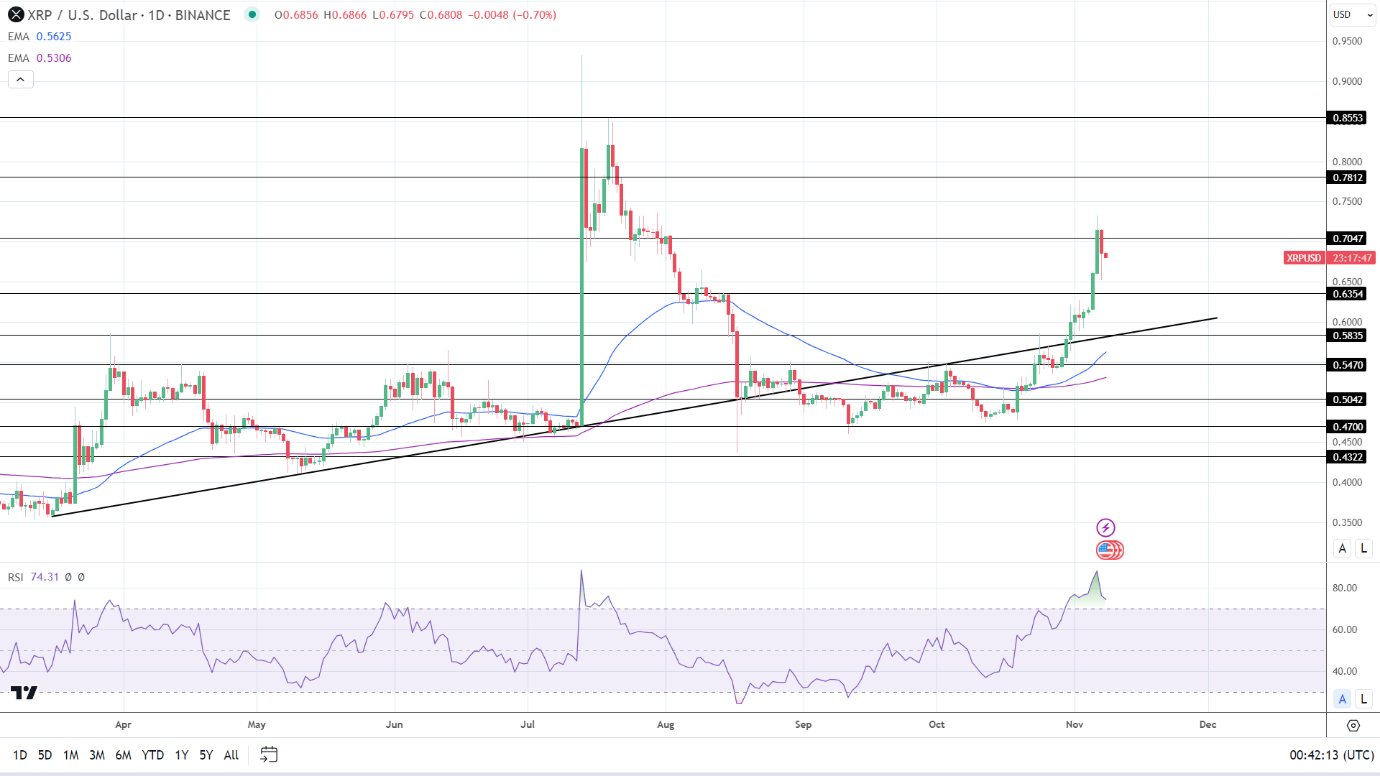
An XRP break above the $0.7047 resistance level would support a move to the Monday high of $0.7328.

SEC and Ripple updates on progress toward a settlement will be the focal points on Wednesday.

If the SEC and Ripple fail to agree to a briefing schedule, XRP could fall to $0.65 and bring the $0.6354 support level into play.

The 14-day RSI reading of 74.31 shows XRP remaining in overbought territory. A lack of progress toward a settlement could intensify selling pressure at the $0.7047 resistance level.

XRP Daily Chart EMAs send bullish price signals.
XRPUSD 081123 Daily Chart

4-Hourly Chart

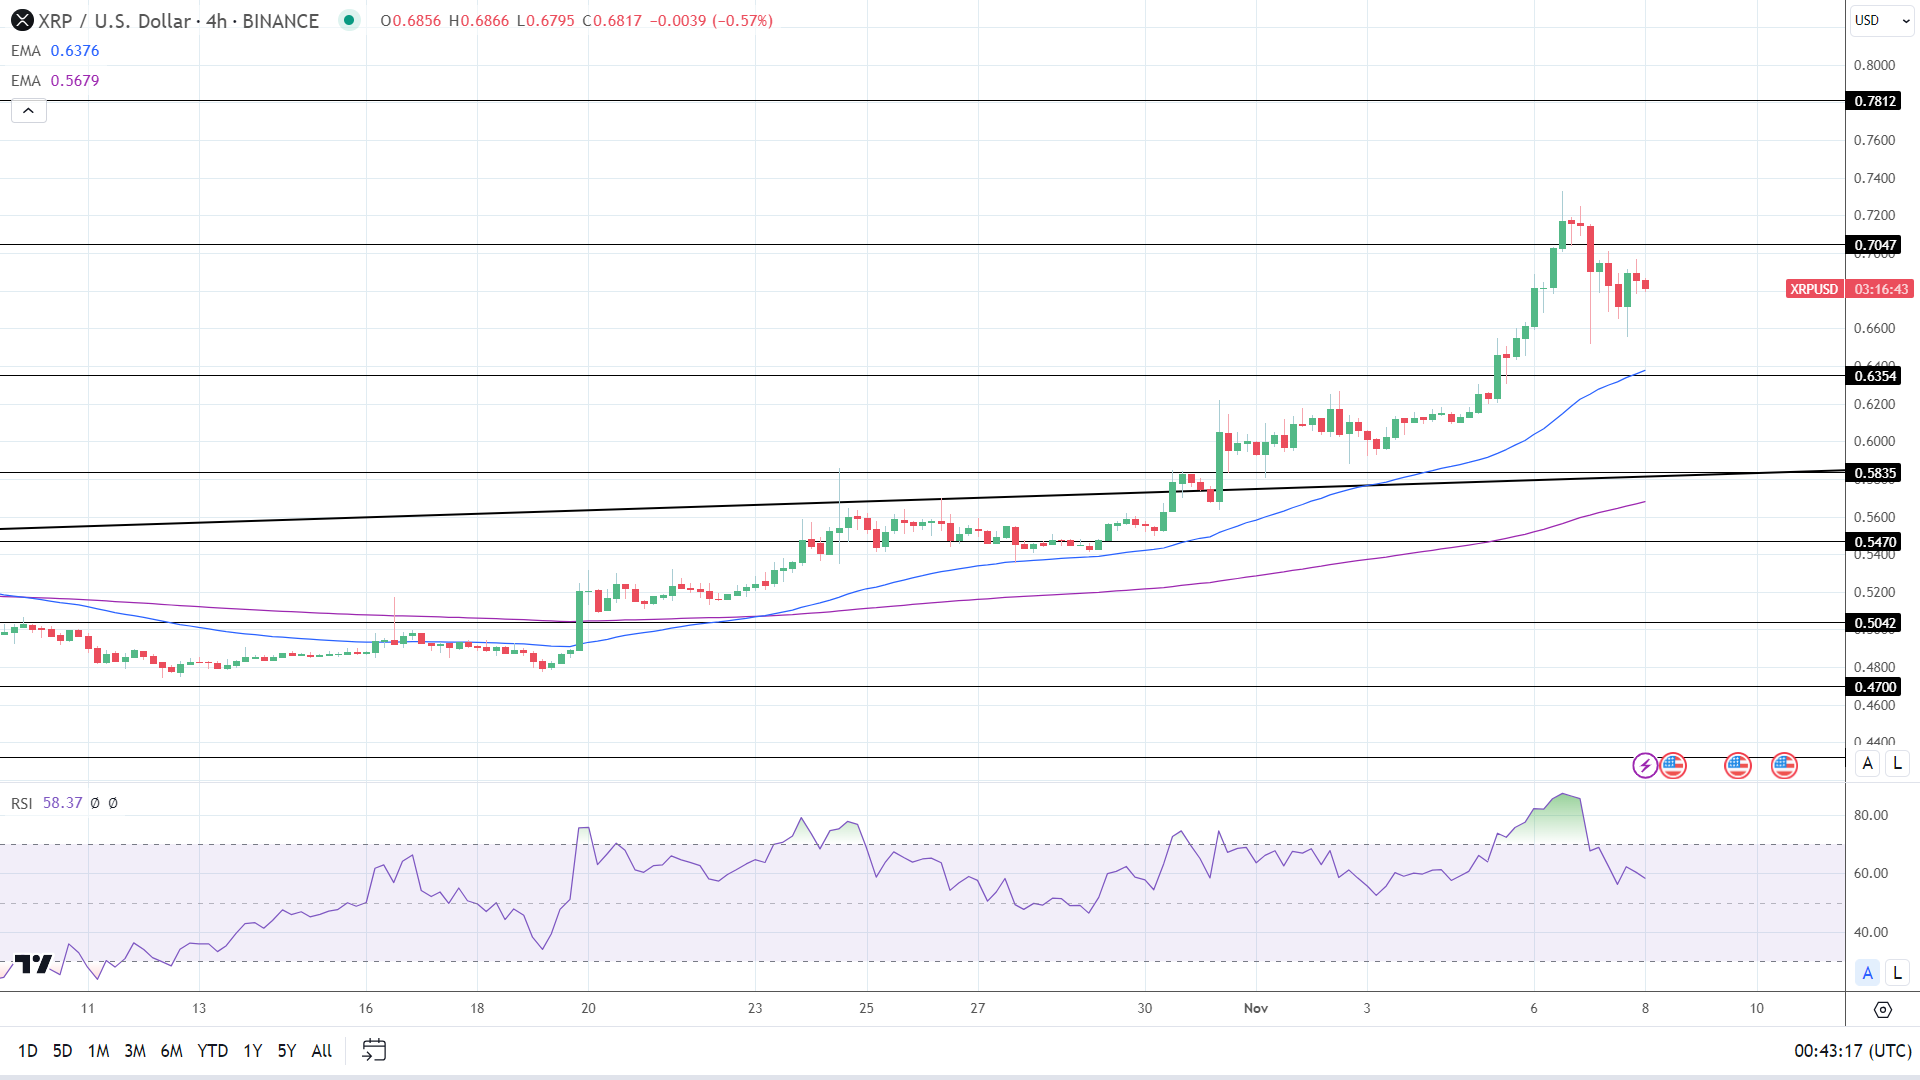
In the 4-hourly Chart, XRP remains above the 50-day and 200-day EMAs, sending bullish price signals.

An XRP break above the $0.7034 resistance level would bring the Monday high of $0.7328 into play.

However, a return to $0.65 would support a move to the 50-day EMA and the $0.6354 support level.

The 4-hourly RSI, with a reading of 58.37, suggests an XRP break above the $0.7047 resistance level before entering overbought territory.

XRP 4-Hourly Chart sends bullish price signals.
XRPUSD
EUR/USD Price Forecast: German Inflation Aggravates Euro Drawback

EUR/USD Price Forecast: German Inflation Aggravates Euro Drawback

EURO FUNDAMENTAL BACKDROP

The euro has paired back its recent gains post-NFP with certain US central bank speakers ‘out-hawking’ their European Central Bank (ECB) counterparts. The Fed’s Logan and Bowman in particular highlighted the resilience of the US economy and the possible need for additional interest rate hikes. In summary, Fed officials will likely adopt a ‘wait and see’ approach as more data is needed after the recent NFP miss.

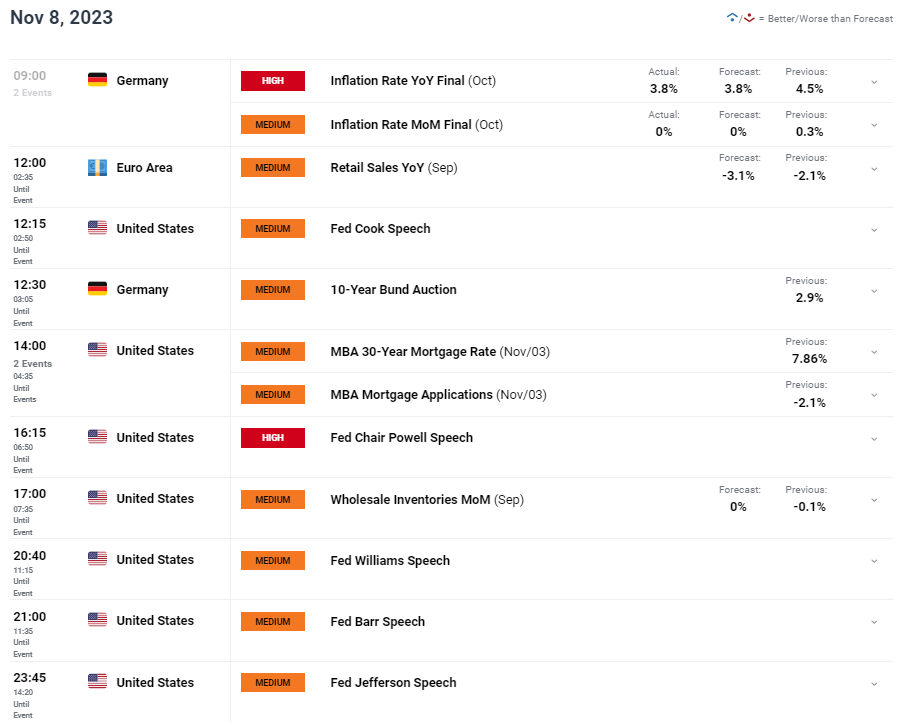
Today’s early session moves were stoked by a sharp decline in German inflation (see economic calendar below) on both MoM and YoY metrics. Being the largest economy within the euro area, this statistic serves as a gauge for the wider inflationary backdrop. With ECB speakers scheduled to speak later today, this could bring in some dovish undertones to their messaging and weigh negatively on the euro. Euro area retail sales are anticipated lower and could add to euro woes.

Later today, the focus will shift to the Federal Reserve once more with Fed Chair Jerome Powell under the spotlight. The speech will be dissected for any clues or potential changes to the prior narrative. Other Fed speakers will follow Mr. Powell but markets will likely keep their reactions aimed at the Fed Chair.

Implied Fed funds futures have been ‘dovishly’ re-priced to levels pre-NFP showing the fickle nature of financial market expectations. With the ECB expected to cut by +/-30bps more by year end 2024, the US dollar could remain supported ceteris paribus. The ongoing war in the Middle East may supplement the safe haven attribute of the USD against the EUR.

ECONOMIC CALENDAR (GMT+02:00)

image1.png

Want to stay updated with the most relevant trading information? Sign up for our bi-weekly newsletter and keep abreast of the latest market moving events!

TECHNICAL ANALYSIS

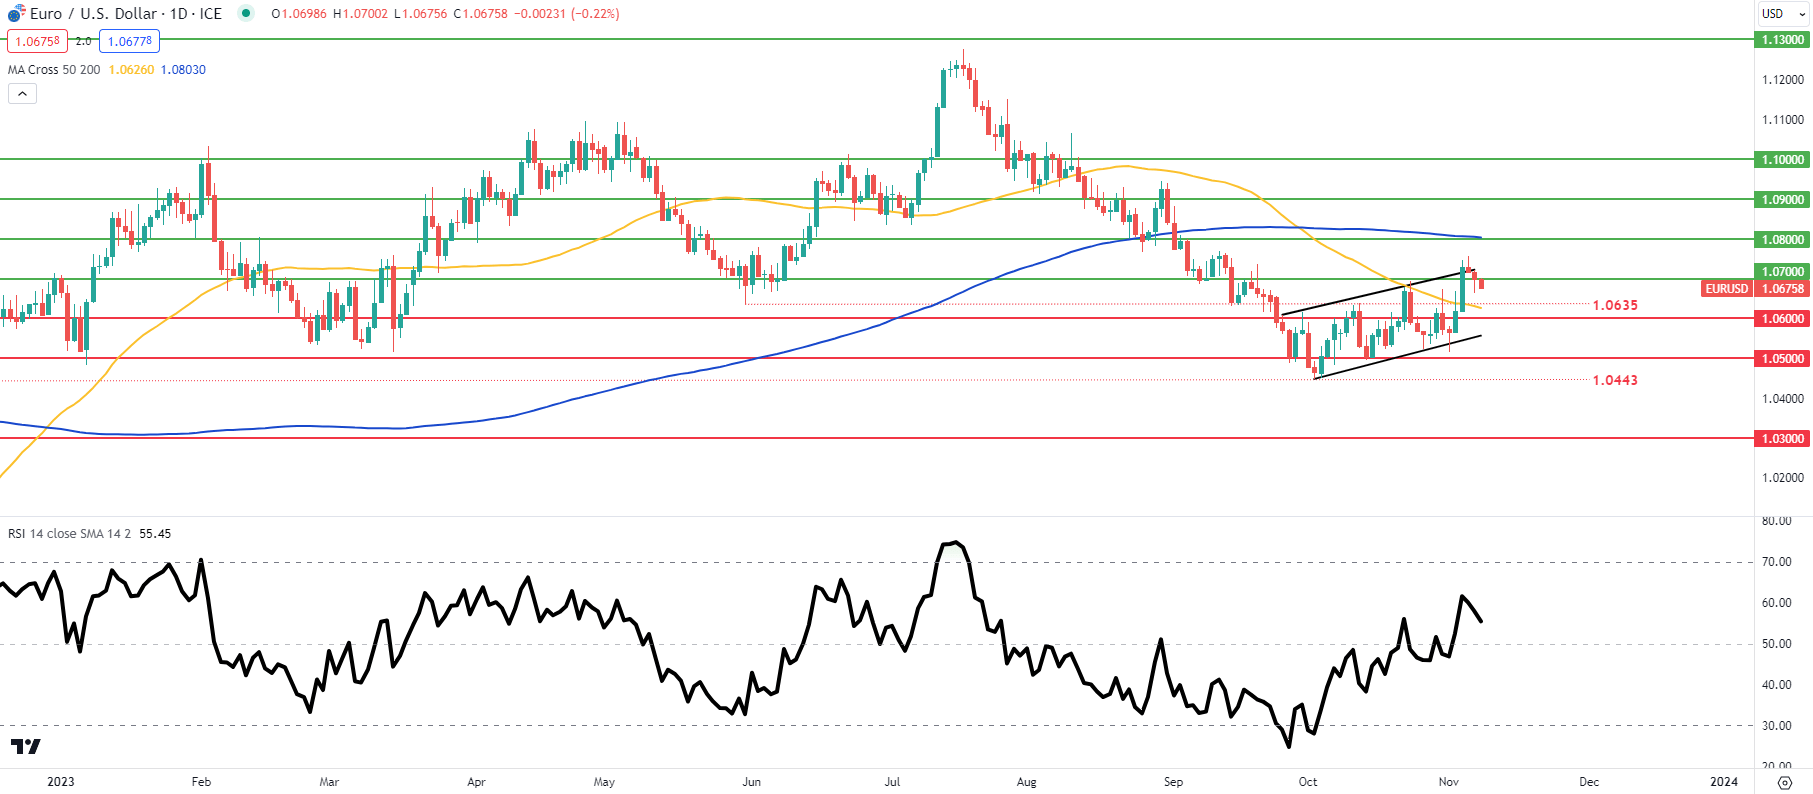
EUR/USD DAILY CHART

image2.png

The daily EUR/USD daily chart above now trades below the 1.0700 psychological handle. The pullback higher within the larger and longer-term downtrend remains within a bear flag formation (black) that could still unfold in its traditional sense.

Resistance levels:

  • 1.0800/200-day MA
  • Flag resistance
  • 1.0700

Support levels:

  • 1.0635
  • 50-day MA
  • 1.0600
  • Flag support
  • 1.0500
Trading Forex at the News Release

Trading Forex at the News Release

Forex News Trading Strategies

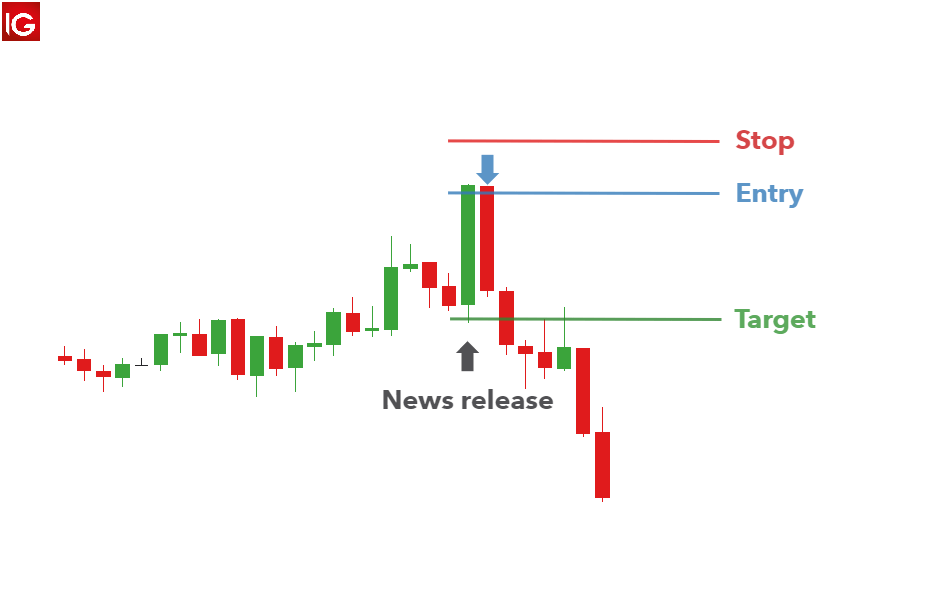
There are two common strategies for trading forex at the news release:

  1. Initial Spike Fade strategy
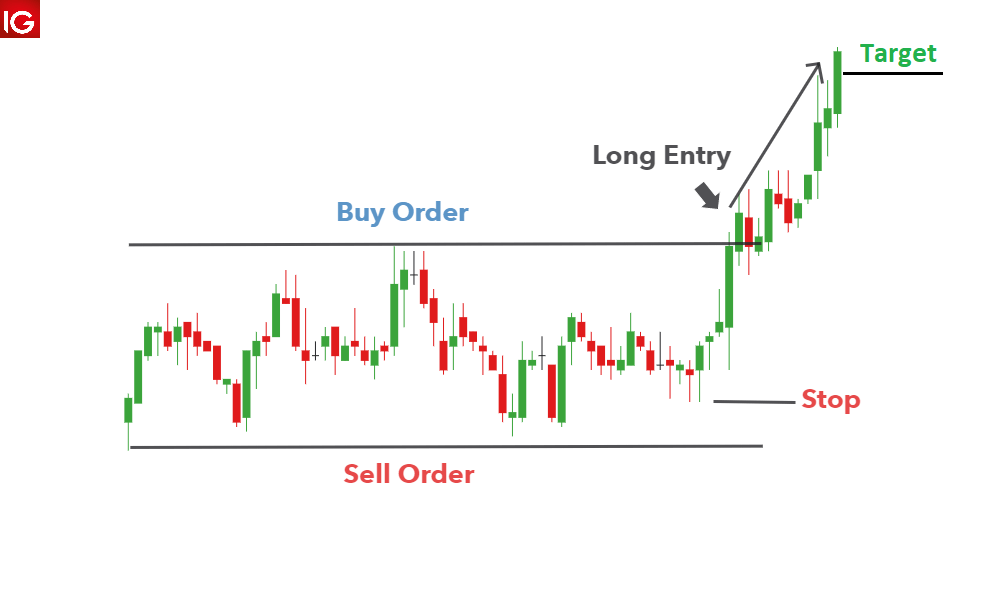
  2. News Straddle strategy

Each one provides a robust plan for traders to follow, depending on the market environment observed at the time of the release, and how best to approach that particular market.

Before reading further it is essential that you have a good grasp on the basics of news trading. If you are new to trading or simply require a refresher, take a look at our introduction on how to trade forex news.

1. Initial Spike Fade Strategy

This strategy looks to capitalize on an overreaction in the market over the short term by fading the initial move. This strategy suits reversal traders, scalpers and day traders due to fast moving and erratic pricing that often follows a major news release.

Overreactions and subsequent reversals are seen fairly regularly in the forex market as large institutions add to the increased volatility of the initial move. The market as a whole, often spikes as an overreaction and subsequently push price back toward pre-release levels.

Once the market calms down and spreads return to normal, the reversal often gains momentum showing early signs of a potential new trend.

The shortfall associated with this strategy is that the initial spike may turn out to be the start of a prolonged move in the direction of the initial spike. This underscores the importance of using well-defined stops to limit downside risk and get you out of a bad trade quickly.

How to implement initial spike fade strategy:

  1. Select the relevant currency pair: Ensure the major news event corresponds to the desired currency pair to trade, i.e. Non-Farm Payrolls will affect USD crosses.
  2. Switch to a five-minute chart: After selecting the desired market, switch to a 5-minute chart just before the news release.
  3. Observe the close of the first five-minute candle: The first five-minute candle is usually quite large. When price approaches either the spike high or the spike low, fade the move by trading in the opposite direction.
  4. Stops and limits: Stops can be placed 15 pips above the high for a short trade or 15 pips below the low for a long trade. Targets can be set at two or three times the distance of the stop.

initial spike fade strategy in forex news trading

2. News Straddle Strategy

The news straddle strategy is perfect for traders expecting a huge surge in volatility but are unsure of the direction. This strategy lends its name from a typical straddle strategy in the world of options trading as it uses the same core strategy – to capitalize on an increase in volatility when direction is uncertain.

The disadvantage of the news straddle approach surfaces when price breaks support or resistance only to reverse soon thereafter. Similarly, price can trigger the entry order and move toward your target only to reverse until a stop it hit.

This strategy can be implemented using the following steps:

  1. Establish a range with support and resistance.
  2. Set two orders to open: Set a working order/ entry order to open a long trade if price breaks above resistance and one to go short if price trades below support.
  3. Remove remaining order after confirming direction: The market has the potential to breakout of the range and once this happens, the one entry order will be triggered, and a trade will be opened. Immediately remove the entry order that was not triggered.
  4. Stops and limits: A tight stop can be placed at the recent range low when going long and recent high when going short. Limits can be placed in line with a positive risk to reward ratio.

Straddle news trading strategy

Trading the News During the Release: Conclusion

Trading forex news at the news release has the potential to overwhelm traders with increased volatility in a short period of time. However, through the adoption of a solid strategy, traders can approach these volatile periods with greater confidence and mitigate risk of a runaway market through the use of guaranteed stops (where available).

Take a look at what our in-house analysts have forecasted as the top trading opportunities for the year.

Trading Forex News Releases FAQs

How can I tell which direction the market will trade after at the release?

Forecasting the economic news release is one thing, predicting how traders will react to the news release is quite difficult. When estimations are unsurprising or more or less similar to the previous recorded number, the market tends to digest this information and it is reflected in the lead up to the release. However, there is no guarantee that the market direction/trend will be maintained even if the news comes out exactly as was estimated. This is because different market participants can draw different conclusions that will influence their trades.

Someone may consider data that prints in line with expectations as a bad thing and someone else may view it as a good thing. The bottom line is that traders need to have a strategy in place with predetermined risk parameters.

How Central Banks Impact the Forex Market

How Central Banks Impact the Forex Market

The role of central banks in the forex market

Central banks are mainly responsible for maintaining inflation in the interest of sustainable economic growth while contributing to the overall stability of the financial system. When central banks deem it necessary they will intervene in financial markets in line with the defined “Monetary Policy Framework”. The implementation of such policy is highly monitored and anticipated by forex traders seeking to take advantage of resulting currency movements.

This article focuses on the roles of the major central banks and how their policies affect the global forex market.

What is a central bank?

Central Banks are independent institutions utilized by nations around the world to assist in managing their commercial banking industry, set central bank interest rates and promote financial stability throughout the country.

Central banks intervene in the financial market by making use of the following:

  • Open market operations: Open market operations (OMO) describes the process whereby governments buy and sell government securities (bonds) in the open market, with the aim of expanding or contracting the amount of money in the banking system.
  • The central bank rate: The central bank rate, often referred to as the discount, or federal funds rate, is set by the monetary policy committee with the intention of increasing or decreasing economic activity. This may seem counter-intuitive, but an overheating economy leads to inflation and this is what central banks aim to maintain at a moderate level.

Central banks also act as a lender of last resort. If a government has a modest debt to GDP ratio and fails to raise money through a bond auction, the central bank can lend money to the government to meet its temporary liquidity shortage.

Having a central bank as the lender of last resort increases investor confidence. Investors are more at ease that governments will meet their debt obligations and this helps to lower government borrowing costs.

FX traders can monitor central bank announcements via the central bank calendar

Major central banks

Federal Reserve Bank (United States)

American flag representing the US central bank

The Federal Reserve Bank or “The Fed” presides over the most widely traded currency in the world according to the Triennial Central Bank Survey, 2016. Actions of The Fed have implications not only for the US dollar but for other currencies as well, which is why actions of the bank are observed with great interest. The Fed targets stable prices, maximum sustainable employment and moderate long-term interest rates.

European Central Bank (European Union)

European unio flag representing the European Central Bank

The European central bank (ECB) is like no other in that it serves as the central bank for all member states in the European Union. The ECB prioritizes safeguarding the value of the Euro and maintaining price stability. The Euro is the second most circulated currency in the world and therefore, generates close attention by forex traders.

Bank of England

English flag representing the Bank of England

The Bank of England operates as the UK’s central bank and has two objectives: monetary stability and financial stability. The UK operates using a Twin Peaks model when regulating the financial industry with the one “peak” being the Financial Conduct Authority (FCA) and the other the Prudential Regulating Authority (PRA). The Bank of England prudentially regulates financial services by requiring such firms to hold sufficient capital and have adequate risk controls in place.

Bank of Japan

Japanese flag representing the Bank of Japan

The Bank of Japan has prioritized price stability and stable operations of payment and settlement systems. The Bank of Japan has held interest rates below zero (negative interest rates) in a drastic attempt to revitalize the economy. Negative interest rates allow individuals to get paid to borrow money, but investors are disincentivised to deposit funds as this will incur a charge.

Central bank responsibilities

Central banks have been established to fulfil a mandate in order to serve the public interest. While responsibilities may differ between countries, the main responsibilities include the following:

1) Achieve and maintain price stability: Central banks are tasked with protecting the value of their currency. This is done by maintaining a modest level of inflation in the economy.

2) Promoting financial system stability: Central banks subject commercial banks to a series of stress testing to reduce systemic risk in the financial sector.

3) Fostering balanced and sustainable growth in an economy: In general, there are two main avenues in which a country can stimulate its economy. These are through Fiscal policy (government spending) or monetary policy (central bank intervention). When governments have exhausted their budgets, central banks are still able to initiate monetary policy in an attempt to stimulate the economy.

4) Supervising and regulating financial institutions: Central banks are tasked with the duty of regulating and supervising commercial banks in the public interest.

5) Minimize unemployment: Apart from price stability and sustainable growth, central banks may have an interest in minimising unemployment. This is one of the goals from the Federal Reserve.

Central Banks and interest rates

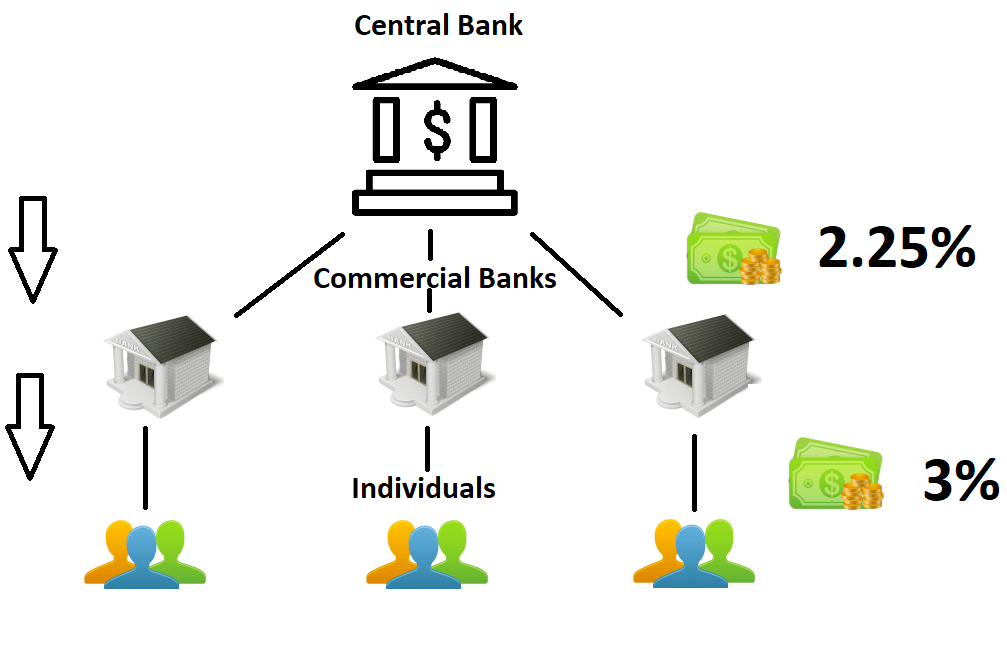
Central banks set the central bank interest rate, and all other interest rates that individuals experience on personal loans, home loans, credit cards etc, emanate from this base rate. The central bank interest rate is the interest rate that is charged to commercial banks looking to borrow money from the central bank on an overnight basis.

This effect of central bank interest rates is depicted below with the commercial banks charging a higher rate to individuals than the rate they can secure with the central bank.
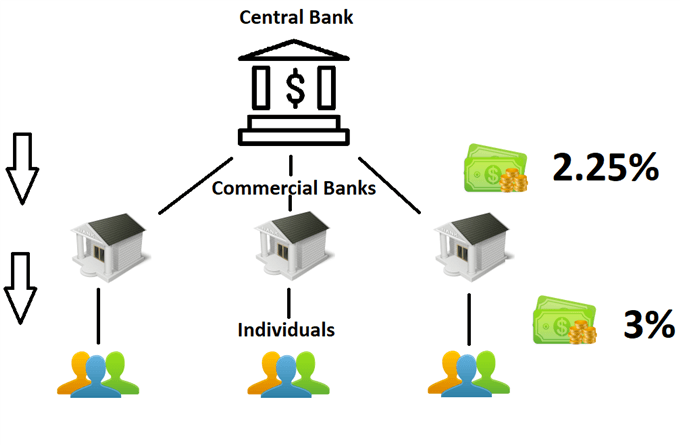
Central bank FX rates filtering down the system

Commercial banks need to borrow funds from the central bank in order to comply with a modern form of banking called Fractional Reserve Banking. Banks accept deposits and make loans meaning they need to ensure that there is sufficient cash to service daily withdrawals, while lending the rest of depositors’ money to businesses and other investors that require cash. The bank generates revenue through this process by charging a higher interest rate on loans while paying lower rates to depositors.

Central banks will define the specific percentage of all depositors’ funds (reserve) that banks are required to set aside, and should the bank fall short of this, it can borrow from the central bank at the overnight rate, which is based on the annual central bank interest rate.

FX traders monitor central bank rates closely as they can have a significant impact on the forex market. Institutions and investors tend to follow yields (interest rates) and therefore, changes in these rates will result in traders channelling investment towards countries with higher interest rates.

How central banks impact the forex market

Forex traders often assess the language used by the chairman of the central bank to look for clues on whether the central bank is likely to increase or decrease interest rates. Language that is interpreted to suggest an increase/decrease in rates is referred to as Hawkish/Dovish. These subtle clues are referred to as “forward guidance” and have the potential to move the forex market.

Traders that believe the central bank is about to embark on an interest rate hiking cycle will place a long trade in favour of that currency, while traders anticipating a dovish stance from the central bank will look to short the currency.

For more information on this mechanism, read, “Interest Rates and the Forex Market”

Movements in central bank interest rates present traders with opportunities to trade based on the interest rate differential between two country’s currencies via a carry trade. Carry traders look to receive overnight interest for trading a high yielding currency against a low yielding currency.

3 Trading Tips for RSI

3 Trading Tips for RSI

WHAT IS RSI (RELATIVE STRENGTH INDEX)?

RSI (Relative Strength Index) is counted among trading’s most popular indicators. This is for good reason, because as a member of the oscillator family, RSI can help to determine the trend, time entries, and more.

The Relative Strength Index (RSI) was developed by J. Welles Wilder to measure the speed and change of price movements. RSI oscillates and is bound between zero and 100. There are many different uses for RSI and by far the most popular is trading overbought and oversold crossovers.

To help become better acquainted with the RSI indicator and the different settings, we will review three uncommon tips for trading with RSI.

1. THINK BEYOND THE CROSSOVERS

When traders first learn about RSI and other oscillators, they tend to gravitate to overbought and oversold values, looking for a direct signal when the indicator is leaving oversold or overbought territory. While these are intuitive points to enter in the market on retracements, this can be counterproductive in strong trending environments. RSI is considered a momentum oscillator, and this means extended trends can keep RSI overbought or oversold for long periods of time and short signals may show in the midst of a strong market, or long signals showing in a bear market.
The below image is an example of using RSI on a EURUSD 8 hour chart. The initial sell signal would’ve led into a strong bearish market, but as the short-side trend really took-hold, the indicator ended up flagging multiple bullish signals, even as prices were still continuing to fall.

EUR/USD Eight-Hour Price Chart, RSI Applied

Chart prepared by James Stanley; EUR/USD Eight-Hour price chart, Sept 2021 – Oct 2021

This is why traders should look to avoid blindly taking signals from RSI or any other indicator, as it’s a simple tool; and like any other tool it can be very advantageous if used correctly but if mis-applied, the damage could be catastrophic.

2. RSI as a Trend Filter – Watch the Center Line

All oscillators have a center line and more often than not, they become a forgotten backdrop compared to the indicator itself. RSI is no different, with a center line found in the middle of the range at a reading of 50.

Technical forex traders can use the centerline to show shifts in the trend. If RSI is above 50, momentum is considered up and traders can look for opportunities to buy the market. A drop below 50 would indicate the development of a new bearish market trend.

In the chart below you can again see our EURUSD example using a weekly price chart. Notice how RSI moving above or below the 50 line had a tendency to highlight the prevailing trend. From April of 2018 RSI spent most of the time below the 50 mark, and a down-trend took-hold in EUR/USD through much of this period. The Covid pandemic getting priced-in during Q1 of 2020 provided some excitement, but a corresponding bullish signal via RSI in May led strength as the pair rose for much of the next nine months.

While no indicator is perfect, something like RSI on the weekly chart can be helpful for directional signals, so that traders can gleam a technical bias from the higher timeframes that they can then use on shorter time frames (a technique known as multiple time-frame analysis).

EUR/USD Weekly Price Chart with RSI Applied

Chart prepared by James Stanley; EUR/USD Weekly chart, 2018 – April 2022

3. CHECK YOUR PARAMETERS

RSI, like many other oscillators is defaulted to a 14 period setting. This means the indicator looks back 14 bars on whatever chart you may be viewing, to create its reading. Even though 14 is the default setting, that may not make it the best setting for your trading. Normally short-term traders use a smaller period, such as a nine period RSI, to replicate shorter term movements in the market. Longer-term traders may opt for a higher period, such as a 25 period RSI, for another indicator line.

In our final comparison, you can see in the chart below a nine period RSI line side by side with a 25 period RSI line. While there may not seem like much difference at first glance, pay close attention to the centerline along with crossovers of the 70 and 30 values. The RSI nine at the top of the graph has considerably more oscillation compared to its RSI 25 counterpart.

Chart prepared by James Stanley

Australian Dollar Price Action Setups: AUD/USD, GBP/AUD Post RBA Hike

Australian Dollar Price Action Setups: AUD/USD, GBP/AUD Post RBA Hike

AUSTRALIAN DOLLAR FUNDAMENTAL BACKDROP

The Reserve Bank of Australia (RBA) and its new Governor Michele Bullock did not disappoint this morning following repeated comments regarding another rate hike. The Governor issued a warning in her statement that the RBA is prepared to hike rates again if needed as inflationary pressures remain persistent. Bullock commented on the fresh batch of data received since its August meeting “the weight of this information suggests that the risk of inflation remaining higher for longer has increased”.

This rate hike is not one that will be welcomed by consumers as according to estimates it will add another $100AUD to the average $600kAUD mortgage loan. The RBA however, said that inflation while on the way down is taking longer than expected to reach the Central Banks target range of 2-3%.

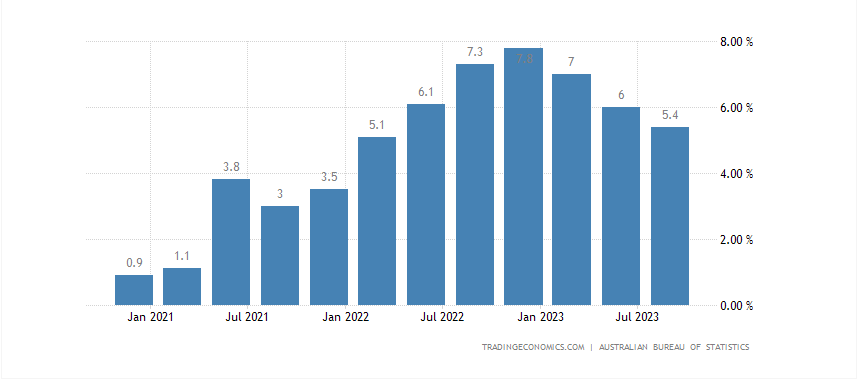
Australian Inflation

image1.png

The Australian Dollar however, weakened following the announcement. This may in part be down to the recent rally or down to the change in language from the RBA who in October stated “some further tightening of monetary policy may be required”. Today the rhetoric was that the Central Bank remains ready to act if the need arises which was interpreted as slightly dovish in nature.

PRICE ACTION AND POTENTIAL SETUPS

AUDUSD

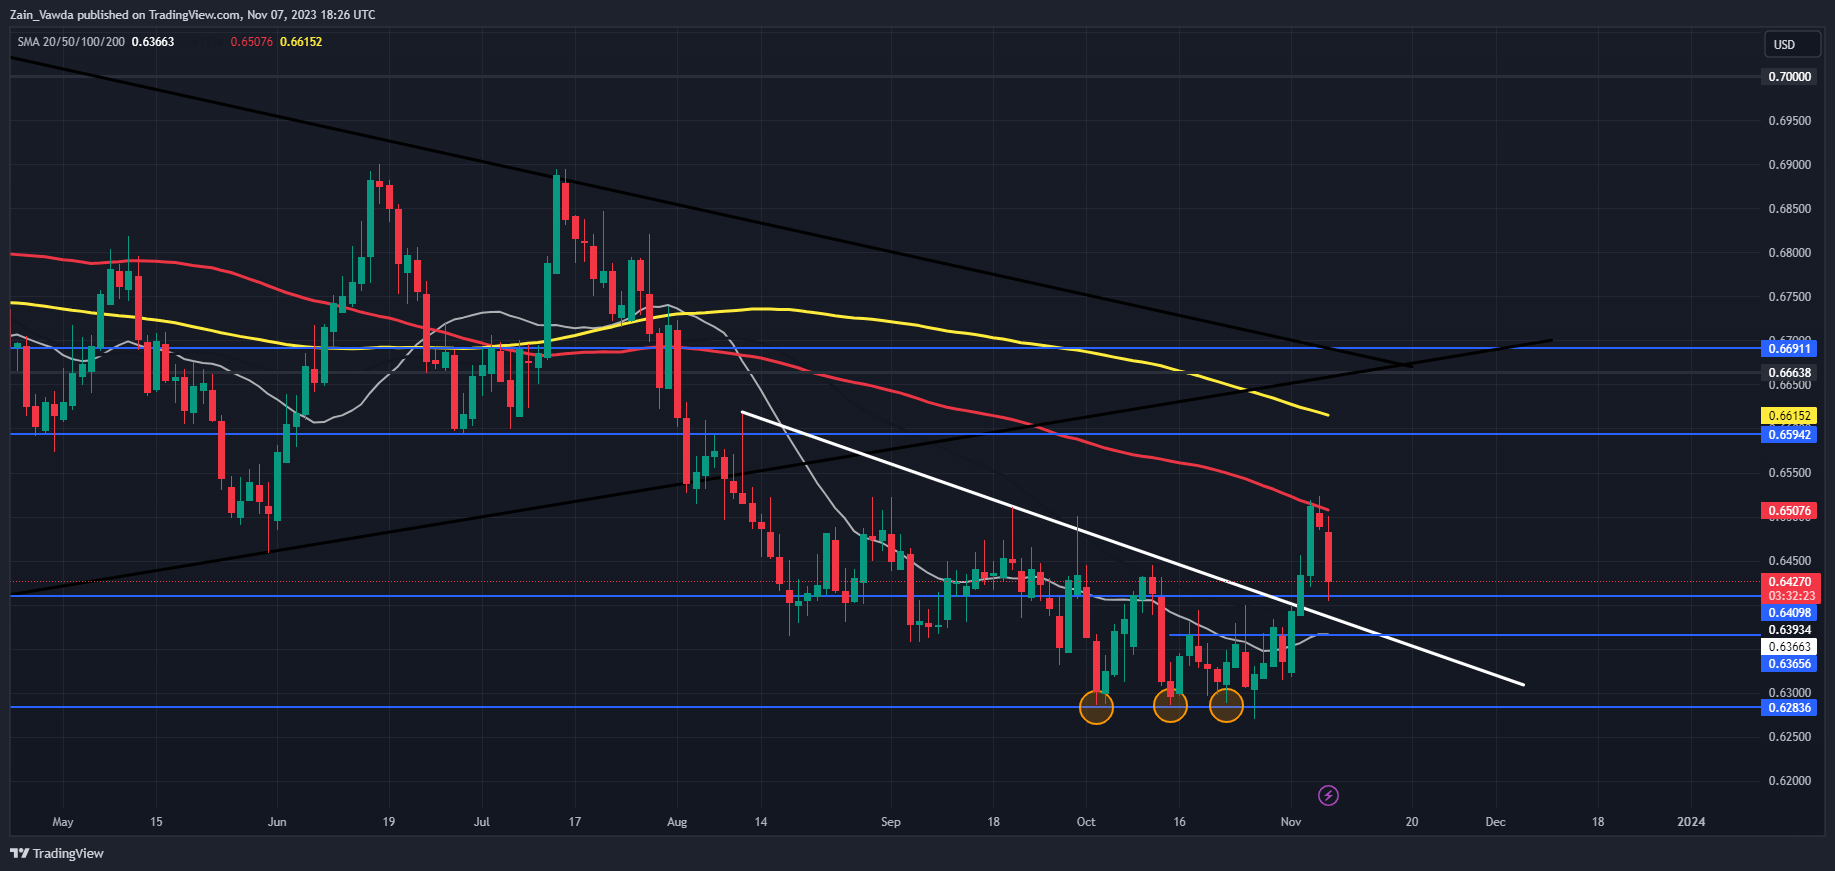
AUDUSD had been on an impressive 3-day rally at the back end of last week before running into resistance at 0.6500 handle where the 100-day MA rests as well. The rally which began following a triple bottom pattern and a descending trendline break gathered pace quickly and could continue from a technical standpoint.

AUDUSD is beginning to look like a textbook long setup with a period of consolidation followed by a trendline break and now it appears we are about to retest the trendline. The ideal scenario here would be a bounce of the trendline and support at either the 0.64098 or the 20-day MA and support area slightly lower at 0.63660 before continuing its move higher.

AUDUSD bulls will be watching the US Dollar index which is attempting a rebound here at the start of the week. In order for Bulls to seize control I think we may need to see a renewed leg to the downside for the DXY which in turn could help AUDUSD cross above the 0.6500 hurdle and beyond.

Key Levels to Keep an Eye On:

Support levels:

  • 0.64098
  • 0.63660
  • 0.62836

Resistance levels:

  • 0.65000
  • 0.66152
  • 0.66911

AUD/USD Daily Chart

GBPAUD

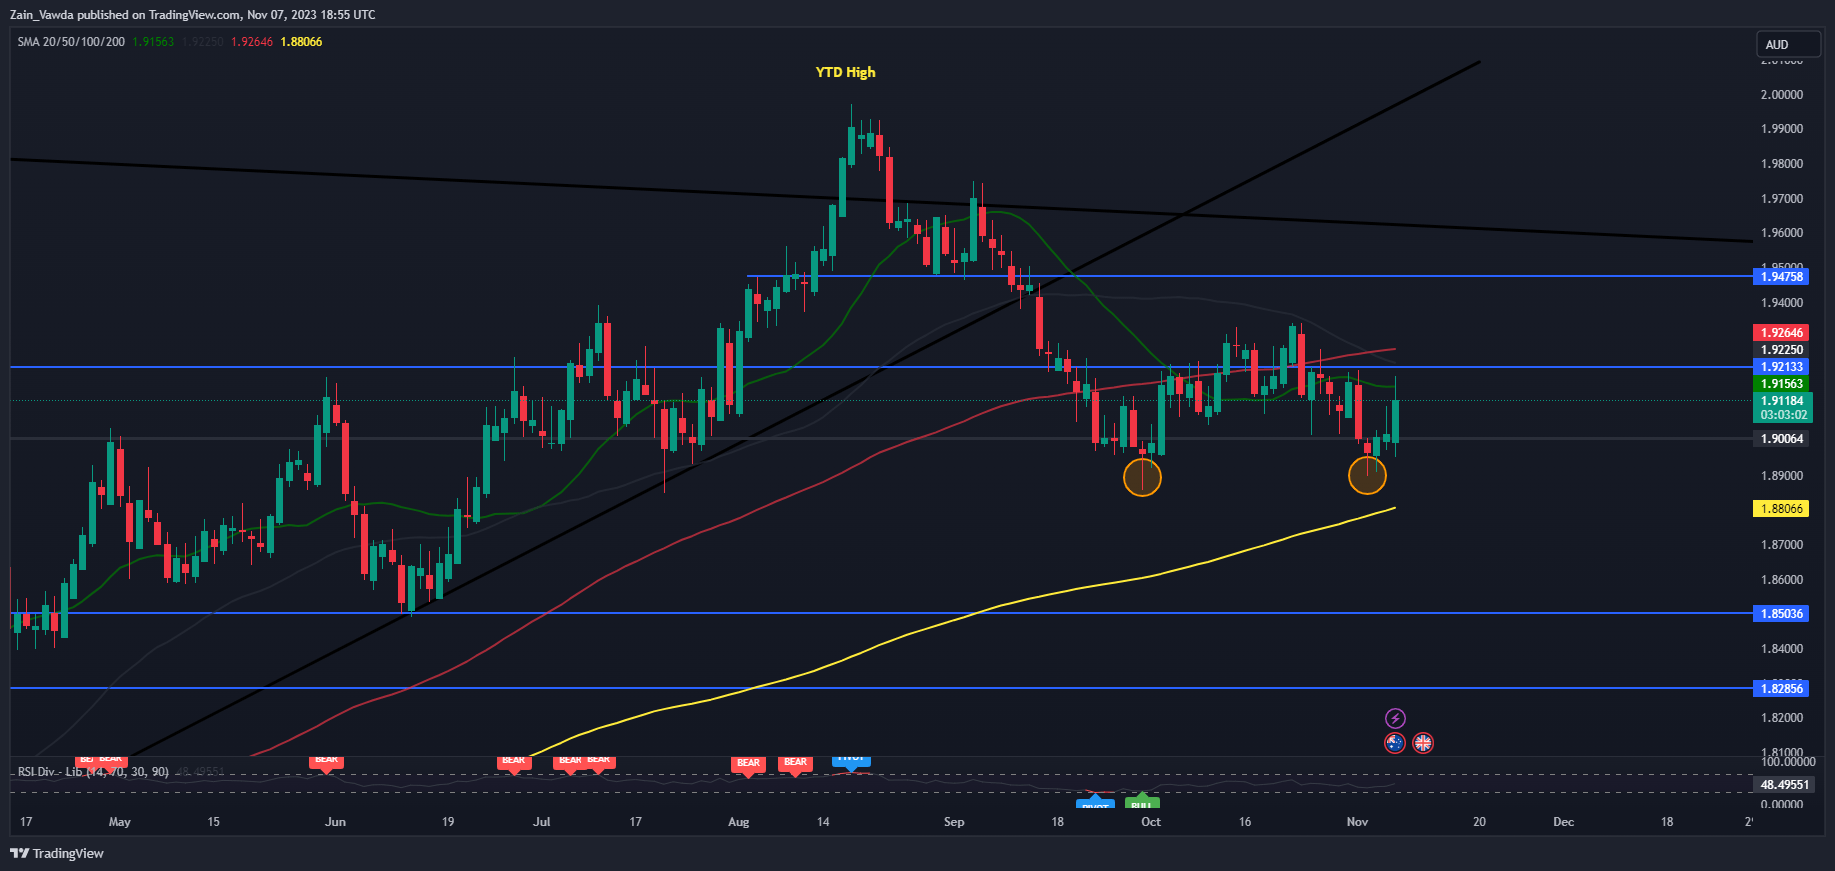
GBPAUD has been ranging now for the better part of 6 weeks. It does appear as if we have printed a double bottom pattern but the upside remains capped by a key area of resistance and the 20,50 and 100-day MA all resting around the 1.92100 area.

Looking at the mixed nature of price action though there is a chance that we could get one more push lower toward support resting at the 200-day MA around 1.8806. This would

obviously provide a better risk to reward opportunity for would be bulls looking to get involved.

GBP/AUD Daily Chart

Source: TradingView, prepared by Zain Vawda

For tips and tricks regarding the use of client sentiment data, download the free guide below.

AUD/USD Mixed

Data provided by