Gold Trading: Three Top Tips for Trading Gold

Gold Trading: Three Top Tips for Trading Gold

Gold Trading Tips

Few markets on Earth have the historical appeal and attraction as Gold. While traders have numerous trading options today, in a number of different currencies or asset classes or geographies, Gold has been a long-standing store of value that’s piqued speculators’ interest for about as long as human beings have traded with each other.

We previously looked at some of the basics around Gold trading in the What is Gold article a little earlier in this sub-module. And we also have a ‘How to Trade Gold’ article on the Gold page of DailyFX. But, in this article, we’re going to get a bit more granular as we investigate Gold Trading Strategies, Tips and Tactics.

Gold Trading Tips

Probably one of the more obvious aspects of Gold, particularly on a longer-term basis, is the cycle sensitivity that will often show around the metal – and this isn’t a new phenomenon. As markets themselves are cyclical animals, Gold often moves to a similar type of tune, although timing may be differentiated from other markets at the time. Looking at Gold prices over the past 45 years, and this becomes a bit more clear. On the below chart, trends and ranges have been identified by blue or grey boxes, and that leads us into tip number one:

Gold Trading Tip #1: Adapt to the Present Condition

The key takeaway here is the importance of adaptation: Because if a trend trader approaches Gold with their typical approach while Gold markets are in a range, there’s high odds they could see unfavorable results. If Gold markets are mean-reverting and range-bound, the trader would likely want to approach the matter with a range-based approach. But, when Gold markets are trending, such as the case from 2001-2011 or 1976-1980, then traders are going to want to utilize trend strategies to adapt to the present condition.

Gold Futures Monthly Chart

Gold Trading Tip #2: Watch the US Dollar

The US Dollar is traded in a number of markets but, in the largest venues, Gold is traded in US Dollars. As a matter of fact, one common equation on CFD platforms presents a quote for Gold prices as ‘XAU/USD.’ The chemical symbol for Gold on the periodic table of elements is ‘AU’ and the denominator in that quote is the US Dollar, highlighting how Gold is being priced in terms of US Dollars.

This also means that, all factors held equal, and if Gold made no move at all but the US Dollar increased in value – the price of Gold could go down. Because in the function above, the value of the denominator, or USD, would increase in value thereby decreasing the value of the function as a whole.

So, there could be a tendency for Gold to display an inverse correlation with the US Dollar. This isn’t all of the time, there are scenarios where both Gold and the Dollar may increase in value although those are somewhat rare, historically speaking.

On the below chart, that correlation is highlighted in the bottom portion of the image. Reads or values above the zero line indicate positive correlation which, again, is somewhat rare but not unheard of. Reads below zero highlight inverse correlation, with a value of -1 highlighting a perfect inverse relationship.

Gold Monthly Price Chart: An Inverse Relationship with the US Dollar

Gold Trading Tip #3: Know Your Time Frames

On the above charts we’re looking at the bigger picture behind Gold prices using the Monthly variety. But these conditions and market changes can take place on shorter-terms, as well, and it’s key for traders to have some type of consistent framework for their analysis so that they can properly implement their strategies in the ways that they want.

As we looked at in the multiple time frames article, traders should analyze markets from more than a single vantage point. The above monthly variety can be helpful to see the bigger picture – but for actually setting up trades and implementing strategies, traders will likely want to look to shorter time frames.

In the above graphic, the blue box on the right side of the chart shows a trend that’s been going for a little over two years now. But, looking at the shorter-term daily chart below to get a more granular look at that two-year-outlay shows that Gold prices were not trending the entire time. As a matter of fact, the same type of trend-range-trend-range relationship presented itself inside of this longer-term trend.

This is again important for traders when setting up strategy because for those that are looking to trade a trend, waiting for the monthly chart to highlight that potential may be too late. On the below chart, that blue box has been expanded so we can take a more granular look at the trend; but this time, I’ve added green boxes around the shorter-term trends and grey boxes around the mean-reverting or range-bound periods.

Gold Daily Price Chart

Gold Trading Strategies

Perhaps more important than the specific strategy that one is using to analyze or set up trades in Gold is the ‘fit’ to that specific market condition. For instance, if we look at the above image and focus on the green boxes, when the short-term trend is moving in the direction of the longer-term trend, traders are going to want to follow the age-old adage of ‘buying low and selling high.’ In the grey portions, however, when prices are ranging, traders want to similarly buy low and sell high but they’re going to want to do that in a slightly different way; closing the entirety of the long position while ‘high’ and then looking at potentially getting short to play the other side of the range.

Right up front – this means that no trader is always going to be ‘right’ because conditions, similar to trends, will change; and its impossible to know that until after the fact. This is where items like trade and risk management come into play, potentially helping to mitigate the downside in those instances where something changes or shifts away from their expectations.

Simplifying Market Behaviors by Assigning ‘Conditions’

With any market, if you think about it, there’s really only a couple of things that prices might do: Trend or not. Either prices are trending in a directional move for some reason, or they’re not trending at all: And the transitory state between mean-reversion and trends are breakouts, which are technically a market condition, itself. So, in that effort of simplification, analysts can break down market conditions into three specific types:

  1. Trend – a directional move is showing and there’s often a fundamental reason for it as traders are bidding higher-highs and higher-lows (or selling lower-lows and lower-highs).
  2. Range/Mean-Reversion – devoid of a driver, prices will often display no trend, which can open the door for range-bound or mean-reversion strategies.
  3. Breakouts – this is what happens when new information gets priced-in, and this can create a breakout move from a range and into a new trend. That new trend may last for a while or it may merely propel price action into a new range.

Bespoke Approach for the Proper Condition

Knowing what state a market is in isn’t enough, as traders are usually going to want to cater their approach to that specific condition. For instance, a trader focusing on breakouts likely won’t be able to withstand as much excursion as a trader picking on range/mean reversion setups.

At DailyFX, we help traders learn more about strategies for each of these conditions. But, perhaps the most important aspect of customizing a strategy to a specific traders’ needs is the risk management component, which is explored in-depth our Traits of Successful Traders research series, which is available completely free-of-charge and can be accessed by clicking on the link below:

AUD/USD Price Forecast: Aussie Dollar Unable to Exploit Weaker US Data

AUD/USD Price Forecast: Aussie Dollar Unable to Exploit Weaker US Data

AUSTRALIAN DOLLAR FUNDAMENTAL BACKDROP

The Australian dollar has slipped back below the 0.6500 psychological handle once more. Yesterday, we saw Australian employment change data beat estimates despite unemployment ticking 0.1% higher. Overall, the Australian labor market remains tight and will keep the Reserve Bank of Australia (RBA) on its toes.

From a USD perspective, continuous jobless claims data rose to levels last seen roughly two years ago alongside an initial claims beat. Recent US economic data is showing signs of weakness but Fed officials fought back with some hawkish messaging in support of Fed Chair Jerome Powell’s recent comments.

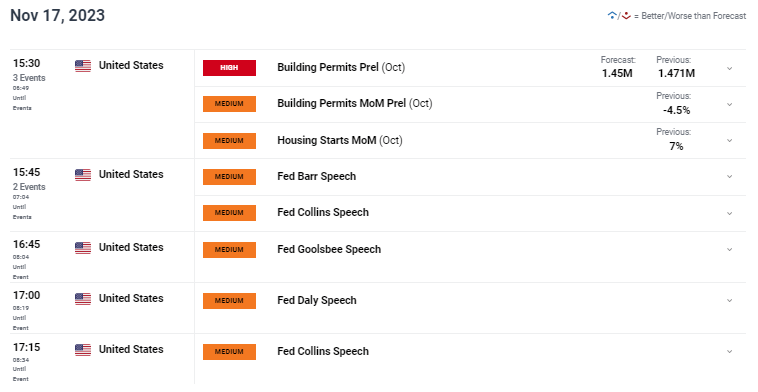
The day ahead will be relatively muted but US building permit figures will dominate headlines after yesterday’s NAHB miss. Fed speakers will continue through to today and it will be interesting whether today’s speakers extend the pushback against easing monetary policy.

AUD/USD ECONOMIC CALENDAR (GMT +02:00)

image1.png

TECHNICAL ANALYSIS

AUD/USD DAILY CHART

image2.png

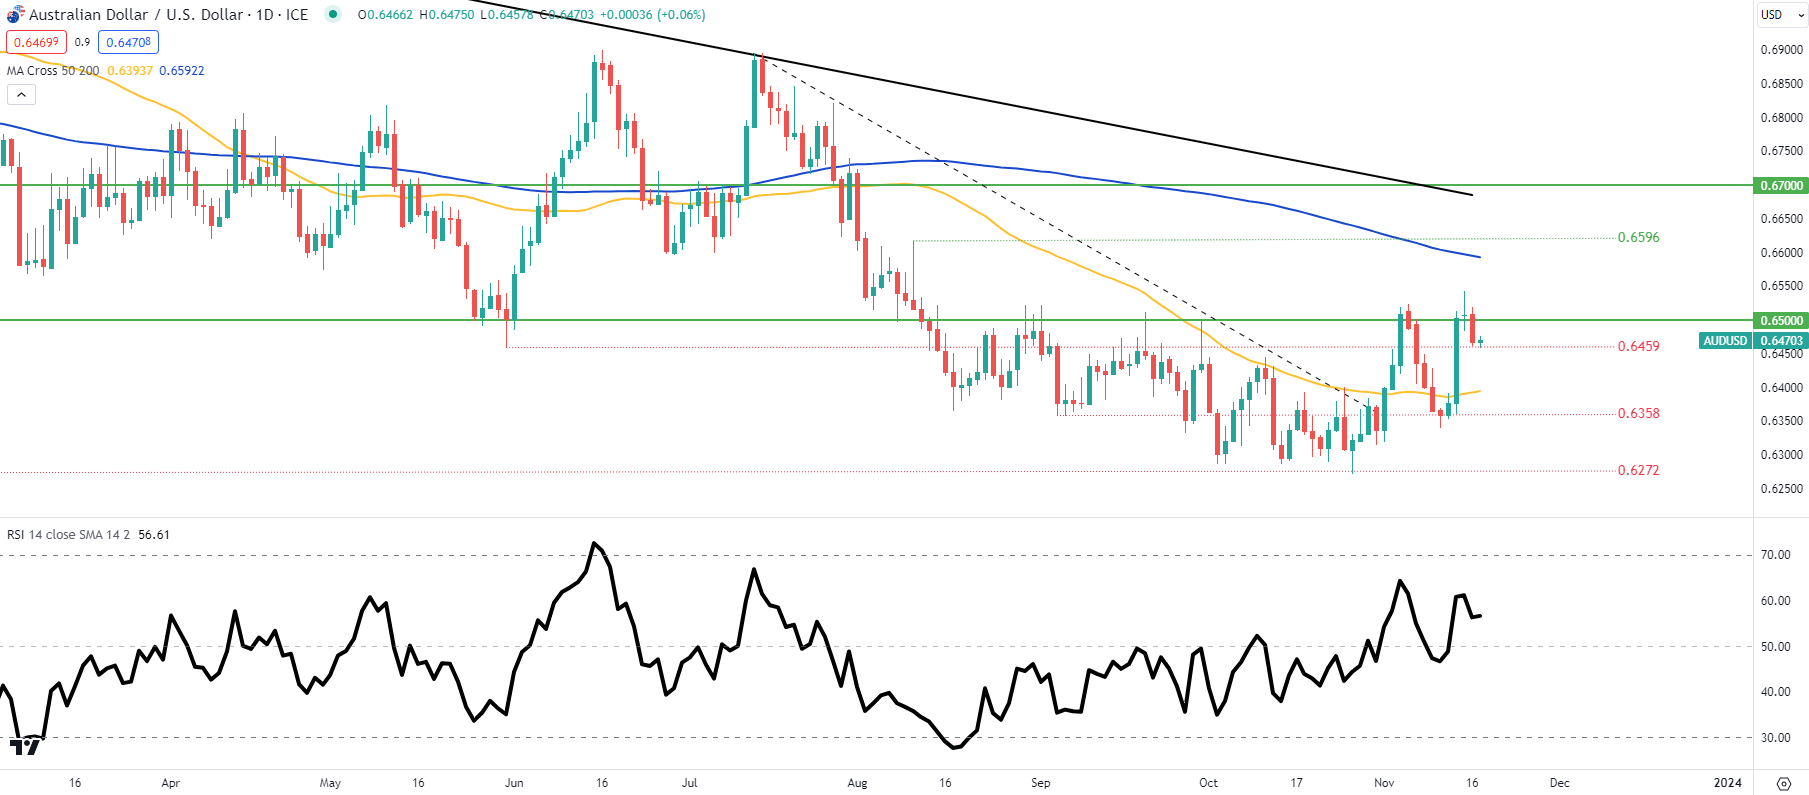
AUD/USD daily price action slumped after Wednesday’s long upper wick close now facing the 0.6459 swing support. The Relative Strength Index (RSI) shows bearish/negative divergence and could see the pair breakdown further should this unfold. If today’s close falls below the 0.6459 swing low, the 50-day moving average (yellow) could come into consideration for AUD bears.

  • 200-day MA
  • 0.6500

Key support levels:

  • 0.6459
  • 50-day MA
  • 0.6358
Crypto News: Bitcoin-Spot ETFs in Focus as Approval Window Narrows

Crypto News: Bitcoin-Spot ETFs in Focus as Approval Window Narrows

BTC Ends Four-Day Losing Streak as SEC Breaks ETF Silence

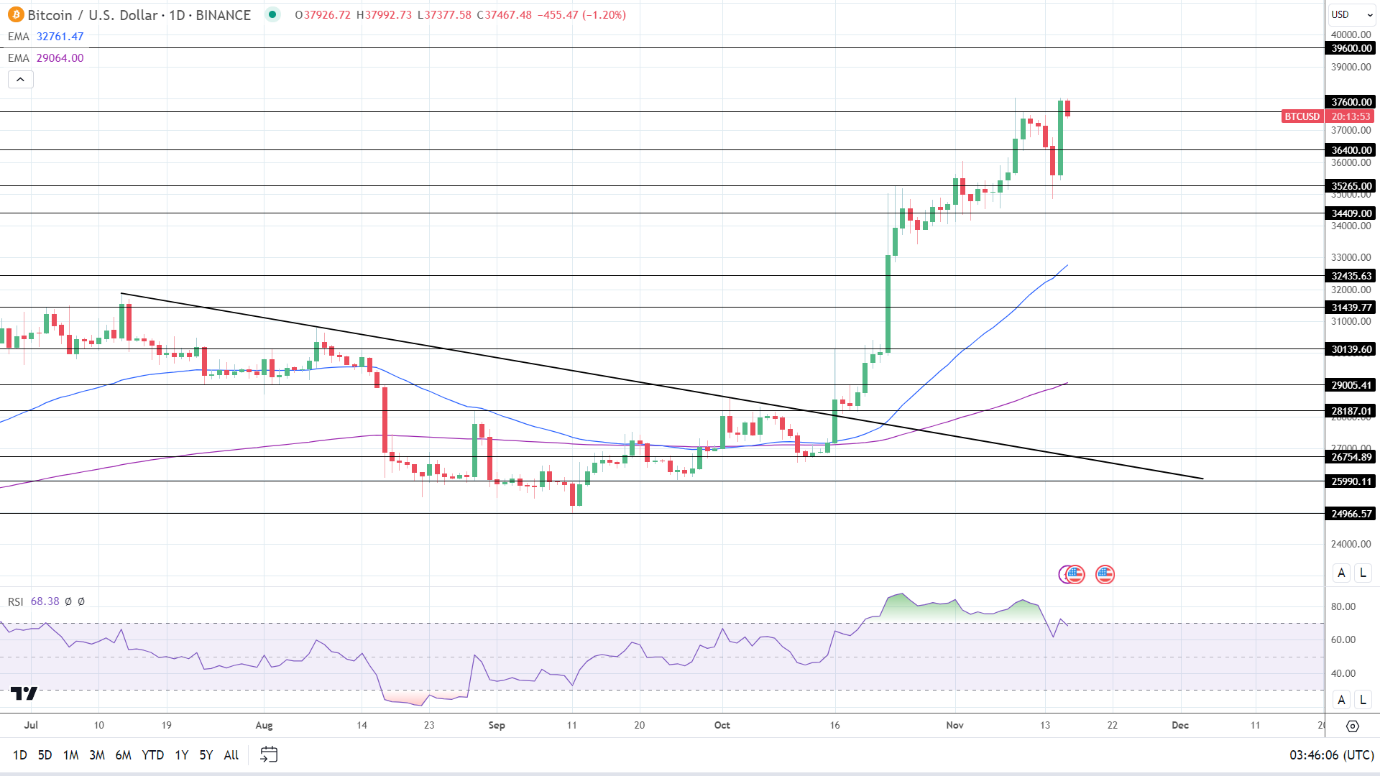
Bitcoin (BTC) rallied 6.49% on Wednesday, ending the session at $37,923. On Wednesday, the SEC delayed the decision on the Hashdex request to change to a BTC futures and spot ETF.

Bloomberg Intelligence ETF Analyst James Seyffart shared the SEC update, saying,

Trading Derivatives carries a high level of risk to your capital and you should only trade with money you can afford to lose. Trading Derivatives may not be suitable for all investors, so please ensure that you fully understand the risks involved, and seek independent advice if necessary. A Product Disclosure Statement (PDS) can be obtained either from this website or on request from our offices and should be considered before entering into a transaction with us. Raw Spread accounts offer spreads from 0.0 pips with a commission charge of USD $3.50 per 100k traded. Standard account offer spreads from 1 pips with no additional commission charges. Spreads on CFD indices start at 0.4 points. The information on this site is not directed at residents in any country or jurisdiction where such distribution or use would be contrary to local law or regulation.

This week, the ETF community discussed the unlikelihood of the SEC approving BTC-spot ETFs in waves. The ETF community expects the SEC to approve the current batch of applications in January 2024. A batch approval would mean the broader market cannot accuse the SEC of playing kingmaker.

Technical Analysis

Bitcoin Analysis

BTC remained above the 50-day and 200-day EMAs, sending bullish price signals.

A BTC break above the $37,600 resistance level would support a move toward the $39,000 resistance level.

While the ETF community expects the SEC to batch-approve the ETFs, BTC-spot ETF-related news will remain the focal point.

Failure to break above the $37,600 resistance level would leave the $36,400 support level in play. Adverse ETF-related news or SEC activity could test buyer demand.

The 14-Daily RSI reading of 68.38 suggests a BTC return to $38,000 before entering overbought territory.

BTC Daily Chart sends bullish price signals.

BTCUSD 161123 Daily Chart

Ethereum Analysis

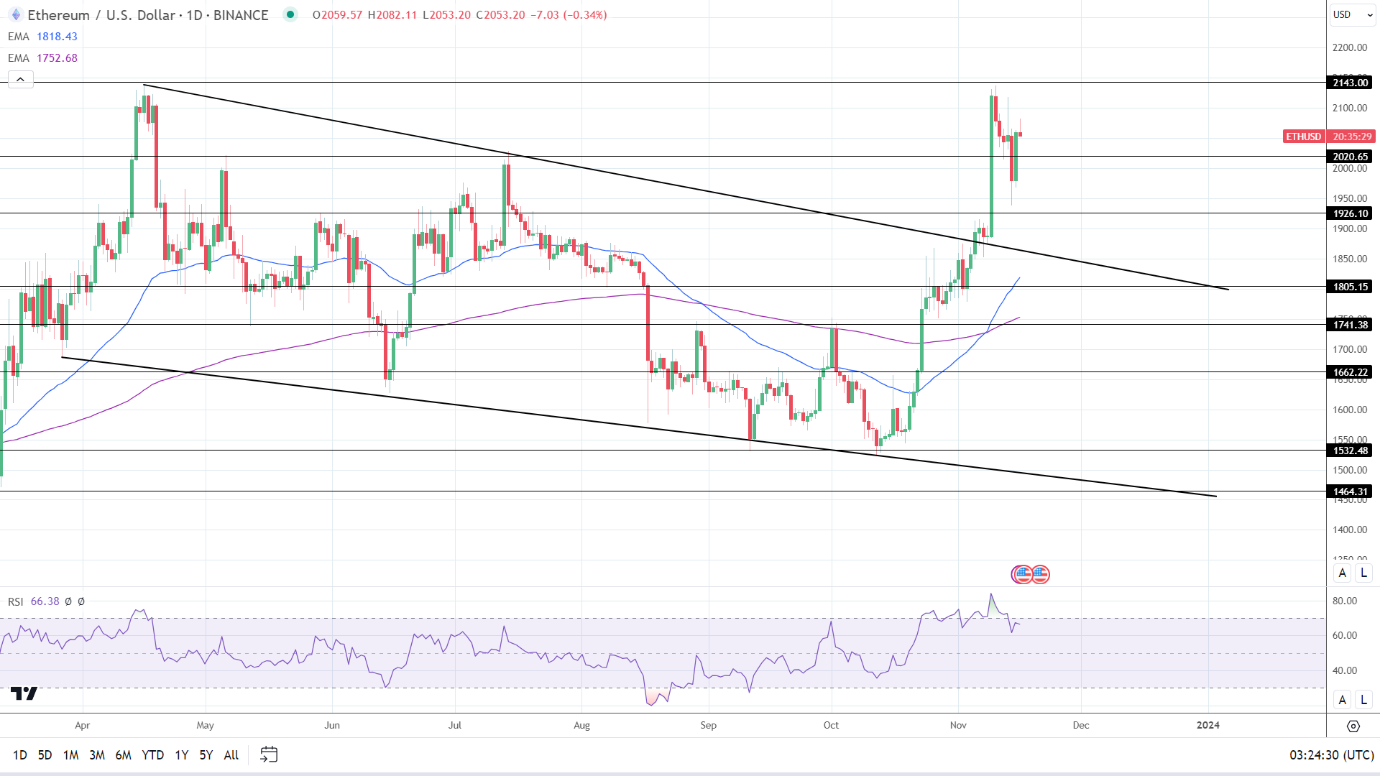
ETH held above the 50-day and 200-day EMAs, sending bullish price signals.

An ETH move to $2,100 would support a break above the $2,021 resistance level to target the $2,143 resistance level.

However, a fall through the $2,021 support level would bring the $1,926 support level into play.

The 14-period Daily RSI at 66.38 indicates an ETH return to $2,100 before entering overbought territory.

ETH Daily Chart sends bullish price signals.
EUR/USD Forecast: Impact of Lagarde’s ECB Stance and US Labor Market

EUR/USD Forecast: Impact of Lagarde’s ECB Stance and US Labor Market

Wednesday Overview

The EUR/USD declined by 0.30% on Wednesday. After a 1.68% rally on Tuesday, the EUR/USD ended the day at $1.08464. The EUR/USD rose to a high of $1.08858 before falling to a low of $1.08315.

ECB President Lagarde and Executive Board Members in Focus

On Thursday, the ECB will take center stage. After revisions to 2023 and 2024 growth forecasts, ECB views on the economy and the interest rate trajectory need monitoring. The EU Commission downwardly revised growth forecasts for 2023 and 2024.

Trading Derivatives carries a high level of risk to your capital and you should only trade with money you can afford to lose. Trading Derivatives may not be suitable for all investors, so please ensure that you fully understand the risks involved, and seek independent advice if necessary. A Product Disclosure Statement (PDS) can be obtained either from this website or on request from our offices and should be considered before entering into a transaction with us. Raw Spread accounts offer spreads from 0.0 pips with a commission charge of USD $3.50 per 100k traded. Standard account offer spreads from 1 pips with no additional commission charges. Spreads on CFD indices start at 0.4 points. The information on this site is not directed at residents in any country or jurisdiction where such distribution or use would be contrary to local law or regulation.

Before the revised growth forecasts, ECB President Lagarde stated the ECB would not begin considering rate cuts for the next two quarters. Deviation from her previous stance would impact the EUR/USD.

ECB Executive Board members Andrea Enria and Luis de Guindos are also on the calendar to speak.

There are no economic indicators from the euro area to influence EUR/USD trends on Thursday.

US Fed Speakers and the Labor Market in Focus

On Thursday, US jobless claims will garner investor interest. Tighter labor market conditions could test market bets on the Fed cutting rates within H1 2024. Economists forecast initial jobless claims to rise from 217k to 220k in the week ending November 11.

Tight labor market conditions support wage growth and increases in disposable income. An upward trend in disposable income would fuel consumer spending and demand-driven inflationary pressures.

The markets are currently eying a possible May Fed rate cut. According to the CME FedWatch Tool, there is a 47.9% chance of a 25-basis point rate cut in May.

However, manufacturing sector economic indicators also need consideration. The manufacturing sector contributes less than 30% to the US economy. Cracks in the US economy could raise fears of a hard landing and fuel bets on a May Fed rate cut. Industrial production and Philly Fed Manufacturing Index numbers warrant consideration.

Beyond the numbers, Fed speakers could also influence the buyer appetite for the US dollar.

Fed Vice Chair John Williams and FOMC members Loretta Mester, Lisa Cook, and Michael Barr are on the calendar to speak. Reactions to the inflation and retail sales figures need monitoring.

Short-Term Forecast:

ECB and Fed speakers may influence short-term EUR/USD trends. Dovish Fed comments on US inflation and retail sales could drive EUR/USD towards $1.10, but the ECB must maintain its interest rate guidance for support.

EUR/USD Price Action

Daily Chart

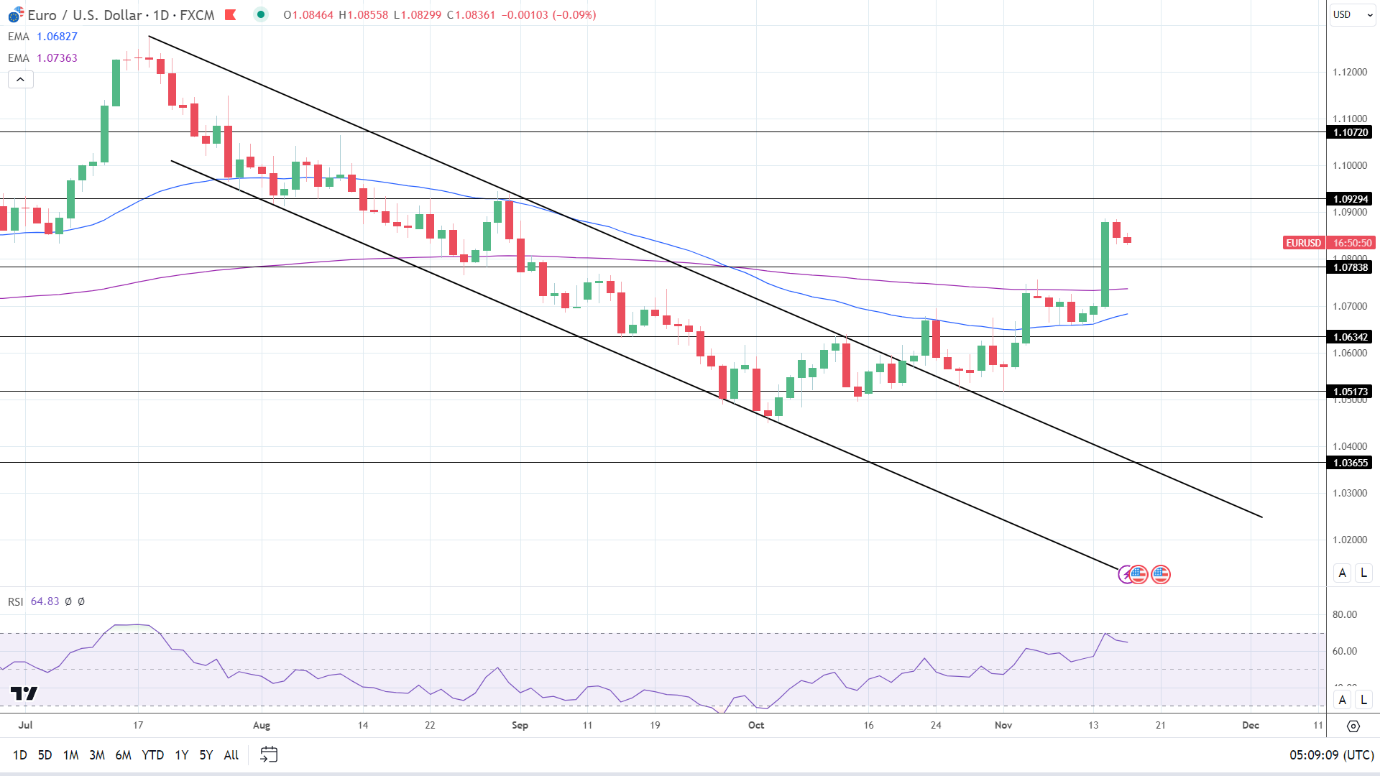
The EUR/USD remained above the 50-day and 200-day EMAs, affirming bullish price signals.

A EUR/USD break above $1.09 would support a move to the $1.09294 resistance level.

US economic data and central bank speeches will be the focal points on Thursday.

Hawkish Fed comments and better-than-expected US stats would support a EUR/USD fall through the $1.07838 support level. A fall through the $1.07838 support level would bring the 200 EMA into view.

The 14-period Daily RSI, 64.83, suggests a EUR/USD move to the $1.09294 resistance level before entering overbought territory.

EUR/USD Daily Chart sends bullish price signals.
EURUSD 161123 Daily Chart

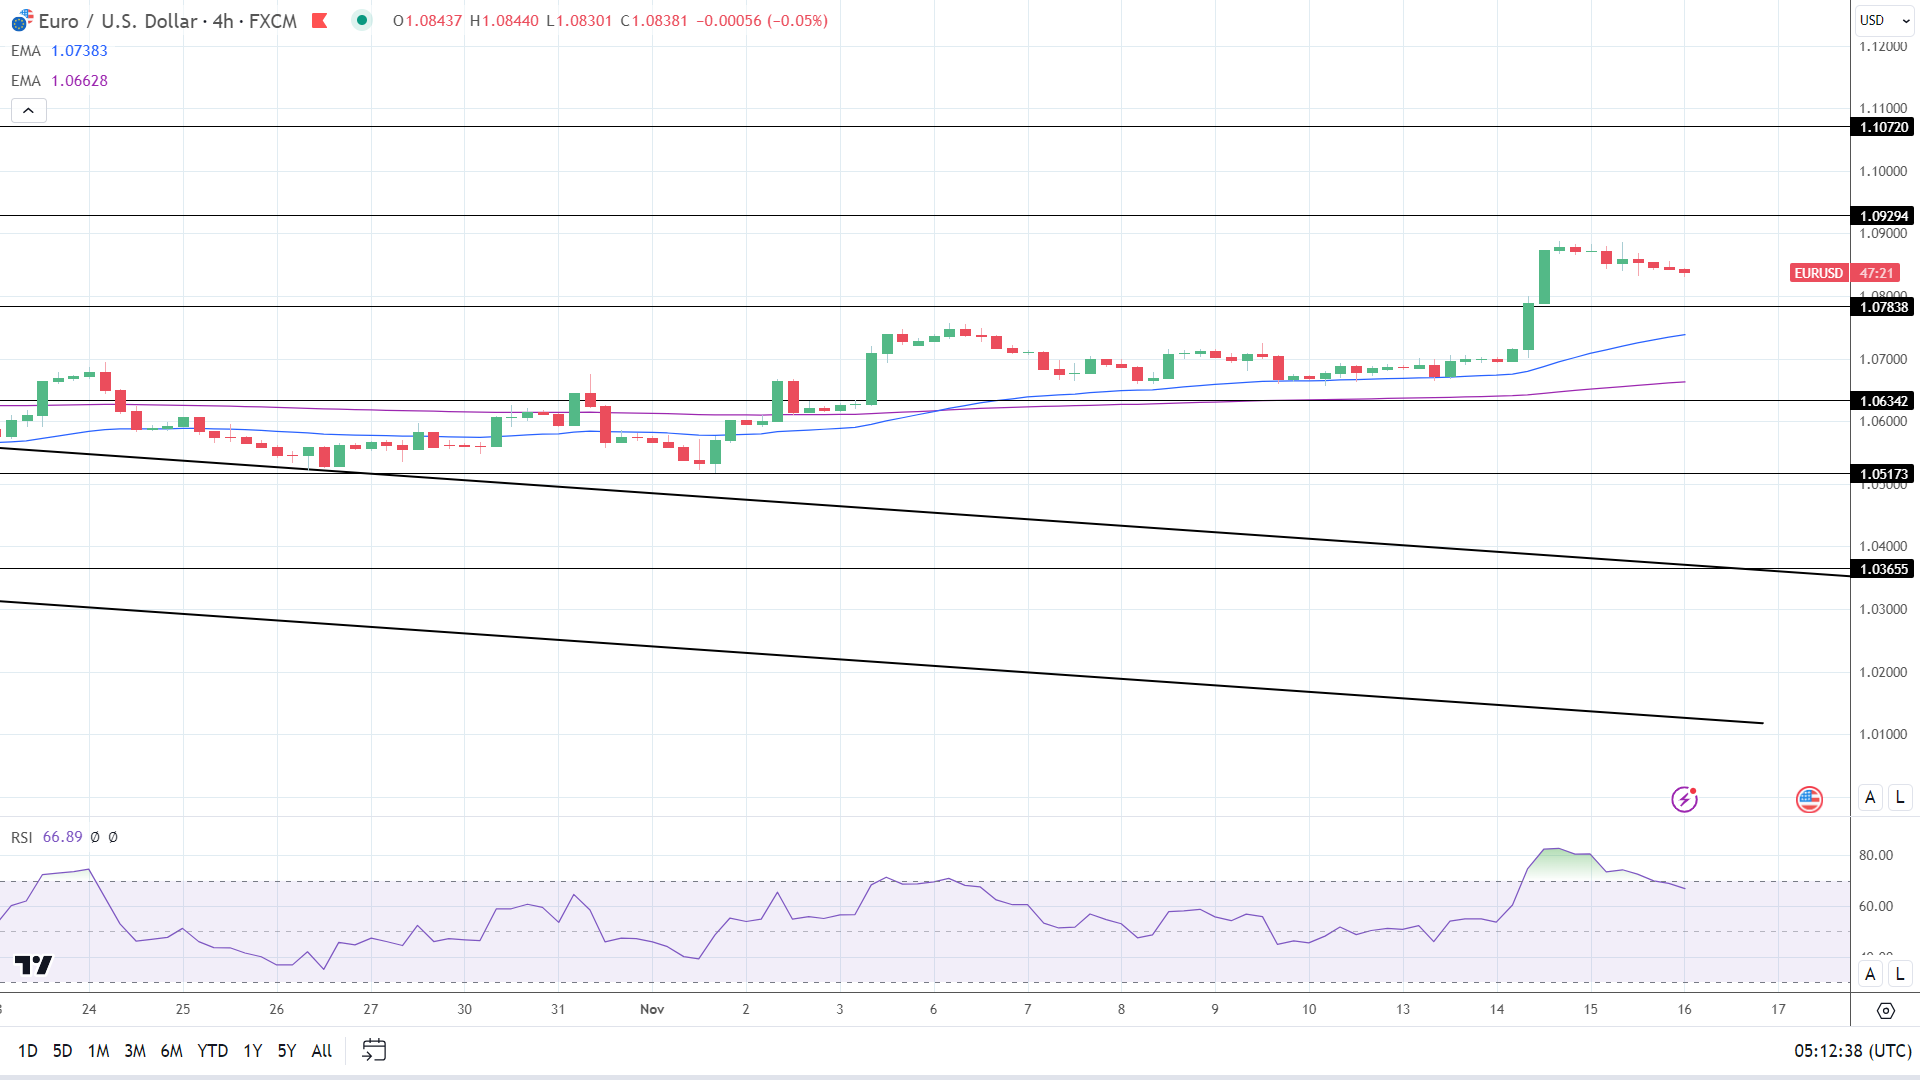
4-Hour Chart

The EUR/USD holds above the 50-day and 200-day EMAs, reaffirming bullish price signals.

A EUR/USD break above $1.09 would give the bulls a run at the $1.09294 resistance level.

However, a EUR/USD fall below the $1.07838 support level would bring the 50-day EMA into play.

The 14-period RSI on the 4-hour chart, 66.89, suggests a EUR/USD move to $1.09 before entering overbought territory.

4-Hourly Chart affirms bullish price signals.
EURUSD 161123 4 Hourly Chart
Silver Prices Forecast: Underpinned by Federal Reserve Rate Cut Expectations

Silver Prices Forecast: Underpinned by Federal Reserve Rate Cut Expectations

Silver’s Stability Amid Economic Uncertainties

Silver (XAG/USD) is showing resilience despite the strengthening U.S. dollar, maintaining stability around $23.90. This stability is partly attributed to a dip in U.S. Treasury yields and mixed economic indicators, which are shaping the silver market dynamics.

U.S. Dollar and Treasury Yields Influence

The U.S. dollar’s rebound, driven by strong retail sales data and persistent inflation, is influencing silver prices. On one hand, the dollar’s strength makes silver more expensive for overseas buyers. On the other, declining Treasury yields, following the release of lower-than-expected inflation data, are creating an environment conducive for silver’s stability.

Trading Derivatives carries a high level of risk to your capital and you should only trade with money you can afford to lose. Trading Derivatives may not be suitable for all investors, so please ensure that you fully understand the risks involved, and seek independent advice if necessary. A Product Disclosure Statement (PDS) can be obtained either from this website or on request from our offices and should be considered before entering into a transaction with us. Raw Spread accounts offer spreads from 0.0 pips with a commission charge of USD $3.50 per 100k traded. Standard account offer spreads from 1 pips with no additional commission charges. Spreads on CFD indices start at 0.4 points. The information on this site is not directed at residents in any country or jurisdiction where such distribution or use would be contrary to local law or regulation.

Federal Reserve Policy and Market Anticipation

Recent economic reports, indicating a slowdown in inflation, have led markets to anticipate an end to the Federal Reserve’s rate hikes. The likelihood of rates remaining unchanged in December is high, with expectations of rate cuts increasing for the next year. This sentiment is playing a crucial role in shaping silver’s short-term outlook.

Investor Sentiment and Silver’s Future

Investors are showing cautious optimism, adjusting their expectations in light of the recent economic data. The anticipation of lower interest rates, coupled with signs of slowing inflation, is enhancing silver’s appeal as an inflation hedge. However, the narrative of “higher-for-longer” rates is tempering this optimism.

Short-Term Outlook: Cautiously Optimistic

In the short term, the outlook for silver remains cautiously optimistic. The balance between a stronger dollar and the prospect of lower interest rates, along with the inflation trajectory, will be key in determining silver’s market position. Strategic buying opportunities may emerge, as long-term drivers for silver remain strong despite near-term challenges.

Technical Analysis

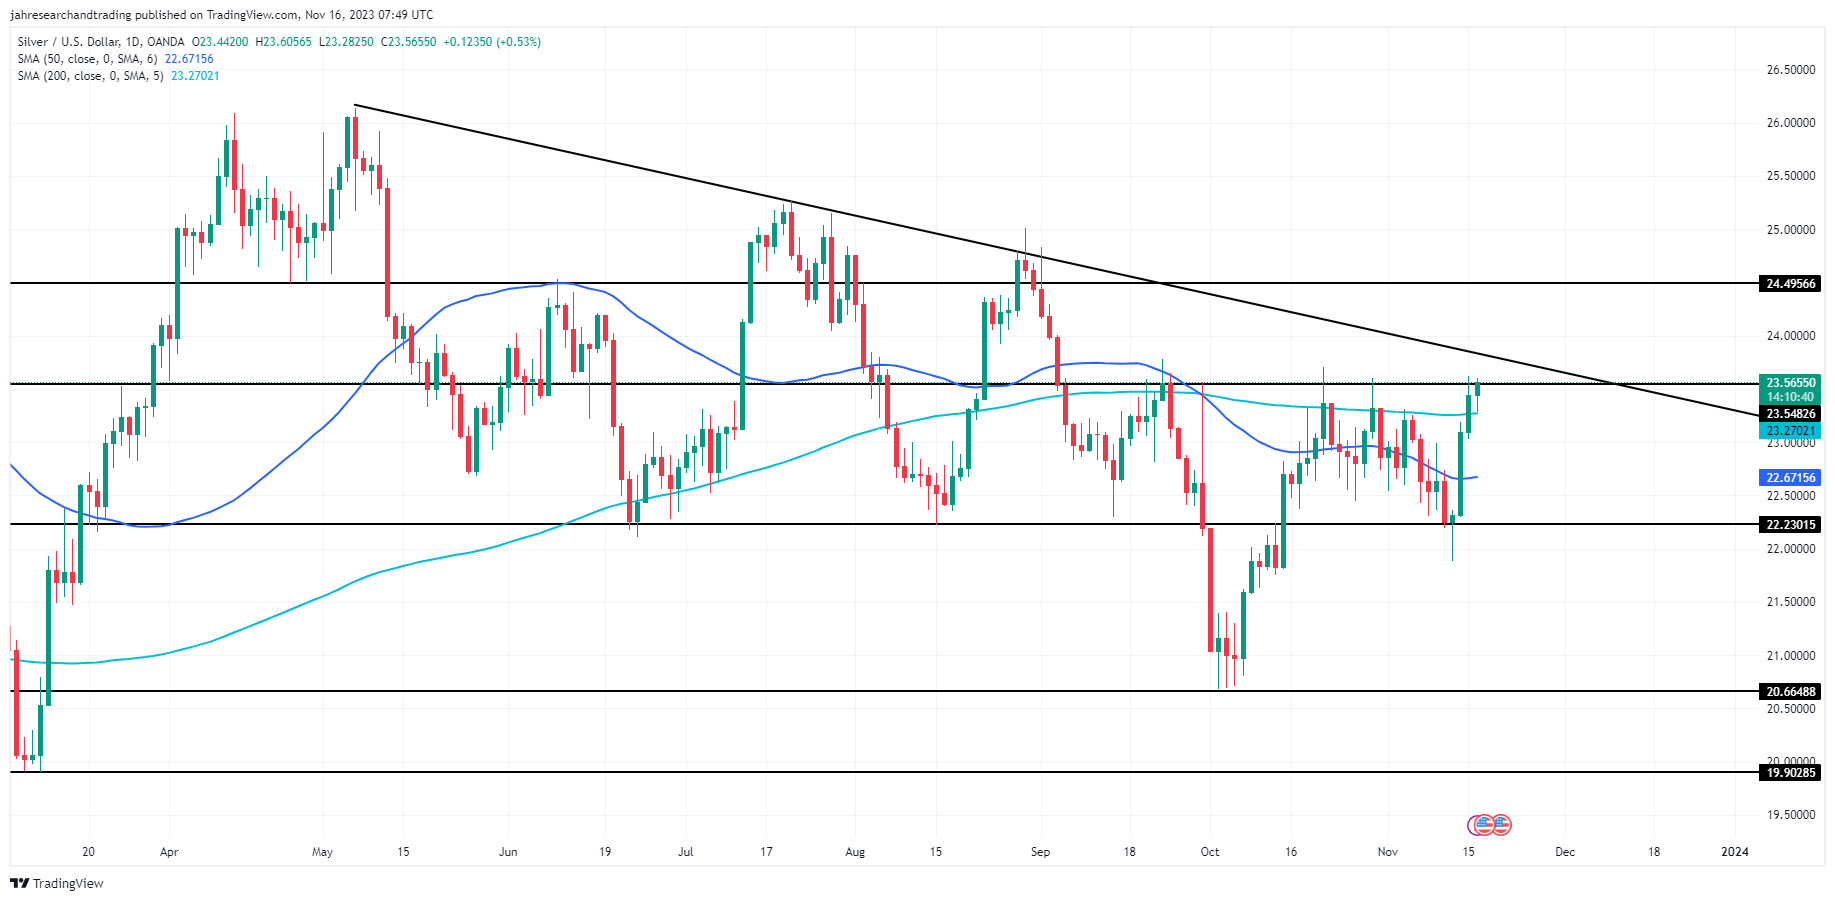
Daily Silver (XAG/USD)Silver (XAG/USD) is trading at 23.57, positioning itself above both the 200-day and 50-day moving averages, indicating a bullish trend in the medium to long term.

The current price is slightly above the 50-day moving average of 22.67 and comfortably above the 200-day average of 23.27. This positioning suggests a sustained upward momentum.

Silver is also trading just above the minor resistance level of 23.55, pointing towards potential further upward movement. If it surpasses this level, the next target would be the main resistance at 24.50.

The current price dynamics of silver, when considered alongside its position relative to key moving averages and resistance levels, indicate a bullish market sentiment.

Furthermore, if the upside momentum continues to increase then look for a potential breakout over the downtrending resistance line at 23.85.

Nasdaq 100, Dow Jones, S&P 500 News: Investors Shift Focus to Walmart’s Earnings, Rate Hike Pause

Nasdaq 100, Dow Jones, S&P 500 News: Investors Shift Focus to Walmart’s Earnings, Rate Hike Pause

Investor Focus Shifts to Economic Data and Retail Earnings

Following the release of key inflation reports, investors are now shifting their focus to upcoming economic data and remarks from Federal Reserve officials. Key topics such as jobless claims, industrial production, and housing market data, due on Thursday, are in the spotlight. Additionally, investors are keenly awaiting insights from Fed officials like Cleveland President Loretta Mester and New York President John Williams.

Retail Earnings: Spotlight on Walmart

The earnings reports from major retail players, particularly Walmart, are poised to capture significant attention. Walmart is expected to report earnings per share of $1.52 and revenue of $159.72 billion, according to consensus estimates. As the holiday season approaches, the market is betting on Walmart’s ability to drive sales, bolstered by its robust grocery segment and e-commerce investments.

Trading Derivatives carries a high level of risk to your capital and you should only trade with money you can afford to lose. Trading Derivatives may not be suitable for all investors, so please ensure that you fully understand the risks involved, and seek independent advice if necessary. A Product Disclosure Statement (PDS) can be obtained either from this website or on request from our offices and should be considered before entering into a transaction with us. Raw Spread accounts offer spreads from 0.0 pips with a commission charge of USD $3.50 per 100k traded. Standard account offer spreads from 1 pips with no additional commission charges. Spreads on CFD indices start at 0.4 points. The information on this site is not directed at residents in any country or jurisdiction where such distribution or use would be contrary to local law or regulation.

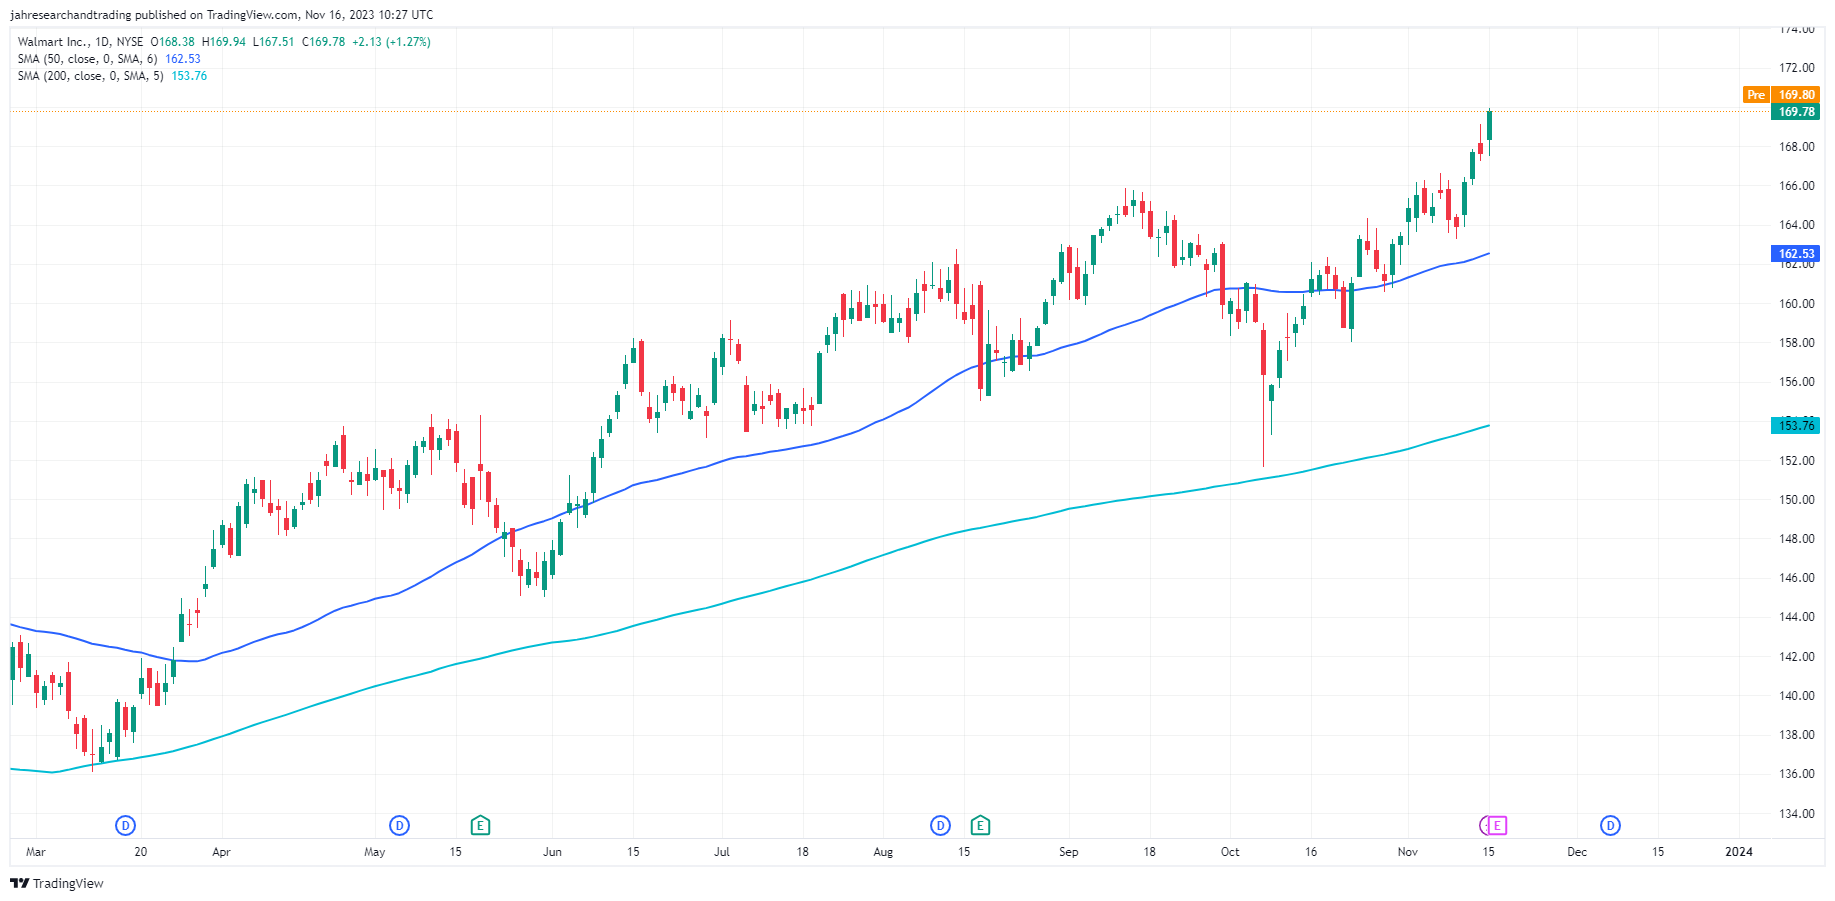
Daily Walmart

Walmart’s Stock and Market Dynamics

Walmart’s stock reached an all-time high on Monday, reflecting its strong performance and market share gains, especially against competitors like Target. The company’s focus on low prices and a mix of basic goods has contributed to its success. However, there are concerns about whether heightened expectations could impact its upcoming earnings report.

Market Outlook Amidst Retail Reports

The anticipation of Walmart’s earnings report has had a muted impact on S&P 500 futures, with minimal changes observed. This caution follows a positive response to recent inflation data, which sparked gains on Wall Street. The PPI’s significant decline and CPI’s stabilization are fueling hopes that the Federal Reserve might halt interest rate hikes, potentially benefiting the broader market.

Short-Term Forecast: Optimism in the Market

With recent inflation data suggesting a cooling trend, there’s growing optimism that the Federal Reserve may pause interest rate hikes. This sentiment, combined with a historically strong market season, suggests that the current rally could have enduring strength, offering a positive short-term outlook for the market.

Technical Analysis

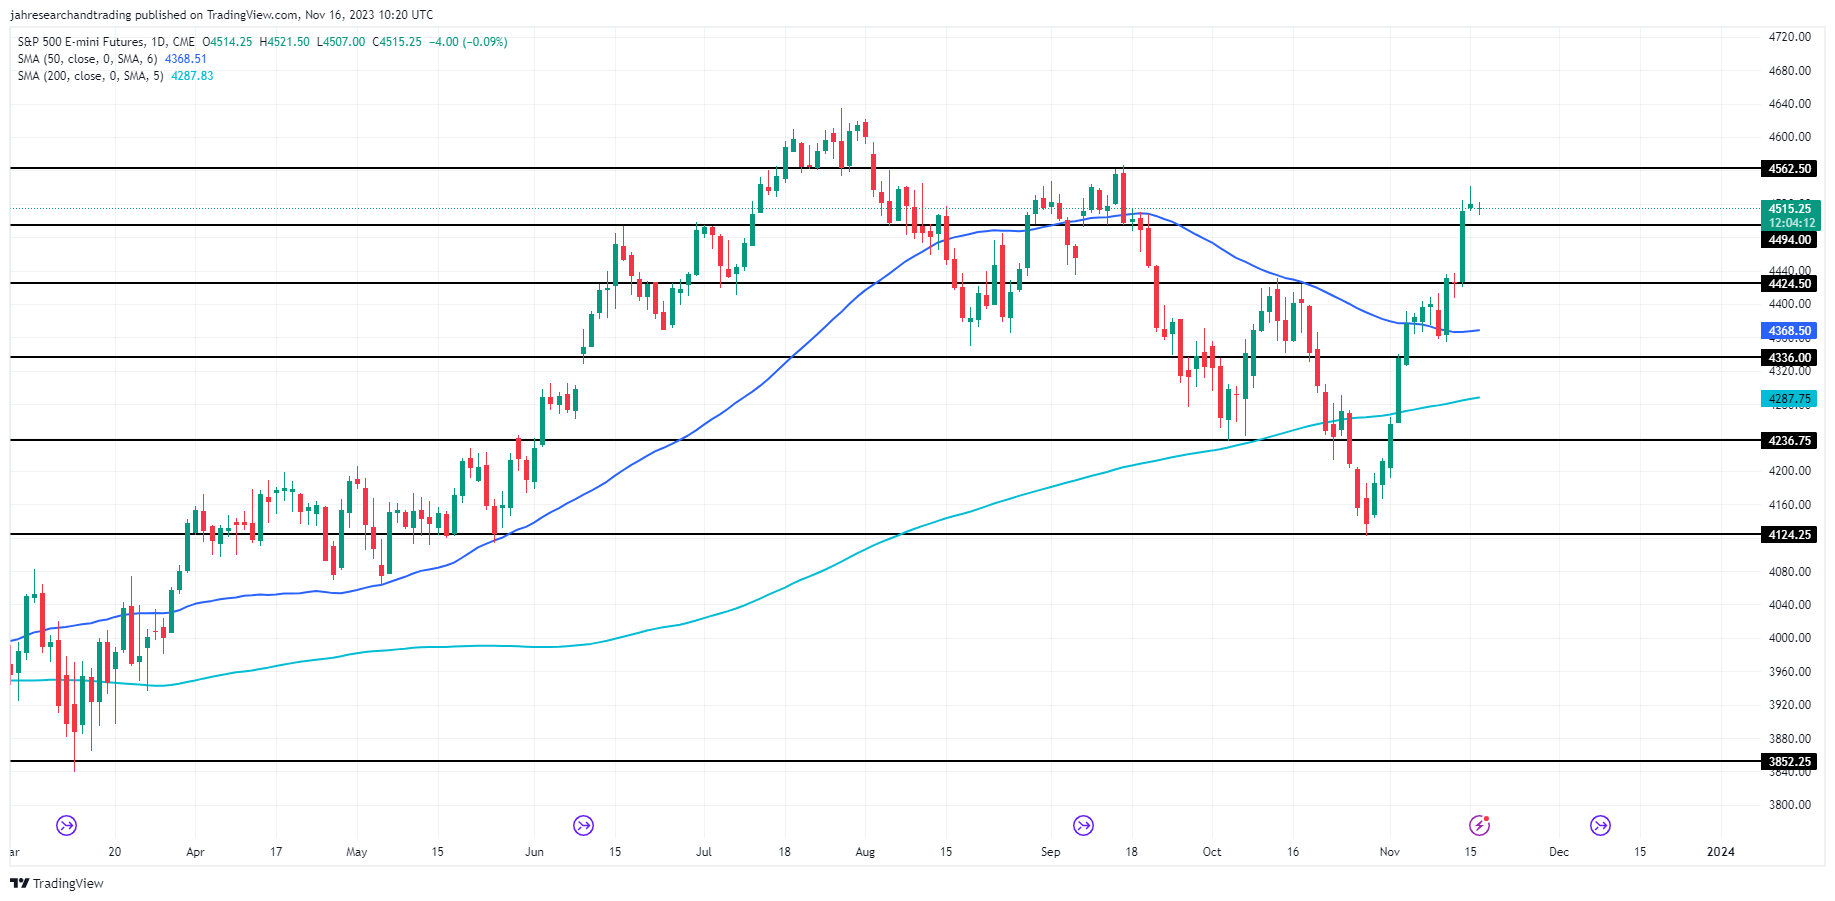
DailyE-mini S&P 500 IndexThe E-mini S&P 500 Index, with its current daily price at 4516.75, is trading above both its 200-day and 50-day moving averages, at 4287.84 and 4368.54 respectively. This positioning above key moving averages indicates a bullish trend in the medium to long term.

The index is currently situated between the minor support level of 4494.00 and the minor resistance level of 4562.50. Its proximity to the minor resistance suggests potential for upward movement, especially if it surpasses this threshold.

Overall, the index’s positioning relative to its moving averages and support-resistance levels suggests a bullish market sentiment, with room for further upside gains if the minor resistance level is breached.

Oil Prices Forecast: Rising US Supply Clashes With China’s Demand Woes

Oil Prices Forecast: Rising US Supply Clashes With China’s Demand Woes

Global Oil Market Dynamics

The international oil market is currently witnessing a complex interplay of factors. Brent and West Texas Intermediate (WTI) crude oil prices experienced a decline, driven by a mix of rising U.S. supply and concerns over China’s wavering demand. The U.S. crude production maintains a record high, while China’s oil refinery throughput shows a downtrend amidst economic challenges.

U.S. Supply and Contango Structure

U.S. crude oil stocks saw a substantial increase, far surpassing expectations. This rising supply adds pressure to oil prices, compounded by a contango market structure in WTI contracts, signaling investor anticipation of future price rises. However, technical factors, including prices falling below their 200-day moving average, suggest a bearish sentiment.

Trading Derivatives carries a high level of risk to your capital and you should only trade with money you can afford to lose. Trading Derivatives may not be suitable for all investors, so please ensure that you fully understand the risks involved, and seek independent advice if necessary. A Product Disclosure Statement (PDS) can be obtained either from this website or on request from our offices and should be considered before entering into a transaction with us. Raw Spread accounts offer spreads from 0.0 pips with a commission charge of USD $3.50 per 100k traded. Standard account offer spreads from 1 pips with no additional commission charges. Spreads on CFD indices start at 0.4 points. The information on this site is not directed at residents in any country or jurisdiction where such distribution or use would be contrary to local law or regulation.

China’s Demand Outlook

Contrasting with the U.S. supply scenario, China’s demand presents a puzzling picture. Despite forecasts by the International Energy Agency (IEA) and OPEC predicting robust demand growth in Asia, led by China, the actual crude imports tell a different story. China’s year-on-year imports have not matched these bullish forecasts, indicating a potential overestimation of demand growth.

Regional Demand Variations

While China and India show noticeable growth in oil imports, the rest of Asia displays a mixed response, with overall imports not aligning with the optimistic projections by IEA and OPEC. Europe’s demand is likely to decline, whereas modest increases are expected in North America and Africa. The Middle East shows potential for significant demand growth, but it’s uncertain how this will influence global oil prices.

Market Implications and Forecast

The global oil market currently faces a crucial question: Will demand forecasts or actual import levels be more influential in determining oil prices? As of now, Brent and WTI are trading lower, reflecting the current market uncertainty. The short-term outlook appears bearish, given the mismatch between forecasted demand and actual import figures, alongside the technical bearish indicators in the market.

Technical Analysis

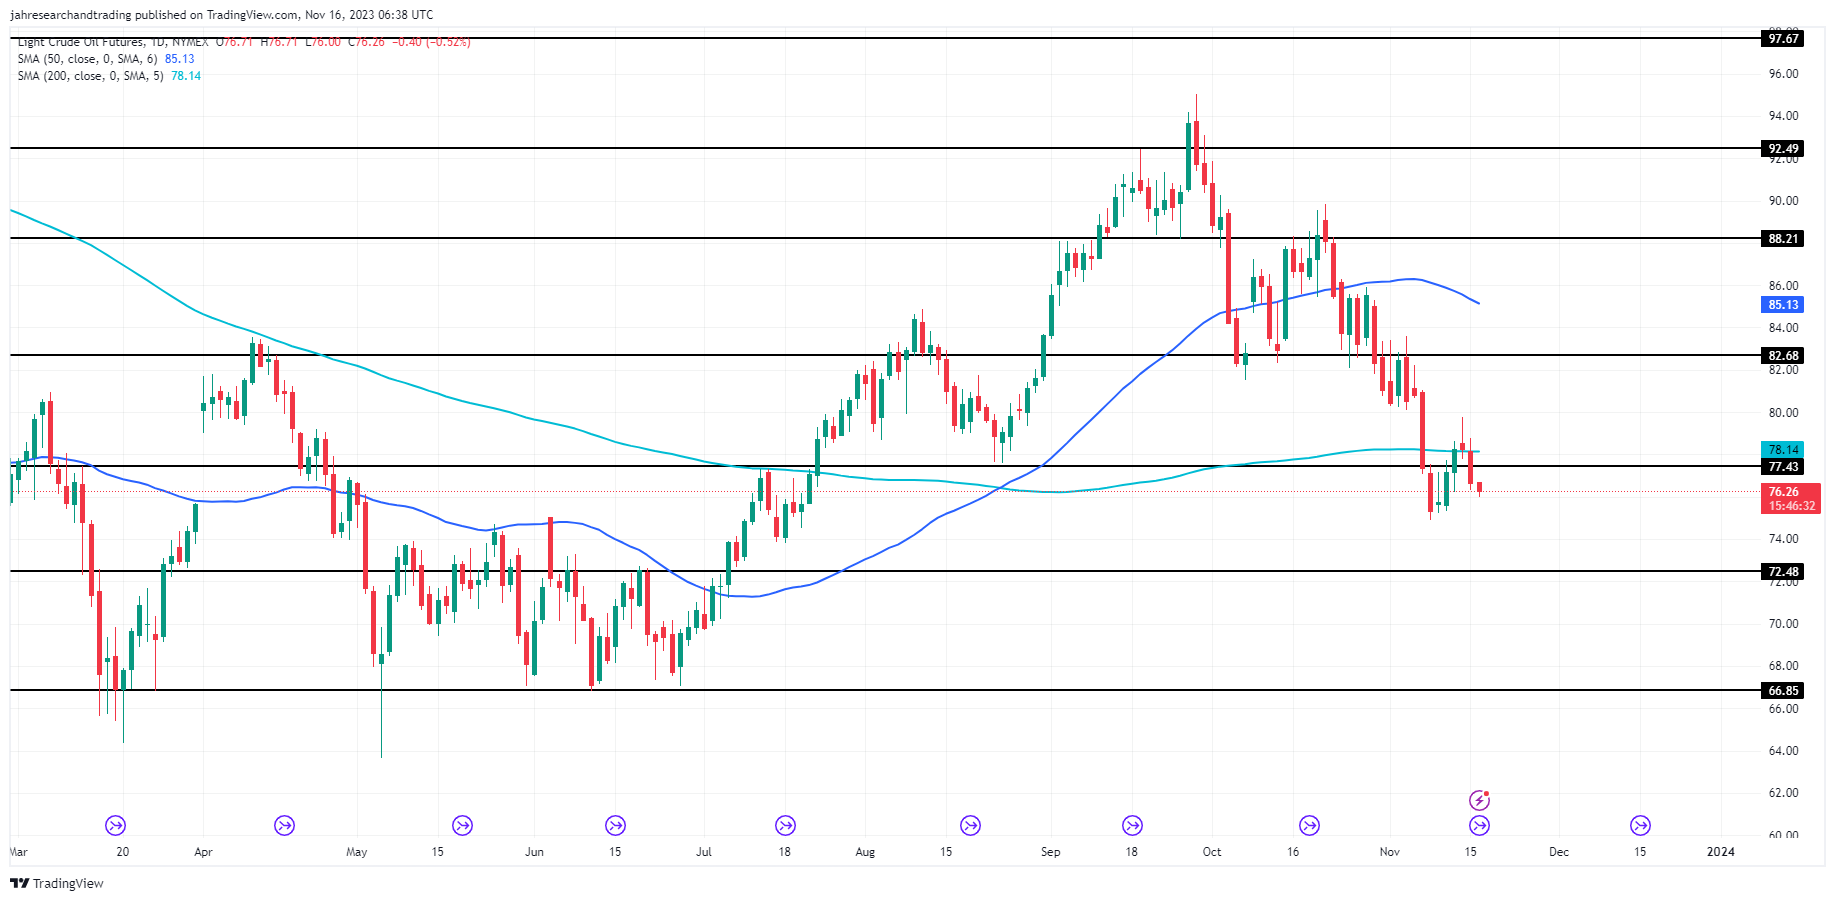
Daily Light Crude Oil FuturesThe current daily price of light crude oil futures at 76.27 is positioned between the minor support level at 72.48 and the minor resistance level at 77.43, indicating a neutral to slightly bearish sentiment in the short term.

This price is below the 200-day moving average of 78.14, suggesting a longer-term bearish trend. It is also below the 50-day moving average of 85.13, reinforcing the bearish outlook.

The proximity to the minor resistance level at 77.43 could indicate potential for upward movement if this resistance is breached.

However, the overall market sentiment leans bearish given the current price’s position relative to these key technical indicators.

Forex Trading Truth or Lie? Uncovering the Truths of FX Trading

Forex Trading Truth or Lie? Uncovering the Truths of FX Trading

Do you know the truths about forex trading?

Traders face a barrage of information when they start out in the markets – and being able to sort the wisdom from the folly could be the difference between success and failure. Should you risk 1% of your account per trade, or 5%? Does RSI work better than stochastics? And is Bitcoin really a reliable store of value? Granted, some topics will always be debatable, but with the help of our DailyFX expert analysts, we uncover the truth about forex trading, the lies, and the murky bits in between.

First, learn the truth about your own forex journey with our DNA FX Quiz, helping you discover the kind of forex trader you are.

Truth about forex trading

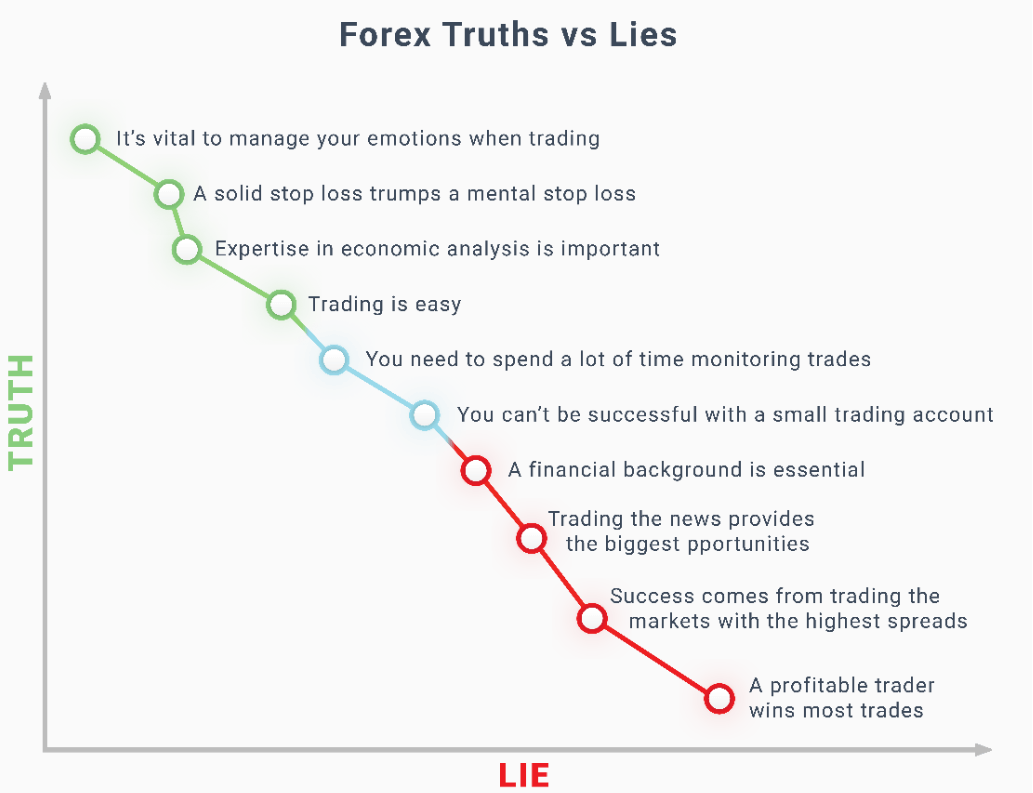
Truth or Lie: Traders Need a Financial Background

“Trading has little to do with ‘finance’ and more to do with understanding what is involved in performance-related endeavors” – Paul Robinson, Currency Strategist

A financial background can be useful for understanding how forex and other markets work. However, more beneficial are skills in math, engineering and hard sciences, which better prepare traders for analyzing and acting on economic factors and chart patterns. It doesn’t matter how much awareness you have about financial markets – if you can’t process new data quickly, methodically and in a focused manner, those same markets you thought you knew so well can eat you alive.

ANSWER: LIE

EXPERT TIP: To prepare for trading, focus on developing analytical skills rather than boning up on financial knowledge.

Truth or Lie: Trading is Easy

“Trading is definitely easy. Being profitable is where the difficulty lies” – Peter Hanks, Analyst

Trading is like running a business. In order to be successful, you need to learn from mistakes and have rules in place to help protect your capital. Like a business, it’s crucial to have appropriate strategies on hand for varying market conditions. Setting up a business is easy, and similarly, trading is easy too. Developing successful strategies and making money? That’s the hard part.

ANSWER: TRUTH

EXPERT TIP: It will seem easy if your early trades go well, but long-term profitability is a different matter altogether. Make your life easier by researching your trades, using the right position size, setting stops and keeping a handle on your emotions.

Truth or Lie: You can’t be successful with a small trading account

“A 20% return is a 20% return regardless of the account size” – Paul Robinson


Can you be successful with a small trading account? It depends on your definition of successful. An account needs to be large enough to accommodate proper risk parameters. But success is relative; a high rate of return is based on percentages and not on monetary amounts.

For example, a 20% return is a 20% return regardless of the account size. However, if your 20% return isn’t worth enough in hard cash, it might be hard to incentivize yourself to improve as a trader.

How AUD & NZD Exchange Rates Are Impacted by China’s Economy

How AUD & NZD Exchange Rates Are Impacted by China’s Economy

AUD and NZD Analysis, China Trade Relations With Australia and New Zealand, Understanding the Core-Perimeter Model -TALKING POINTS:

  • How to trade the Australian and New Zealand Dollars with regard to China’s growth
  • What are the economic and trade relations between China, Australia and New Zealand?
  • How the China, Australia & New Zealand relationship fits into Core-Perimeter model

The Australian (AUD) and New Zealand Dollars (NZD) both tend to do well when global risk appetite is elevated, and when investors feel good about prospects for global growth. However, while both can and do rise when investors are buoyant, the specific issue of China’s growth tends to be especially important. In this regard, China can be seen as the core that perimeter economies rely on as the primary source of their economic vitality.

China Takes A Lot of What Both Australia and New Zealand Are Selling

It’s easy to see why. China is the number-one export destination for goods from both Australia and New Zealand, but that’s not quite the whole story of their links to Chinese growth prospects. Australia is a key supplier of raw materials such as iron ore, coal and liquified natural gas (LNG) to China. All of these are closely linked to the Asian giant’s structural economic expansion.

Therefore, when the outlook for Chinese growth is looking bright, demand for key inputs increases, leading capital to flow from the core (China) to the perimeter (Australia). Under these conditions, the Australian Dollar has a tendency to appreciate against a basket of currencies. China takes nearly a third of all Australian exports, thereby putting the latter economy in large part at the mercy of demand from the former.

China-Australian Trade Relationship (2018)

Chart showing China-Australia TradeBut Australia is not alone. New Zealand supplies China with vast quantities of dairy products and meat, notably lamb and beef. Robust demand for these relatively expensive products is held to be indicative of China’s growing, affluent middle class. A booming Chinese economy means growth in this group’s ranks and thereby China’s overall appetite for dairy and meat, to the delight of New Zealand exporters.

China-New Zealand Trade Relationship (2018)

Chart showing China-New Zealand TradeThis brings a higher volume of capital flowing out of the core (China) and into the perimeter (New Zealand), pushing NZD higher.

If Chinese economic growth is at risk, be it from a financial meltdown, trade wars, or a pandemic like the coronavirus in 2020, capital tends to flee the perimeter economies. This is because the outsized importance of exports in those countries’ economic growth model tends to make them more sensitive to the ups and downs of the global business cycle.

AUD, NZD Index Suffer as Chinese Growth Prospects Dwindle

Chart showing AUD, NZDIn general, they are more vulnerable to external shocks than ones that rely on internal demand to power growth. Under these circumstances, NZD and AUD tend to weaken along with other growth-oriented assets as core (China) demand for exports from the perimeter (New Zealand and Australia) is anticipated to decline.

Key Takeaways on How to Trade the Australian and New Zealand Dollars

  • The Core-Perimeter model shows that when the growth outlook is positive, capital typically flows from core (China) to perimeter (New Zealand and Australia) economies
  • However, under poor economic conditions, this dynamic reverses and capital flows out of the cycle-sensitive perimeter and pressures assets affiliated with those economies (NZD and AUD)
  • Australia and New Zealand are broadly raw-material exporting economies, which makes investors’ global growth assessment as important to their direction as their own domestic data
EUR/USD Price Forecast: It’s Time for Eurozone Inflation

EUR/USD Price Forecast: It’s Time for Eurozone Inflation

EURO FUNDAMENTAL BACKDROP

The euro has been capitating off the weaker than expected US CPI earlier this week despite weakening slightly both yesterday and today. Markets are seemingly expecting the Federal Reserve to have reached its hiking cycle peak and have since ‘dovishly’ repriced expectations through to December 2024. This may be an overreaction as inflation remains sticky and after Fed Chair Jerome Powell’s recent comments to maintain elevated interest rates, the roughly 91bps of cumulative rate cuts by the end of 2024 could be amplified. US PPI did encourage further disinflation being a leading indicator but Fed officials stay cautious.

From a euro area perspective, the EU commission stated that the region will avoid a technical recession but recent economic data has shown extremely poor statistics including yesterday’s industrial production.

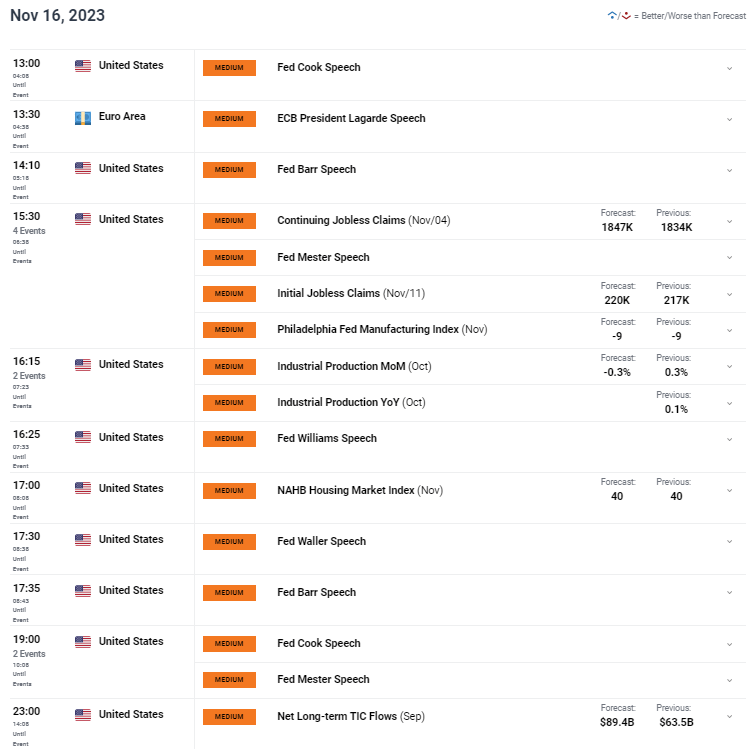
The day ahead will be dominated by central bank speakers with the European Central Bank’s (ECB) President Christine Lagarde included (see economic calendar below). It will be interesting to see how Fed speakers respond to the recent inflation and retail sales reports. Considering the US and UK have released their inflation statistics, the euro report scheduled for tomorrow could bring the euro down from recent highs if actual data fall in line with estimates.

ECONOMIC CALENDAR (GMT+02:00)

image1.png

TECHNICAL ANALYSIS

EUR/USD DAILY CHART

image2.png

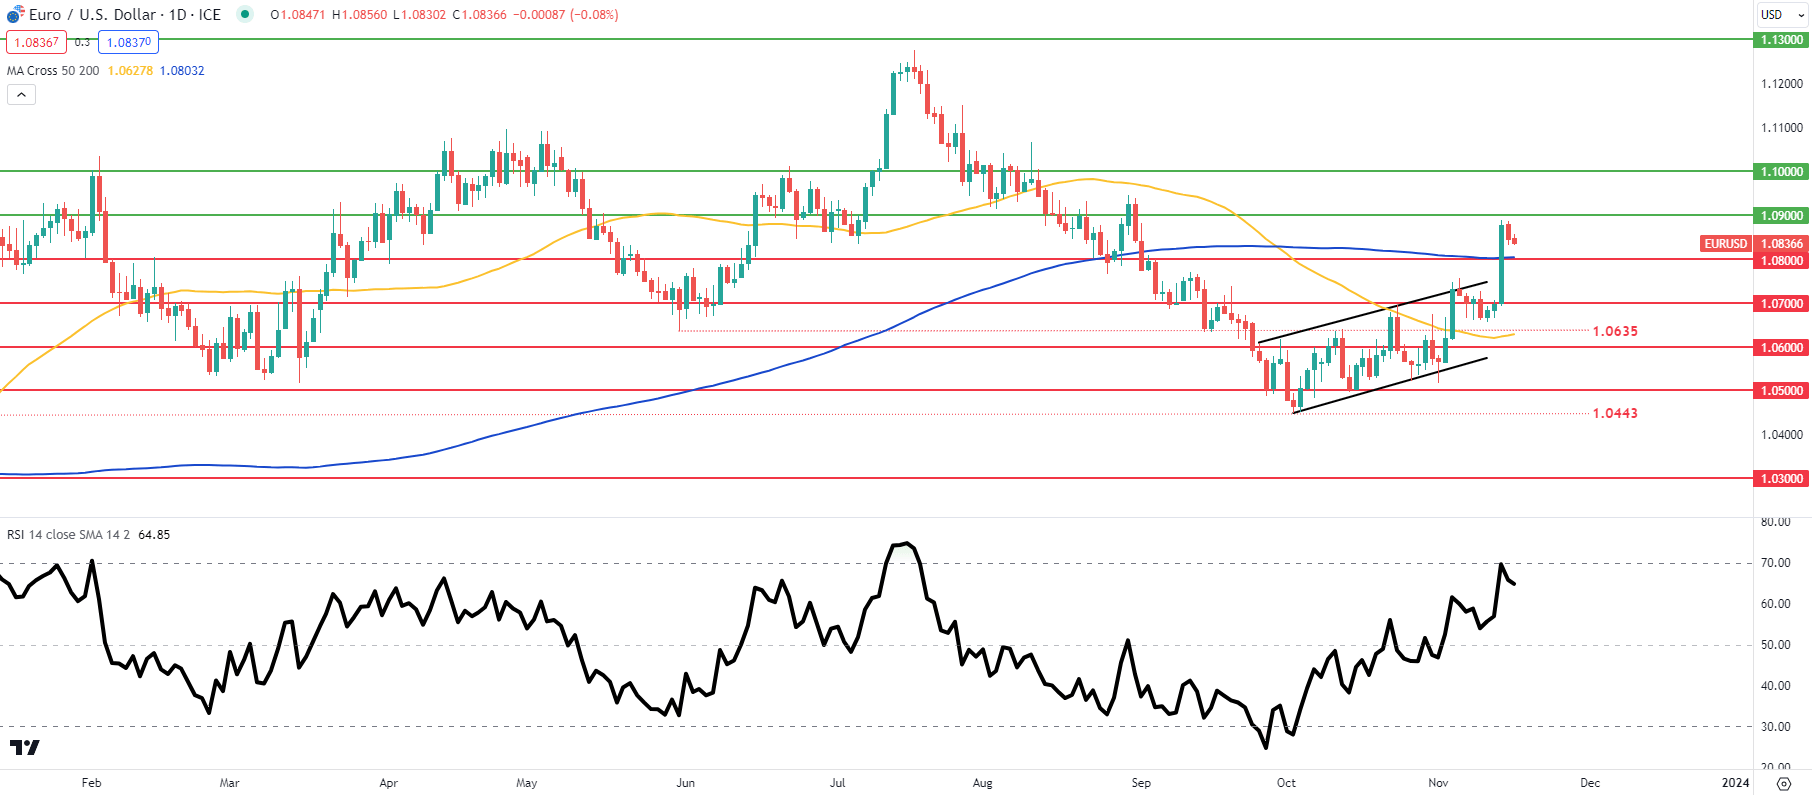
The daily EUR/USD daily chart above has been rejected around the overbought mark on the Relative Strength Index (RSI) coinciding with the 1.0900 psychological handle. A sharp decline in euro area inflation could see the pair back below the 200-day moving average (blue)/1.0800 once more.

Resistance levels:

  • 1.1000
  • 1.0900

Support levels:

  • 1.0800/200-day MA
  • 1.0700
  • 1.0635
  • 50-day MA
  • 1.0600

IG CLIENT SENTIMENT DATA: MIXED

IGCS shows retail traders are currently neither NET SHORT on EUR/USD, with 59% of traders currently holding long positions (as of this writing).

Download the latest sentiment guide (below) to see how daily and weekly positional changes affect EUR/USD sentiment and outlook.