Natural Gas Prices Forecast: Balancing Supply Surge and Rising Demand

Natural Gas Prices Forecast: Balancing Supply Surge and Rising Demand

U.S. Natural Gas Futures See Uptick Amid Varied Factors

The U.S. natural gas futures markets are closed on Thursday, but in the previous session, the market witnessed a 1% increase in futures, influenced by an unexpected withdrawal from gas storage and the anticipation of higher heating demand due to colder weather forecasts. This rise occurred despite the consistent supply to LNG export plants.

Unexpected Storage Withdrawal Signals Demand Shift

The Energy Information Administration (EIA) reported a withdrawal of 7 billion cubic feet (bcf) from storage in the week ending November 17, a contrast to the expected addition of 7 bcf. This deviation from both last year’s and the five-year average figures indicates a shift in heating demand.

Trading Derivatives carries a high level of risk to your capital and you should only trade with money you can afford to lose. Trading Derivatives may not be suitable for all investors, so please ensure that you fully understand the risks involved, and seek independent advice if necessary. A Product Disclosure Statement (PDS) can be obtained either from this website or on request from our offices and should be considered before entering into a transaction with us. Raw Spread accounts offer spreads from 0.0 pips with a commission charge of USD $3.50 per 100k traded. Standard account offer spreads from 1 pips with no additional commission charges. Spreads on CFD indices start at 0.4 points. The information on this site is not directed at residents in any country or jurisdiction where such distribution or use would be contrary to local law or regulation.

The price of front-month gas futures for December on the New York Mercantile Exchange climbed to $2.874 per mmBtu post the EIA report, rebounding from recent lows. Despite this increase, the market’s response to high production levels and ample storage suggests tempered expectations for significant winter price surges.

High Production and Storage Impact on Supply-Demand

Record-high gas production in November and sufficient storage levels are key factors in the current market scenario. Upcoming colder weather is projected to spike gas demand, including exports. The U.S. is also poised to become a leading global LNG supplier in 2023, bolstered by strong international demand.

Additionally, Freeport LNG, a U.S. liquefied natural gas company, received Federal Energy Regulatory Commission (FERC) approval to fully reactivate its Texas export plant’s Phase II infrastructure. This includes LNG Loop 2 and Dock 2 for ship loading, after being shut down for about eight months following a fire in June 2022.

The plant’s return to full operation will increase LNG supply to global markets, particularly ahead of winter’s high demand in the Northern Hemisphere. This approval follows Freeport’s satisfactory address of the incident’s root causes and progression of cool down activities. The plant’s full capacity allows processing approximately 2.1 billion cubic feet per day of gas into LNG.

Market Outlook: Cautiously Bullish Amid Ample Supply

Given the high production and robust storage, coupled with rising demand prospects, the short-term outlook for the U.S. natural gas market leans towards a cautiously bullish sentiment. The current supply and expected demand surge, especially for U.S. LNG exports, underpin this perspective.

Nasdaq 100, Dow Jones, S&P 500 News: Robust Markets Face Global Economic Headwinds

Nasdaq 100, Dow Jones, S&P 500 News: Robust Markets Face Global Economic Headwinds

Renewed Market Confidence Amidst Economic Indicators

U.S. stocks have recently seen an upswing, spurred by optimism around the Federal Reserve’s potential pause in interest rate hikes and robust economic indicators.

This positive sentiment was reflected in the market’s performance on Wednesday, with advancing issues outnumbering decliners. The S&P 500 demonstrated strength by posting 45 new 52-week highs, although there was one new low. The Nasdaq Composite also showed a mix of dynamics, with 89 new highs against 104 new lows.

Trading Derivatives carries a high level of risk to your capital and you should only trade with money you can afford to lose. Trading Derivatives may not be suitable for all investors, so please ensure that you fully understand the risks involved, and seek independent advice if necessary. A Product Disclosure Statement (PDS) can be obtained either from this website or on request from our offices and should be considered before entering into a transaction with us. Raw Spread accounts offer spreads from 0.0 pips with a commission charge of USD $3.50 per 100k traded. Standard account offer spreads from 1 pips with no additional commission charges. Spreads on CFD indices start at 0.4 points. The information on this site is not directed at residents in any country or jurisdiction where such distribution or use would be contrary to local law or regulation.


Resilient Rally Despite Economic Uncertainties

Since late October, there has been a notable rally in U.S. stocks, particularly in the S&P 500 and Nasdaq. This trend suggests investor confidence that the Fed may be nearing the end of its tightening cycle, bolstered by signs of cooling inflation and a strong earnings season.

Yet, major money managers perceive this rise as a temporary year-end rebound rather than a fundamental shift, with concerns about upcoming fiscal policies, the 2024 presidential election, and looming recession fears.

The performance of significant technology stocks, especially the influential ‘Magnificent Seven’, has played a vital role in market movements. These stocks have benefited from the recent drop in yields and the excitement around AI.

However, as yields begin to stabilize, the future success of these tech giants will increasingly depend on their ability to leverage AI effectively. This cautious perspective is mirrored in predictions for only a modest increase in the S&P 500 next year amid apprehensions of economic deceleration.

Global Economic Slowdown and Strategic Investment Approach

Looking ahead to 2024, a slowdown in the global economy is anticipated, driven by higher interest rates, increased energy prices, and moderated growth in the U.S. and China. Despite these challenges, economists largely forecast avoiding a recession. Nevertheless, the impact of the Fed’s aggressive monetary policies and the potential volatility from the U.S. presidential election warrant a flexible and responsive investment strategy in navigating the evolving market landscape.

Technical Analysis


Daily E-mini S&P 500 Index

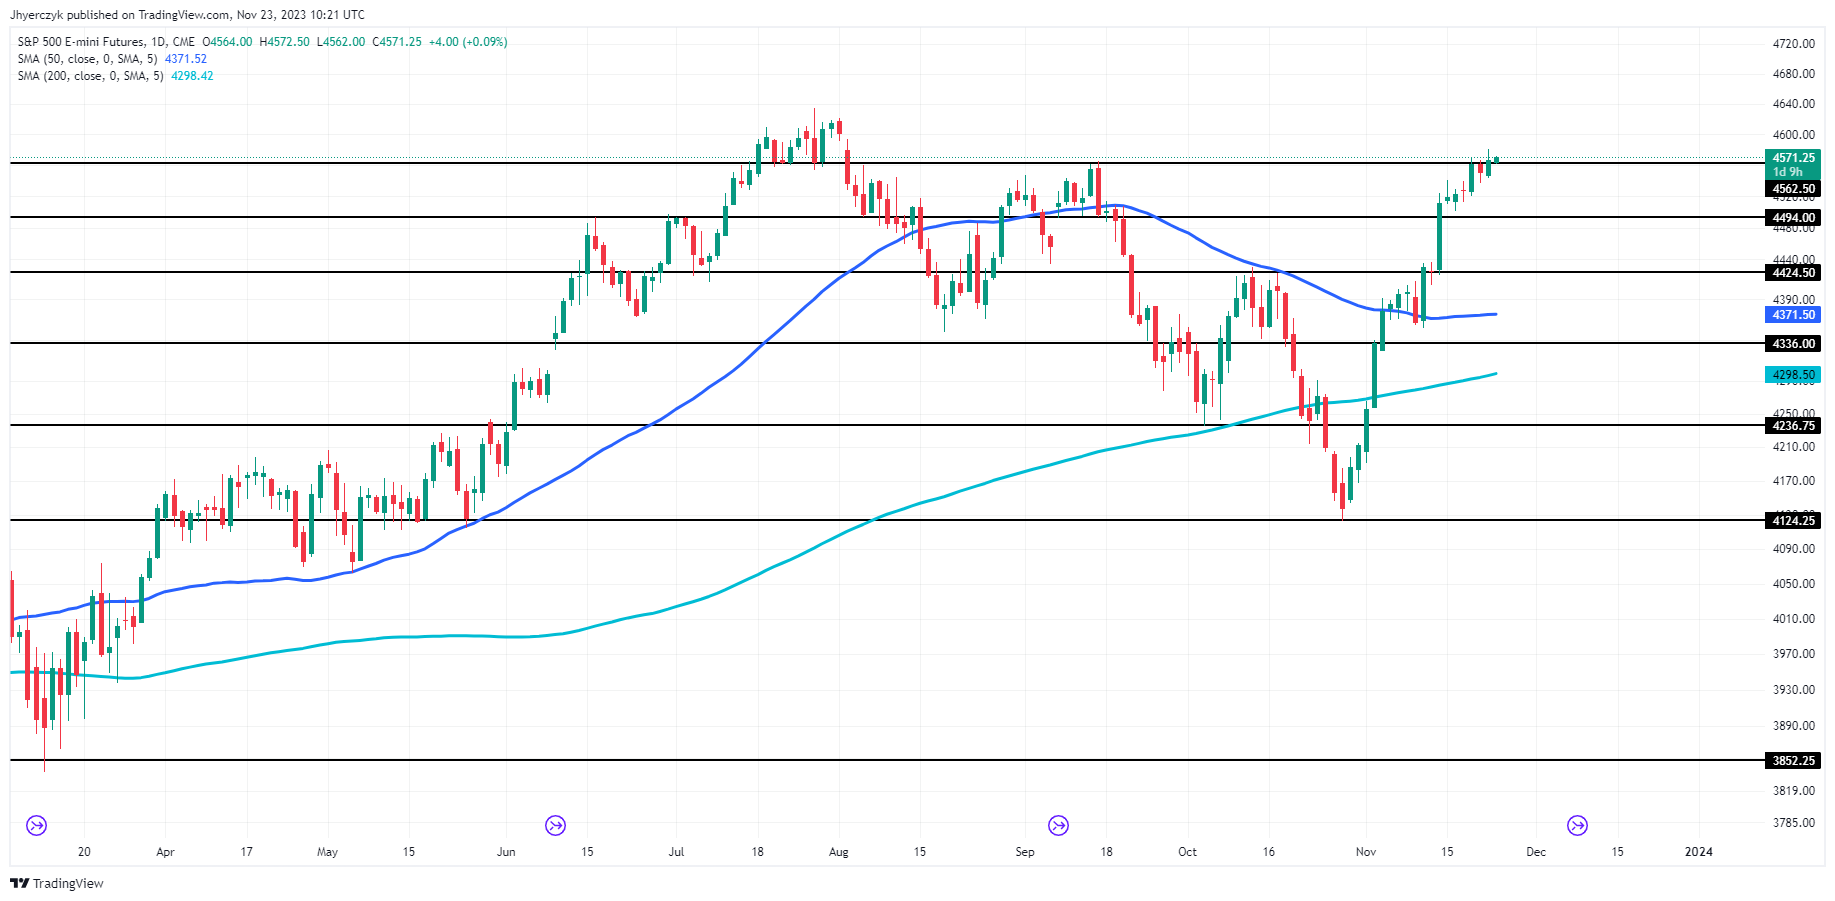
The E-mini S&P 500 Index, currently priced at 4571.25, is trading above its 200-day moving average of 4032.08, indicating a long-term upward trend. This positioning also surpasses the 50-day moving average of 4371.52, reinforcing a bullish sentiment in the shorter term.

The index is positioned just above the minor support level at 4562.50, suggesting that this level could now act as a pivot point for daily trading. If the index holds above this support, it could signal continued bullish momentum. However, a break below this support might indicate a shift towards a bearish outlook.

Overall, the current pricing relative to these key moving averages and support level leans towards a bullish market sentiment for the E-mini S&P 500 Index.

Germany’s PMI Reveals Gradual Economic Recovery Amid Challenges

Germany’s PMI Reveals Gradual Economic Recovery Amid Challenges

German Economy Shows Signs of Resilience Amid Challenges

Germany’s economic downturn showed signs of easing in November, with the HCOB Flash Germany Composite PMI Output Index reaching a four-month high of 47.1. This slight improvement in business activity, however, still indicates a contraction phase, as the index remains below the neutral 50 mark.

Manufacturing and Services Sector Analysis

The manufacturing sector’s PMI Output Index climbed to a six-month high of 44.0, signaling a deceleration in the rate of contraction, while the Flash Germany Manufactoring PMI reached 42.3, also a 6-month high.

Trading Derivatives carries a high level of risk to your capital and you should only trade with money you can afford to lose. Trading Derivatives may not be suitable for all investors, so please ensure that you fully understand the risks involved, and seek independent advice if necessary. A Product Disclosure Statement (PDS) can be obtained either from this website or on request from our offices and should be considered before entering into a transaction with us. Raw Spread accounts offer spreads from 0.0 pips with a commission charge of USD $3.50 per 100k traded. Standard account offer spreads from 1 pips with no additional commission charges. Spreads on CFD indices start at 0.4 points. The information on this site is not directed at residents in any country or jurisdiction where such distribution or use would be contrary to local law or regulation.

Similarly, the Services PMI Business Activity Index rose to 48.7, a modest decline but an improvement from October’s figures. This suggests a milder downturn in service activities and a possible stabilization in the manufacturing sector.

Despite the positive signs, demand for goods and services continued to decline, driven by market uncertainty and financial conditions. New work inflows decreased for the seventh consecutive month, albeit at a slower rate. Employment trends were mixed, with job losses in manufacturing accelerating, while the service sector saw stable staffing levels.

Inflation and Price Pressures

Inflationary pressures persisted, particularly in the service sector, where input costs rose sharply. This led to a faster increase in average charges for goods and services, indicating continued inflationary trends despite overall economic contraction.

Outlook and Expert Commentary

Dr. Cyrus de la Rubia, Chief Economist at Hamburg Commercial Bank, expressed cautious optimism, noting a potential return to growth by the first half of the upcoming year. He highlighted the milder trajectory of the service sector slowdown and a reduction in manufacturing’s decline in new orders. However, he cautioned that inflation remains a challenge, particularly with rising wages and service sector output prices. This outlook suggests a mixed but improving picture for the German economy, with potential growth on the horizon but continued challenges from inflation.

Black Friday & the Stock Market: Economy, Consumers & Shares

Black Friday & the Stock Market: Economy, Consumers & Shares

What is Black Friday?

Black Friday was originally the term used to describe the stock market collapse of 1869, when American investors Jay Gould and James Fisk caused a financial meltdown after a failed attempt to corner the gold market.

The modern concept of Black Friday, however, came about in the 1940s to entice people to the stores the day after Thanksgiving. Named for its tendency to contribute to traffic accidents, Black Friday later took on a new meaning as companies expected to make enough sales to put them ‘in the black’, or profitable, for the year.

It was not until the 1980s, however, that retailers began to slowly use the day as a marketing tool, culminating in its widely-held status as the most popular shopping day of the year in the 2000s. Today, Black Friday is more than just a US-based tradition; it has spread to some 20 other countries, including Mexico, Russia and Pakistan.

In conjunction with Cyber Monday, the Monday after Thanksgiving that pushes online sales, the shopping period is seen by some analysts and market commentators as providing a measure of economic prosperity. That measure can then be used to predict the performance of other assets such as stocks.

The influence of Black Friday

Marketing gimmick or useful indicator; what’s the overall influence of Black Friday? To answer, it’s worth examining its effect on retail spending and consumers, the economy, and the resulting effect (if any) on traders and stocks.

1) Retail spending and consumers

There is no doubt that Black Friday influences consumers to spend. Across a range of countries, the event is promoted as a rare chance to save money across a gamut of products, from laptops to lawnmowers, and historical media coverage of the event has featured stampedes in retail outlets as bargain-hungry punters battle for deals. In 2018, Adobe Analytics data shows $6.22 bn was spent online in the US, representing a 23.6% increase on the previous year. Furthermore, every Black Friday bar one has seen higher retail sales volume than any other date.

2) Economy

Black Friday’s influence on the economy is more debatable. Some argue in favor of the Keynesian effect of spending driving economic activity, which puts more money into circulation and potentially buoys the economy. At a time when the US economy has shown signs of recession, consumer spending might be welcomed. But others say that the influence of the event is negligible, with only short-term effects observed. This is due in part to lessons from previous years, when many retailers have seen poor sales figures once the discounting has ended.

However, if stores decide to go another route and prolong discounts, profit margins can be eroded, potentially meaning staff cuts and increased unemployment. Knock-on economic effects of this could include decreased income tax receipts and a raised welfare burden, factors which raise an argument for Black Friday having a net negative economic effect.

3) Stocks/stock markets

The influence of Black Friday on stock markets and individual stocks is also less than straightforward. Perhaps predictably, a range of retail stocks can be expected to rise if sales expectations are met. Conversely, unexpectedly weak sales can suggest poor consumer confidence and a fragile underlying economy, giving traders reason to go short. But even if a given company has enjoyed strong sales, this performance has no bearing on its profitability or overall financial health, which are factors traders should consider when picking one stock over another.

Examining the impact of previous Black Fridays on financial markets gives an insight into the trends traders might expect to see following this key date in the future.

Black Friday and Stock Market History

While Black Friday history begins with the catastrophic 1869 stock market crash, the modern iteration of Black Friday has seen retail stocks making strong returns around the Black Friday period. This can be observed in the S&P 500 where, in a ten-year timeframe, Bloomberg data shows a 5% return for retail stocks compared to an average 3% over a period of one week before Black Friday to one week after.

The Black Friday periods 2014-2018 are circled on the S&P 500 chart below. However, while such data suggests that retail stocks perform well over this period, stock pickers should be aware of the nuances between retail sub-sectors as well as the likelihood of online sales taking business from more brick-and-mortar reliant stocks, as well as additional fundamental factors that can move the market.

Black Friday impact on stock market performance

Black Friday retail stock performance: A snapshot

When measuring Black Friday retail stock performance, here’s an insight into how 15 major global retail stocks did in 2018 over the period one week before to one week after Black Friday:

Closing stock price: Nov 16 2018 ($) Closing stock price: Nov 30 2018 ($) Percentage increase/decrease
Amazon 1,502.06 1,690.17 +11
Apple 193.53 178.58 -8
Best Buy 66.43 64.59 -3
Burlington Stores 161.75 165.76 +2
Costco 231.02 231.28 +0
CVS 79.33 80.20 +0
H&M 3.49 3.63 +4
Home Depot 177.02 180.32 +2
Lowe’s 93.25 94.37 +1
Sainsbury’s 15.90 15.60 -2
Target 79.68 70.96 -12
Tesco 7.82 7.51 -4
TJX 51.49 48.85 -5
Walgreens 82.52 84.67 +3
Walmart 97.69 97.65 -0

Amazon reaped the rewards in 2018, enjoying its biggest shopping day in history on Cyber Monday. Customers ordered more than 18 million toys and 13 million fashion items on Black Friday and Cyber Monday combined, according to Bloomberg data, and saw its share price rise to the tune of 11% over the two-week period from November 16 to November 30, as the table shows.

On the short side, while Target shares saw a dip of 12% over the same period, the fall can probably be attributed more to a wider fall in the stock market caused by trade wars and concerns about global growth than any other factors. This underlines the importance of traders considering a range of fundamental reasons that can contribute to moves during the holiday season.

Key considerations when trading stocks on Black Friday

Once traders have assessed the market and gained a feel for the retailers taking a lead in Black Friday sales, there are a variety of other considerations to make when trading stocks around this period.

  1. Stock market liquidity: Trading around the holidays can seriously distort liquidity and Black Friday is no exception. With fewer traders on the desk, liquidity dries up and the potential for larger swings can increase – especially as stop losses are triggered automatically and positions are ditched.
  2. Fundamental factors: These may give clues as to how consumer spending may go, allowing traders to consider certain retail stocks. For example, lower gasoline prices and strong employment figures could signal more spending power and company sales expectations being met. However, as mentioned above, it’s important to be aware of a whole range of other factors that can impact the market and overshadow any moves caused by consumer sentiment.
  3. Online vs brick and mortar sales: Brick and mortar retailers have lost ground to their online competitors in recent years and Cyber Monday threatens to take the crown in terms of total sales. To capitalize on this, it may be worth keeping an eye on stocks like Amazon and Best Buy which offer attractive online shopping deals around the holidays.
  4. Earnings usually aren’t released until January: Traders should also be mindful that company performance may not be entirely clear until earnings, which for many companies will be released in January.

What time does the stock market close on black Friday?

The stock market open on Black Friday is 9:30 ET as normal, but the market closes at 1pm. The market is closed for the whole of Thanksgiving.

Gold Prices Forecast: XAU/USD Path Influenced by Dollar, Yields

Gold Prices Forecast: XAU/USD Path Influenced by Dollar, Yields

Early Dip Despite Dollar Weakness

Gold prices (XAU/USD) are currently experiencing a slight dip, despite a weakening U.S. Dollar. As of 07:25 GMT, gold trades at $1980.58, a marginal decrease of 0.01%. December Comex Gold futures also show a downtrend at $1982.90, down by 0.09%. This movement is primarily influenced by marginally higher U.S. Treasury yields.

Federal Reserve’s Rate Hike Campaign

The gold market is reacting to the broader economic landscape, particularly the U.S. Federal Reserve’s rate hike campaign. Recent economic data, indicating a slowing U.S. jobs market and lower-than-expected inflation, have led to speculation that the Fed might pause its rate increases.

Trading Derivatives carries a high level of risk to your capital and you should only trade with money you can afford to lose. Trading Derivatives may not be suitable for all investors, so please ensure that you fully understand the risks involved, and seek independent advice if necessary. A Product Disclosure Statement (PDS) can be obtained either from this website or on request from our offices and should be considered before entering into a transaction with us. Raw Spread accounts offer spreads from 0.0 pips with a commission charge of USD $3.50 per 100k traded. Standard account offer spreads from 1 pips with no additional commission charges. Spreads on CFD indices start at 0.4 points. The information on this site is not directed at residents in any country or jurisdiction where such distribution or use would be contrary to local law or regulation.

The dollar’s decline to a two-month low further supports this view, with market anticipations shifting towards potential rate cuts. The CME FedWatch tool indicates a 30% likelihood of rate reductions starting as early as March.

Upcoming FOMC Minutes and Market Sentiment

The forthcoming release of minutes from the Federal Reserve’s latest meeting is keenly awaited. These minutes are expected to provide insights into the Fed’s decision-making and could potentially signal a shift towards more dovish policies. This shift, often referred to as the ‘Fed pivot,’ might favor softer U.S. Treasury yields and a weaker dollar, which could bolster gold prices and other risk assets.

Gold’s Outlook Amid Economic Indicators

Despite these developments, there’s a notable divergence between gold prices and real yields. To surpass the $2,000 per ounce mark, gold may require significantly weaker economic data. This is evident from recent trends in the job market and consumer inflation reports, which rekindled hopes of the Fed easing monetary conditions sooner than anticipated.

Investor Focus and SPDR Gold Trust Holdings

Investors are now focusing on the Fed’s minutes for further clarity on the interest rate trajectory. Meanwhile, holdings in the SPDR Gold Trust, the largest gold-backed ETF, rose by 1.49% to 883.43 tonnes, indicating sustained investor interest in gold amid these changing economic conditions.

Short-Term Forecast for Gold Prices

In the short term, gold prices are likely to remain sensitive to shifts in U.S. monetary policy and economic indicators. Given the recent dovish signals from the Federal Reserve and the downward pressure on the U.S. dollar, there’s potential for a modest uptick in gold prices.

However, the extent of this increase may be tempered by the current market divergence between gold prices and real yields. Should the upcoming Federal Reserve minutes confirm a shift towards a more accommodative monetary policy, we could see further support for gold prices.

Overall, the short-term outlook for gold appears cautiously optimistic, with a likelihood of gradual gains, especially if the U.S. economic data continues to signal a slowdown.

Technical Analysis

Daily Gold (XAU/USD)In the gold (XAU/USD) market, the current daily price of 1979.81 is hovering near the minor resistance level of 1987.00, suggesting a potential challenge in breaking through this threshold.

This price is above both the 200-day and 50-day moving averages, set at 1937.71 and 1928.63 respectively, indicating a general bullish trend in the medium to long-term.

However, the proximity to the main resistance at 2009.00 could limit upward movement. The support levels at 1952.21 (minor) and 1930.64 (main) provide downside protection, suggesting that the price is currently in a consolidation phase within these bounds.

The overall market sentiment leans towards bullish, but with caution, as the current price is in a delicate balance near critical resistance levels.

Crypto News: Elon Musk, SpaceX, and DOGE in Focus Pre-December Moon Flight

Crypto News: Elon Musk, SpaceX, and DOGE in Focus Pre-December Moon Flight

BTC-Spot ETF Trail Goes Cold

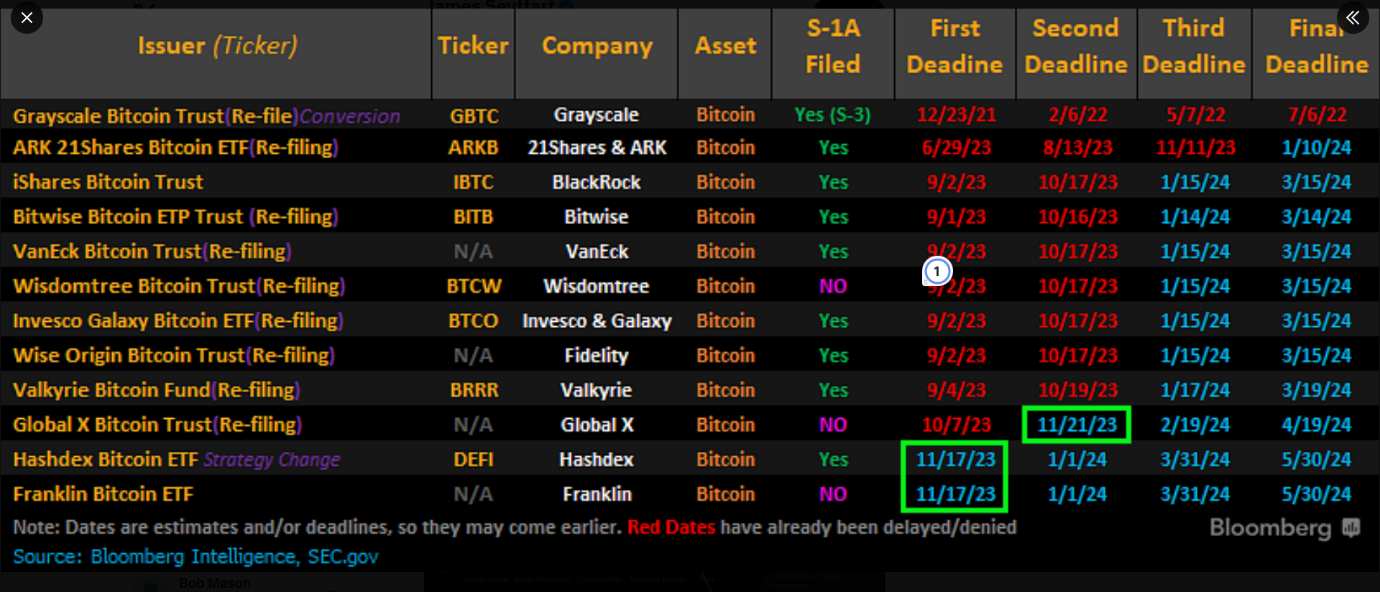
Bitcoin (BTC) rallied 1.91% on Sunday, ending the week up 0.68% to $37,386. Dip buyers returned as investors moved on from the approval window for the SEC to approve 12 BTC-spot ETFs.

The SEC announced delays to the application reviews for the Franklin and the GlobalX BTC-spot ETFs, testing buyer demand. Notably, the ETF community expected the SEC to push back the reviews. The consensus is the SEC wants to avoid the crypto market accusing the SEC of playing kingmaker. Approving the applications in one batch would avoid such a scenario.

Trading Derivatives carries a high level of risk to your capital and you should only trade with money you can afford to lose. Trading Derivatives may not be suitable for all investors, so please ensure that you fully understand the risks involved, and seek independent advice if necessary. A Product Disclosure Statement (PDS) can be obtained either from this website or on request from our offices and should be considered before entering into a transaction with us. Raw Spread accounts offer spreads from 0.0 pips with a commission charge of USD $3.50 per 100k traded. Standard account offer spreads from 1 pips with no additional commission charges. Spreads on CFD indices start at 0.4 points. The information on this site is not directed at residents in any country or jurisdiction where such distribution or use would be contrary to local law or regulation.

In the meantime, the SEC’s Trading and Markets discussed ‘cash creates’ and in-kind structures with BTC-spot ETF applicants.

Discussion and agreement on the final structure are unlikely to cause a delay. Bloomberg Intelligence ETF Analyst Eric Balchunas expects the process to take two weeks.


A screen shot of a computer Description automatically generated

Dogecoin (DOGE) Got Musked

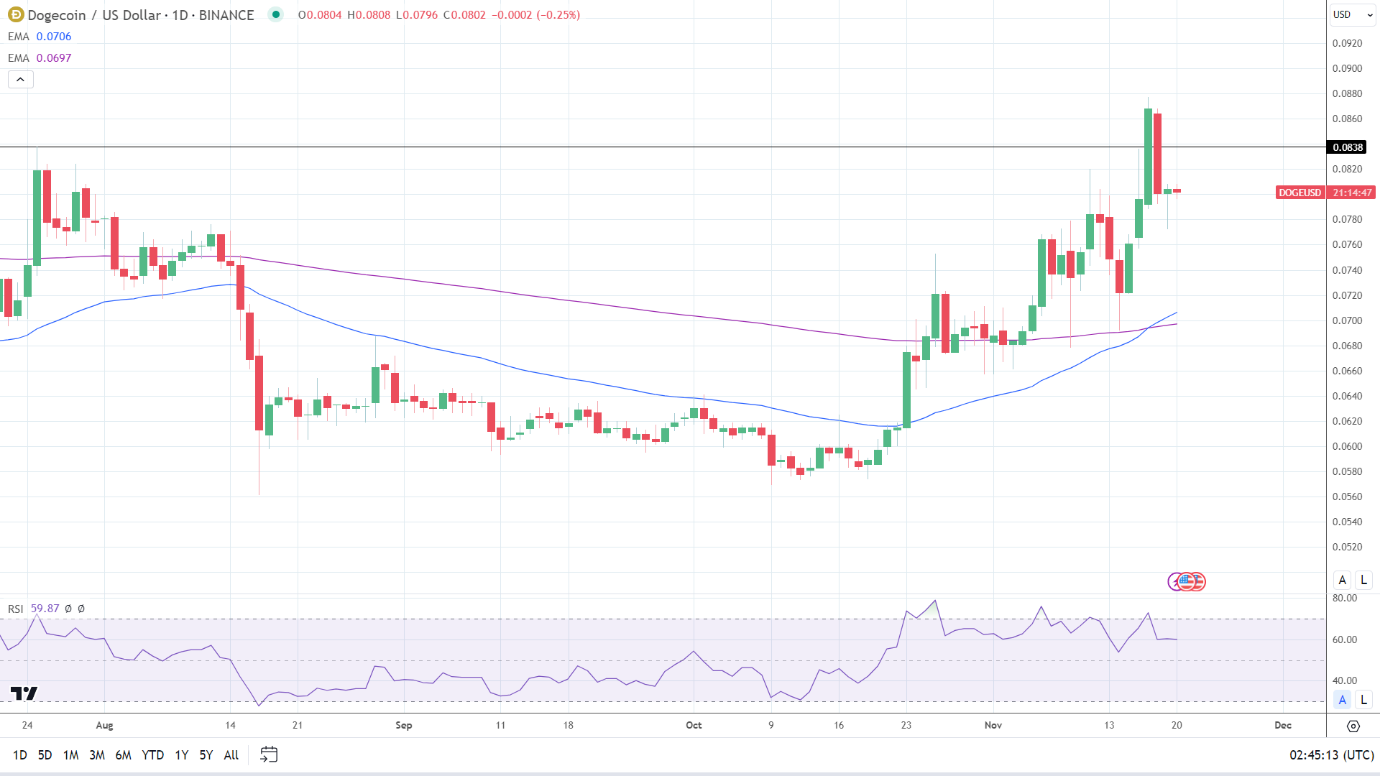
Dogecoin (DOGE) tumbled 7.71% on Saturday before a 0.37% gain on Sunday. Despite the Saturday sell-off, DOGE ended the week up 3.34% to $0.0804.

On Saturday, investors reacted to news of SpaceX losing its Starship spacecraft while on a test flight. The spacecraft made it through hot staging before the early trigger of the automated flight termination system. The SpaceX team announced the loss of data at T + 00:11:00.

Utility has been the key to the success of DOGE and its ascent to become a bonafide top 10 crypto by market cap. Elon Musk has been instrumental in the rise of DOGE. SpaceX began accepting DOGE for payments in 2022 after Tesla (TLSA) allowed DOGE payments for merch on January 14, 2022.

News of DOGE traveling to the Moon kickstarted a breakout week for DOGE. Despite SpaceX spacecraft loss, DOGE will travel on Peregrine Mission 1 to the Moon in December 2023.

On Monday, November 20, DOGE was down 0.25% to $0.0802.

DOGE steadies ahead of the December Moon mission.
Technical Analysis

Bitcoin Analysis

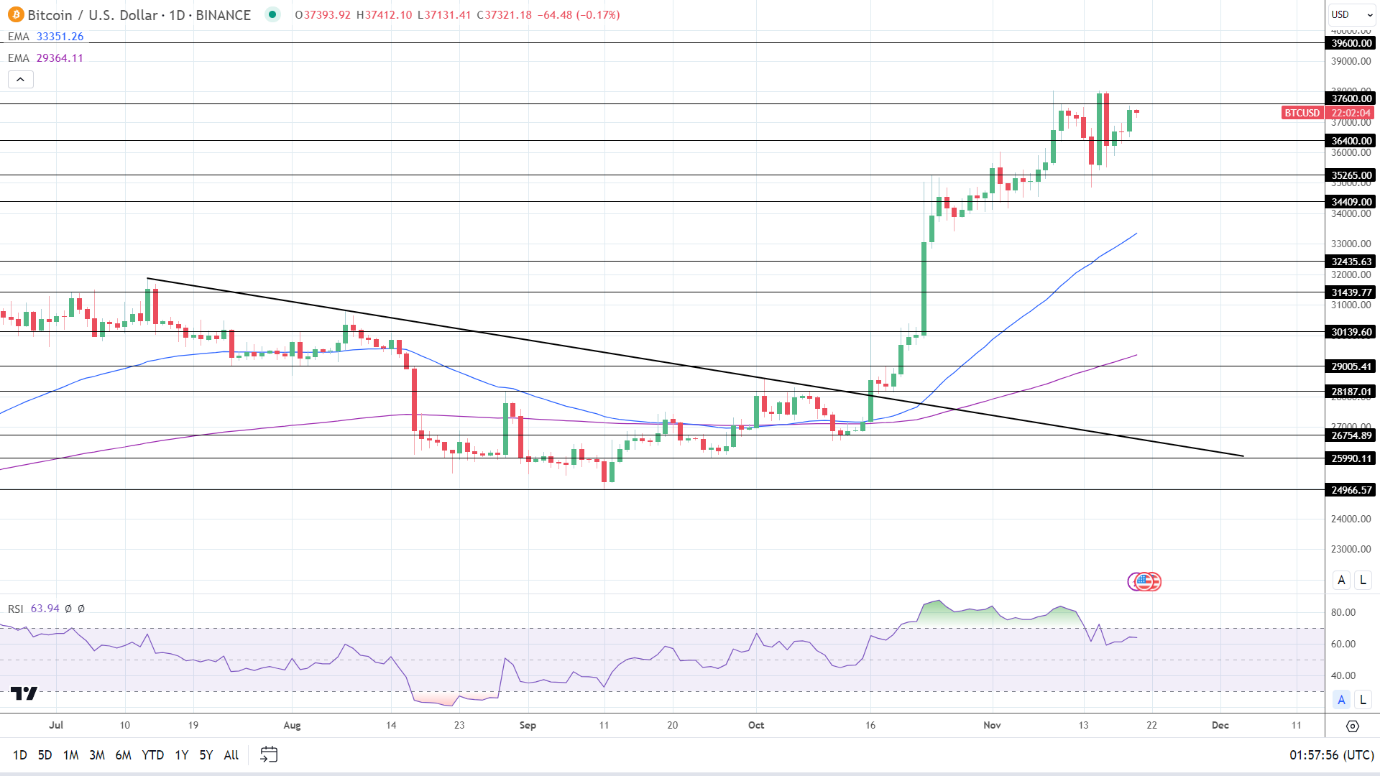
BTC held above the 50-day and 200-day EMAs, affirming bullish price signals.

A BTC break above the $37,600 resistance level would support a move to the November 9 high of $38,029.

Crypto-spot ETF-related news remains the focal point for the crypto market.

A drop below the $37,000 handle would bring the $36,400 support level into play.

The 14-Daily RSI reading of 63.92 indicates a BTC move to the November high of $38,029 before entering overbought territory.

BTC Daily Chart sends bullish price signals.
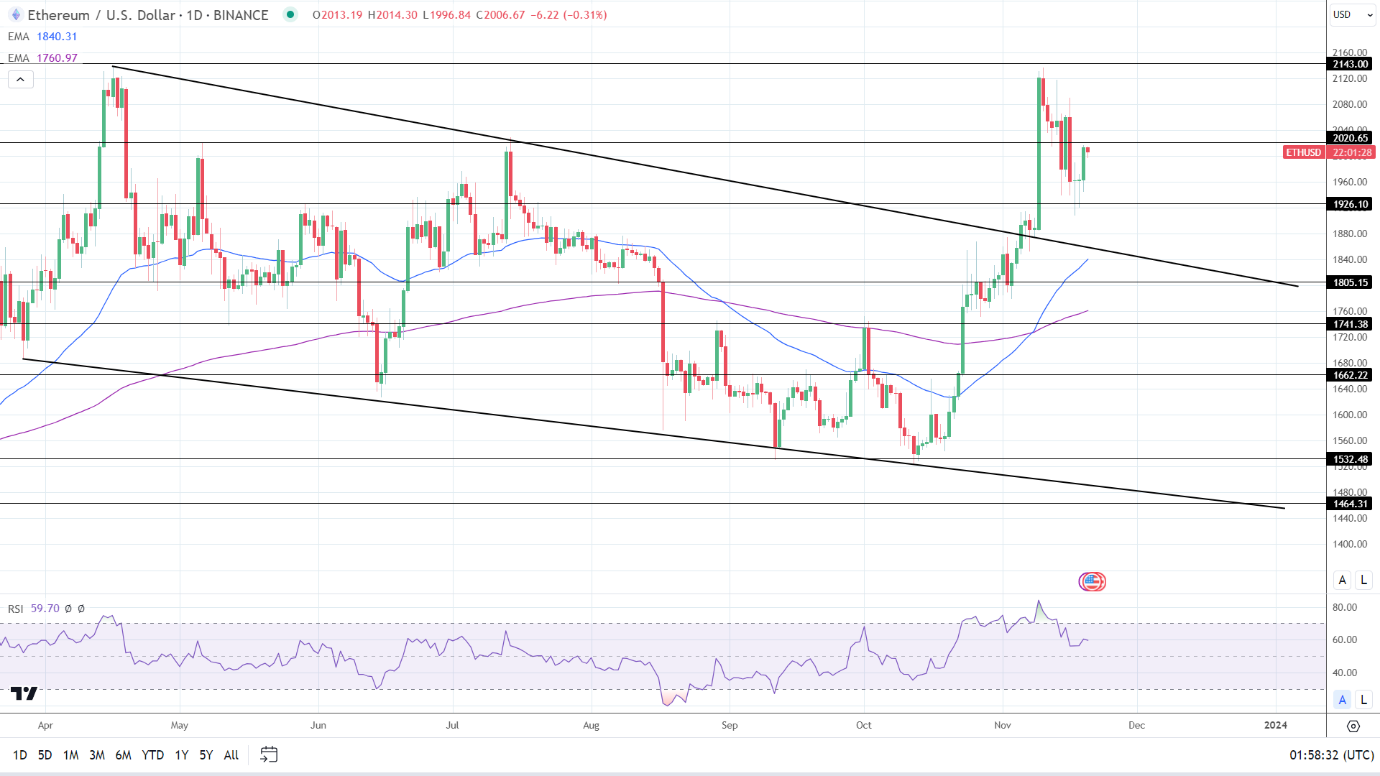
Ethereum AnalysisETH remained above the 50-day and 200-day EMAs, affirming bullish price signals.

An ETH break above the $2,021 resistance level would support a move toward the $2,143 resistance level.

However, a drop below $2,000 would support a fall to the $1,926 support level.

The 14-period Daily RSI at 59.70 suggests an ETH move to the $2,143 resistance level before entering overbought territory.

ETH Daily Chart sends bullish price signals.
DAX Index: German Producer Prices and ECB Chief Economist Philip Lane in Focus

DAX Index: German Producer Prices and ECB Chief Economist Philip Lane in Focus

The DAX rallied 0.84% on Friday. Following a 0.24% on Thursday, the DAX ended the day at 15,919.

Eurozone Inflation Softens to 2.9%

The Eurozone annual inflation rate softened from 4.3% to 2.9% in October 2023. The softer numbers supported market bets on the ECB cutting interest rates next year. German government bond yields and 10-year US Treasury yields tumbled early in the European session. The pullback in yields fueled buyer demand for riskier assets.

Trading Derivatives carries a high level of risk to your capital and you should only trade with money you can afford to lose. Trading Derivatives may not be suitable for all investors, so please ensure that you fully understand the risks involved, and seek independent advice if necessary. A Product Disclosure Statement (PDS) can be obtained either from this website or on request from our offices and should be considered before entering into a transaction with us. Raw Spread accounts offer spreads from 0.0 pips with a commission charge of USD $3.50 per 100k traded. Standard account offer spreads from 1 pips with no additional commission charges. Spreads on CFD indices start at 0.4 points. The information on this site is not directed at residents in any country or jurisdiction where such distribution or use would be contrary to local law or regulation.

US Housing Sector Data Deliver Late Support

On Friday, better-than-expected US housing data drove buyer demand for riskier assets. The US housing sector remains a litmus test of the US economy, easing investor fears of a hard landing. However, the numbers failed to influence market bets on an H1 2024 Fed Rate cut.

On Friday, the Dow rose by 0.01%, with the Nasdaq Composite Index and S&P 500 seeing gains of 0.08% and 0.13%, respectively.

Fed speakers contributed to the rising bets on a Fed rate cut in March or May. FOMC voting member Austan Goolsbee expects a sharp fall in inflation, with Michael Barr seeing interest rates near the peak. Voting member Mary Daly called for patience on monetary policy given the increased uncertainty toward the US economic outlook.

The Friday Market Movers

Siemens Energy AG rallied 7.55% as investors responded further to the news of the government deal.

Deutsche Bank and Commerzbank gained 2.63% and 1.22%, tracking UBS into positive territory.

The risk-on sentiment supported the auto sector, with rising bets of central bank rate cuts a boon for car manufacturers. BMW and Mercedes Benz Group ended the day up 1.22% and 1.12%. Porsche and Volkswagen rose by 0.46% and 0.54%, with Daimler Truck Holding gaining 0.86%.

German Producer Prices and the ECB in the Spotlight

On Monday, German producer prices will draw investor interest. A less marked decline in producer prices could signal an improving demand environment. Economists forecast that producer prices will decrease by 11.0% year-over-year in October, compared to -14.7% in September.

Beyond the numbers, ECB Chief Economist Philip Lane is on the calendar to speak. Support to begin rate cut discussions would fuel the appetite for DAX-listed stocks.

Earlier today, the PBoC left Loan Prime Rates unchanged, in line with expectations. The Hang Seng Index enjoyed a positive start to the week, with pledges to support the Chinese real estate sector supporting riskier assets. Gains across the Asian equity markets could set the tone for the European session.

Fed Speakers in Focus

Later in the Monday session, investors must monitor Fed speakers. Support for a Fed pivot to begin discussing rate cuts would support riskier assets.

There are no US economic indicators to consider before the FOMC Meeting Minutes out on Tuesday.

The futures markets point to a mixed start to the Monday session. The DAX was up 18 points, while the Nasdaq mini was down by 40 points.

Short-Term Forecast

Neat-term trends hinge on central bank forward guidance. Rising bets on Fed and ECB rate cuts would support further gains. However, talk of a hard landing in the US and a prolonged economic recession across the euro area could cap the upside. Prelim private sector PMIs could prove pivotal this week.

DAX Technical Indicators

Daily Chart

The DAX remained above the 50-day and 200-day EMAs, with the EMAs sending bullish price signals.

A DAX break above the 16,004 resistance level would support a move toward the trend line.

Central bank commentary and German producer prices will be the focal points. Dovish ECB and Fed chatter and a modest rise in producer prices could support the DAX.

However, a drop below 15,850 would bring the 15,694 support level into play.

The 14-day RSI reading of 72.16 shows the DAX in overbought territory. Selling pressure could intensify at 16,000.

DAX Daily Chart EMAs send bullish price signals.
DAX 201123 Daily Chart

4-Hourly Chart

The DAX held above the 50-day and 200-day EMAs, with the EMAs reaffirming bullish price signals.

A break above the 16,004 resistance level would support a move toward the trend line.

However, a fall below the 15,800 handle would give the bears a run at the 15,694 support level.

The 82.74 14-4 hour RSI shows the DAX in overbought territory. Selling pressure will likely intensify at 16,000.

4-Hourly Chart EMAs affirm bullish price signals.
DAX 201123 4-Hourly Chart
EUR/USD Forecast: German Producer Prices and ECB Insight to Test Move Toward $1.10

EUR/USD Forecast: German Producer Prices and ECB Insight to Test Move Toward $1.10

The EUR/USD rose by 0.52% on Friday. Following a 0.05% gain on Thursday, the EUR/USD ended the day at $1.09088. The EUR/USD fell to a low of $1.08246 before rising to a high of $1.09139.

German Producer Prices and the ECB in the Spotlight

On Monday, German producer prices for October will garner investor interest. The markets expect the ECB to begin discussing rate cuts after the softer Eurozone inflation figures. However, a pickup in demand could fuel consumer price inflation.

Trading Derivatives carries a high level of risk to your capital and you should only trade with money you can afford to lose. Trading Derivatives may not be suitable for all investors, so please ensure that you fully understand the risks involved, and seek independent advice if necessary. A Product Disclosure Statement (PDS) can be obtained either from this website or on request from our offices and should be considered before entering into a transaction with us. Raw Spread accounts offer spreads from 0.0 pips with a commission charge of USD $3.50 per 100k traded. Standard account offer spreads from 1 pips with no additional commission charges. Spreads on CFD indices start at 0.4 points. The information on this site is not directed at residents in any country or jurisdiction where such distribution or use would be contrary to local law or regulation.

Producer prices reflect the demand environment. Increasing demand allows producers to raise prices. In contrast, a low-demand environment forces producers to cut costs to win new business. Producer price trends influence demand-driven inflationary pressures.

Economists forecast producer prices to decline by 11.0% year-over-year vs. a 14.7% fall in September.

Beyond the numbers, ECB Chief Economist Philip Lane is on the calendar to speak. Comments relating to the economy, inflation, and interest rates need consideration.

Fed Speakers to Test the Theory of a May Rate Cut

On Monday, Fed speakers need monitoring. Following the shift in market sentiment toward the Fed interest rate path, hawkish speeches could ease bets on a May Fed rate cut. Inflation softened in October, with consumer confidence waning. However, labor market conditions remain tight, supporting wage growth.

Tight labor market conditions support wage growth, fueling spending and demand-driven inflationary pressures. A more hawkish Fed rate path raises borrowing costs and reduces disposable income, affecting spending and inflation.

Fed signals of rate cuts after aggressive policy moves could impact the US dollar. There are no economic indicators for investors to consider.

Short-Term Forecast:

Near-term EUR/USD trends hinge on central bank speeches and private sector PMIs. Rising bets on a May Fed rate hike have supported a EUR/USD return to $1.09. However, a deteriorating Euro area macroeconomic environment could force the ECB to cut rates sooner than expected. Private sector PMIs will be pivotal this week.

EUR/USD Price Action

Daily Chart

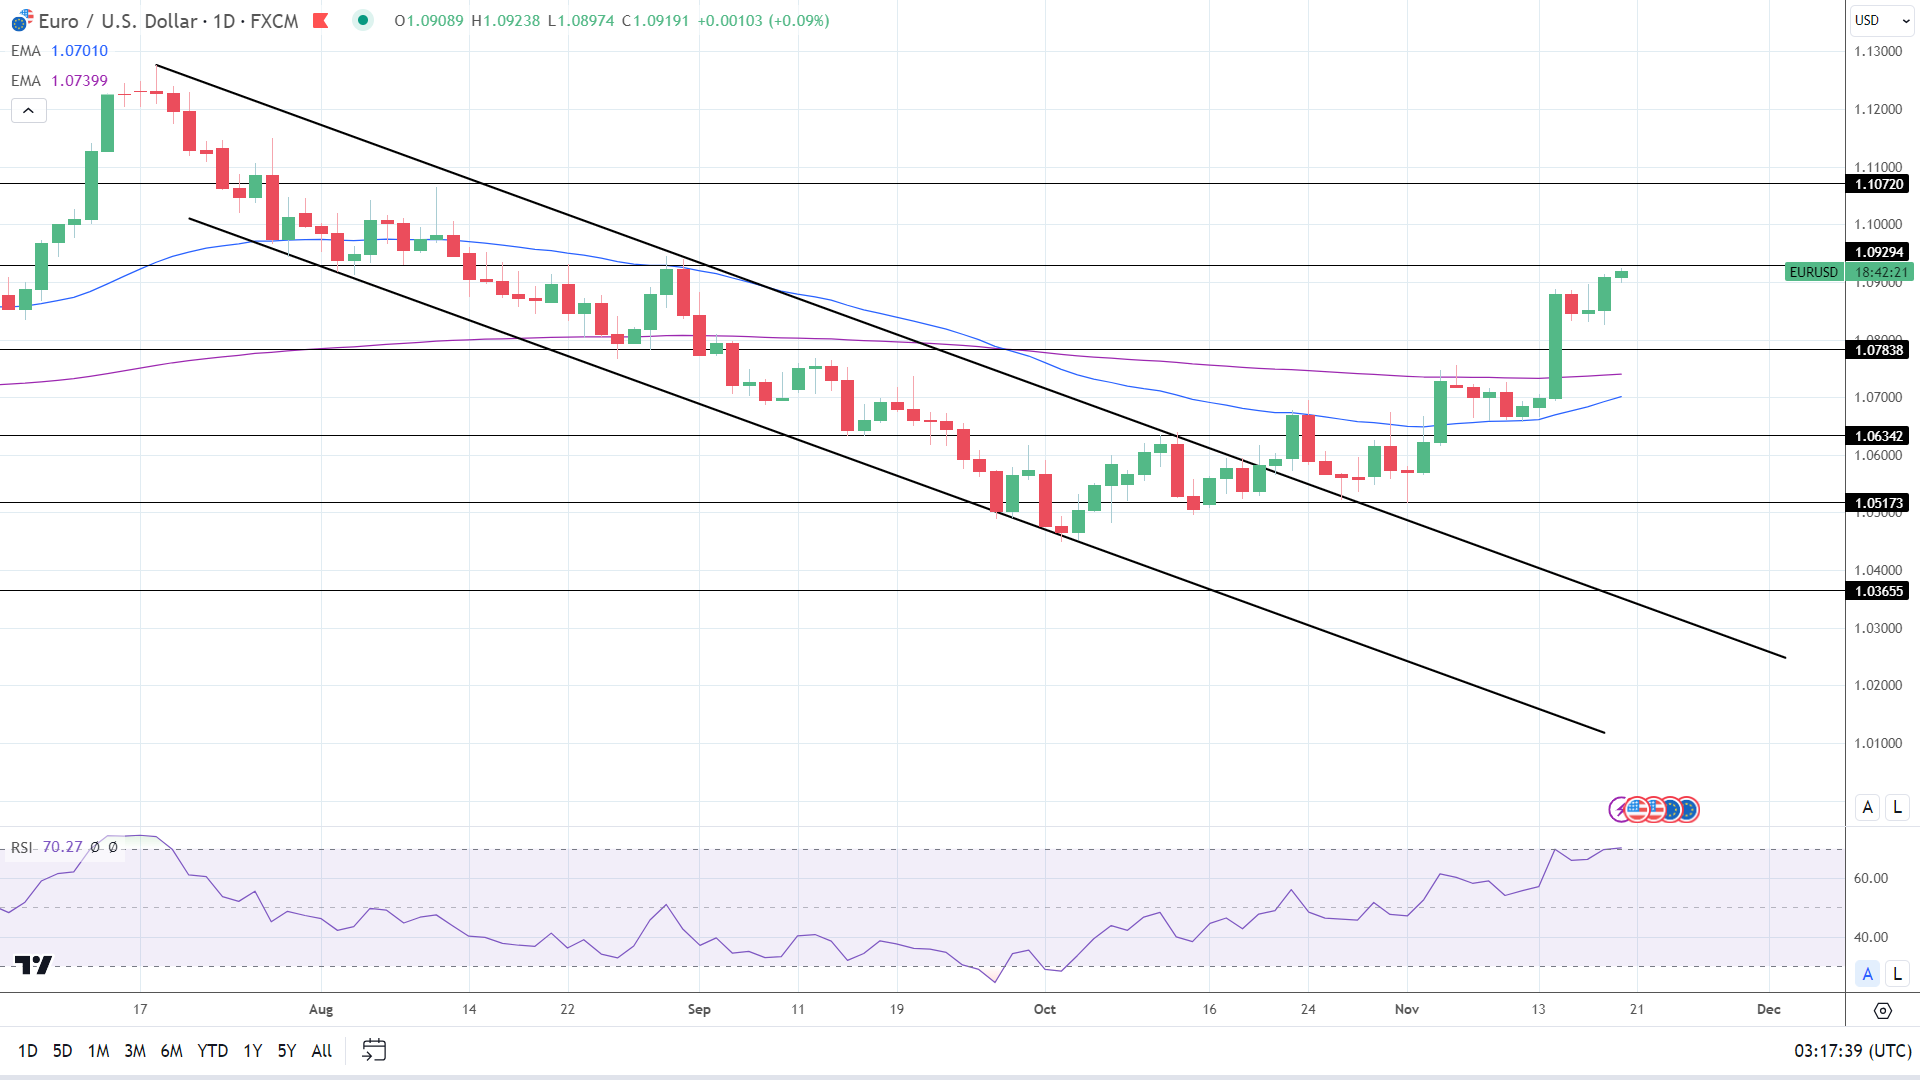
The EUR/USD held above the 50-day and 200-day EMAs, with the EMAs affirming bullish price signals.

A EUR/USD return to $1.09200 would support a break above the $1.09294 resistance level.

German producer prices and central bank speeches will be focal points.

Weaker-than-expected German producer prices and dovish ECB speeches would support a EUR/USD drop to the $1.07838 support level. A fall through the $1.07838 support level would bring the 200 EMA into play.

The 14-period Daily RSI, 70.27, shows the EUR/USD in overbought territory. Selling pressure could intensify at the $1.09294 resistance level.

EUR/USD Daily Chart EMAs send bullish price signals.
EURUSD 201123 Daily Chart

4-Hour Chart

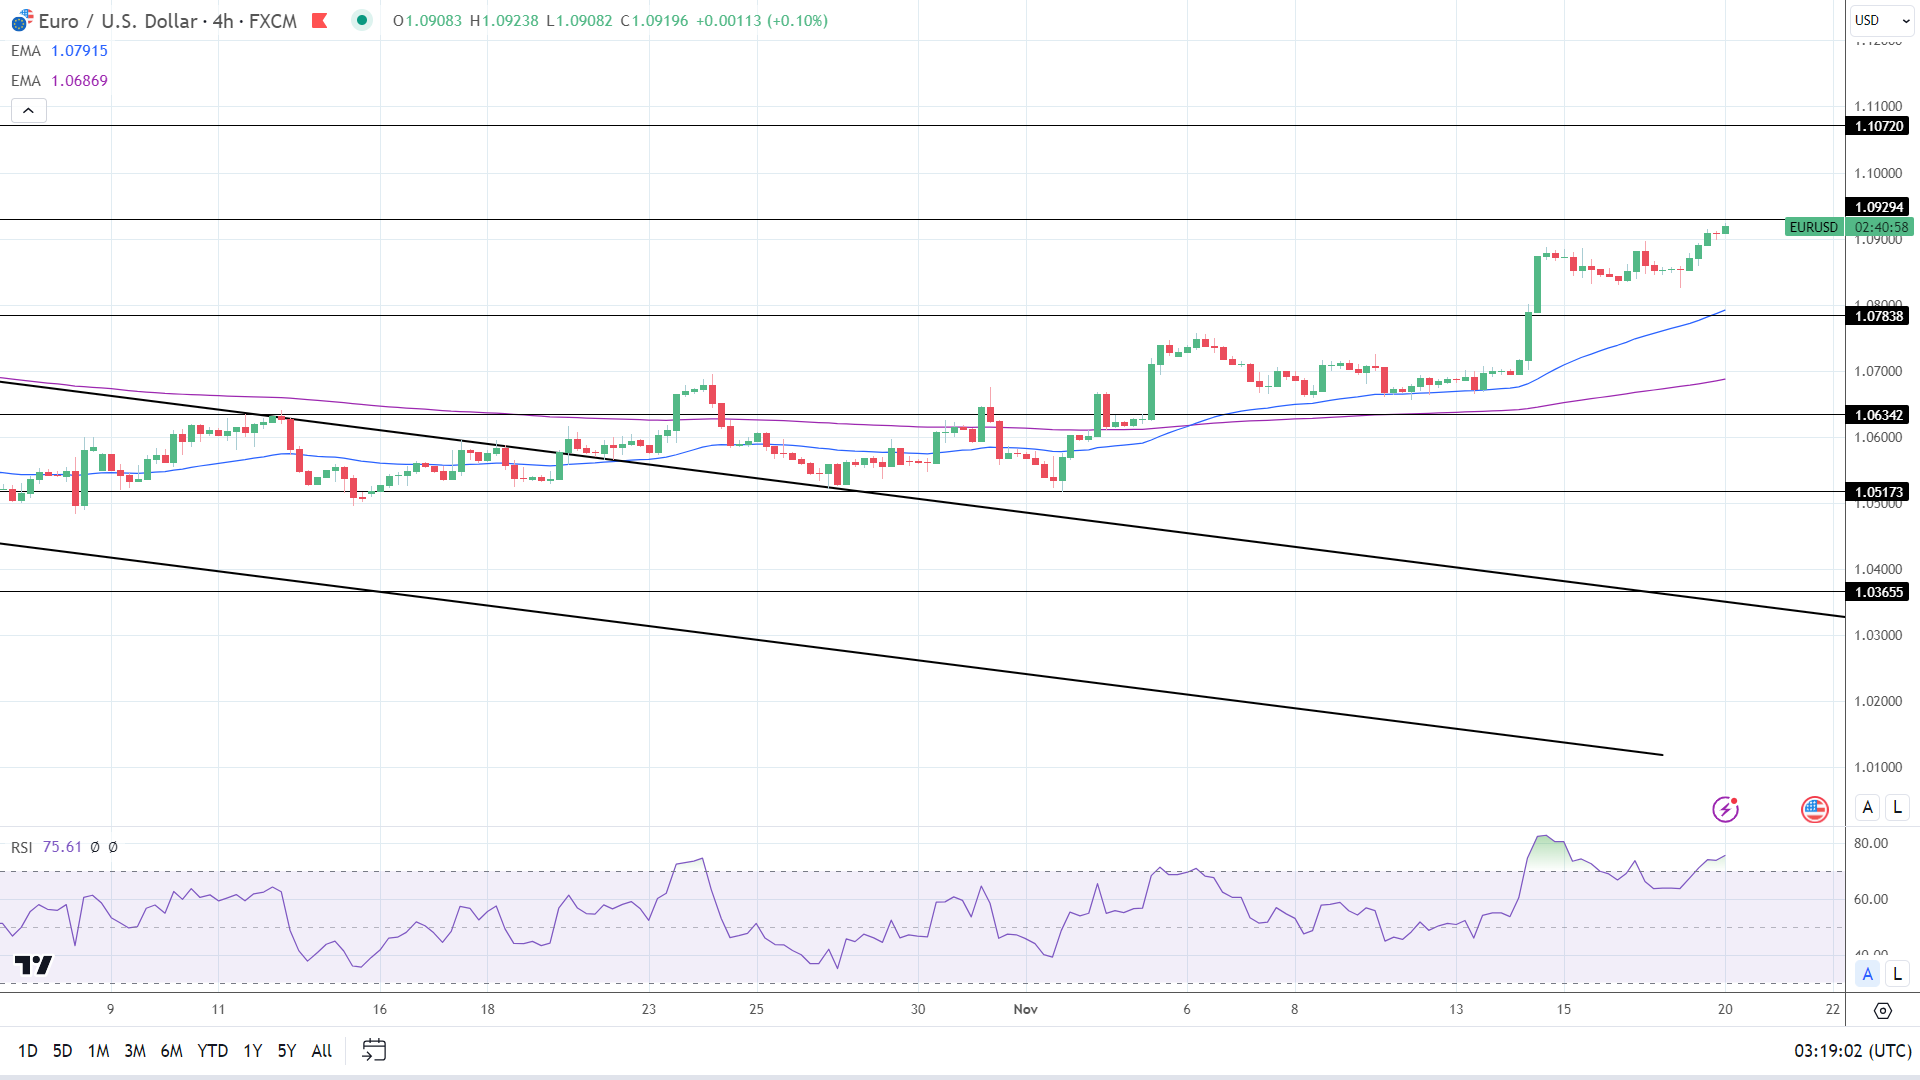
The EUR/USD holds above the 50-day and 200-day EMAs, with the EMAs reaffirming bullish price signals.

A EUR/USD break above the $1.09294 resistance level would support a move toward $1.10.

However, a EUR/USD drop to $1.08500 would give the bears a run at the 50-day EMA and the $1.07838 support level. Buying pressure could intensify at the $1.07838 support level. The 50-day EMA is confluent with the support level.

The 14-period RSI on the 4-hour chart, 75.61, shows the EUR/USD in overbought territory. Selling pressure could intensify at the $1.09294 resistance level.

4-Hourly Chart EMAs send bullish price signals.
EURUSD 201123 4 Hourly Chart
What is the Commitment of Traders (COT) Report?

What is the Commitment of Traders (COT) Report?

The Commitment of Traders (COT) report is published weekly by the Commodity Futures Trading Commission (CFTC). It’s often times referred to as the “COT” report. It provides a breakdown of open interest for all exchanged-traded futures contracts under the rule of the CFTC. It is published each Friday afternoon Eastern Standard Time (EST), and represents the positioning profile of all market participants for the week ending on Tuesday. According to the CFTC, the COT has informal beginnings which can be traced back as far as 1924; however, the report officially began release in 1962. It has gained increasing popularity in the past 25-30 years with the increasing importance and size of the futures market.

There are three general types of market participants which are represented in the report – commercial traders, non-commercial, and non-reportable traders. Each group has its own specific interest for their involvement in the futures market.

Commercial traders, also known as ‘hedgers’, are traders with exposure to a commodity or financial instrument. For example, corporations who require raw materials for the production of goods. To these companies it is viewed as a form of insurance against adverse price fluctuations and allows for a means of price stabilization of key inputs which impact the cost of production. It can also apply to financial instruments, such as interest rate contracts; where for example, a bank might want to hedge against fluctuations in interest rates.

Non-commercial traders, also known as ‘large speculators’, are entities such as hedge funds, Commodity Trading Advisors (CTAs), Commodity Pool Operators (CPOs), and other large traders who use the futures market to speculate on price fluctuations.

Non-reportable traders, also known as ‘small speculators’, are the smallest traders in the marketplace. These can be individuals, proprietary trading firms, small hedge funds, and anyone who establishes small position sizes for speculative purposes. This group has grown over the years with the advent of technology and access to the market electronically.

What information can be gained through the COT report?

(For purposes of simplicity, we’ll refer to commercial traders as ‘hedgers’, non-commercials as ‘large speculators’, and non-reportable as ‘small speculators’.)

First off, it’s worth noting that due to the infrequent and delayed release (weekly reporting on Friday’s for the week ending on Tuesday), COT data is best used as an intermediate to long-term indicator. It’s a sentiment analysis tool and should be used in conjunction with other forms of analysis, i.e. – technical & fundamental.

There is more than one way to gain information from these weekly reports, but first let’s determine which of the three aforementioned group of traders might offer the most valuable information.

Hedgers and large speculators take positions opposite of one another. The reason for this is due to the differing intentions just discussed. Hedgers are interested in price stabilization while large speculators are looking to profit from large price fluctuations hedgers try and avoid. As the market rises hedgers tend to be sellers while large speculators, collectively, typically employ trend-following strategies which would look to go long the market. The same can be said in reverse for markets which trend lower.

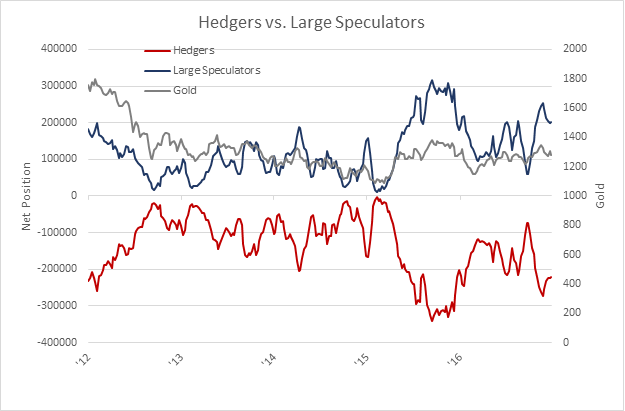
In the graph below, in the gold market you can see a nearly 100% inverse correlation between the activity by hedgers and large speculators. The tendency for large specs to use trend-following strategies can also be observed, as the general direction of their trading activity and the price of gold move relatively in-line.

Gold hedgers vs large speculators

How might this information be useful? We can safely take the commercial traders out of the equation since we already have a good idea of what they are doing by just looking at what large speculators are doing. We won’t focus on small speculators, as they tend to exhibit more erratic behavior, but loosely follow the positioning of the large speculators. It’s just not with the same degree of negative correlation observed between large speculators and hedgers.

Various ways COT data can be interpreted and incorporated into your trading methodology

It’s important to first remember that COT studies provide a gauge of market sentiment, and as such, they need to be used in context with other factors which fit within your trading methodology (i.e. price action and fundamental analysis). They are best used to identify broader conditions which may be more or less conducive for price to move in a particular direction. Let’s look at how this can be most effectively achieved by looking at indications from the COT report as a trend identifier, an overbought/oversold indicator, as well as a sign of a breakout leading to a new trend.

Large speculators typically look to identify intermediate to long-term trends

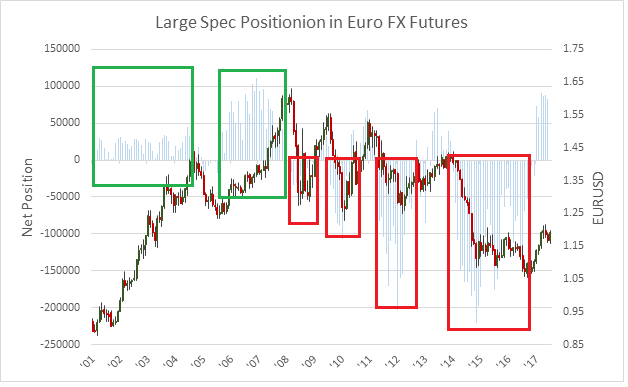
Let’s look at how we might be able to utilize the information observed in the activity of large speculators. When strong trends develop, this group tends to be buying when the market is rising and selling when the market is falling. By looking at which direction their positioning is heading, this information can be used as not only a gauge of direction but trend strength as well.

Large specs following the trend

Please add a description for the image.

Breakout/Momentum: Sharp changes in positioning with price can indicate a breakout and momentum as the trend changes

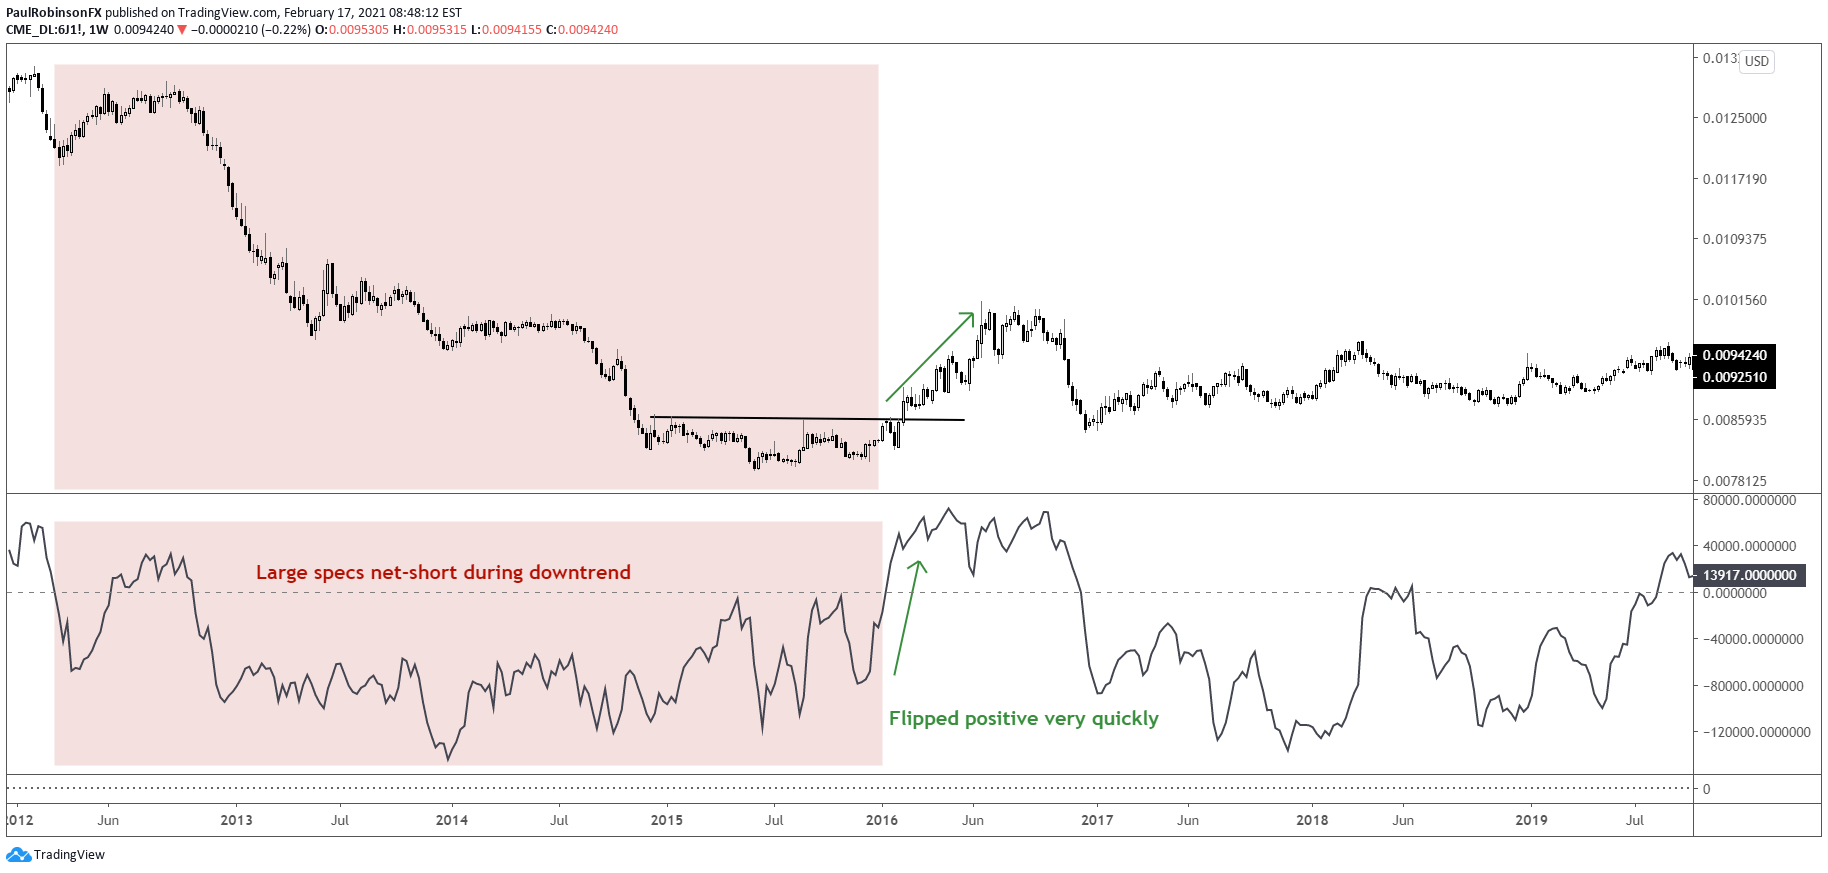
The Japanese Yen was in a very persistent downtrend from 2011-2015, and large speculators were correctly net-short for much of the bear market. However, in early 2016 they not only flipped from short to long, it occurred very rapidly. The sudden change, in only four weeks, saw their position-size move from the lower one-third of the range over the prior year to net-long for the first time in several years.

Around this same time the Yen experienced a price breakout above resistance to its highest levels in 15 months. The sudden surge in buying turned out to be a sign of momentum as the breakout was sustained and led to a multi-month rally of approximately 15%. Notice at other times we didn’t have this signaling with several failed short-covering rallies within the context of a strong downtrend. The key distinguishing factor here from the prior times was that large specs were net-short and there also wasn’t any confluence with price changing trend (i.e. breakout above resistance).

Japanese Yen futures reverse course on surge in large spec buying, break above resistance

Japanese yen futures with CoT

Many traders use momentum indicators such as RSI and Stochastics to identify when a market may be overbought or oversold. As an intermediate to long-term indicator the COT profile of large speculators can be used similarly. How this behavior is viewed needs to be taken into context with market conditions, trend, and how other factors are impacting the market.

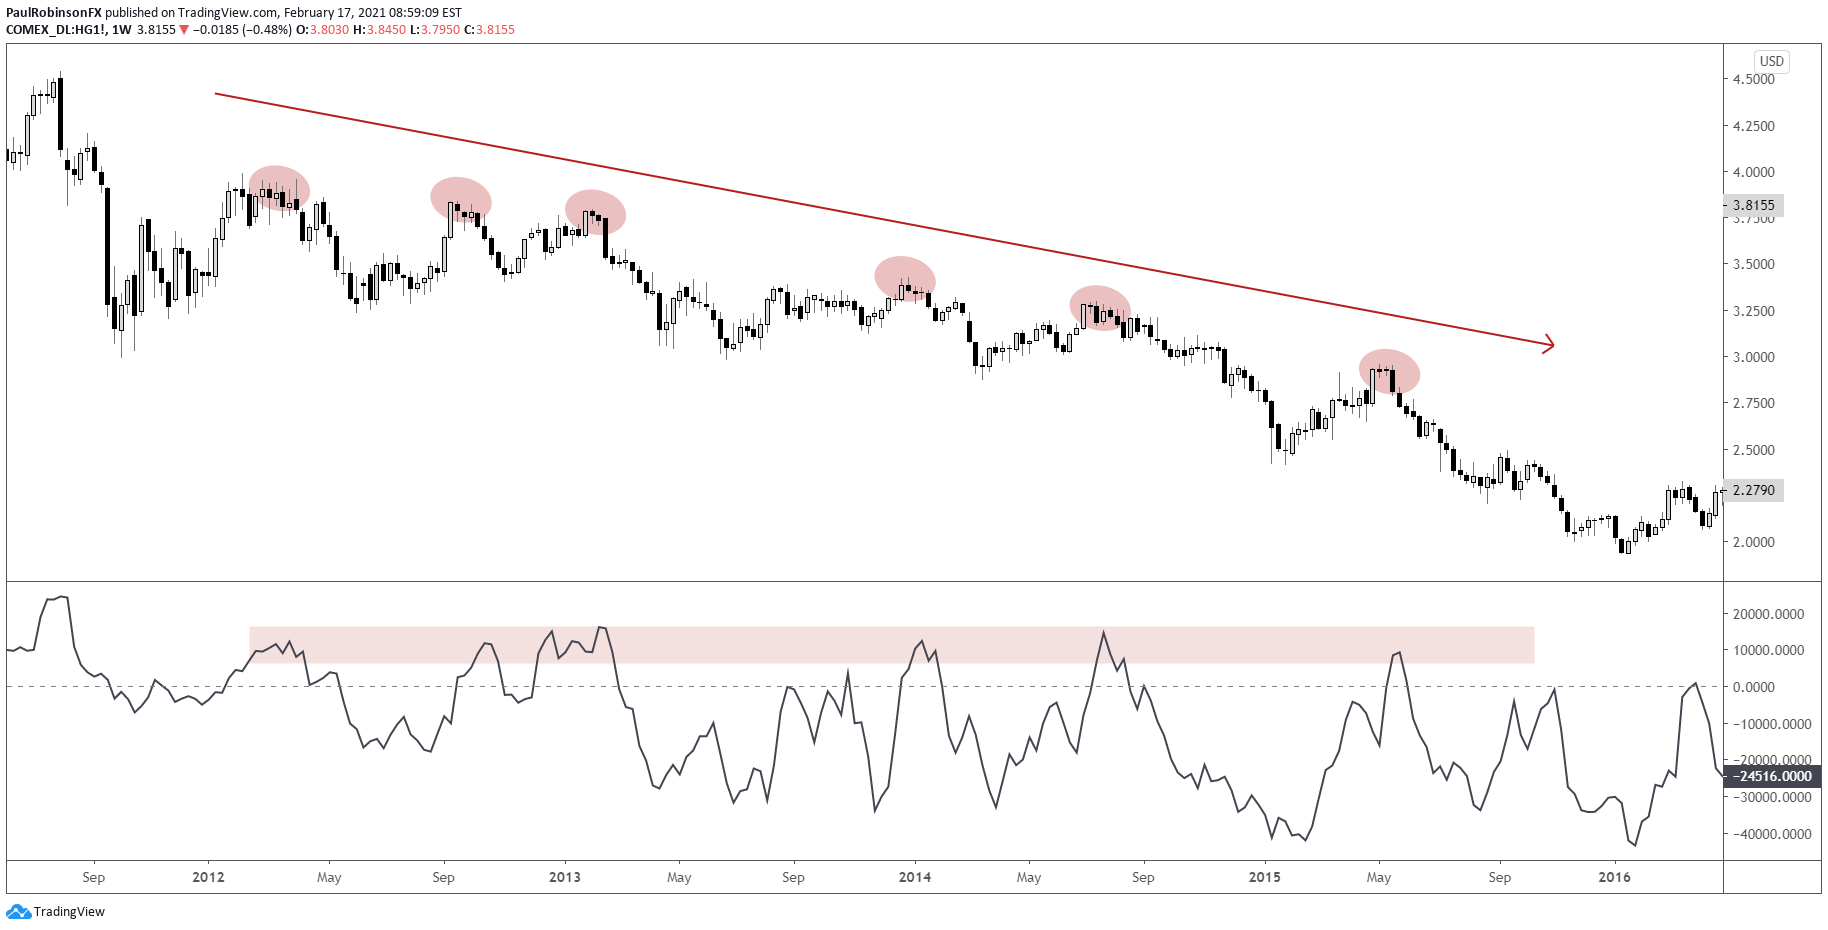
Copper went into a bear market from 2011-2016. During this time there were numerous attempts by the commodity to rally, but within the context of a clear downtrend those only proved to be temporary before sellers took over again. Net-positioning on many of those occasions was pushed to a 52-week extreme which coincided with the peak of the counter-trend rallies. It acted as an indication of overbought in a pervasive downtrend.

Copper futures trending lower with peaks in buying leading to swing-highs

HG futures with CoT peaks

COT versus IG Client Sentiment data

As noted earlier, due to the infrequency and delay in reporting, the COT report is best used as an intermediate to long-term sentiment indicator. This is where more timely data can be used to determine short-term sentiment, and even in conjunction with the COT data. IG Client Sentiment data, or IGCS for short, shows real-time positioning of retail traders through a ratio of long positions versus short positions. IGCS can be an effective contrarian indicator as the retail crowd tends to trade against developing trends.


What is Crude Oil? A Trader’s Primer to Oil Trading

What is Crude Oil? A Trader’s Primer to Oil Trading

WHAT IS CRUDE OIL AND WHAT IS IT USED FOR?

Crude oil, or petroleum, is a naturally-occurring fossil fuel and currently the world’s primary energy source. It is made from ancient organic matter and can be distilled into component fuels such as gasoline, diesel, and lubricants, each of which have a multitude of industrial applications.

The commodity is usually extracted from underground reservoirs through drilling, and the countries that produce the greatest volume of crude oil, as of 2019, are the USA, Russia, and Saudi Arabia.

To understand how crude oil relates to other energy resources and assets, as well as how to trade them, visit our Major Commodities page.

BRENT AND WTI CRUDE OIL EXPLAINED

The composition of crude oil varies by source, but two types are used to benchmark global prices. They are the United States’ West Texas Intermediate (WTI) and United Kingdom’s Brent crude. The differences between them are based on factors such as composition, extraction location and prices, but for more details, as well as how to trade each asset, see our WTI vs Brent comparison.

POWER PLAYERS IN THE CRUDE OIL MARKET

The Organization for Petroleum Exporting Countries (OPEC) was established in 1960. This body sets production quotas for its members, with the aim of reducing competition and keeping prices at profitable levels. OPEC is dominated by Kuwait, Qatar, Saudi Arabia (which controls the Strait of Hormuz), and the United Arab Emirates. While OPEC generally controls a large percentage of the oil supply, the US, as of 2019, is the world’s largest producer of oil.

Institutions that supply oil to the global market are made up of international oil companies, or IOCs, such as ExxonMobil, BP and Royal Dutch Shell. These are investor-owned and look to increase shareholder value through private interests. However, national oil companies, or NOCs, such as Saudi Aramco and Gazprom, are fully or majority-owned by a national government.

HISTORY OF CRUDE OIL

The history of crude oil has seen many changes since the beginning of the century, when global supply was largely controlled by OPEC, but demand was driven by the US. With OPEC calling the shots and Asian demand rising rapidly, prices went from a cost per barrel of $25 for Brent and $27 for WTI in March 2001, to $140 for both types by June 2008, representing a price bubble.

However, the last decade has seen technological advancements and deregulation facilitate increased US shale oil production, leading to shift in power from OPEC to the US. Prices fell from $112 for Brent and $105 for WTI in June 2014, to under $36 for both by January 2016. OPEC responded by colluding with several countries – including Russia – to implement ‘production quotas’ designed to stabilize prices. These brought the cost per barrel back above $70 for Brent, and $65 for WTI, by April 2018.

The below chart shows some key landmarks in the price of US Crude this century and the reasons for the swings.

WTI CRUDE OIL (2000-2019)

WHAT AFFECTS CRUDE OIL PRICES?

Crude oil prices are affected mostly by supply and demand, which in turn are influenced by factors such as outages, OPEC production cuts, seasonality, and changing consumption patterns. For more on these and why they are essential fundamental factors to understand when trading the asset, see our guide to trading crude oil.

USD AND THE PRICE OF OIL

The US Dollar and oil have historically had an inverse relationship. When USD is weak, the price of oil has traditionally been higher in dollar terms. Since the US was for long periods a net importer of oil, rising oil price has meant the US trade balance deficit has risen since more dollars are required to be sent abroad. However, some believe this relationship follows less reliable patterns in modern times.

There is a more predictable link between the Canadian Dollar and oil prices. For example, as of 2019, Canada exports some three million barrels of oil and petroleum products per day to the US, meaning a huge demand for Canadian dollars is created. If US demand rises, more oil is needed, which often means oil prices rise, and could accordingly mean a fall in USD/CAD. Conversely, if US demand falls, oil prices may fall too, meaning demand for CAD drops in turn.

Reasons to Trade Crude Oil

Oil is a dynamic, volatile and liquid market – and stands as the most traded commodity in the world. Here’s more on the benefits of engaging with this asset.

  1. The volatile nature of trading this asset makes it a favorite of swing and day traders, who react to the latest oil pricing news. While the trading can be risky, some see the oil market as an opportunity in its purest form.
  2. Crude oil is a liquid market, traded in huge volume. This means trades can be opened and closed at the price points you want and at lower trading cost.
  3. Oil can be traded as part of a hedging strategy to mitigate against the effects of the asset’s volatility.
  4. Trading oil can be part of a diversified portfolio of commodities, stocks and bonds.

HOW TO GET STARTED TRADING CRUDE OIL

We offer an in-depth guide to trading crude oil and publish daily news and analysis articles reviewing the latest crude oil prices, among other assets. You can also download our free quarterly oil forecasts which will equip you with the knowledge to make informed decisions in the oil market.