7 Step Trading Checklist Before Entering Any Trade

7 Step Trading Checklist Before Entering Any Trade

hy You Should Use a Trading Checklist

Implementing a trading checklist is a vital part of the trading process because it helps traders to stay disciplined, stick to the trading plan, and builds confidence. Maintaining a trading checklist presents traders with a list of questions that traders need to answer before executing trades.

It is important not to confuse a trading plan with the trading checklist. The trading plan deals with the big picture, for example, the market you are trading and the analytical approach you choose to follow. The trading checklist focuses on each individual trade and the conditions that must be met before the trade can be made.

Your Trading Checklist

Before entering a trade, ask yourself the following questions:

  1. Is the market trending or ranging?
  2. Is there a significant level of support or resistance nearby?
  3. Is the trade confirmed by an indicator?
  4. What is the risk to reward ratio?
  5. How much capital am I risking?
  6. Are there any significant economic releases that can impact the trade?
  7. Am I following the trading plan?

1) Is the Market Trending or Ranging?

Trending markets

Experienced traders know that finding a strong trend and trading in the trend’s direction, has the potential to lead to higher probability trades.

There is a well-known saying that trending markets have the ability to bail traders out of bad entries. As can be seen below, even if a trader entered a short trade after the trend was well established, the trend would continue to provide more pips to the downside than to the upside.

Traders need to ask themselves if the market is exhibiting signs of a strong trend and whether ‘trend trading’ forms part of the trading plan.
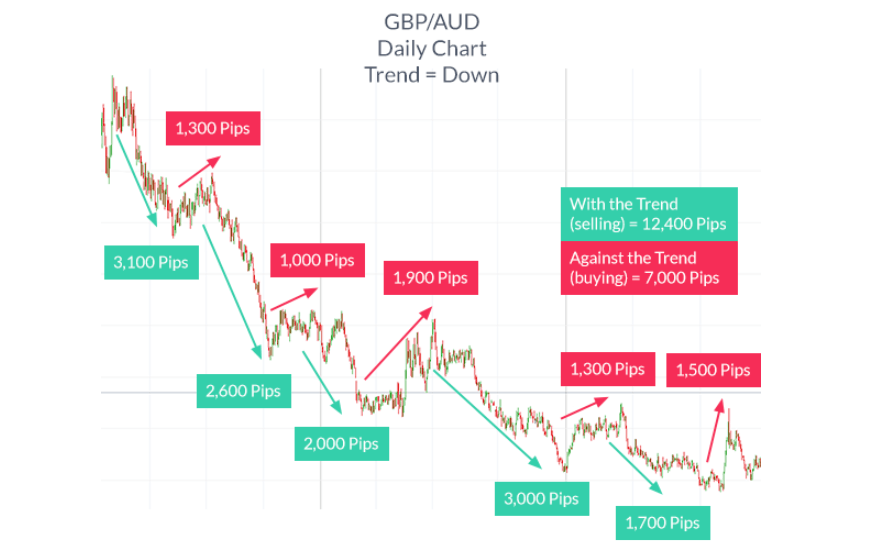
Trend trading where there are more pips available in the direction of the trend

Ranging markets

Ranging markets tend to see price bounce between support and resistance to trade within a channel. Certain markets, like the Asian trading session, tend to trade in ranges. Oscillating indicators (RSI, CCI and Stochastic) can be of great use to traders that focus on range trading.

Range trading

2) Is there a significant level of support or resistance nearby?

Price action tends to respect certain price levels for a number of reasons and being able to identify these levels is key. Traders do not want to be holding a short position after price has dropped to the key level of support, only to bounce back higher.

Key level of support EUR/USD

The same applies when price approaches a key level of resistance and typically drops lower shortly after. Trend traders typically look for sustained breaks of these levels as an indication that the market may start to trend. Range traders will on the other hand, look for price to bounce between support and resistance for prolonged periods.

3) Is the trade confirmed by an indicator?

Indicators assist traders in confirming high probability trades. Depending on the trading plan and strategy, traders will have one or two indicators that complement the trading strategy. Do not fall into the trap of over-complicating the analysis by adding multiple indicators to a single chart. Keep the analysis clean and simple and easy to view at a glance.

4) What is the risk to reward ratio?

The risk to reward ratio is the ratio of the number of pips that traders will risk in the hopes of reaching the target. According to our Traits of Successful Traders research, which analysed over 30 million live trades, traders with a positive risk to reward ratio were nearly three times more likely to be profitable than those who do not. For example, a 1:2 ratio means that a trader risks half of what he/she stands to gain if the trade works out. The image below further depicts this principle.

risk to reward ratio good vs bad

5) How much capital am I risking?

It is essential for traders to ask this question. Often traders blow up their accounts by leveraging the account to the maximum when chasing “sure things”. One way to avoid this is to limit the leverage used on all trades to ten to one, or less. Another helpful tip is to set stops on all trades and ensure that the aggregate amount risked is no more then 5% of the account balance.

Before placing a trade, ask yourself, “how much capital should I use?”

6) Are there any significant economic releases that can impact the trade?

Sudden market news has the potential to invalidate the “perfect” trade. While it is almost impossible to anticipate things like, acts of terror, natural disasters or systemic failures in the financial markets, traders can plan for economic releases like NFP, CPI, PMI and GDP releases.

Plan ahead by viewing our economic calendar which highlights major economic releases from the top trading nations

7) Am I following the trading plan?

All of the above is of very little use if it does not tie in with the trading plan. Deviating from the trading plan will result in mixed results and only frustrate the trading process. Keep to the trading plan and do not place trades unless the trading checklist has been completed and confirms the trade may be executed.

Oil Prices Forecast: Brent, WTI Futures Dip as OPEC+ Decision Looms

Oil Prices Forecast: Brent, WTI Futures Dip as OPEC+ Decision Looms

The crude oil market is setting a cautious tone early Friday, with both U.S. and international benchmark crude futures registering modest declines. Traders remained attentive to OPEC+’s potential moves regarding production cuts, a factor significantly influencing market sentiment.

Market Movements

Brent crude futures saw a slight decrease of 0.07%, reaching $81.36, continuing the downtrend from the previous session. Similarly, U.S. West Texas Intermediate crude experienced a more notable fall of 0.86%, landing at $76.44. This marked a change from Wednesday’s close, with Thursday not seeing a settlement due to a U.S. public holiday. Notably, both Brent and WTI are poised for their first weekly gain in five weeks, buoyed by expectations of OPEC+, led by Saudi Arabia, potentially reducing supply to stabilize the market into 2024.

Trading Derivatives carries a high level of risk to your capital and you should only trade with money you can afford to lose. Trading Derivatives may not be suitable for all investors, so please ensure that you fully understand the risks involved, and seek independent advice if necessary. A Product Disclosure Statement (PDS) can be obtained either from this website or on request from our offices and should be considered before entering into a transaction with us. Raw Spread accounts offer spreads from 0.0 pips with a commission charge of USD $3.50 per 100k traded. Standard account offer spreads from 1 pips with no additional commission charges. Spreads on CFD indices start at 0.4 points. The information on this site is not directed at residents in any country or jurisdiction where such distribution or use would be contrary to local law or regulation.


OPEC+ Deliberations

The Organization of Petroleum Exporting Countries and its allies, known as OPEC+, unexpectedly postponed their ministerial meeting, intensifying market speculation. This delay, set until Nov. 30, followed disagreements on production levels. Market reactions were swift, with Brent futures dropping by 4% and WTI by 5% during Wednesday’s trading. However, the consensus leans towards an extension of the current production cuts.

Mixed Signals from Global Markets

While Chinese market outlooks seemed robust, aiding market sentiment, U.S. market indicators showed a contrasting picture. Higher U.S. crude stockpiles and diminishing refining margins hinted at reduced crude demand, potentially capping gains from the Chinese market positivity. Furthermore, the long-term outlook for China’s oil demand growth appears tepid, with projections of a slowdown to around 4% in the first half of 2024, amidst challenges in the property sector.

Forecast

Given these factors, the near-term trend in oil markets appears bearish. The balance between OPEC+’s potential production cuts and the mixed global demand outlook suggests cautious trading in the coming weeks, with a close watch on OPEC+’s upcoming decisions and global economic indicators.

Technical Analysis

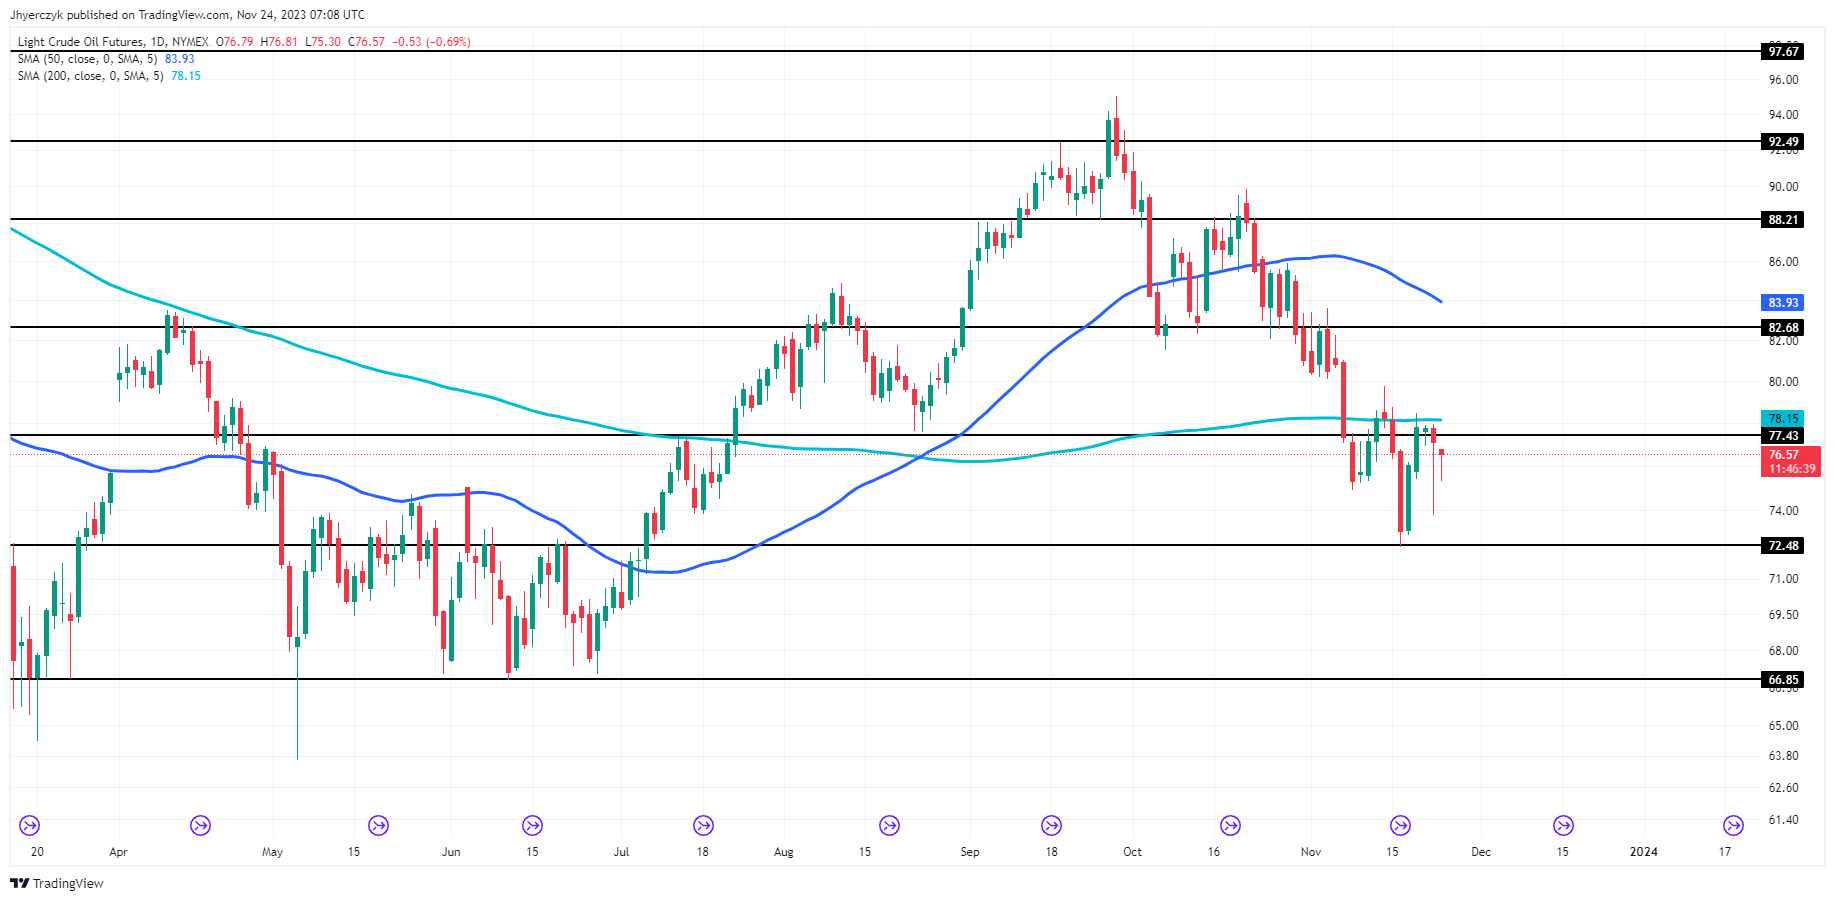
Daily Light Crude Oil FuturesThe current daily price of light crude oil futures at $76.52 is slightly below the previous close of $77.10, indicating a modest downward movement.

It’s also trading below both the 200-day and 50-day moving averages, at $78.15 and $83.93 respectively, suggesting a bearish trend in the short to medium term.

The price is situated between the minor resistance at $77.43 and the main support at $66.85. This positioning, closer to the minor resistance, could indicate a potential for a rebound if it breaks through this resistance level. However, the proximity to the main support also suggests a vulnerability to further declines.

The overall sentiment, considering these factors, leans towards bearishness in the current market context. Over the near-term, trader reaction to the 200-day moving average will set the tone.

DAX Index: The German Economy and the US Services Sector in the Spotlight

DAX Index: The German Economy and the US Services Sector in the Spotlight

Thursday DAX Overview

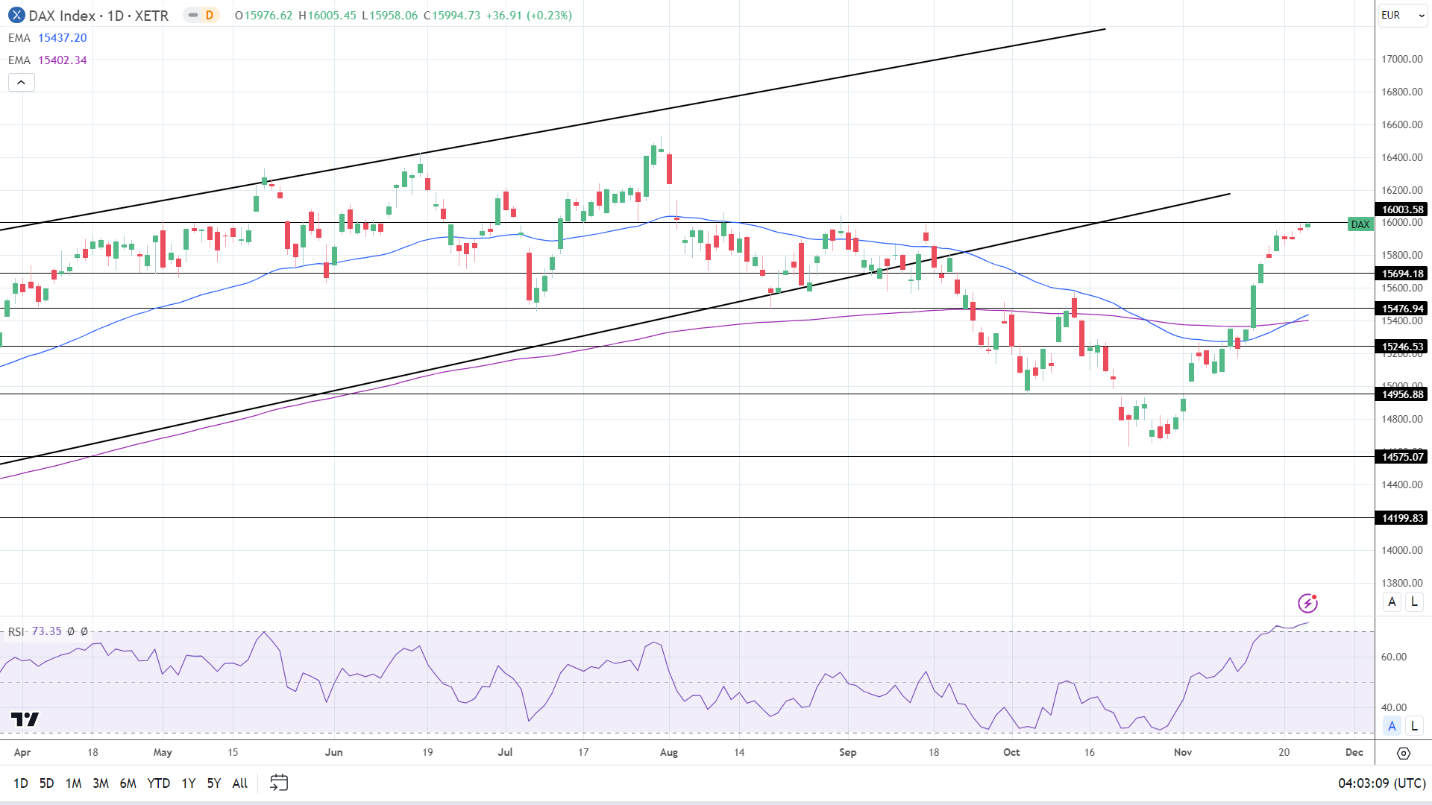
The DAX rose by 0.23% on Thursday. Following a 0.36% gain on Wednesday, the DAX ended the day at 15,995.

Euro Area Private Sector PMIs Offer Relief

On Thursday, prelim private sector PMIs for Germany and the Eurozone provided investor relief. Better-than-expected PMI numbers raised hope of an improving macroeconomic environment. Nonetheless, the private sector continued contracting at a marked pace, signaling an economic recession.

Trading Derivatives carries a high level of risk to your capital and you should only trade with money you can afford to lose. Trading Derivatives may not be suitable for all investors, so please ensure that you fully understand the risks involved, and seek independent advice if necessary. A Product Disclosure Statement (PDS) can be obtained either from this website or on request from our offices and should be considered before entering into a transaction with us. Raw Spread accounts offer spreads from 0.0 pips with a commission charge of USD $3.50 per 100k traded. Standard account offer spreads from 1 pips with no additional commission charges. Spreads on CFD indices start at 0.4 points. The information on this site is not directed at residents in any country or jurisdiction where such distribution or use would be contrary to local law or regulation.

Later in the European session, the ECB Monetary Policy Meeting Minutes supported buyer appetite for DAX-listed stocks. A more cautious ECB eased fears of a higher-for-longer rate path.

There were no US economic indicators to consider. The US markets were closed for the Thanksgiving holiday.

The Thursday Market Movers

The auto sector was among the worst-performing sectors. Porsche fell by 0.97%, with BMW and Volkswagen ending the day down 0.12% and 0.21%, respectively. Mercedes Benz Group slipped by 0.07%. Despite better-than-expected PMI numbers, recessionary jitters weighed on the outlook for demand.

However, bank stocks had a mixed session. Deutsche Bank declined by 0.02%, while Commerzbank ended the day up 0.95%.

The German Economy in Focus

On Friday, the German economy will be in the spotlight. Finalized Q3 GDP and business sentiment figures will draw investor interest. Upward revisions to preliminary GDP figures could provide early support to the DAX.

However, the Ifo Business Climate Index must signal an improving outlook to support gains. Economists forecast the Ifo Business Climate Index to increase from 86.9 to 87.5.

With the German economy in focus, ECB commentary also needs monitoring. ECB President Christine Lagarde is on the calendar to speak. Forward guidance on inflation, the economy, and interest rates needs consideration.

US Private Sector PMIs to Fuel Fed Policy Bets

On Friday, US private sector PMIs will also move the dial. The US services sector will draw more interest, accounting for over 70% of the US economy.

An unexpected rise in the Services PMI could ease bets on a May Fed rate cut. However, investors must consider the subcomponents. A decrease in price pressures and an increase in service sector activity would benefit riskier assets. Softer price pressures would ease the need for a hawkish Fed rate path. A pickup in service sector activity would support hopes of a soft landing.

Economists forecast the US Services PMI to fall from 50.6 to 50.4 in November.

Short-Term Forecast

Near-term trends will likely hinge on the US private sector PMI numbers. An unexpected rise in service sector activity but softer price pressures would support buyer demand. However, euro area recessionary fears remain a headwind for the DAX.

DAX Technical Indicators

Daily Chart

The DAX remained above the 50-day and 200-day EMAs, with the EMAs sending bullish price signals.

A DAX break above the 16,004 resistance level would support a move to the trend line.

The German economy and the US services sector are focal points on Friday.

However, a drop below the 15,900 handle would bring the 15,694 support level into view.

The 14-day RSI reading of 73.35 shows the DAX in overbought territory. Selling pressure could intensify at 16,000.

DAX Daily EMAs send bullish price signals.
DAX 241123 Daily Chart

4-Hourly Chart

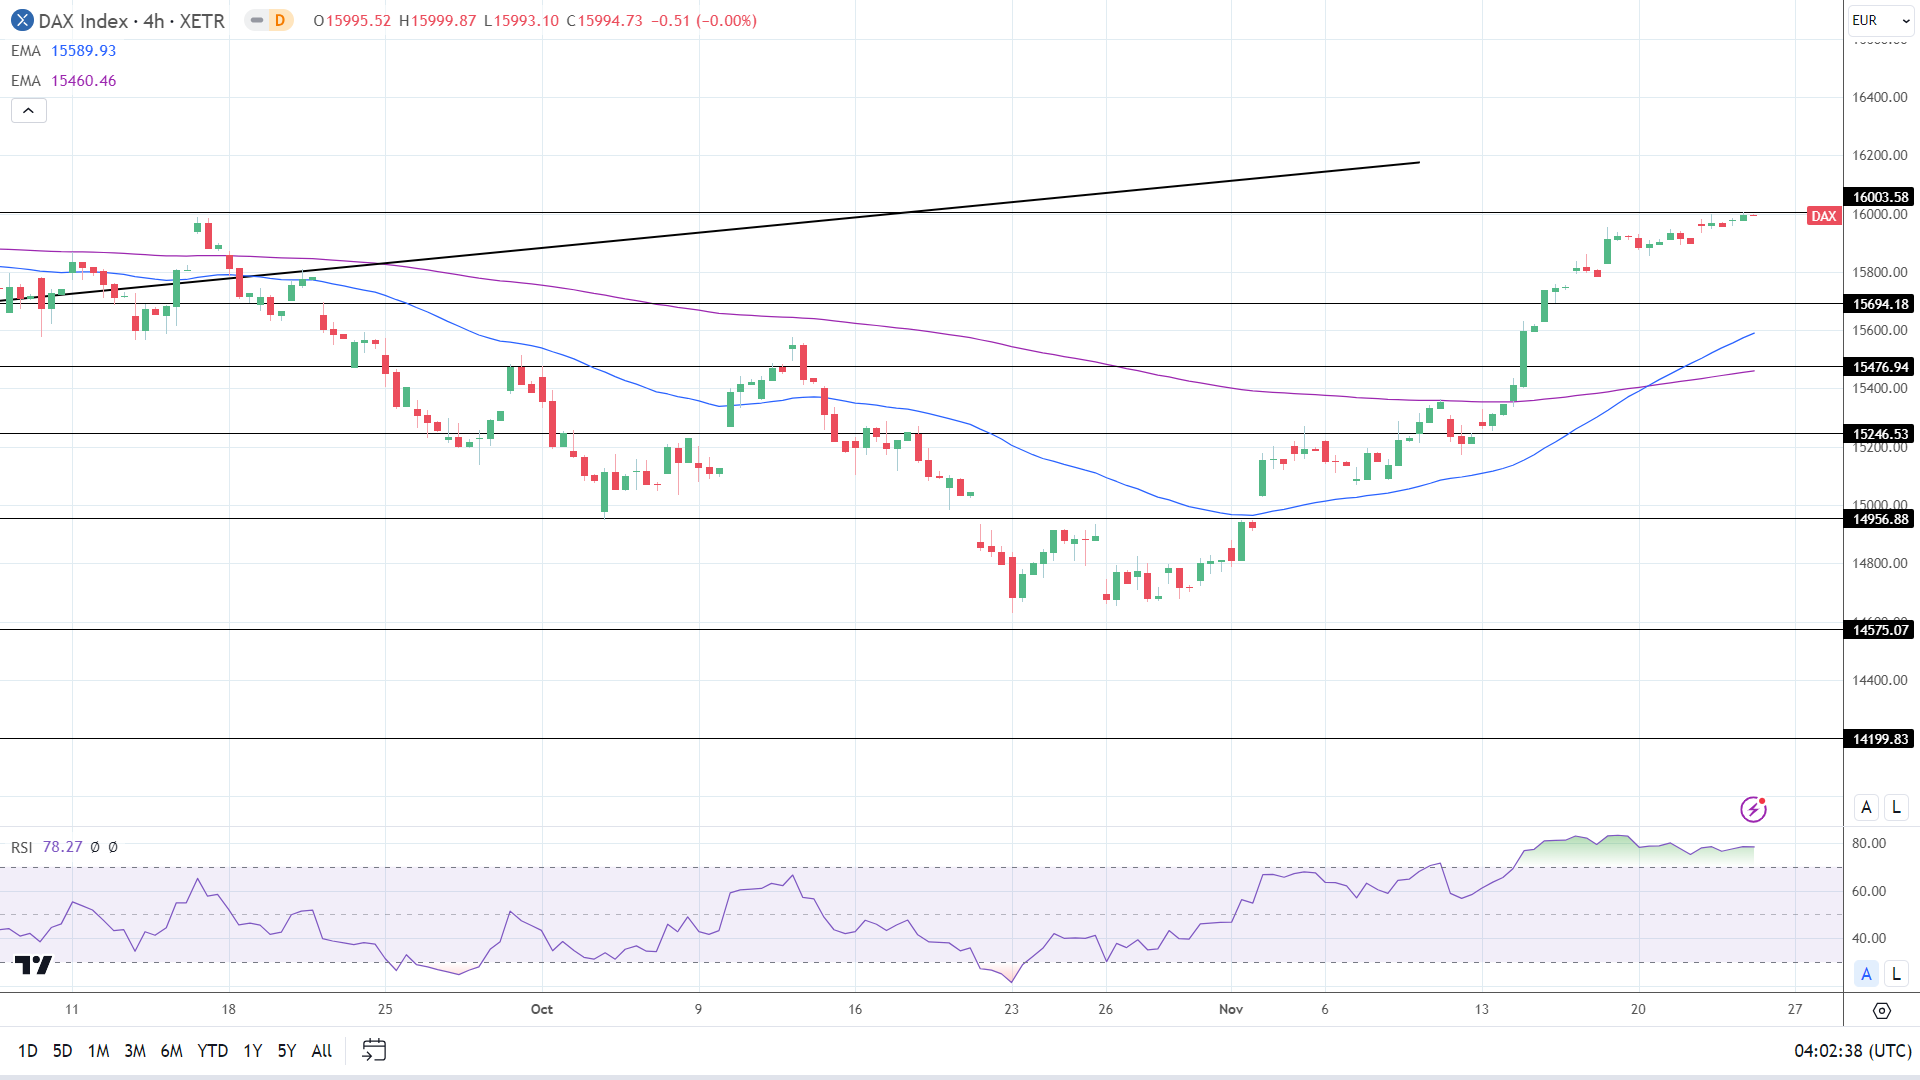
The DAX held above the 50-day and 200-day EMAs, affirming bullish price signals.

A DAX break above the 16,004 resistance level would give the bulls a run at the trend line.

However, a fall below the 15,900 handle would bring the 15,694 support level into view.

The 76.45 14-4 hour RSI shows the DAX in overbought territory. Selling pressure could intensify at 16,000.

4-Hourly Chart EMAs affirm bullish price signals.
DAX 241123 4-Hourly Chart
EUR/USD Forecast: The German Economy and the US Services Sector in Focus

EUR/USD Forecast: The German Economy and the US Services Sector in Focus

Thursday Overview

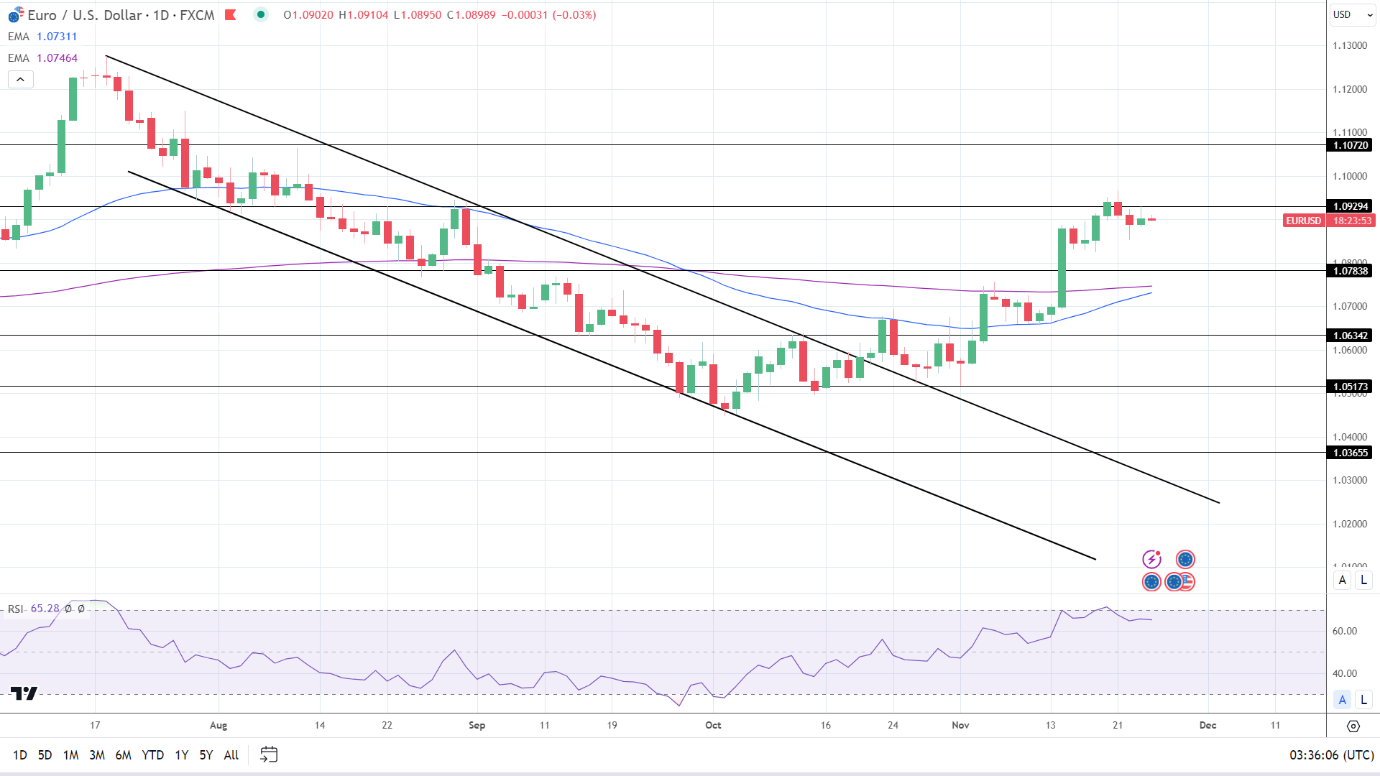
The EUR/USD gained 0.13% on Thursday. After a 0.21% loss on Wednesday, the EUR/USD ended the day at $1.09020. The EUR/USD fell to a low of $1.08821 before rising to a high of $1.09306.

The German Economy Takes Center Stage

On Friday, the German economy will be in the spotlight. Q3 GDP and business sentiment figures will garner investor interest.

Trading Derivatives carries a high level of risk to your capital and you should only trade with money you can afford to lose. Trading Derivatives may not be suitable for all investors, so please ensure that you fully understand the risks involved, and seek independent advice if necessary. A Product Disclosure Statement (PDS) can be obtained either from this website or on request from our offices and should be considered before entering into a transaction with us. Raw Spread accounts offer spreads from 0.0 pips with a commission charge of USD $3.50 per 100k traded. Standard account offer spreads from 1 pips with no additional commission charges. Spreads on CFD indices start at 0.4 points. The information on this site is not directed at residents in any country or jurisdiction where such distribution or use would be contrary to local law or regulation.

Upward revisions to preliminary Q3 GDP numbers could provide early support. However, business sentiment figures must signal an improving outlook to support hopes of a pickup in economic activity.

Improving business sentiment could fuel a pickup in business investment and staffing levels. An upward trend in employment could fuel consumer spending. Euro area private consumption contributes over 50% to the euro area economy.

However, a more positive economic outlook could delay the timing of ECB rate cut discussions.

Economists forecast the German Ifo Business Climate Index to increase from 86.9 to 87.5 in November. According to preliminary figures, the German economy contracted by 0.1% in Q3 after expanding by 0.1% in Q2.

With the German economy in focus, ECB commentary also needs consideration. ECB President Christine Lagarde is on the calendar to speak. Forward guidance on inflation and interest rates will remain the focal points.

US Private Sector PMIs in Focus

On Friday, US private sector PMIs for November will draw investor interest. Market bets on a May Fed rate cut linger despite better-than-expected US labor market and consumer sentiment numbers.

An unexpected pickup in service sector activity could further ease bets on a May Fed rate cut. The US services sector contributes over 70% to the US economy and is the driving force behind inflation. A pickup in activity could allow the Fed to take a more hawkish rate path to tame inflation.

Subcomponents, including prices, new orders, and employment, also need consideration. Input and output price trends could impact consumer inflation trends and the Fed.

Short-Term Forecast:

Near-term EUR/USD trends hinge on the US services sector PMI numbers. An unexpected pickup in sector activity and an upswing in input and output price inflation could signal a more hawkish Fed rate path.

EUR/USD Price Action

Daily Chart

The EUR/USD held above the 50-day and 200-day EMAs, sending bullish price signals.

A EUR/USD break above the $1.09294 resistance level would support a move toward the $1.10720 resistance level.

The German economy and the US services sector are the focal points for the Friday session.

However, a EUR/USD fall below the $1.09 handle would bring the $1.07838 support level into play.

The 14-period Daily RSI, 65.28, suggests a EUR/USD move through the $1.09294 resistance level before entering overbought territory.

EUR/USD Daily Chart sends bullish price signals.
EURUSD 241123 Daily Chart

4-Hour Chart

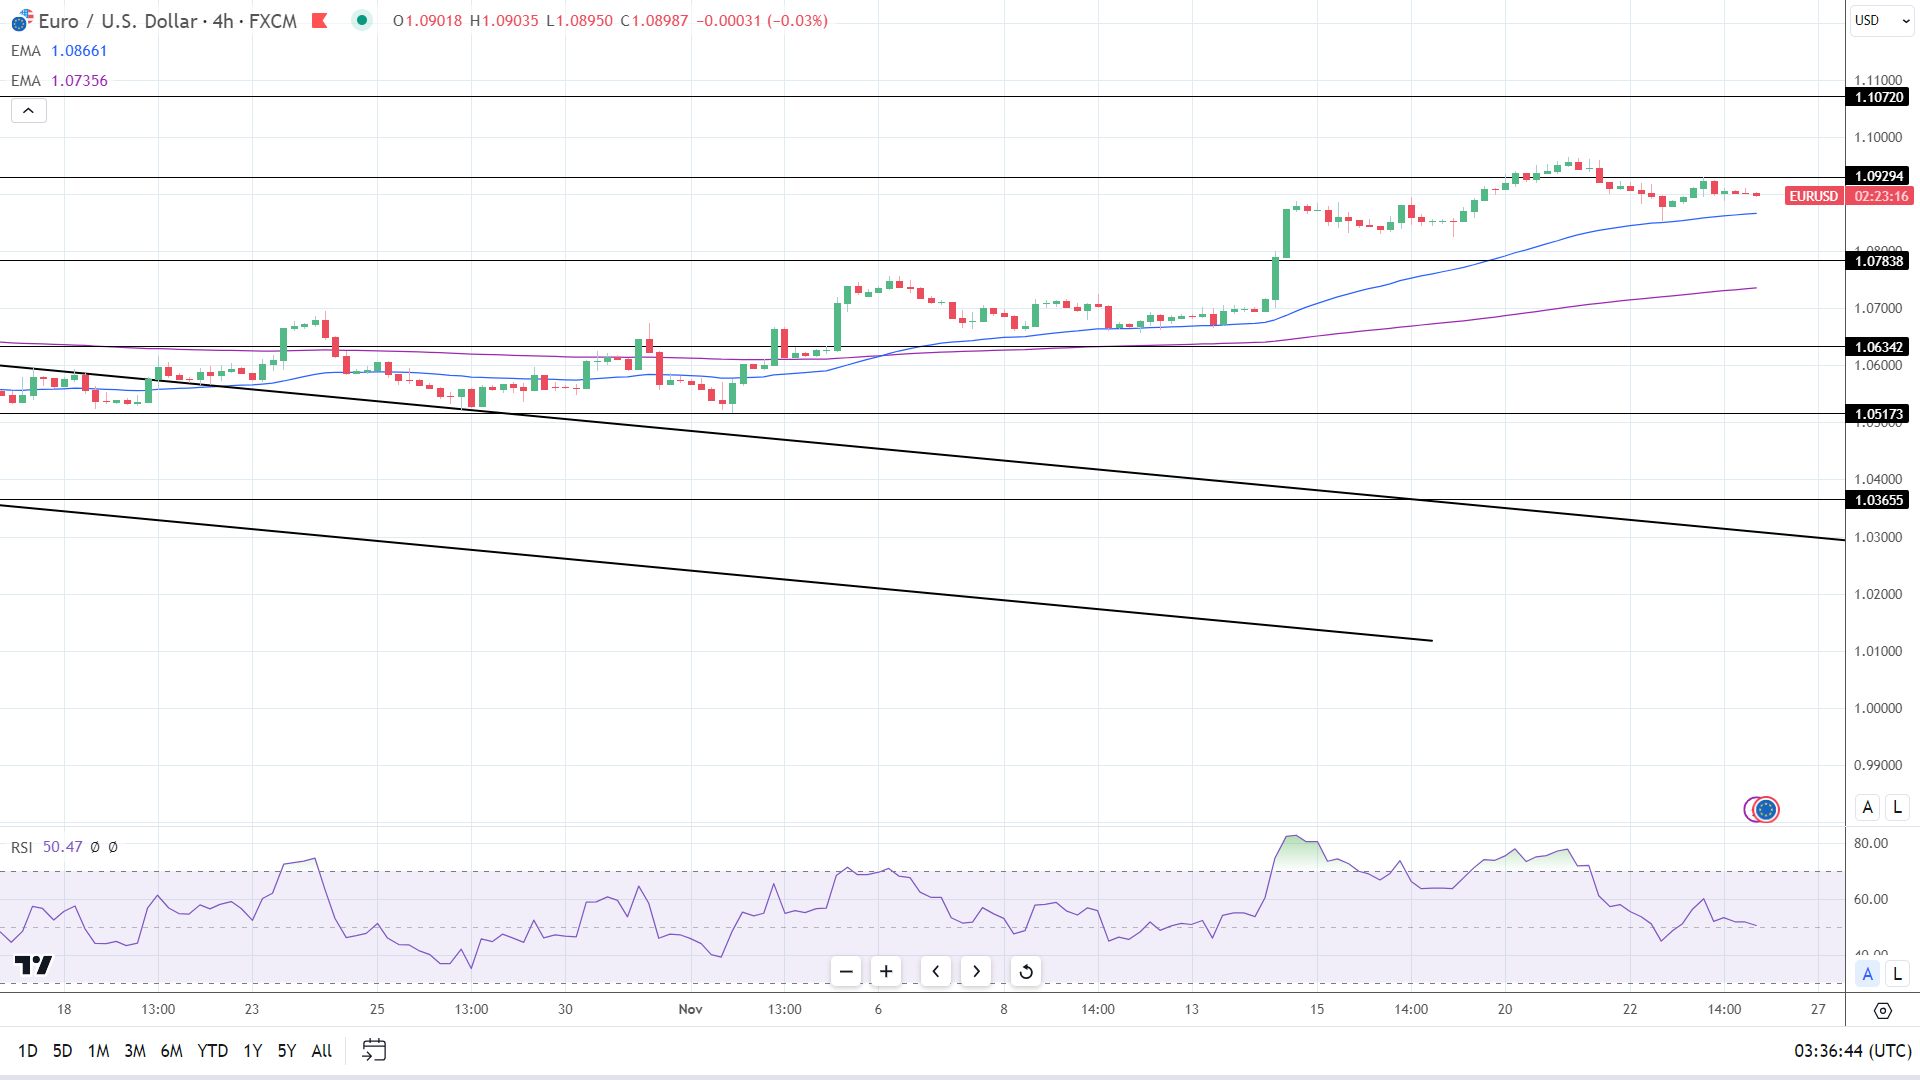
The EUR/USD hovers above the 50-day and 200-day EMAs, affirming bullish price signals.

A EUR/USD break above the $1.09294 resistance level would bring the $1.10720 resistance level into play.

However, a EUR/USD fall through the 50-day EMA would give the bears a run at the $1.07838 support level.

The 14-period RSI on the 4-hour chart, 50.47, suggests a EUR/USD move to $1.10 before entering overbought territory.

4-Hourly Chart affirmed bullish price signals.
EURUSD 241123 4 Hourly Chart
Silver Prices Forecast: XAG/USD Exhibits Cautious Stance as Fed Decisions Loom

Silver Prices Forecast: XAG/USD Exhibits Cautious Stance as Fed Decisions Loom

Silver’s Weekly Performance Amid Economic Indicators

Silver (XAG/USD) is exhibiting a steady yet slightly downward trend on Friday, heading towards a weekly loss. Traders are shrugging off the weaker US Dollar, while being largely influenced by steady-to-higher Treasury yields. Longer-term traders are following the market’s interpretation of the Federal Reserve’s interest rate strategies.

Influence of the Dollar and Treasury Yields

The dollar index’s continued decline is making silver more affordable for buyers using other currencies. Concurrently, Treasury yields are experiencing a rise after hitting a two-month low, impacting silver’s price. Comex silver futures reflect this trend, showing a modest decrease.

Trading Derivatives carries a high level of risk to your capital and you should only trade with money you can afford to lose. Trading Derivatives may not be suitable for all investors, so please ensure that you fully understand the risks involved, and seek independent advice if necessary. A Product Disclosure Statement (PDS) can be obtained either from this website or on request from our offices and should be considered before entering into a transaction with us. Raw Spread accounts offer spreads from 0.0 pips with a commission charge of USD $3.50 per 100k traded. Standard account offer spreads from 1 pips with no additional commission charges. Spreads on CFD indices start at 0.4 points. The information on this site is not directed at residents in any country or jurisdiction where such distribution or use would be contrary to local law or regulation.

Economic Data and Fed’s Stance

The market is digesting various economic signals, including lower-than-expected weekly jobless claims and the Federal Reserve’s latest meeting minutes. While the minutes did not indicate imminent interest rate cuts, recent data suggest easing inflationary pressures. This has led investors to speculate that the Fed might pause rate hikes, impacting silver prices.

Short-term Forecast and Market Expectations

In the short term, the market anticipates the Fed to maintain current rates in December, with a moderate chance of a rate cut by March.

The upcoming Flash Manufacturing and Services PMI reports will also influence silver’s price direction.

The current market environment, marked by a blend of economic data and Fed speculation, suggests a cautious outlook for silver, with potential for modest movement based on upcoming economic indicators and the Fed’s policy decisions. The best way to describe the XAG/USD market is Fed-dependent.

Technical Analysis

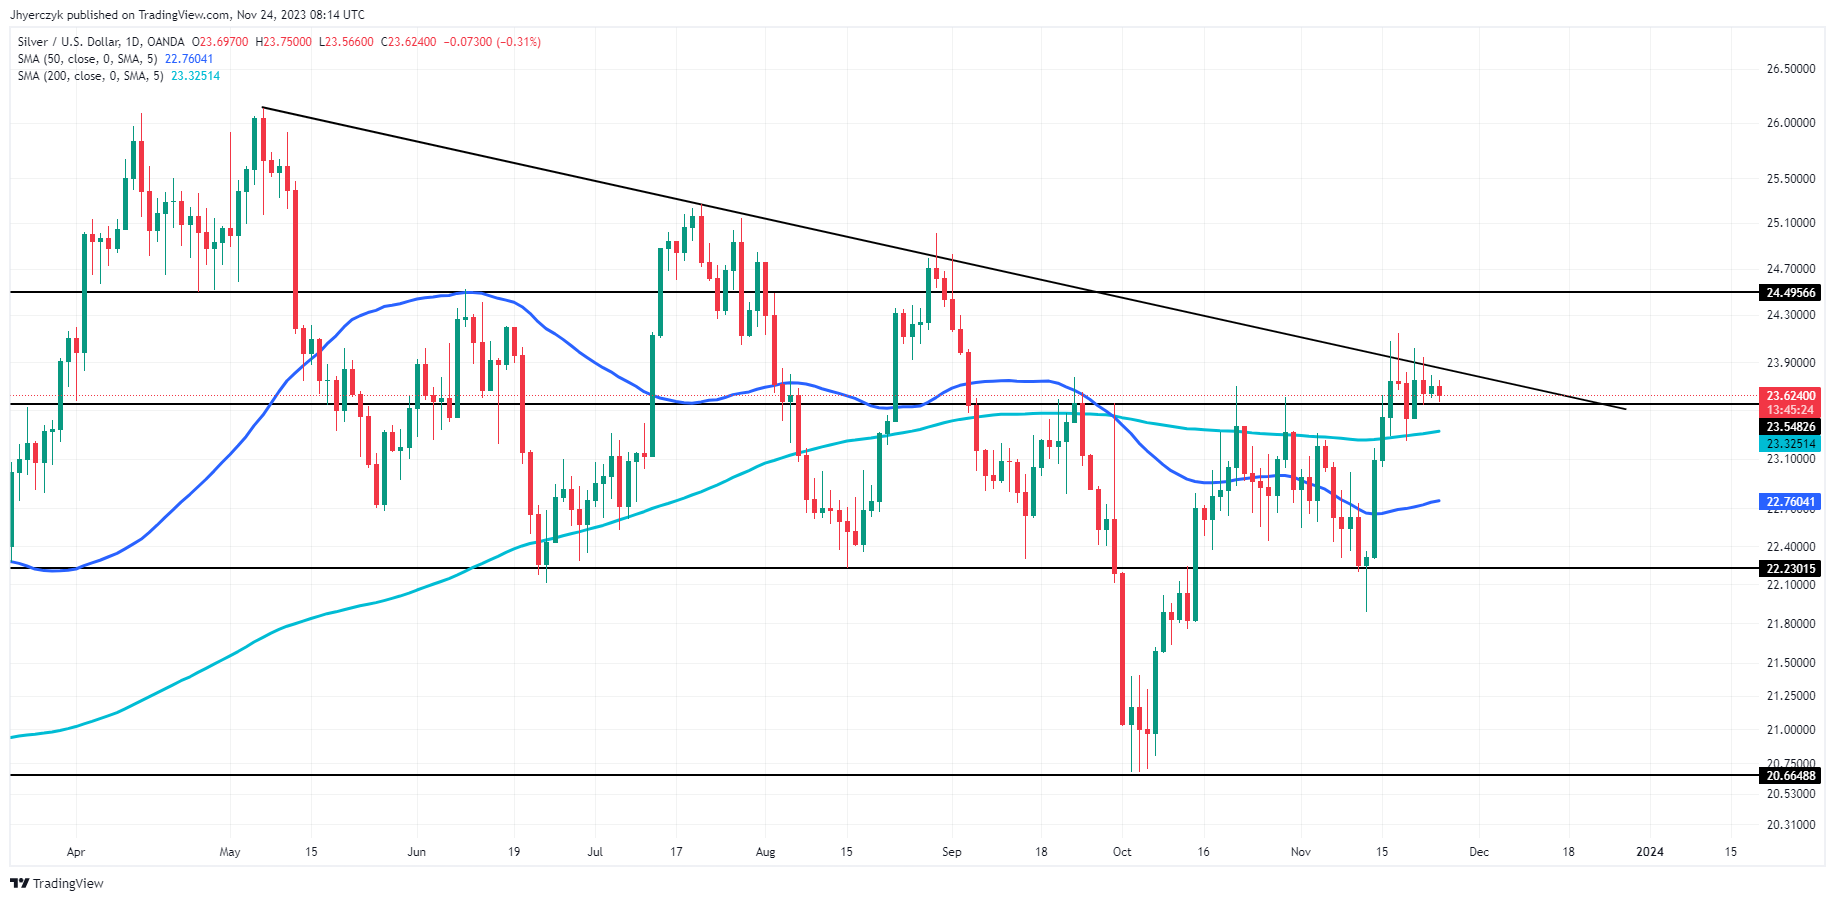
Daily Silver (XAG/USD)Silver (XAG/USD), currently priced at 23.63, is trading above both its 200-day and 50-day moving averages, set at 23.33 and 22.76 respectively. This positioning above these key averages suggests a generally bullish trend in the medium term.

The current price is slightly above the minor support level of 23.55, indicating that this level could act as a pivot in the short term. If the price maintains above this support, it may approach the minor resistance at 24.50. However, a break below this support could see the price testing the main support at 22.23.

Overall, the market sentiment for silver leans towards bullishness, with the potential for upward movement if it sustains above the minor support level.

Furthermore, the triggerpoint for a potential acceleration to the upside is the downtrending resistance line at 23.84.

Gold Prices Forecast: XAU/USD Underpinned by Weak Dollar, Capped by Firm Yields

Gold Prices Forecast: XAU/USD Underpinned by Weak Dollar, Capped by Firm Yields

Gold Eyes Weekly Gains Amid Fed and Dollar Moves

Gold (XAU/USD) prices are trader steady-to-lower on Friday, eyeing a second straight week of gains, influenced by a softer U.S. dollar and traders’ reading of the Federal Reserve’s rate hike plans. The precious metal’s current trend is a reflection of shifting market expectations about the Fed’s next moves. February Comex gold futures are stable at $2014.10, with spot gold showing a minor dip.

Dollar Weakness and Yield Fluctuations

A weaker dollar, heading for another weekly drop, is making gold cheaper for buyers with other currencies. Meanwhile, Treasury yields, which recently dipped to a two-month low, are impacting gold’s upside.

Trading Derivatives carries a high level of risk to your capital and you should only trade with money you can afford to lose. Trading Derivatives may not be suitable for all investors, so please ensure that you fully understand the risks involved, and seek independent advice if necessary. A Product Disclosure Statement (PDS) can be obtained either from this website or on request from our offices and should be considered before entering into a transaction with us. Raw Spread accounts offer spreads from 0.0 pips with a commission charge of USD $3.50 per 100k traded. Standard account offer spreads from 1 pips with no additional commission charges. Spreads on CFD indices start at 0.4 points. The information on this site is not directed at residents in any country or jurisdiction where such distribution or use would be contrary to local law or regulation.

Fed Minutes and Job Data Weigh on Gold

Key factors driving gold’s price include the latest jobless claims data and the Fed’s minutes. While jobless claims dropped more than expected, bond markets as well as gold remained unfazed. The Fed minutes revealed caution about future rate hikes and ongoing high inflation concerns. However, October’s CPI figures, showing easing inflation, add to the complex outlook for gold.

Near-Term Gold Outlook: Mildly Bullish

In the near term, traders are betting on the Fed holding rates steady in December, with some speculation about a possible rate cut by March. Gold’s path will also hinge on today’s manufacturing and services data.

The short-term forecast for gold is mildly bullish, as traders weigh potential dovish shifts from the Fed against mixed economic indicators. The current market environment suggests a window of opportunity for gold to benefit if the Fed signals any easing in its rate hike strategy.

Technical Analysis

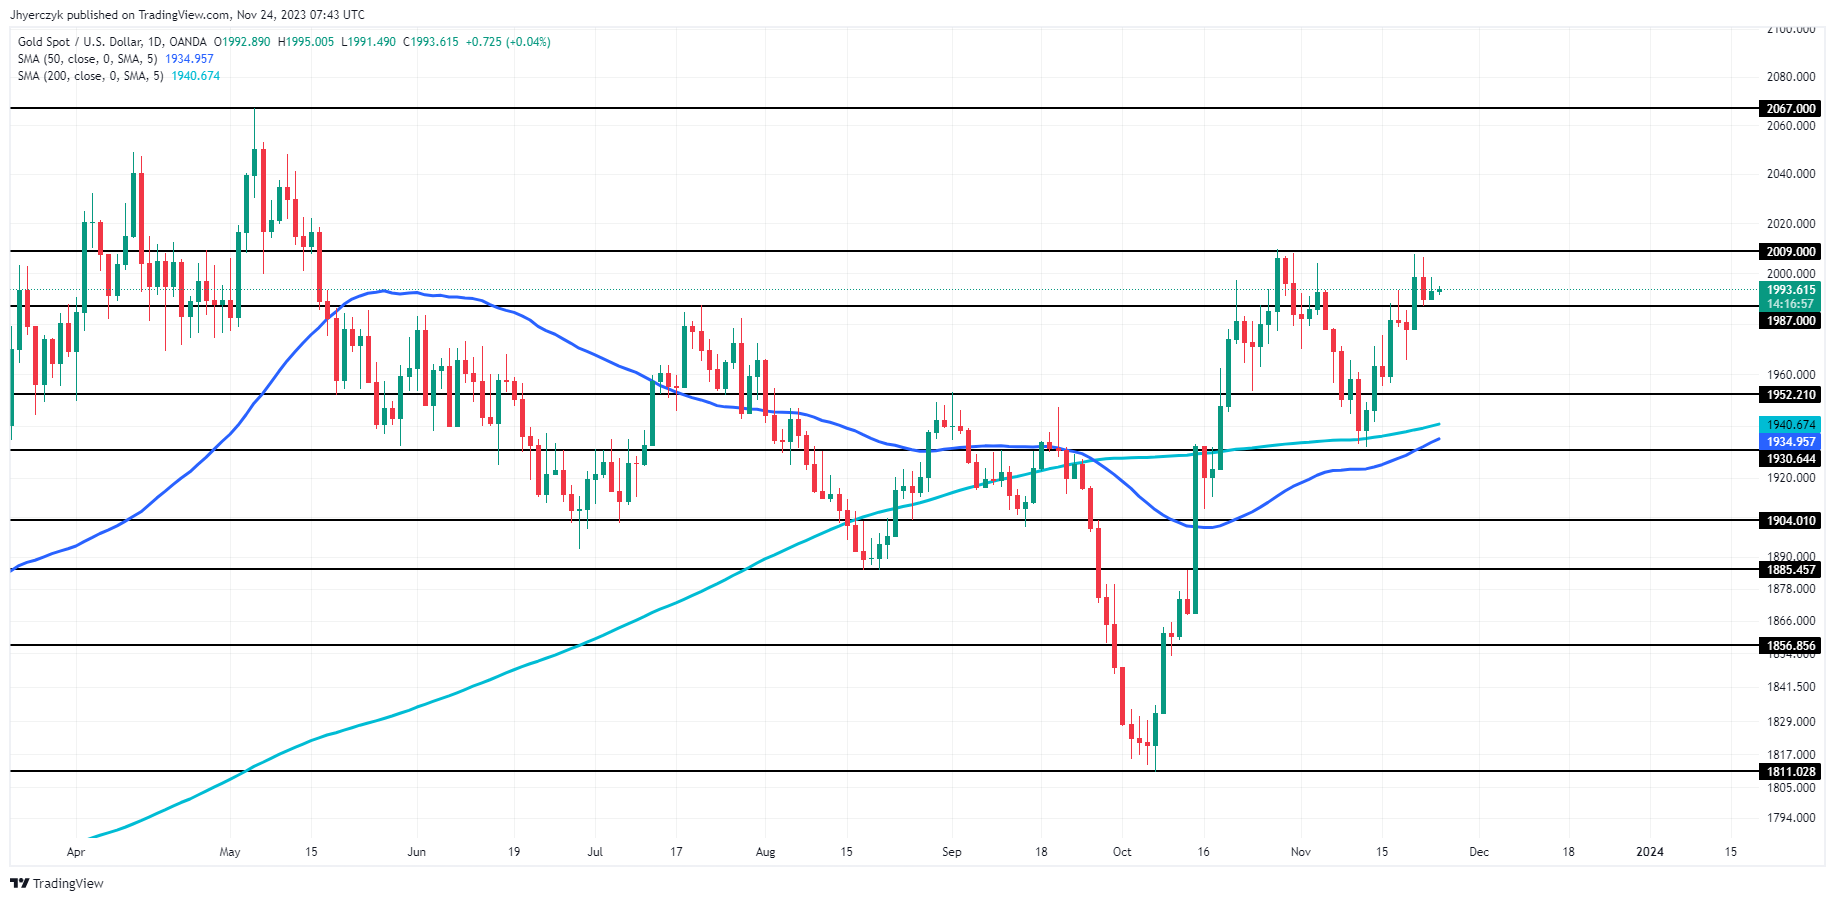
Daily Gold (XAU/USD)Gold (XAU/USD) is currently trading above both its 200-day and 50-day moving averages, which are at 1940.67 and 1934.96 respectively. This positioning above these key moving averages suggests a generally bullish trend in the medium term.

The current price is also hovering near the minor support level of 1987.00, indicating that this level could act as a pivot in the short term.

If the price holds above this support, it may test the minor resistance at 2009.00, and potentially aim for the main resistance at 2067.00. However, a break below the minor support could see the price moving towards the main support at 1952.21.

The overall market sentiment for gold, considering its position relative to these technical indicators, leans towards bullishness, with the possibility of continued upward movement if it maintains above the minor support level.

Ifo Index: German Business Confidence Rises Slightly, Misses Expectations

Ifo Index: German Business Confidence Rises Slightly, Misses Expectations

German Business Morale Shows Modest Improvement

In November, German business sentiment experienced a slight uptick, albeit falling short of market expectations. The Ifo Institute’s recent survey reveals this nuanced shift in the business climate within Europe’s largest economy.

Ifo Business Climate Index Analysis

The Ifo Business Climate Index, a critical barometer for the German economy, registered at 87.3, marginally below the analyst forecast of 87.5 from a Reuters poll. This figure, while indicative of a slight improvement, underscores the cautious optimism among German businesses.

Economic Implications

The modest rise in the Ifo index reflects the complex economic landscape Germany is navigating. Amidst various global economic challenges, this incremental improvement suggests resilience yet underlines the lingering uncertainties in the business sector.

Short-term Economic Outlook

Given the current trajectory indicated by the Ifo index, the short-term outlook for the German economy appears cautiously optimistic. While businesses show signs of resilience, the less-than-expected improvement points towards a steady, but cautious economic recovery path.

Conclusion

This slight variance from expected values in the Ifo Business Climate Index highlights the need for careful monitoring of Germany’s economic health, particularly in the context of broader global economic trends. The data suggests a steady, albeit cautious, progression in business sentiment, crucial for future economic planning and strategy.

Gold Price Forecast – Gold Markets Continue To See Same Barrier In Thin Trading

Gold Price Forecast – Gold Markets Continue To See Same Barrier In Thin Trading

Gold Market Technical Analysis

Gold has rallied a bit during the early hours on Thursday, but keep in mind that it is a very thin session, and the actual open market is not going to be moving during the trading session as it is Thanksgiving in the United States. At this point, the $2000 region continues to be a bit of a barrier, and therefore I think it’s very difficult to rise from here. Furthermore, the market has rallied over the last couple of weeks, and therefore it’s likely that we need to work off some of the potential excess froth anyway.

Trading Derivatives carries a high level of risk to your capital and you should only trade with money you can afford to lose. Trading Derivatives may not be suitable for all investors, so please ensure that you fully understand the risks involved, and seek independent advice if necessary. A Product Disclosure Statement (PDS) can be obtained either from this website or on request from our offices and should be considered before entering into a transaction with us. Raw Spread accounts offer spreads from 0.0 pips with a commission charge of USD $3.50 per 100k traded. Standard account offer spreads from 1 pips with no additional commission charges. Spreads on CFD indices start at 0.4 points. The information on this site is not directed at residents in any country or jurisdiction where such distribution or use would be contrary to local law or regulation.

Looking at the bond market will be crucial, due to the fact that yield has such a huge negative correlation to the gold market, and of course the bond markets are going to be trading over the holiday. With that being the case, there’s probably not a whole lot out there to move the market in the short term. You can also start to argue that that we might be trying to form some type of double top in this region as well, so all of this comes together for the likelihood of consolidation to take over the market again.

Underneath, we have the 50-Day EMA, the 38.2% Fibonacci level, and uptrend line, and the 200-Day EMA within a $30 range. In other words, there is a lot of support underneath it could come in and lift the market, and quite frankly I think a pullback at this point probably attracts people looking at that region.

However, if we were to break above the most recent high, then it allows the market to go looking toward the $2100 level, possibly even higher than that. You could make a little bit of an assumption that eventually we could go higher, but that doesn’t mean you should jump into the market right away without some type of confirmation. After all, this looks a lot like a market that you should be able to pick up “cheap gold” if you are patient enough, and by most metrics, that will be exactly what you should be doing at the moment.

EUR/USD Forecast – Euro Gives Up the Initial Push Higher

EUR/USD Forecast – Euro Gives Up the Initial Push Higher

Euro vs US Dollar Technical Analysis

The euro rallied significantly during the course of the trading session on Thursday but gave back gains rather quickly as we continue to see a lot of noise above the 1.09 level. The 1.0850 level underneath offer support, while the 1.10 level above offers resistance. Ultimately, this is an area that I think we continue to go back and forth and over the next couple of trading sessions, and it’s probably worth noting that Thursday was Thanksgiving in the United States, so obviously liquidity would have been a bit of an issue later in the day anyway.

Trading Derivatives carries a high level of risk to your capital and you should only trade with money you can afford to lose. Trading Derivatives may not be suitable for all investors, so please ensure that you fully understand the risks involved, and seek independent advice if necessary. A Product Disclosure Statement (PDS) can be obtained either from this website or on request from our offices and should be considered before entering into a transaction with us. Raw Spread accounts offer spreads from 0.0 pips with a commission charge of USD $3.50 per 100k traded. Standard account offer spreads from 1 pips with no additional commission charges. Spreads on CFD indices start at 0.4 points. The information on this site is not directed at residents in any country or jurisdiction where such distribution or use would be contrary to local law or regulation.

Regardless, we had shot straight up in the air rather rapidly, and now will have to work on some of the excess froth. In this sense, the analysis hasn’t changed much, meaning that we are essentially hanging around and trying to sort out whether or not we can continue to go higher, or if we are going to turn around and break down below the 1.0850 level underneath, which open up the possibility of a move down to the 200-Day EMA. That obviously would be a significant selloff, but quite frankly another thing to pay attention to is the fact that we had pressed against the 61.8% Fibonacci level a couple of days ago, and therefore those who are still bullish on the US dollar may be looking to short this market.

Ultimately, I do think that we have a lot of noisy behavior, and I would be a bit surprised if Friday ended up being the day that we broke out of this range, mainly due to the fact that unless there’s some type of external factor, North America will of course be thin as far as volume is concerned again, due to the fact that most traders will not only take off Thanksgiving, but take off the following day as well. In general, the market continues to be more choppiness than anything else, so at that point in time I think you’ve got to look at this more or less through a short-term prism but recognizing that the high and the low of the consolidation range being broken could give you an idea as to where we are going to go for a bigger move.

DAX Index, FTSE 100, STOXX 600: European Stocks Show Mixed Trends Amid Diverse Market Forces

DAX Index, FTSE 100, STOXX 600: European Stocks Show Mixed Trends Amid Diverse Market Forces

European Markets Mixed Amid Global Uncertainties

European stocks showed mixed performance on Thursday, with major indices like Germany’s DAX and the UK’s FTSE 100 displaying varied trends amidst a closed U.S. market. The DAX saw a slight increase, while the FTSE 100 experienced a marginal decline. The broader STOXX 600 index remained relatively stable with a minimal gain.

Sectoral Shifts and Economic Indicators

In sectoral developments, oil and gas stocks outperformed despite a continued decline in oil prices, while travel stocks saw a downturn. Economic data from the eurozone indicated a contraction in business activity, albeit at a slower pace, and a decrease in employment for the first time in nearly three years, underscoring the region’s economic challenges.

Trading Derivatives carries a high level of risk to your capital and you should only trade with money you can afford to lose. Trading Derivatives may not be suitable for all investors, so please ensure that you fully understand the risks involved, and seek independent advice if necessary. A Product Disclosure Statement (PDS) can be obtained either from this website or on request from our offices and should be considered before entering into a transaction with us. Raw Spread accounts offer spreads from 0.0 pips with a commission charge of USD $3.50 per 100k traded. Standard account offer spreads from 1 pips with no additional commission charges. Spreads on CFD indices start at 0.4 points. The information on this site is not directed at residents in any country or jurisdiction where such distribution or use would be contrary to local law or regulation.

Political Developments and Currency Movements

Political factors also influenced market sentiments, with investors closely watching the Dutch election results, where right-wing populist Geert Wilders’ party is poised for a significant victory. In the UK, the pound sterling strengthened against the U.S. dollar and the euro, following better-than-expected business activity data, which marked a return to growth in November.

UK Fiscal Announcements and Economic Outlook

The UK’s economic outlook was further shaped by recent fiscal announcements, including tax cuts. However, the Office for Budget Responsibility downgraded growth forecasts and raised inflation projections. This scenario was mirrored in the FTSE 100’s performance, which started positively, reflecting responses to the autumn statement’s 110 measures announced by Jeremy Hunt.

Socio-Economic Challenges and Income Disparities

The economic policies have ignited debates over income disparities, with analyses suggesting that the richest in the UK stand to gain more from the recent tax and benefit changes. This period is marked by challenges of a slower-growing Britain in an era of higher interest rates, raising concerns over household income stagnation and the broader impact on socio-economic conditions.

DAX Index Technical Analysis

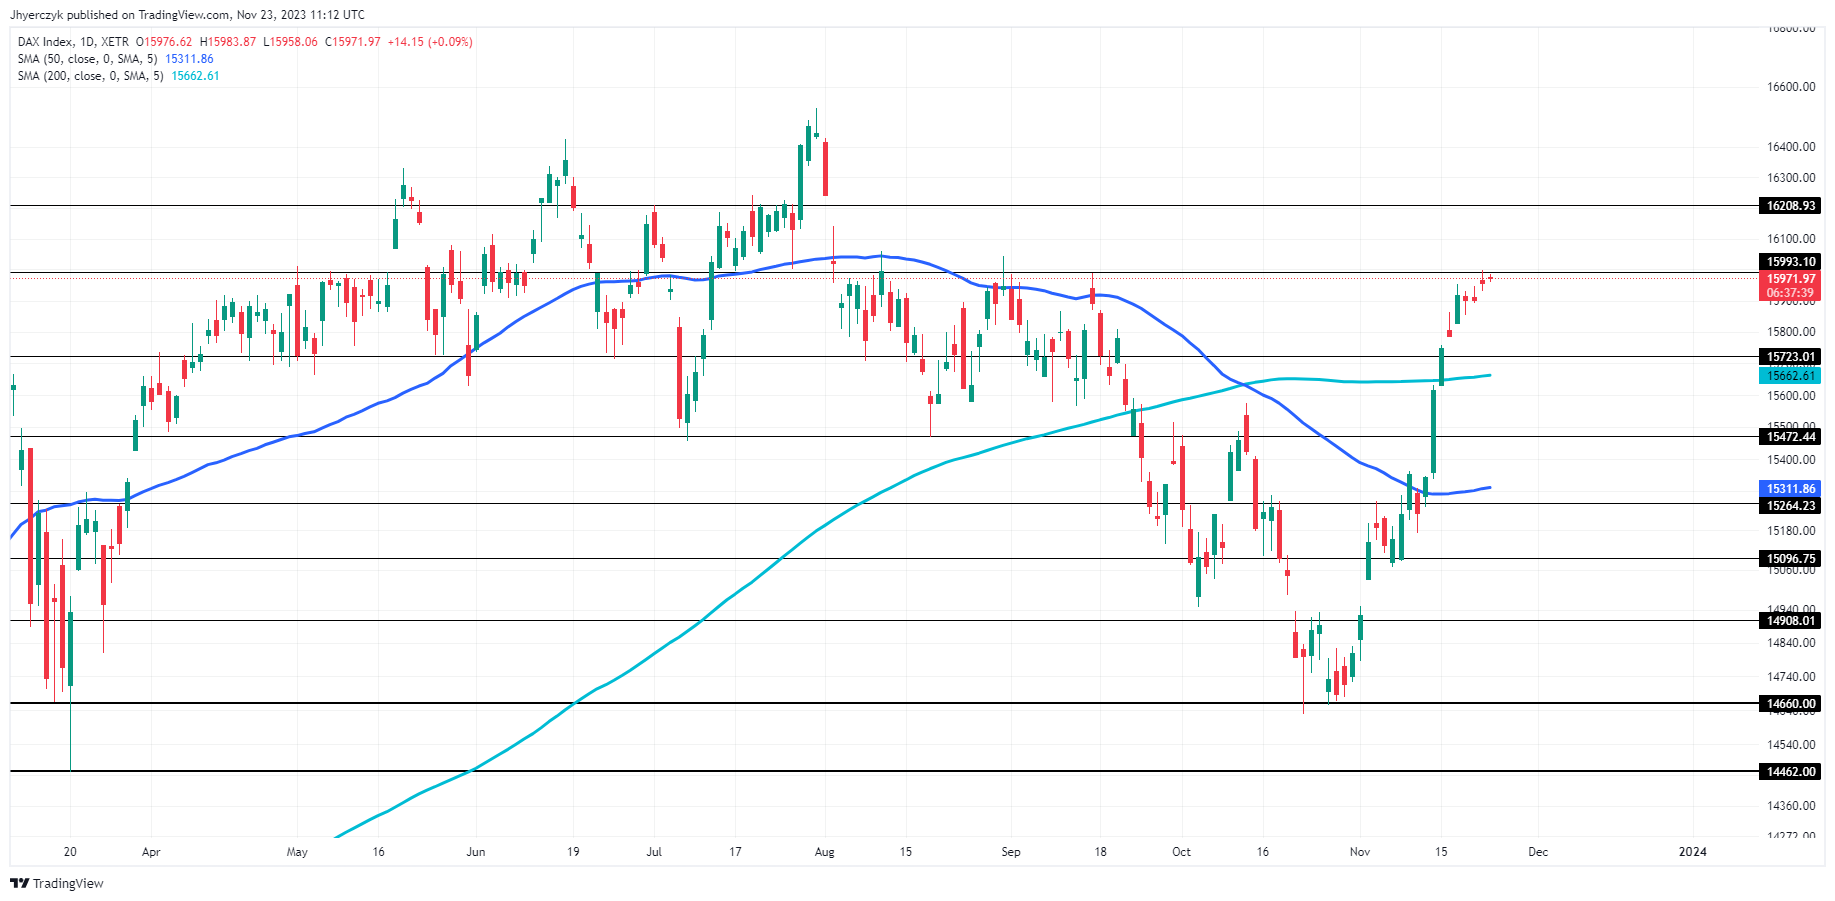
Daily DAX IndexThe DAX Index, currently positioned at 15972.82, is exhibiting bullish signals. It is trading above both its 200-day and 50-day moving averages, at 15662.61 and 15311.87 respectively, indicating a strong upward trend over both the medium and long term.

The index is hovering close to its minor resistance level at 15993.10, suggesting the potential for further upward movement if this resistance is breached.

Given its current position above the main support level of 15472.44, the market sentiment for the DAX Index appears bullish.

This positive outlook is reinforced by its standing above key moving averages, reflecting sustained investor confidence and market strength.

FTSE 100 Index Technical Analysis

Daily FTSE 100 Index

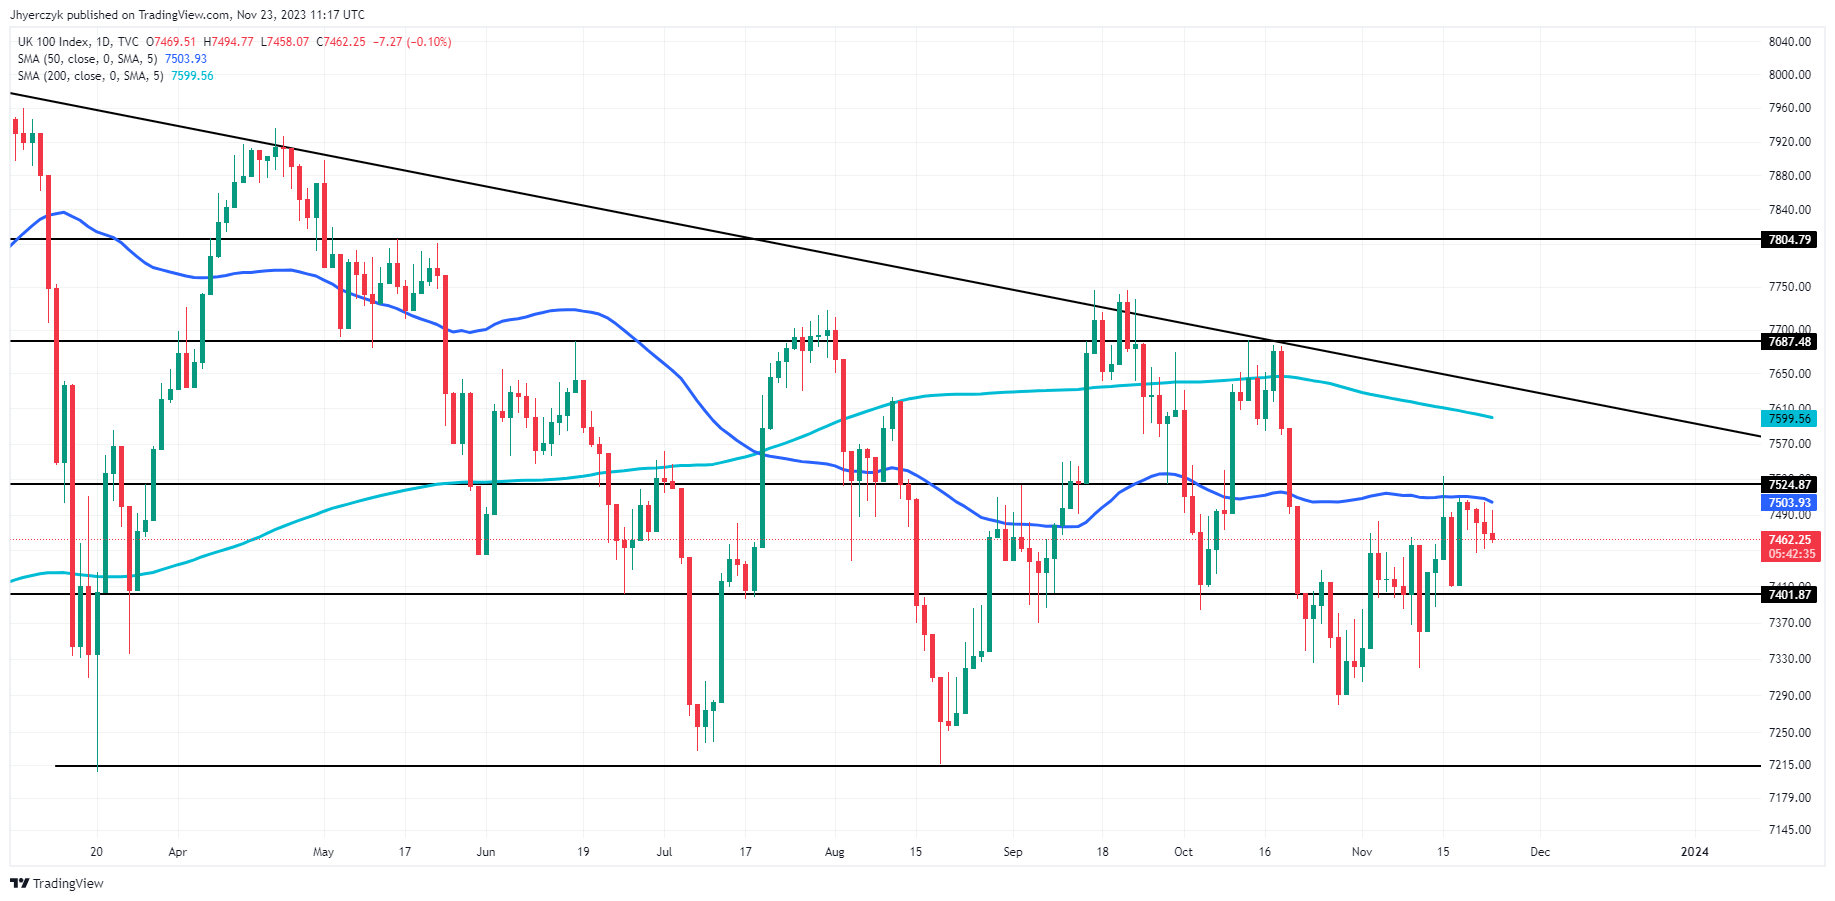
The FTSE 100 Index is currently below its 200-day and 50-day moving averages, which stand at 7599.56 and 7503.89, respectively. This positioning suggests a bearish trend in the longer term.

The Index’s current level is closer to its minor support of 7401.87 and well above the main support at 7213.00, indicating some stability in the near term.

However, being below the minor resistance of 7524.87 and far from the main resistance at 7687.48, the market sentiment for the FTSE 100 appears bearish. This bearish trend is further reinforced by its position relative to the key moving averages.