AUD/USD Price Forecast: Positive Start for Aussie Dollar

AUD/USD Price Forecast: Positive Start for Aussie Dollar

AUSTRALIAN DOLLAR FUNDAMENTAL BACKDROP

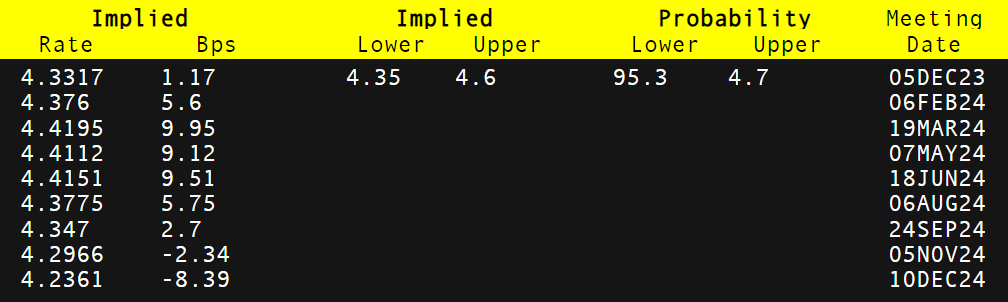
The Australian dollar capitalized on last week’s close above the 0.6500 psychological handle this Monday morning as markets mull over global monetary policy. Recent weak US economic data particularly from the labor market saw US Treasury yields slip alongside USD weakness. Australian jobs data was quite the opposite with unemployment holding steady while employment change beat estimates. Inflation expectations have pushed higher and that could place more pressure on the Reserve Bank of Australia (RBA) to sustain tight monetary policy with the possibility of additional interest rate hikes. Looking at money market pricing below, it is evident that markets have left the door open for more tightening. That being said, incoming data will be crucial for guidance around central bank strategy.

RBA INTEREST RATE PROBABILITIES

image1.png

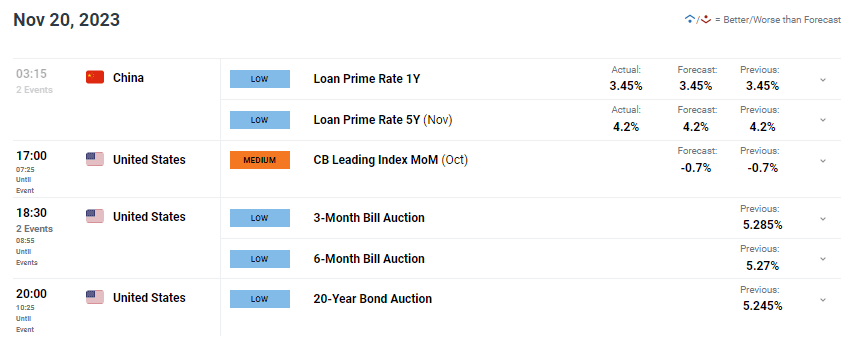
Supplementing the AUD this morning was the fact that China kept both its LPR rates steady after recent economic data showed some improvement. Prior stimulus measures may now be bearing fruit with markets viewing this in a positive light. Commodity prices are mostly bid across the board on the back of a weaker dollar and optimism around China – the pro-growth AUD thus benefitted. The economic calendar for the rest of the trading day looks to be relatively muted but tomorrow’s slew of RBA speakers, RBA minutes and FOMC minutes will likely bring some volatility to the pair.

AUD/USD ECONOMIC CALENDAR (GMT +02:00)

image2.png

Source: DailyFX economic calendar

TECHNICAL ANALYSIS

AUD/USD DAILY CHART

image3.png

Chart prepared by Warren Venketas, TradingView

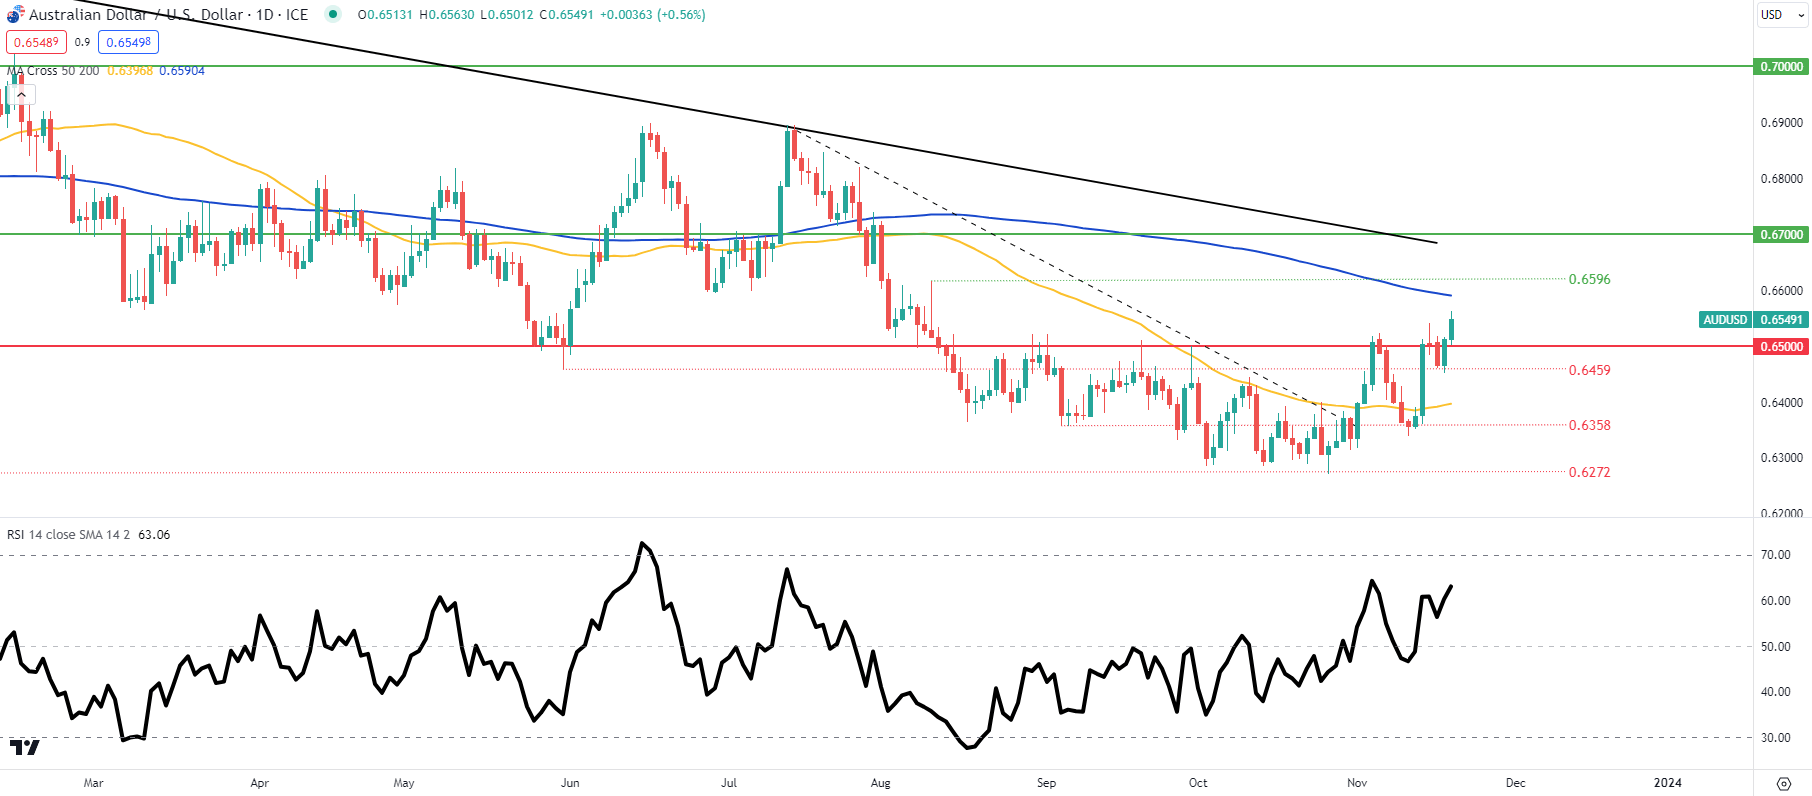
AUD/USD daily price action above has now confidently broken above the 0.6500 level and head towards the 200-day moving average (blue). Bearish/negative divergence remains in play via the Relative Strength Index (RSI) and could unfold with a peak around the 200-day MA resistance zone.

How to Read a Candlestick Chart

How to Read a Candlestick Chart

What is a candlestick chart?

A candlestick chart is simply a chart composed of individual candles, which traders use to understand price action. Candlestick price action involves pinpointing where the price opened for a period, where the price closed for a period, as well as the price highs and lows for a specific period.

Price action can give traders of all financial markets clues to trend and reversals. For example, groups of candlesticks can form patterns which occur throughout forex charts that could indicate reversals or continuation of trends. Candlesticks can also form individual formations which could indicate buy or sell entries in the market.

The period that each candle depicts depends on the time-frame chosen by the trader. A popular time-frame is the daily time-frame, so the candle will depict the open, close, and high and low for the day. The different components of a candle can help you forecast where the price might go, for instance if a candle closes far below its open it may indicate further price declines.

Boost your chart patterns expertise with our interactive quiz!

Our Forex Trading Patterns Quiz will test your knowledge of some of the most important trading patterns. Take the test today by clicking on the link and raise your technical analysis game!

Interpreting a candle on a candlestick chart

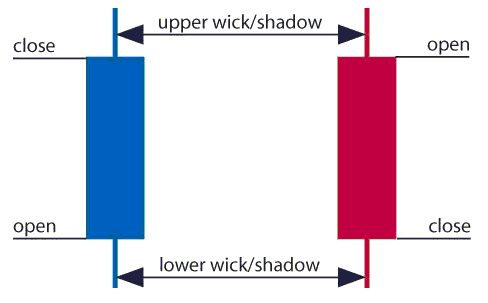
The image below represents the design of a typical candlestick. There are three specific points (open, close, wicks) used in the creation of a price candle. The first points to consider are the candles’ open and close prices. These points identify where the price of an asset begins and concludes for a selected period and will construct the body of a candle. Each candle depicts the price movement for a certain period that you choose when you look at the chart. If you are looking at a daily chart each individual candle will display the open, close, upper and lower wick of that day.

A red and a blue candlestick with open and close wicks

Open price:

The open price depicts the first price traded during the formation of the new candle. If the price starts to trend upwards the candle will turn green/blue (colors vary depending on chart settings). If the price declines the candle will turn red.

High Price:

The top of the upper wick/shadow indicates the highest price traded during the period. If there is no upper wick/shadow it means that the open price or the close price was the highest price traded.

Low Price:

The lowest price traded is the either the price at the bottom of the lower wick/shadow and if there is no lower wick/shadow then the lowest price traded is the same as the close price or open price in a bullish candle.

Close Price:

The close price is the last price traded during the period of the candle formation. If the close price is below the open price the candle will turn red as a default in most charting packages. If the close price is above the open price the candle will be green/blue (also depends on the chart settings).

The Wick:

The next important element of a candlestick is the wick, which is also referred to as a ‘shadow’. These points are vital as they show the extremes in price for a specific charting period. The wicks are quickly identifiable as they are visually thinner than the body of the candlestick. This is where the strength of candlesticks becomes apparent. Candlesticks can help traders keep our eye on market momentum and away from the static of price extremes.

Direction:

The direction of the price is indicated by the color of the candlestick. If the price of the candle is closing above the opening price of the candle, then the price is moving upwards and the candle would be green (the color of the candle depends on the chart settings). If the candle is red, then the price closed below the open.

Range:

The difference between the highest and lowest price of a candle is its range. You can calculate this by taking the price at the top of the upper wick and subtracting it from the price at the bottom of the lower wick. (Range = highest point – lowest point).

Having this knowledge of a candle, and what the points indicate, means traders using a candlestick chart have a clear advantage when it comes to distinguishing trendlines, price patterns and Elliot waves.

Bar Chart vs Candlestick Chart

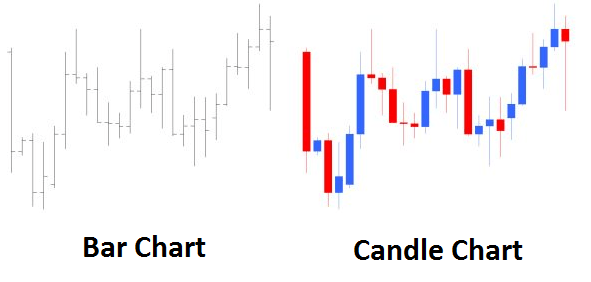
As you can see from the image below, candlestick charts offer a distinct advantage over bar charts. Bar charts are not as visual as candle charts and nor are the candle formations or price patterns. Also, the bars on the bar chart make it difficult to visualize which direction the price moved.

Difference between bar chart and candle chart

How to read a candlestick chart

There are various ways to use and read a candlestick chart. Candlestick chart analysis depends on your preferred trading strategy and time-frame. Some strategies attempt to take advantage of candle formations while others attempt to recognize price patterns.

Interpreting single candle formations

Individual candlesticks can offer a lot of insight into current market sentiment. Candlesticks like the Hammer, shooting star, and hanging man, offer clues as to changing momentum and potentially where the market prices maytrend.

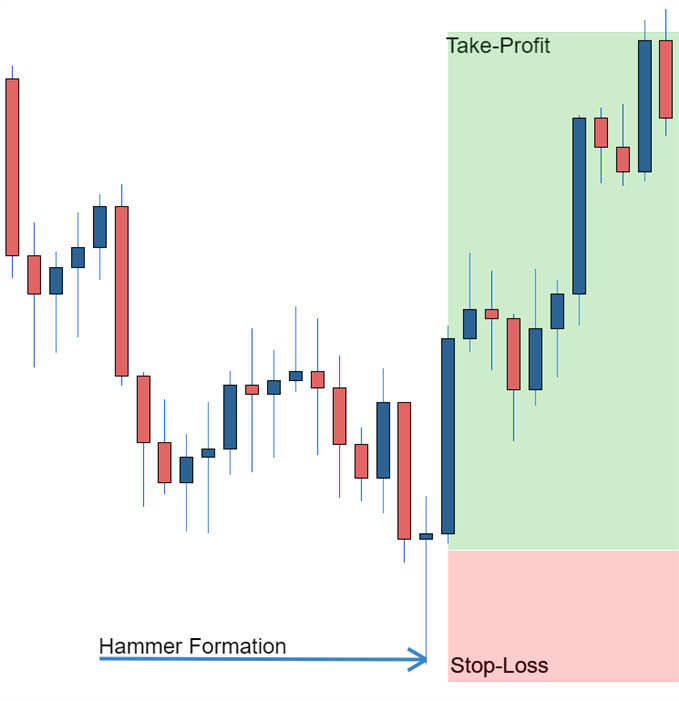
As you can see from the image below the Hammer candlestick formation sometimes indicates a reversal in trend. The hammer candle formation has a long lower wick with a small body. Its closing pricing is above its opening price. The intuition behind the hammer formation is simple, price tried to decline but buyers entered the market pushing the price up. It is a bullish signal to enter the market, tighten stop-losses or close out a short position.

Traders can take advantage of hammer formations by executing a long trade once the hammer candle has closed. Hammer candles are advantageous because traders can implement ‘tight’ stop-losses (stop-losses that risk a small amount of pips). Take-profits should be placed in such a way as to ensure a positive risk-reward ratio. So, the take-profit is larger than the stop-loss.

Hammer formation showing stop loss

Recognizing price patterns in multiple candles

Candlestick charts help traders recognize price patterns that occur in the charts. By recognizing these price patterns, like the bullish engulfing pattern or triangle patterns you can take advantage of them by using them as entries into or exit signals out the market.

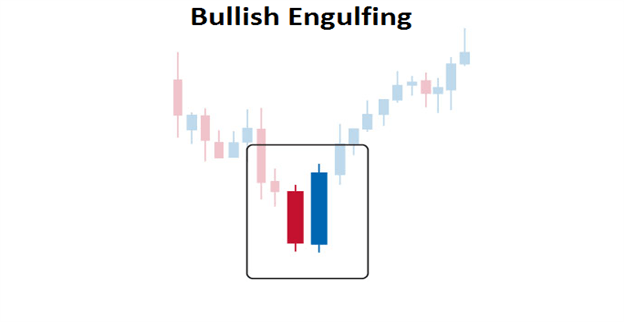
For example, in the image below we have the bullish engulfing price pattern. The bullish engulfing is a combination of a red candle and a blue candle that ‘engulfs’ the entire red candle. It is an indication that it could be the end of a currency pairs established weakness. A trader would take advantage of this by entering a long position after the blue candle closes. Remember, the price pattern only forms once the second candle closes.

As with the hammer formation, a trader would place a stop loss below the bullish engulfing pattern, ensuring a tight stop loss. The trader would then set a take-profit. For more forex candlestick charts check our forex candlesticks guide where we go in depth into the advantages of candlestick charts as well as the strategies that can be implemented using them.

Bullish engulfing pattern

Further tips for reading candlestick charts

When reading candlestick charts, be mindful of:

Yen Update: What’s Behind the Recent Yen Strength?

Yen Update: What’s Behind the Recent Yen Strength?

Broad Japanese Yen Strength Observed on Friday

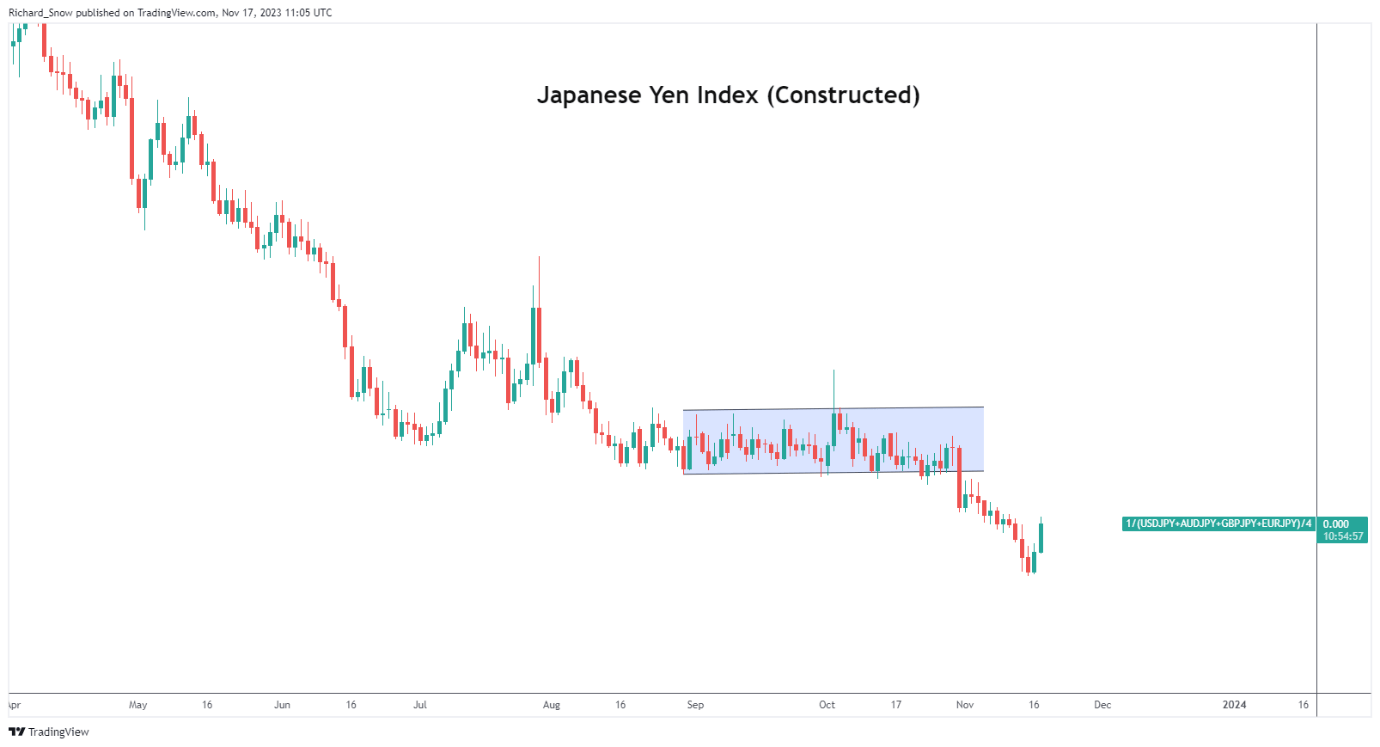
Comments from the Japanese finance ministry and from Bank of Japan Governor (BoJ) Kazuo Ueda inspired a late comeback in the yen across major FX pairs. The yen has otherwise experienced broad weakness despite the recent moves lower in the dollar on a worsening economic outlook for the world’s largest economy.

However, the finance ministry’s Akazawa confirmed that any FX intervention will be aimed at arresting market volatility and Tokyo won’t intervene just because the currency is weakening. Taking this statement at face value, it would be reasonable to assume this meant FX intervention may not be as imminent as many may have believed, causing further weakness in the yen. Comments from BoJ Governor Ueda also lacked any sense of urgency, reaffirming that policy will only change if inflation is expected to be sustainably above target. However, markets saw this as an opportunity to claw back recent losses heading into the end of the week.

Japanese Index – Simple Weighted Average (USD/JPY, GBP/JPY, AUD/JPY, EUR/JPY)

image1.png

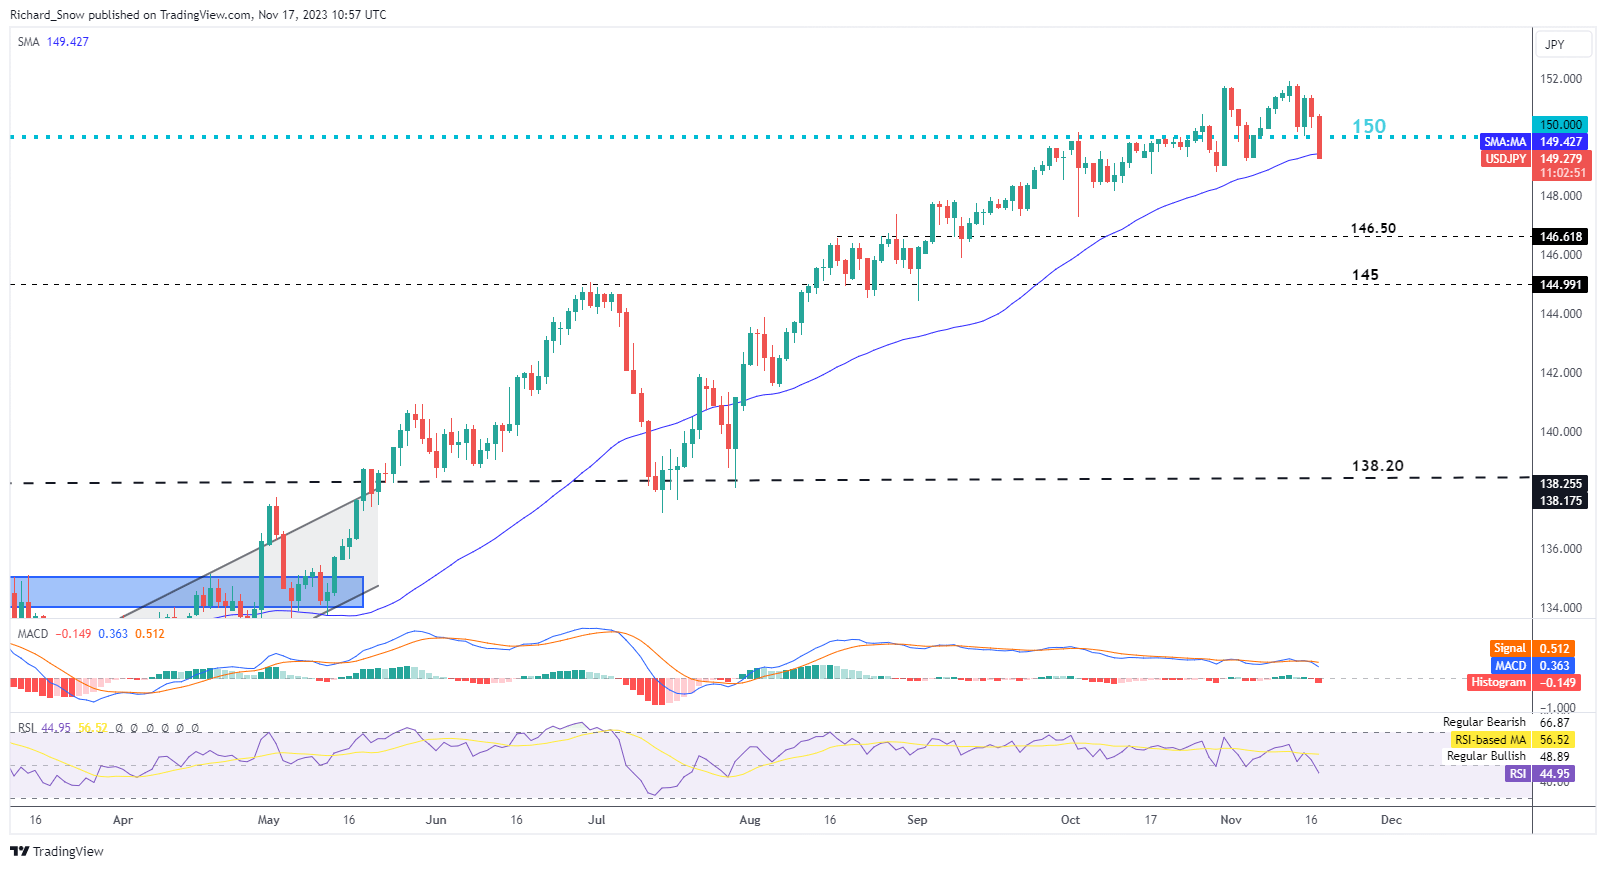
USD/JPY headed lower in Friday after comments from Tokyo and BoJ officials, trading well below the 150 mark once again. Markets have become more brazen, trading above the supposed tripwire for the next round of FX intervention (150) in the absence of push back from top officials.

Top currency officials may be more tolerant of yen weakness given oil prices have dropped notably in the past weeks. The net importer of oil will breathe a slight sigh of relief now that oil prices are under pressure – allowing the export industry to capitalize on its greater price competitiveness. USD/JPY now tests the 50-day simple moving average (SMA) as dynamic support but the recent inability of the yen to build on any appreciation suggests a bearish continuation may be hard to come by or require an additional catalyst.

USD/JPY Daily Chart

image2.png

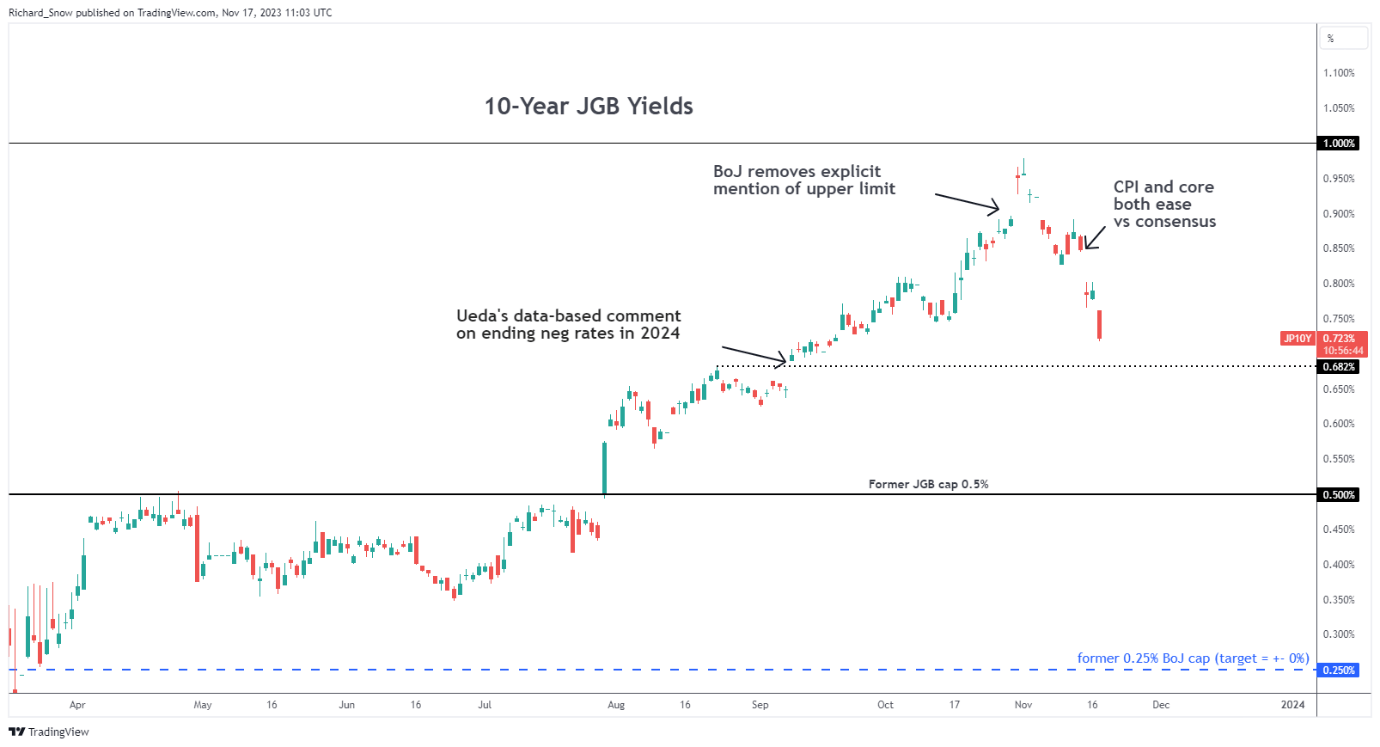
Bond yields head lower in sympathy with the global trend. Japanese bond yields are notably lower than after the latest yield curve control tweaks but the yen has shown signs of strength regardless. The real question is how sustainable will it prove to be?

10-Year Japanese Government Bond Yields (JGBs)

image3.png

Major Event Risk Ahead

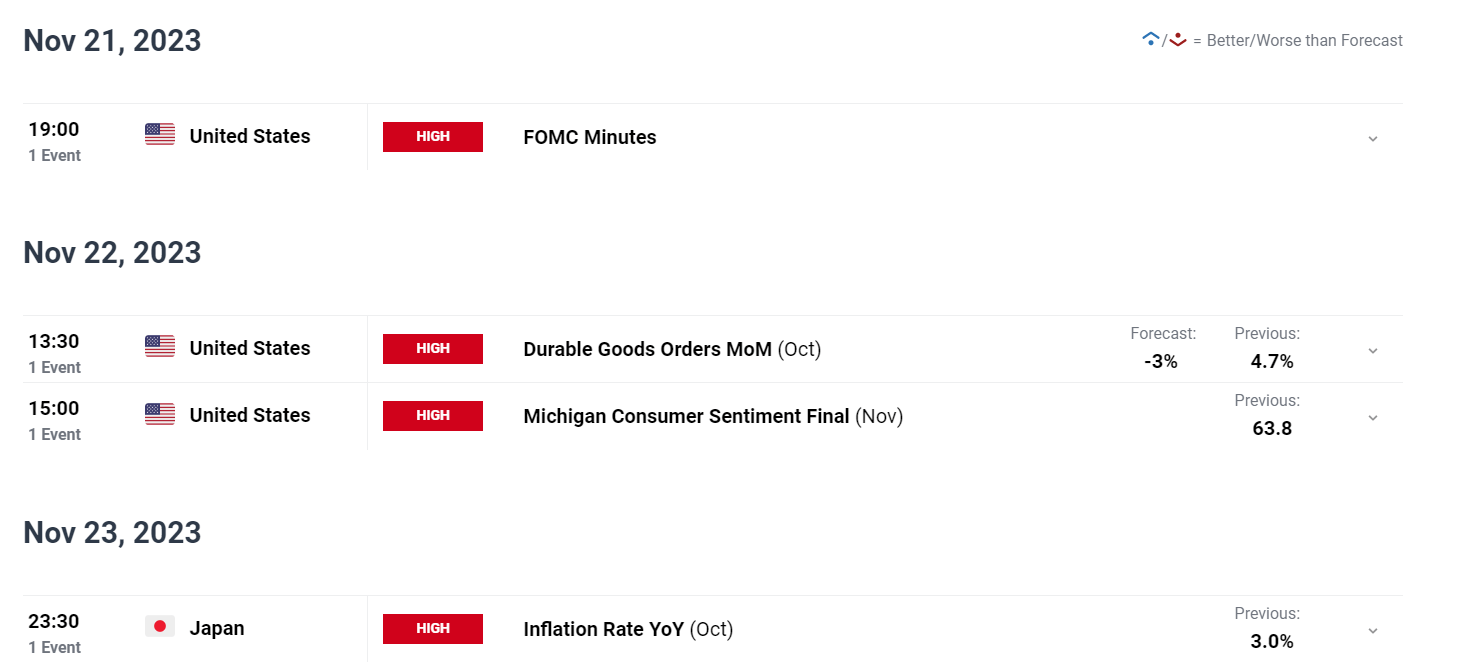
Next week the economic is fairly light across the board but we do get FOMC minutes to read over. With US rates now most likely at their peak, markets will be looking for further signs/ risks of overtightening now that the risk of not doing enough and doing too much has become more balanced. Softer US data has already led the Fed funds futures market to bring forward rate cuts in 2024 with nearly 100 bps worth of cuts expected.

Then, towards the end of the week, Japan releases inflation data. The BoJ is still collecting data before making a decision to withdrawn from its negative interest rate regime; seeking compelling evidence of demand driven inflation that will breach 2% in a stable and sustainable manner as well as witnessing sustainable wage growth. The majority if analysts polled by Reuters see the end of negative rates in 2024.

image4.png


FTSE 100, DAX 40 and Nasdaq Rallies are Taking a Breather​​​

FTSE 100, DAX 40 and Nasdaq Rallies are Taking a Breather​​​

FTSE 100, DAX 40, Nasdaq 100 Analysis and Charts

FTSE 100 rallies on softer US and UK inflation

​​A host of large-cap dividend payments on Thursday put the FTSE 100 on the back foot, together with disappointing results from Burberry’s with its share price dropping by over 10%.

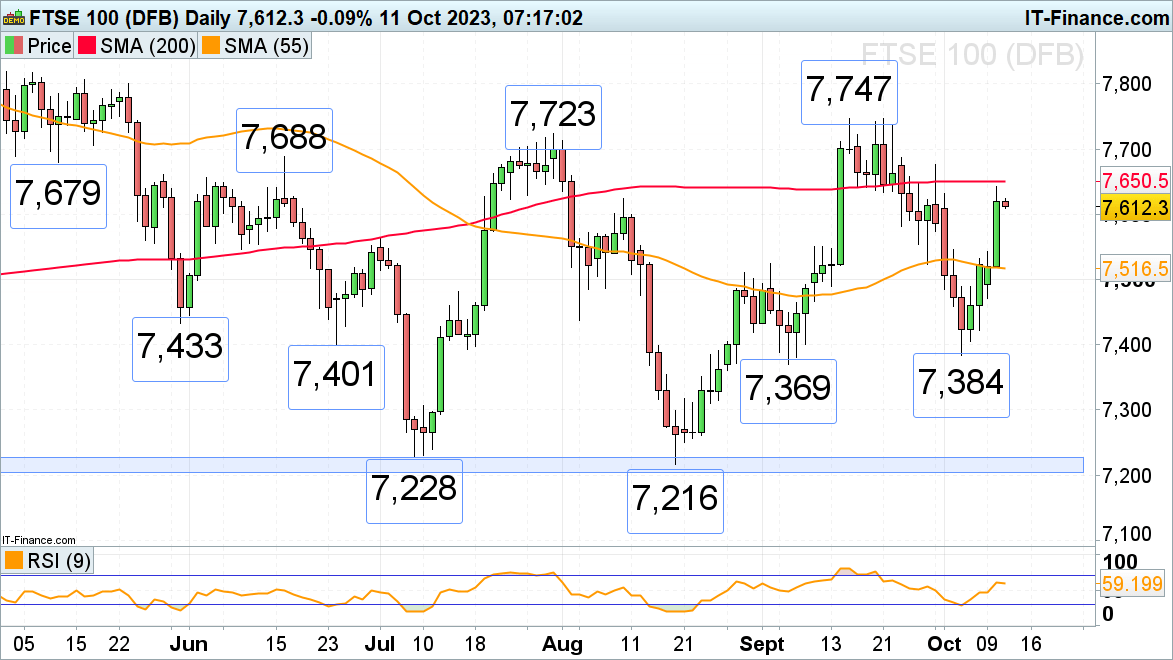
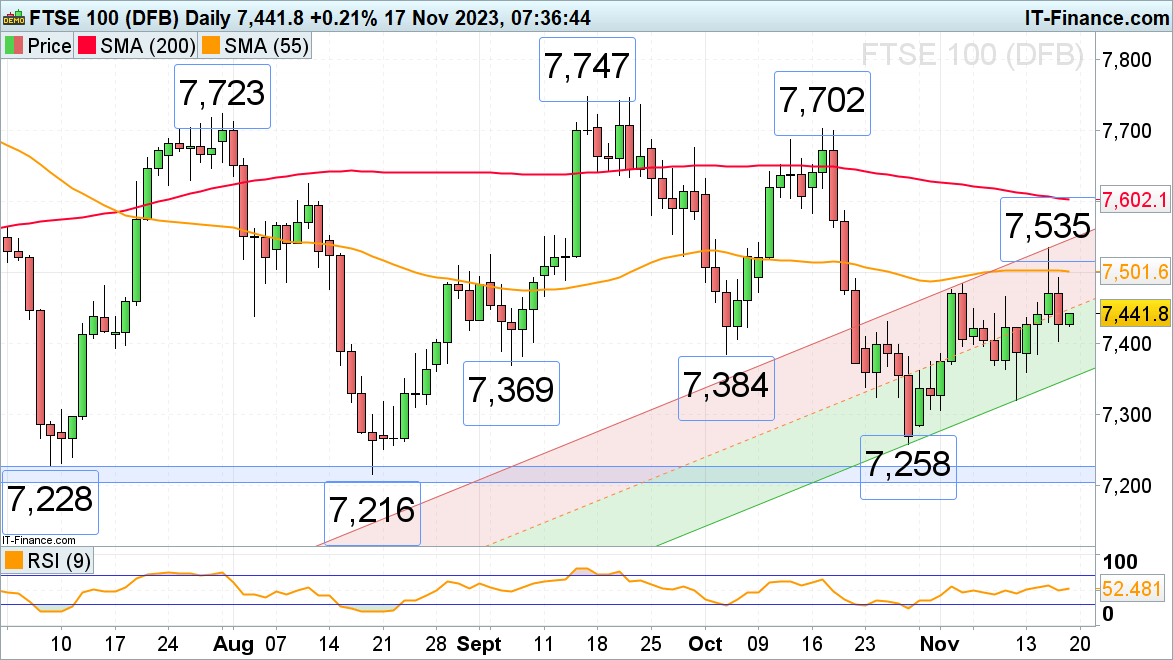
​Early Friday morning UK retail sales slid to their lowest level since the 2021 COVID-19 lockdown, by 0.3% in October 2023, following a downwardly revised fall of 1.1% in September. This did not prevent the FTSE 100 from recovering from Thursday’s low at 7,403. While it holds, the 9 November high at 7,466 may be reached. Further up sits more significant resistance between the early November high and the 55-day simple moving average (SMA) at 7,484 to 7,501.

​Support below Thursday’s 7,430 low can be found between the early September and early October lows at 7,384 to 7,369.

FTSE 100 Daily Chart

​DAX 40 trades in two-month high

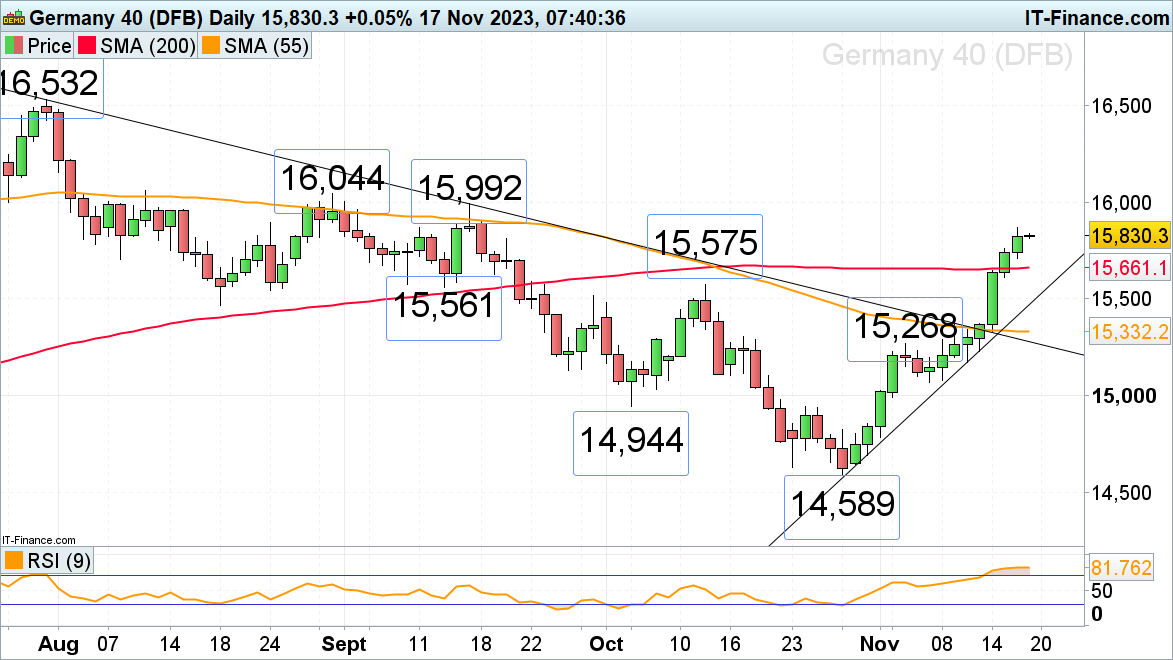
​The DAX 40 continues to rise, having so far seen eight consecutive days of gains, and is approaching the August and September highs at 15,992 to 16,044 which may short-term cap.

​Minor support below Thursday’s 15,710 low can be seen along the 200-day simple moving average at 15,661.Further down lie the early October high at 15,575 and the mid-September low at 15,561.

DAX 40 Daily Chart

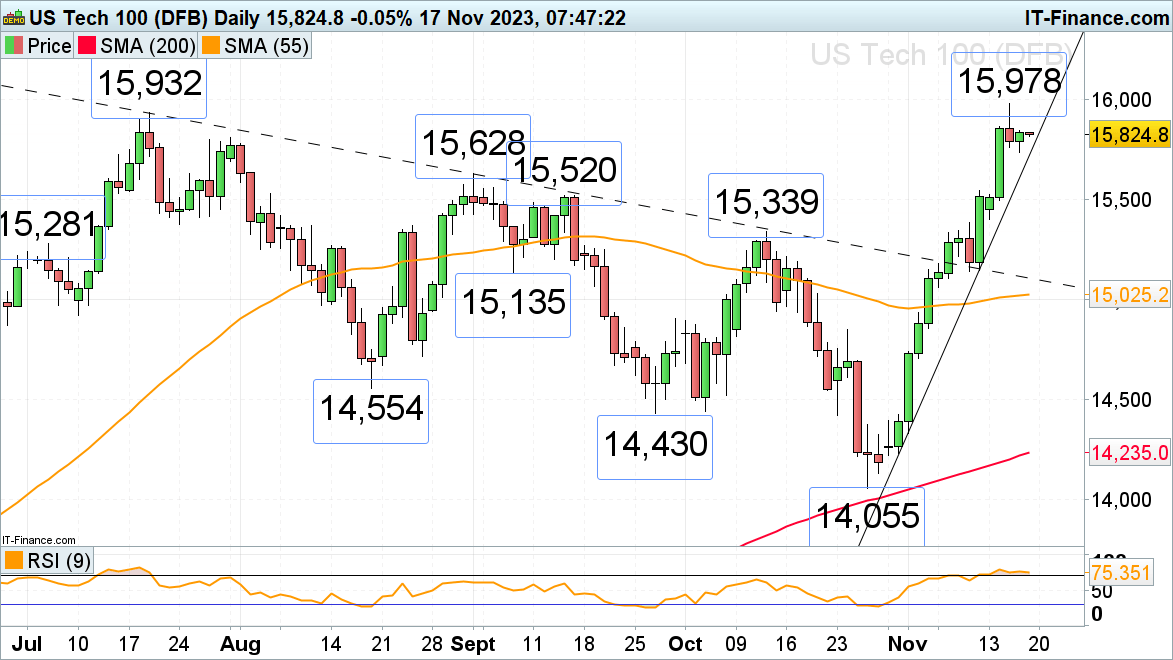
​​The Nasdaq 100’s 12% rally off its late October low has taken the index to its July high which is short-term thwarting the advance ahead of the weekend amid profit taking and as the US’ largest retailer WalMart tumbles 8% amid a cautious outlook for consumer spending.

​While the July and current November highs at 15,932 to 15,978 cap, Thursday’s low at 15,736, and the steep October-to-November uptrend line at 15,724 are likely to be revisited. Good support can be found between the 15,628 to 15,520 early to mid-September highs, though.

​A rise above 15,978 would engage the December 2021 high at 16,660.

Nasdaq 100 Daily Chart

Lagarde Outlines Europe’s Path Through Global Economic Shifts

Lagarde Outlines Europe’s Path Through Global Economic Shifts

European Central Bank President Christine Lagarde said on Friday the critical juncture Europe is facing, with challenges such as deglobalization, shifting demographics, and the urgent need for decarbonization. During her address at the European Banking Congress, Lagarde emphasized the potential fragmentation of the global economy into competing blocs, underlining the need for strategic adjustments in Europe.

Demographic Shifts and Climate Concerns

Lagarde pointed out that Europe is expected to see a decline in its working-age population starting as early as 2025, alongside increasing climate disasters. These changes necessitate a “generational effort” in terms of investment and innovation. She underscored the need for Europe to adapt its supply chains to be safer, more efficient, and geographically closer, in response to new trade barriers.

Digitalization and Green Transition

The shift towards digitalization and the green transition were highlighted as critical areas for investment. Lagarde estimated that the EU’s green transition requires an additional investment of 620 billion euros annually until 2030, with another 125 billion euros per year needed for digital transformation. These significant investments aim to enable Europe to maintain productivity with a shrinking workforce and to advance its environmental goals.

Financial Challenges and Solutions

Addressing financial constraints, Lagarde noted the high debt levels of governments since World War II and the impending end of European recovery funding in 2026. She stressed the vital role of banks but cautioned against overburdening them with risks. This brings into focus the proposed capital markets union (CMU), aiming to create a unified market for capital in Europe, similar to the U.S. model.

The Capital Markets Union Prospect

The ongoing discussions about the CMU envision a single market that facilitates the free flow of investments and savings across the EU. This initiative is expected to benefit consumers, investors, and companies throughout Europe, irrespective of their location. The goal is to create a more integrated, efficient, and resilient European financial system to support the continent’s economic transformation.

How and When to Buy or Sell in Forex Trading

How and When to Buy or Sell in Forex Trading

What it means to buy and sell forex

Buying and selling forex pairs involves estimating the appreciation/depreciation in value of one currency against the other. This could involve fundamental or technical analysis as a foundation of the trade. Once a basis has been formed, the trader will look to other technical and fundamental aspects. Key levels of entry and exit will follow, keeping in mind risk management processes.

Forex buy and sell quote with spread

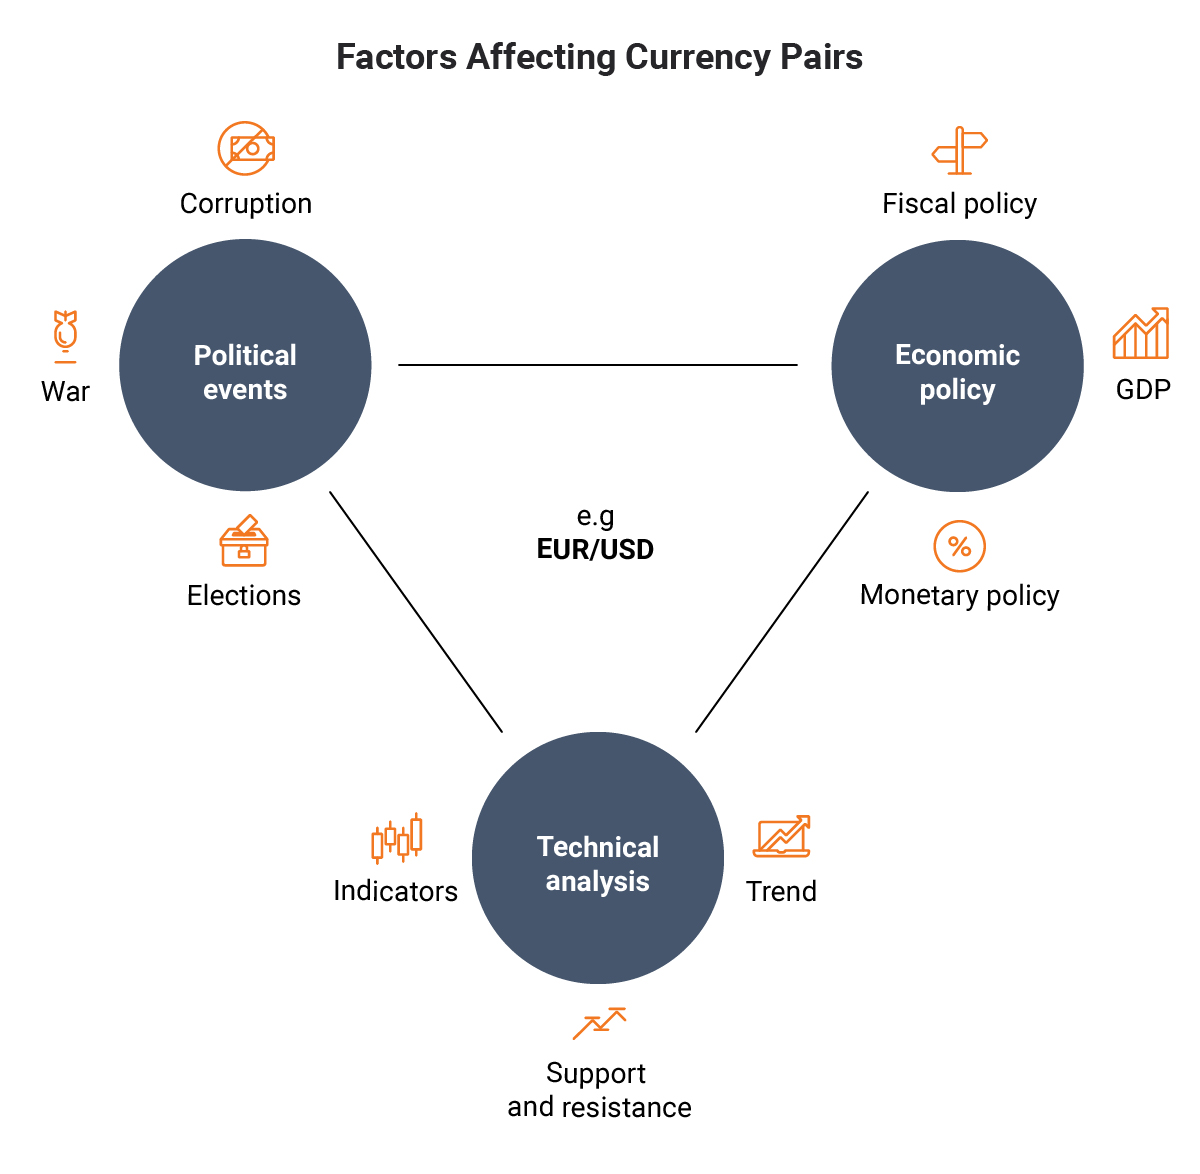
Factors which affect currency pairs

factors which affect currency pairs

Government instability, corruption and changes in government can affect the value of a currency – for example, when president Donald Trump was elected the Dollar soared in value!

Economic policy

From a fundamental standpoint, forex traders keep a close eye on unemployment figures, GDP, monetary and fiscal policies (just to name a few) which have influence over the value of currencies. Our economic calendar shows upcoming events which may shake up the financial markets.

Technical analysis

Technical traders tend to favor key price levels (support & resistance), trends and other indicators to form a basis for their forex trades.

How to buy and sell EUR/USD

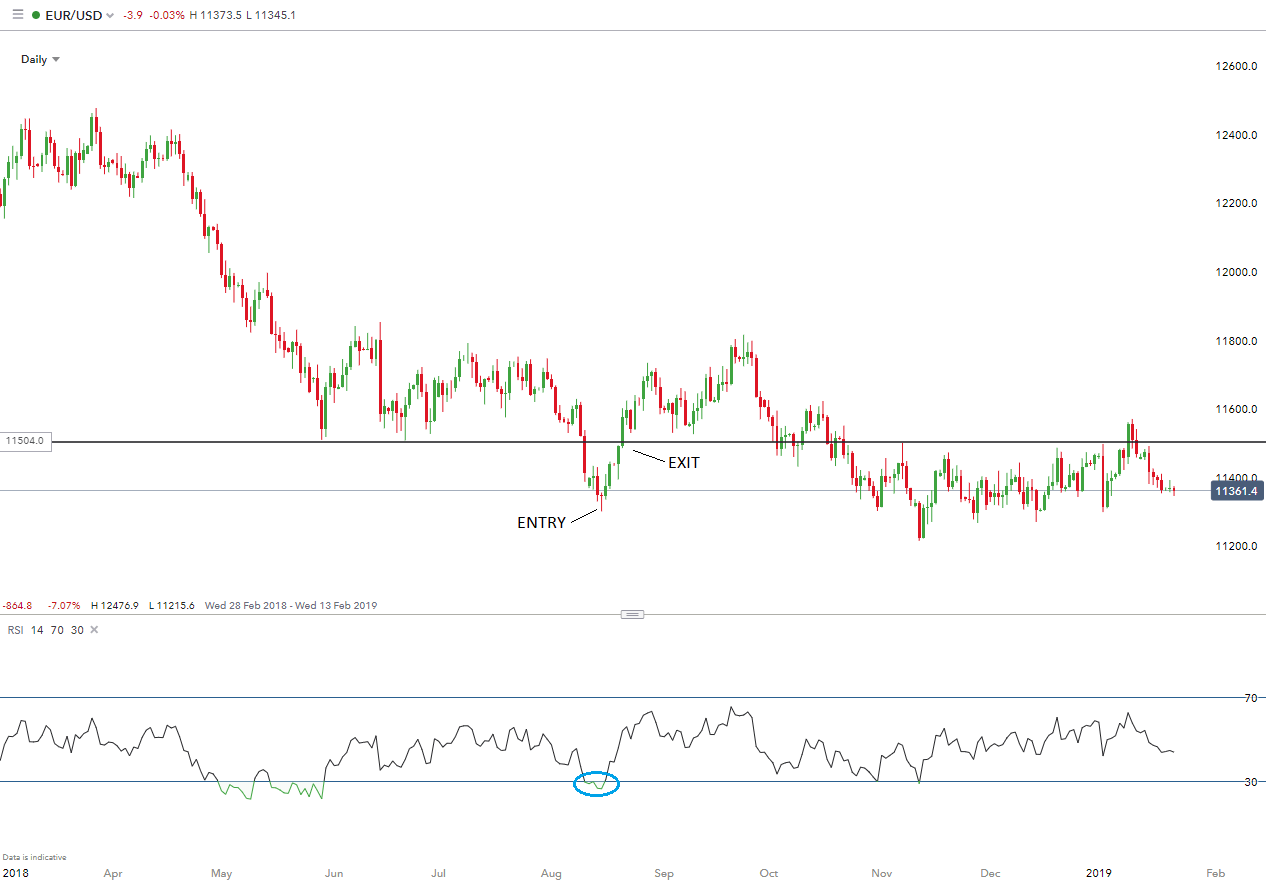
Using the EUR/USD currency pair, we will provide an example of how and when to buy or sell forex. Let’s say you want to buy the EUR/USD. If the EUR goes up in value relative to the USD once the trade is sold, you could have made a profit (depending on commission and other fees). A trader in this example would be buying the EUR and selling the USD at the same time. As an example, if the EUR/USD pair was bought at 11300 and the pair moved up to 11504 at the time that the trade was closed/exited, the profit on the trade would have been 204 pips. This is shown in the chart below.

Chart showing USD/JPY pair

In this example the technical perspective was utilized:

  • Entry level – Morning star candlestick pattern shows a potential entry point, which was substantiated by the use of the RSI indicator which displays an oversold signal.
  • Exit level – Using key price levels of to set initial take profit level.

Similarly, a fundamental trader could trade the USD/JPY currency pair by following political and economic news. For example, if a fundamental trader expected the Fed to hike interest rates, this may attract greater foreign investment into the US, and thus more demand for the home currency (USD). The trader could then look to enter into a long (buy) position in anticipation of the USD to appreciating in value. Of course, this is not absolutely certain as economic principals/theory do not always translate to real world conditions. Taking short positions on forex pairs is slightly more complex as opposed to buying. Read more on how to short forex to gain more insight.

Understanding risk management when buying and selling forex

Risk management is essential to longevity in forex trading. This does not simply include a positive risk/reward ratio but understanding the potential swings in volatility as well. Factors affecting forex pairs can have significant impacts at times so preventing adverse effects on your trade can be managed by implementing proper risk management techniques. Buying and selling forex can be complex, therefore understanding the mechanics behind it, such as how to read currency pairs, is essential prior to initiating a trade. We also recommend reading our forex guide for beginners to get a crash course on the basics of forex trading.

Silver Prices Forecast: XAG/USD Skyrockets on Fed Rate Pause Speculation

Silver Prices Forecast: XAG/USD Skyrockets on Fed Rate Pause Speculation

Silver’s Strong Weekly Performance Amid Fed Speculations

Silver (XAG/USD) prices have seen a significant uptick this week, marking an 8.43% increase, buoyed by investor speculation that the U.S. Federal Reserve may pause its interest rate hikes. This surge in silver, a traditionally non-yielding asset, comes as the dollar weakens and Treasury yields remain low. Investors are closely watching the $25.82 mark, anticipating a potential breakthrough based on economic signals and geopolitical factors.

Influential Economic Indicators

Key U.S. economic indicators have played a crucial role in shaping these market expectations. The unchanged consumer price index and a marginal rise in the core rate in October, coupled with a notable drop in producer prices, have signaled weaker inflationary pressures than expected. Additionally, a rise in unemployment claims suggests a shift in the labor market, potentially aiding the Fed’s anti-inflation efforts.

Trading Derivatives carries a high level of risk to your capital and you should only trade with money you can afford to lose. Trading Derivatives may not be suitable for all investors, so please ensure that you fully understand the risks involved, and seek independent advice if necessary. A Product Disclosure Statement (PDS) can be obtained either from this website or on request from our offices and should be considered before entering into a transaction with us. Raw Spread accounts offer spreads from 0.0 pips with a commission charge of USD $3.50 per 100k traded. Standard account offer spreads from 1 pips with no additional commission charges. Spreads on CFD indices start at 0.4 points. The information on this site is not directed at residents in any country or jurisdiction where such distribution or use would be contrary to local law or regulation.


Lower Interest Rates Boost Silver’s Investment Appeal

The prospect of lower interest rates has increased silver’s appeal, particularly as its price hovers above the critical support level of $21.92. A decline in the dollar value makes silver more affordable for buyers using other currencies, while the low Treasury yields add to its allure. Recent data indicating a slowdown in inflation has reinforced investor belief in a potential halt to the Fed’s rate hikes.

Central Bank Demand Influencing Silver’s Bullish Trend

Central banks, notably China, continue to increase their silver reserves, providing a steady demand for the metal. This trend, along with the recent economic data, points towards a market that is increasingly bullish on silver. Investors remain cautiously optimistic, with expectations of a dovish turn in Fed policy amidst subsiding inflation.

Short-Term Outlook

With the Federal Reserve’s next meeting in December, the market is eagerly awaiting its decision on interest rates. In the meantime, sentiment has turned bullish.

Recent economic figures have raised questions about the timing of potential rate cuts, with many investors betting on a pause in rate hikes. Despite Fed Chairman Jerome Powell’s previous indications of possible further hikes, the current market sentiment leans towards unchanged rates in the upcoming meeting.

Technical Analysis

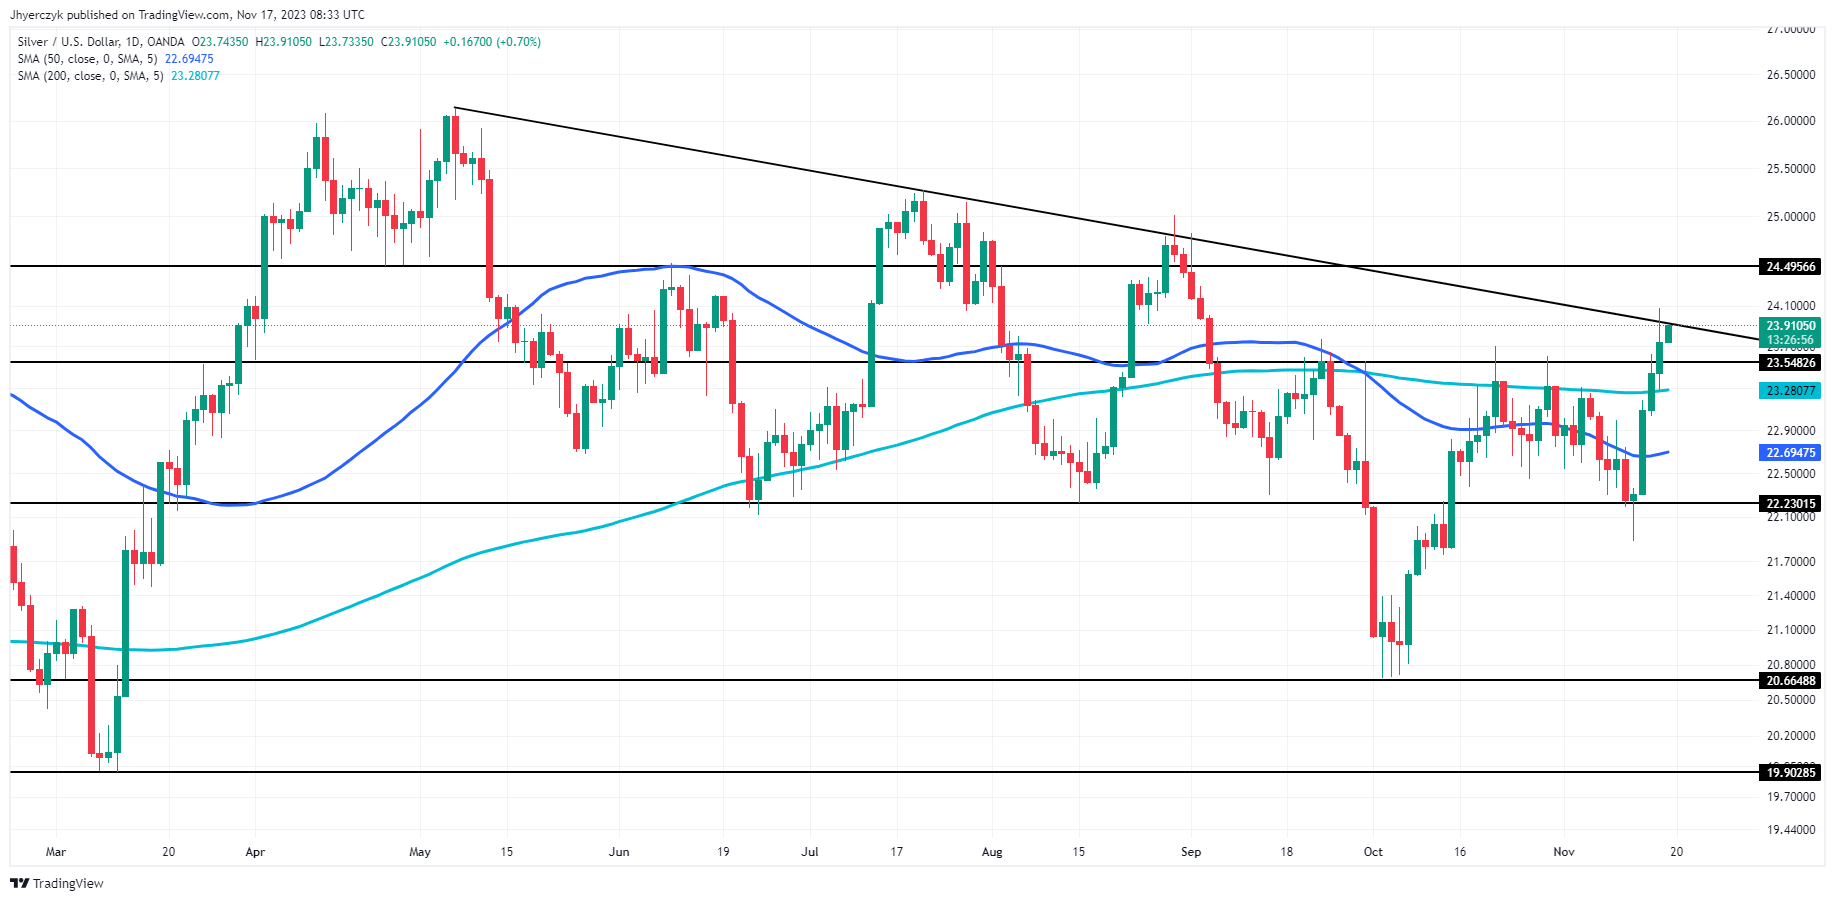
Daily Silver (XAG/USD)Silver (XAG/USD), currently trading at 23.87, is positioned above both its 200-day and 50-day moving averages, indicating a bullish trend.

This price level is also above the minor support of 23.55 and approaching the trend line resistance at 23.94, suggesting potential for further upward movement.

The proximity to the minor resistance at 24.50 could indicate a test of this level soon.

The overall market sentiment for silver appears bullish, considering its position relative to key moving averages and support levels, coupled with its approach towards notable resistance levels.

UK Retail Sales Unexpectedly Fall in October Opening the Door to Rate Cut Talks

UK Retail Sales Unexpectedly Fall in October Opening the Door to Rate Cut Talks

UK Retail Sales

On Friday, UK retail sales figures drew investor interest. In October, UK retail sales unexpectedly fell by 0.3% after falling 1.1% in September. Core retail sales declined by 0.1% after declining by 1.3% in September. Economists forecast retail and core retail sales to increase by 0.3% and 0.4%, respectively.

According to the Office for National Statistics,

  • Automotive fuel sales tumbled by 2.0% in October, while food store sales fell by 0.3%.
  • There were reports of more cautious spending on alcohol and tobacco and specialist food stores, which registered 10.4% and 4.2% falls in sales.
  • Non-food store sales slipped by 0.2%.
  • Retailers attributed the fall in non-food store sales to living costs, a downward trend in footfall, and bad weather.
  • Non-store retailing increased by 0.8%, partially recovering from a 2.4% slump in September.

The retail sales figures completed a full picture of the UK economy. Earlier in the week, UK wage growth and inflation numbers sent mixed signals to the Bank of England. Wage growth remained elevated, suggesting a positive outlook for consumer spending. In contrast, softer-than-expected inflation numbers suggested a weaker demand environment.

The latest retail sales report suggests consumers are tightening their belts. Significantly, the BoE may consider the softer-than-expected inflation and retail sales reports as reasons to begin discussing rate cuts.

GBP/USD Reaction to the UK Retail Sales Report

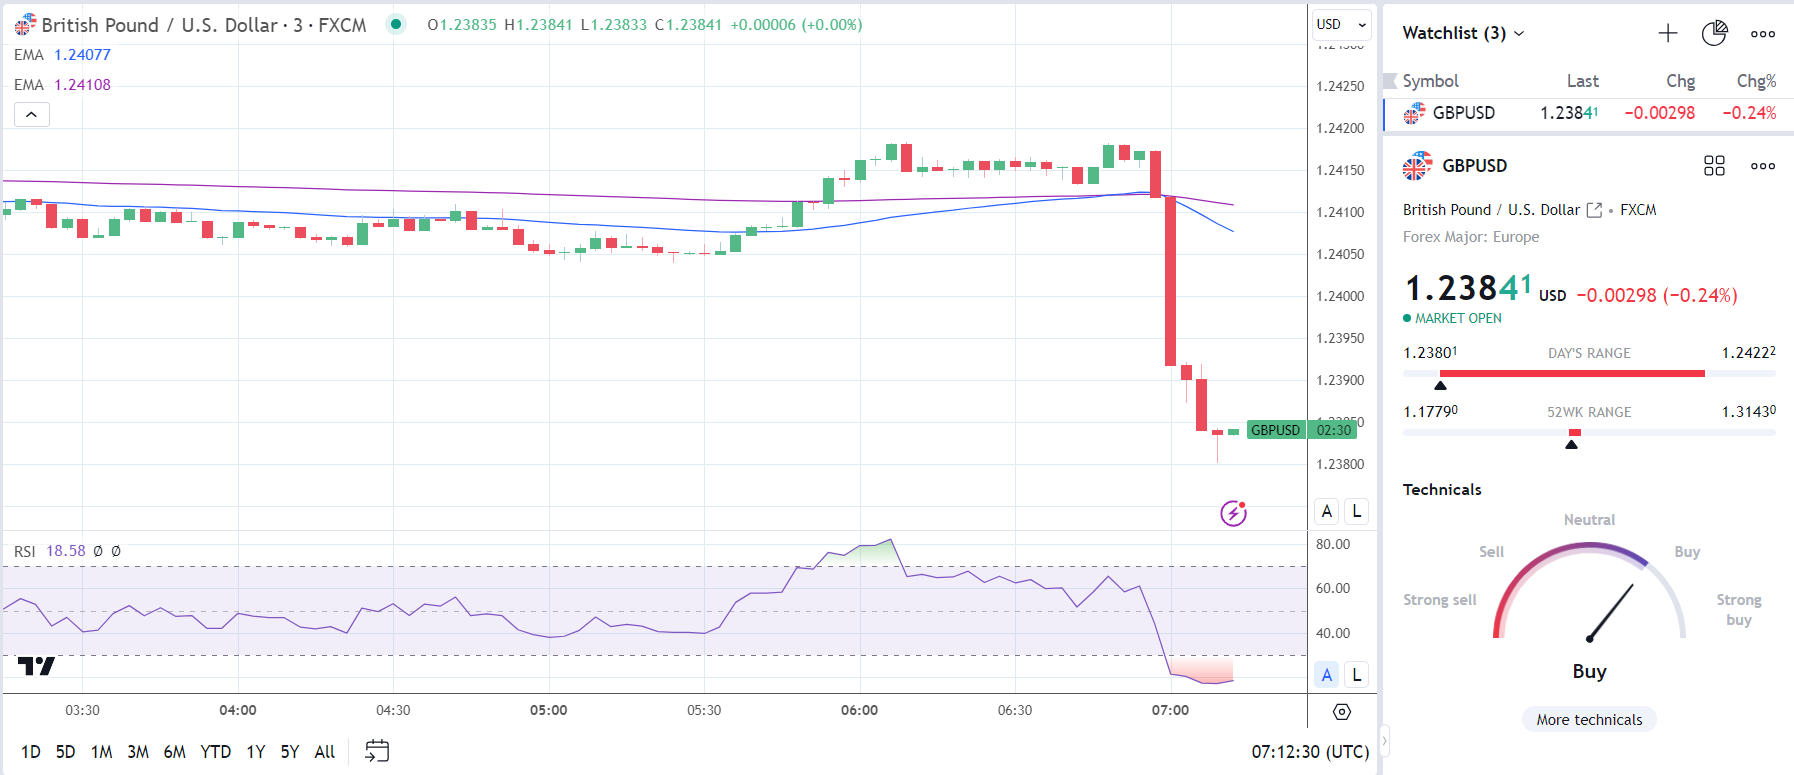
Before the UK retail sales figures, the GBP/USD rose to a high of $1.24222 before falling to a low of $1.24036.

However, in response to the UK retail sales figures, the GBP/USD fell from an opening price of $1.24118 to a low of $1.23801.

This morning, the GBP/USD was down 0.24% to $1.23841.

GBP to USD responds to the UK retail sales numbers.

171123 GBPUSD 3 Minute Chart

Next Up

Sir Dave Ramsden is on the BoE calendar to speak on Friday. Views on the UK economy, inflation, and interest rates need consideration.

The US housing sector will also be in focus along with Fed speakers. A marked deterioration in housing sector conditions could signal a hard landing. However, Fed speakers could have more influence on the global financial markets.

FOMC members Michael Barr, Austan Goolsbee, and Mary Daly are on the Calendar to speak. Reaction to the US CPI Report and retail sales figures would garner investor interest.

The Most Volatile Currency Pairs and How to Trade Them

The Most Volatile Currency Pairs and How to Trade Them

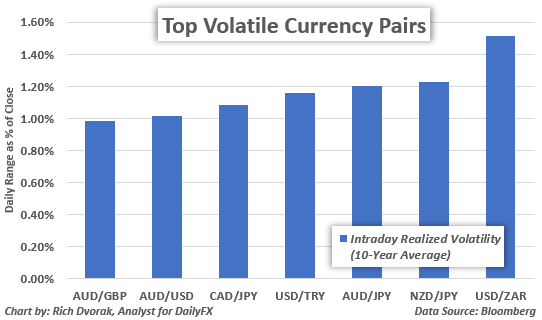
Currency volatility, often measured by calculating the standard deviation or variance of currency price movements, gives traders an idea of how much a currency might move relative to its average over a given time period. Traders can also gauge volatility by looking at a currency pair’s average true range or by looking at range as percent of spot.

The higher the level of currency volatility, the higher the degree of risk, and vice versa. Volatility and risk are usually used as interchangeable terms.Different currency pairs have different levels of volatility on average.

Some traders enjoy the higher potential rewards that come with trading volatile currency pairs. Although, this increased potential reward does present a greater risk, so traders should consider reducing their position sizes when trading highly volatile currency pairs.

What are the most volatile currency pairs?

The most volatile major currency pairs are:

Most Volatile Currency Pairs

Other major currency pairs, like EUR/USD, USD/JPY, GBP/USD and USD/CHF, are generally more liquid and less volatile as a result. That said, emerging market currency pairs, such as USD/ZAR, USD/TRY and USD/MXN, can clock some of the highest volatility readings.

MOST VOLATILE CURRENCY PAIRS

Majors – AUD/JPY, NZD/JPY, AUD/USD, CAD/JPY, GBP/AUD

Emerging Markets – USD/ZAR, USD/TRY, USD/MXN

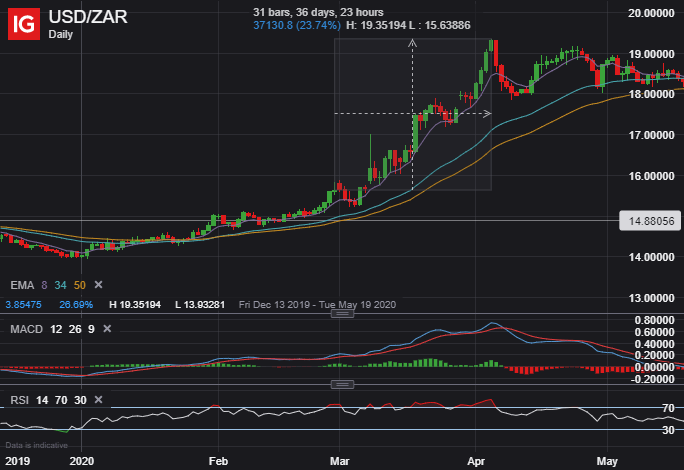
Aside from relatively low liquidity, emerging market currencies tend to be highly volatile in particular due to inherent risk underpinning emerging market economies. The chart below gives an example of how volatile emerging market currencies can be, which shows USD/ZAR (US Dollar/South Africa Rand) exploding nearly 25% higher in just over a month’s time. There are several other examples of emerging market currency pairs swinging drastically like this throughout history.

USDZAR Daily Price Chart

What about the least volatile currency pairs?

The least volatile currency pairs tend to be the major currency pairs which are also the most liquid. Also, these economies tend to be larger and more developed. This attracts more trading volume and facilitates greater price stability in turn. To that end, considering EUR/USD, USD/CHF and EUR/GBP trade with high volumes of liquidity, it comes as little surprise they are among the lease volatile currency pairs.

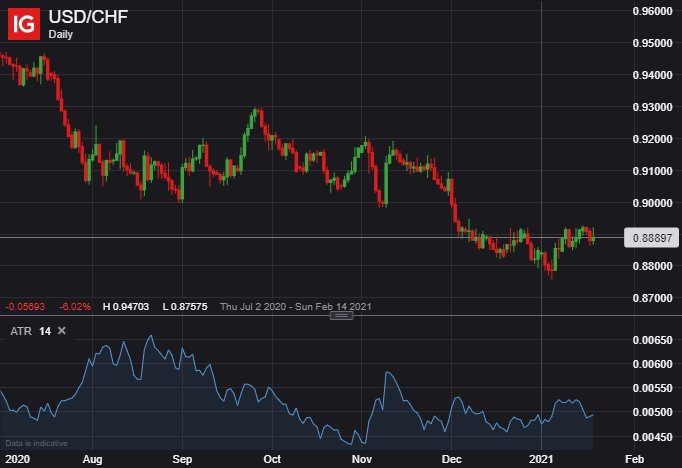
Illustrated below, the average true range (ATR) on USD/CHF ranges between 45-pips and 65-pips, a low average true range compared to other pairs. The average true range of a currency is one of the many ways to measure the volatility of a currency pair. Bollinger Band width is another popular technical indicator used to measure volatility.

USDCHF Daily Price Chart

Correlation between two currencies can also have an impact on their volatility. The more positively two currencies are correlated to one another might lead to less volatility. Continuing with our USD/CHF example, we note that the US Dollar and Swiss Franc are both viewed as safe-haven currencies.

The US Dollar and Swiss Franc tend to strengthen against their sentiment-linked peers when the market experiences episodes of risk aversion, but the two currencies may not deviate much from each other. This contributes to relatively low volatility readings for USD/CHF.

How to trade currency pair volatility

Forex traders should take into account current readings of volatility and potential changes in volatility when trading. Market participants should also consider adjusting their position sizes with respect to how volatile a currency pair is. Trading a volatile currency pair might warrant a reduced position size.

Awareness of volatility can also help traders determine appropriate levels for stop loss and take profit limit orders. Furthermore, it is important to understand the key characteristics separating the most volatile currencies from currencies with low volatility readings. Traders should also know how to measure volatility and have an awareness of events that might create big changes in volatility.

The difference between trading currency pairs with high volatility versus low volatility

  1. Currencies with high volatility will normally move more pips over a certain period than currencies with low volatility. This leads to increased risk when trading currency pairs with high volatility.
  2. Currencies with high volatility are more prone to slippage than currency pairs with low volatility.
  3. Due to high-volatility currency pairs making bigger moves, you should determine the correct position size to take when trading them.

There are several ways to measure volatility

To determine the correct position size, traders need to have an expectation of how volatile a currency can be. A variety of indicators can be used to measure volatility like:

Traders can also look at implied volatility readings, which reflect the level of expected volatility derived from options.

Key things traders should know about volatility:

  • Big news events like Brexit or trade wars can have a major impact on a currency’s volatility. Data releases can also influence volatility. Traders can stay ahead of data releases by using an economic calendar.
  • Volatile currency pairs still obey many technical aspects of trading, like support and resistance levels, trendlines and price patterns. Traders can take advantage of the volatility using technical analysis in combination with strict risk management principles.
  • Staying up to date with the latest forex pair news, analysis and rates can help you predict possible changes in volatility. We provide comprehensive trading forecasts to help you navigate the market.
  • DailyFX hosts daily webinars to answer questions and help traders prepare for volatile market conditions.
  • Supplement your forex learning and strategy development with the DailyFX Education Center.
Crude Oil Trading Strategies and Tips

Crude Oil Trading Strategies and Tips

WHY TRADE CRUDE OIL AND HOW DOES CRUDE OIL TRADING WORK?

Crude oil is the world economy’s primary energy source, making it a very popular commodity to trade. A naturally occurring fossil fuel, it can be refined into various products like gasoline (petrol), diesel, lubricants, wax and other petrochemicals. It is highly demanded, traded in volume, and extremely liquid. Oil trading therefore involves tight spreads, frequent chart patterns, and high volatility.

Brent crude is the world’s benchmark for oil with almost two thirds of oil contracts traded being Brent oil. WTI is America’s benchmark oil, it is a slightly sweeter and lighter oil compared to Brent.

CRUDE OIL TRADING HOURS

WTI trades on CME Globex:

Sunday – Friday, 6:00 p.m. – 5:00 p.m. (with an hour break from 5:00 p.m. to 6:00 p.m. each day)

Brent trades on ICE:

Sunday – Friday – 7:00 p.m. – 5:00 p.m.

CRUDE OIL TRADING BASICS: UNDERSTANDING WHAT AFFECTS PRICE MOVEMENTS

When trading oil, the two major focal points are, as with many commodities, supply and demand. Whether there was an economic report like a news event or press release or tensions in the Middle East, the two factors that will be taken into consideration is how supply and demand is affected, because this will affect the price.

Supply Factors

  • Outages or maintenance in key refineries around the globe, whether it’s the Forties pipeline in the North Sea or the Port Arthur refinery in Texas, must be monitored because of the effect it can have on the supply of oil. War in the Middle East leads to concerns about supply. For example, when the Libyan Civil war began in 2011, prices had seen a 25% rise from in the space of a couple of months.
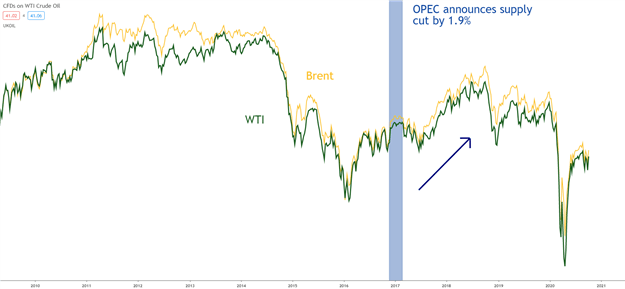
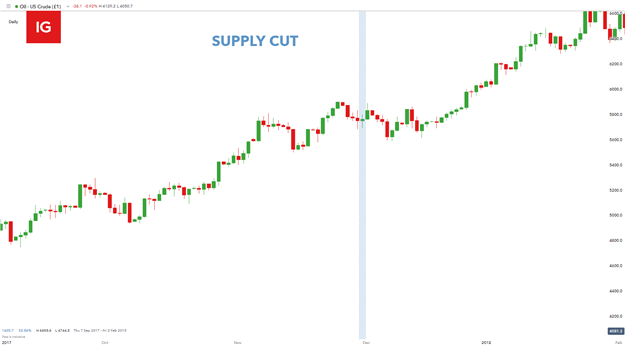
  • OPEC (Organization of the Petroleum Exporting Countries) production cuts or extensions lead to changes in the price of oil. For example, back in 2016 when the cartel had announced their decision to curb global supply by 1.9% (see chart below), the price of oil has risen from $44/bbl to as much as $80/bbl.

TI and Brent Crude price reaction to OPEC supply cut:
  • Oil Suppliers: Similarly, with understanding the importance of OPEC, it is also worth knowing who the top global oil suppliers are, and this information can be fond from the EIA website.

Demand Factors

  • Seasonality: Hot summers can lead to increased activity and higher oil consumption. Cold winters cause people to consume more oil products to heat their houses.
  • Oil Consumers: The largest consumers of oil have typically been developed nations such as the U.S. and European countries. However, in recent times there has been a surge in oil consumption in Asian countries, namely China and Japan. As such, it is important for traders to pay attention to the level of demand from these nations, alongside their economic performance. Any slowdown could affect oil prices and demand may fall.
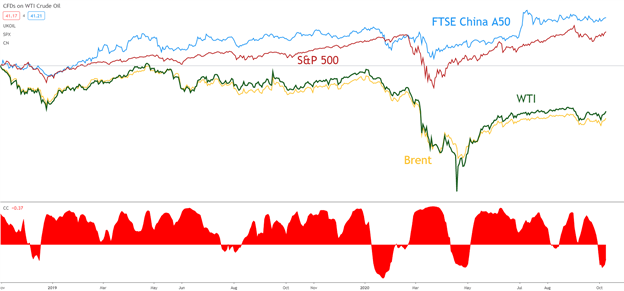
  • Correlation to Global Growth: The chart below shows the largely positive correlation between the price of crude oil and global growth. The Chinese and US economies being the two largest in the world are a great barometer for global growth. The chart includes their respective major stock indices which move in line with crude oil prices – when the equity indices fall, the price of crude oil tends to fall and vice versa.

WTI and Brent Crude positive correlation with FTSE China A50 and S&P 500 chart representation:
  • Alternative Energy: While fossil fuels such as oil and gas continue to dominate cleaner energy sources, there is an incessant push towards sustainability on a global scale. This will definitely impact crude oil prices going forward which makes this a key factor to monitor in a crude oil trading strategy.

The impact of derivatives on the traditional valuations of crude oil have been thought by many to have destabilized the asset class. Simply put, the oil futures are thought to have reflected higher proportions of noise which do not reflect the fundamental data at the time. This is contentious within the investing community with some in disagreement with the above rationale, but it cannot be ignored that large speculative traders are becoming more influential with the flourishing derivative market.

HOW TO TRADE OIL: TOP TIPS AND STRATEGIES

Expert oil traders generally follow a strategy. They will understand the fundamental factors that affect the price of oil and use a trading strategy that suits their trading style. Each trading strategy is different, risk management is an important component to consistent trading, like the effective use of leverage and avoiding top trading mistakes.

A comprehensive crude oil trading strategy could include:

  1. Fundamental Analysis
  2. Technical Analysis
  3. Risk Management

Once a trader understands the fundamental supply and demand factors that affect the price of oil, he/she can look for entries into the market using technical analysis. Then, when a buy or sell signal has been identified using technical analysis, the trader can implement the proper risk management techniques. Let’s go through an example using the steps outlined above:

  1. Fundamental Analysis

On the 30th of November 2017, OPEC and Russia agreed to extend an oil production cut, which lead to a decrease in supply. The basic theory of supply and demand suggests that a decrease in supply should be succeeded by an increase in demand and consequently price. This is the fundamental analysis a trader would need to incorporate into their strategy in order to identify potential buy signals in the market.

WTI daily chart highlighting supply cut:
2. Technical Analysis

The next step would be to analyze the chart using technical analysis. There are a variety of technical indicators and price patterns a trader can use to look for signals to enter the market. There is no need to use many technical indicators, one that you understand well will do the job. A common yet very effective way to begin analyzing any chart is to identify the overall trend of the market. In this example, the implementation of simple price action is used to identify higher highs and higher lows which is suggestive of a preceding upward trend. This falls in line with our fundamental expectation of further upward price movement.

WTI daily chart showing preceding upward trend:
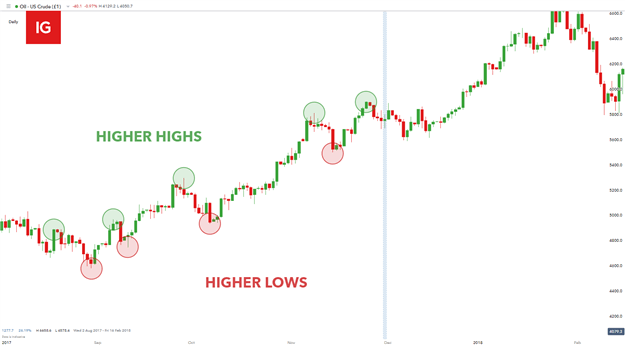
Chart prepared by Warren Venketas, IG

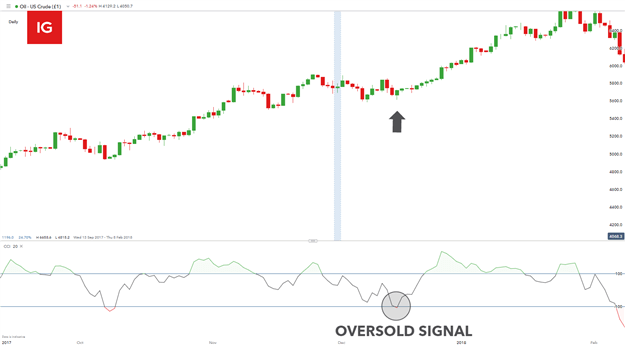
Once the bullish trend has been confirmed, the next step in the trading strategy would be to recognize possible entry points. Again, there are multiple tools and techniques to locate entry points but this example uses the Commodity Channel Index (CCI) indicator which moves into oversold territory shortly after the fundamental supply cut announcement was made. An oversold signal on the CCI advocates further price appreciation and the possibility of a long (buy) entry.

WTI daily chart with CCI indicator:
3. Risk Management

The final step in any trading strategy would be to employ sound risk management to every trade. At DailyFX we support the 1:2 risk-reward ratio guideline which basically means that the target level should be roughly two times more than the position stop-loss level. To manage risk, the trader could look to set a take-profit above the recent high and set a stop-loss at the recent low.

In this example, a recent swing low ($49.30) has been identified as stop level which is approximately $8 away from the entry price ($57.20). There is no recent high which in this case which would allow for a target projection using basic math. With the stop distance being roughly $8 away from entry, a 1:2 projection could seee initial resistance at the $73 level.

WTI daily chart with 1:2 risk-reward ratio:
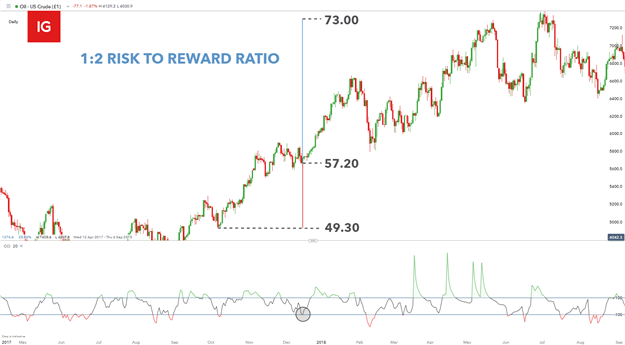
This sample trade would illustrate a positive risk to reward ratio. We researched millions of live trades in a variety of markets and discovered a positive risk to reward ratio was a key element to consistent trading. Additionally, at DailyFX, we recommend risking less than 5% of capital on all open trades.

ADVANCED TIPS FOR OIL TRADING

Advanced traders can incorporate additional information when setting up trades. Traders sometimes look at the futures curve to forecast future demand, CFTC speculative positioning to understand the current market dynamic and can use options to take advantage of forecasted high volatility moves or to hedge current positions.

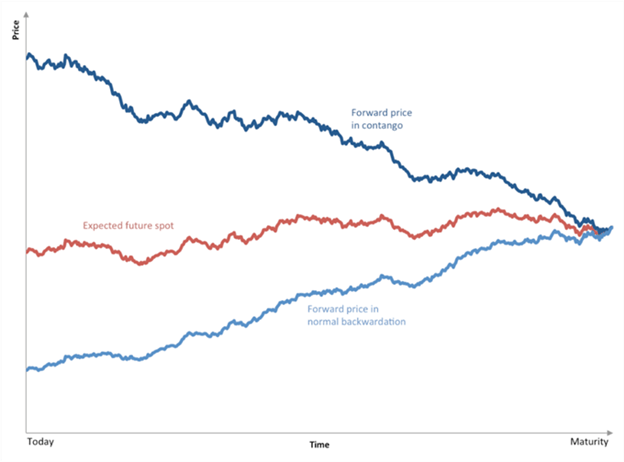
Futures Curve: The shape of the futures curve is important for commodity hedges and speculators. As such, when investors analyze the curve, they look for two things, whether the market is in contango or backwardation:

  1. Contango: This is a situation in which the futures price of a commodity is above the expected spot price, as investors are willing to pay more for a commodity at some point in the future than the actual expected price. This typically signals a bearish structure.
  2. Backwardation: This is a situation when the spot price is above the forward price for a commodity. This typically signals a bullish structure.
CFTC/Speculative Positioning:

The Commodity Future Trading Commission Report (CFTC) is important when trading crude oil futures. It provides traders with information related to market dynamics and therefore s can be a good way to gain a sense of where oil prices are heading. Movements in the CFTC managed money net positions typically precede the move in oil prices.

Trading via futures and options

Buying futures and options, a trader must use the appropriate exchange for the oil benchmark he/she wants to trade. Most exchanges have criteria for who is allowed trade on them, so the majority of futures speculation is undertaken by professionals.

Oil Investing

Instead of trading the individual market, a trader can get exposure to oil through shares of oil companies or through energy-based exchange traded funds (ETFs). The price of oil companies and ETFs are heavily influenced by the price of oil.

Major Oil/Energy ETFs:

  • Energy Select Sector SPDR (XLE)
  • Vanguard Energy ETF (VDE)
  • United States Energy Fund (USO)