RBA Hiked the Cash Rate by 25 Basis Points but Offered no Commitment to More

RBA Hiked the Cash Rate by 25 Basis Points but Offered no Commitment to More

China Trade Data Affirms a Weak Overseas Demand Environment

In October, exports declined by 6.4% year-on-year versus a 6.2% decline in September. Economists forecast exports to fall by 3.3%. However, imports unexpectedly rebounded in October, rising by 3.0% year-over-year. Imports were down 6.2% in September. Economists forecast imports to decline by 4.8%. The US dollar trade balance narrowed from $77.71 billion to $56.53 billion.

The figures were significant. While overseas demand remains weak, domestic demand could fuel economies reliant on trade with China.

On Sunday, China Premier Li Qiang pledged to relax policies and to import more goods. Improving trade terms for export-orientated economies, including Australia, would boost economic growth.

The pledge of more imports countered the effect of weaker exports on riskier assets. However, the markets were also cautious ahead of the heavily anticipated RBA monetary policy decision.

RBA Hikes the Cash Rate by 25 Basis Points to 4.35%

On Tuesday, the RBA raised the cash rate by 25 basis points to 4.35%. Economists expected a 25-basis point rate hike. However, there was uncertainty about a commitment to further rate hikes to combat inflation.

According to the Rate Statement,

  • The RBA expects inflation to be around 3.5% by the end of 2024 and at the top of the 2-3% target by the end of 2025. In October, the RBA expected inflation to be within the 2-3% target range in late 2025.
  • In assessing recent economic indicators, the Board saw an increased risk of inflation remaining higher for longer.
  • The Australian economy has performed more strongly than expected, and the labor market remains tight.
  • However, medium-term inflation expectations have remained consistent with the inflation target.
  • Service price inflation remains a concern, with lags in the effect of policy tightening creating uncertainty.
  • Australian household spending, the Chinese economy, and conflicts added to the uncertain outlook.

Notably, there was no firm commitment to raising rates higher in December or early 2024. The lack of a commitment to further rate hikes left investors with the possibility of a one-and-done scenario. The RBA Statement was dovish despite the Board remaining ‘resolute in its determination to return inflation to target.’

The Aussie Dollar Reaction to China Trade and the RBA

Before the trade data and RBA interest rate decision, the AUD/USD rose to a high of $0.64888 before easing back.

Weak China exports and RBA rate decision apprehension led to a post-trade data low of $0.64818. However, investors responded to the RBA interest rate decision and rate statement. The Australian dollar rose to a high of $0.65012 before sliding to a low of $0.64552.

This morning, the AUD/USD was 0.43% to $0.64605.
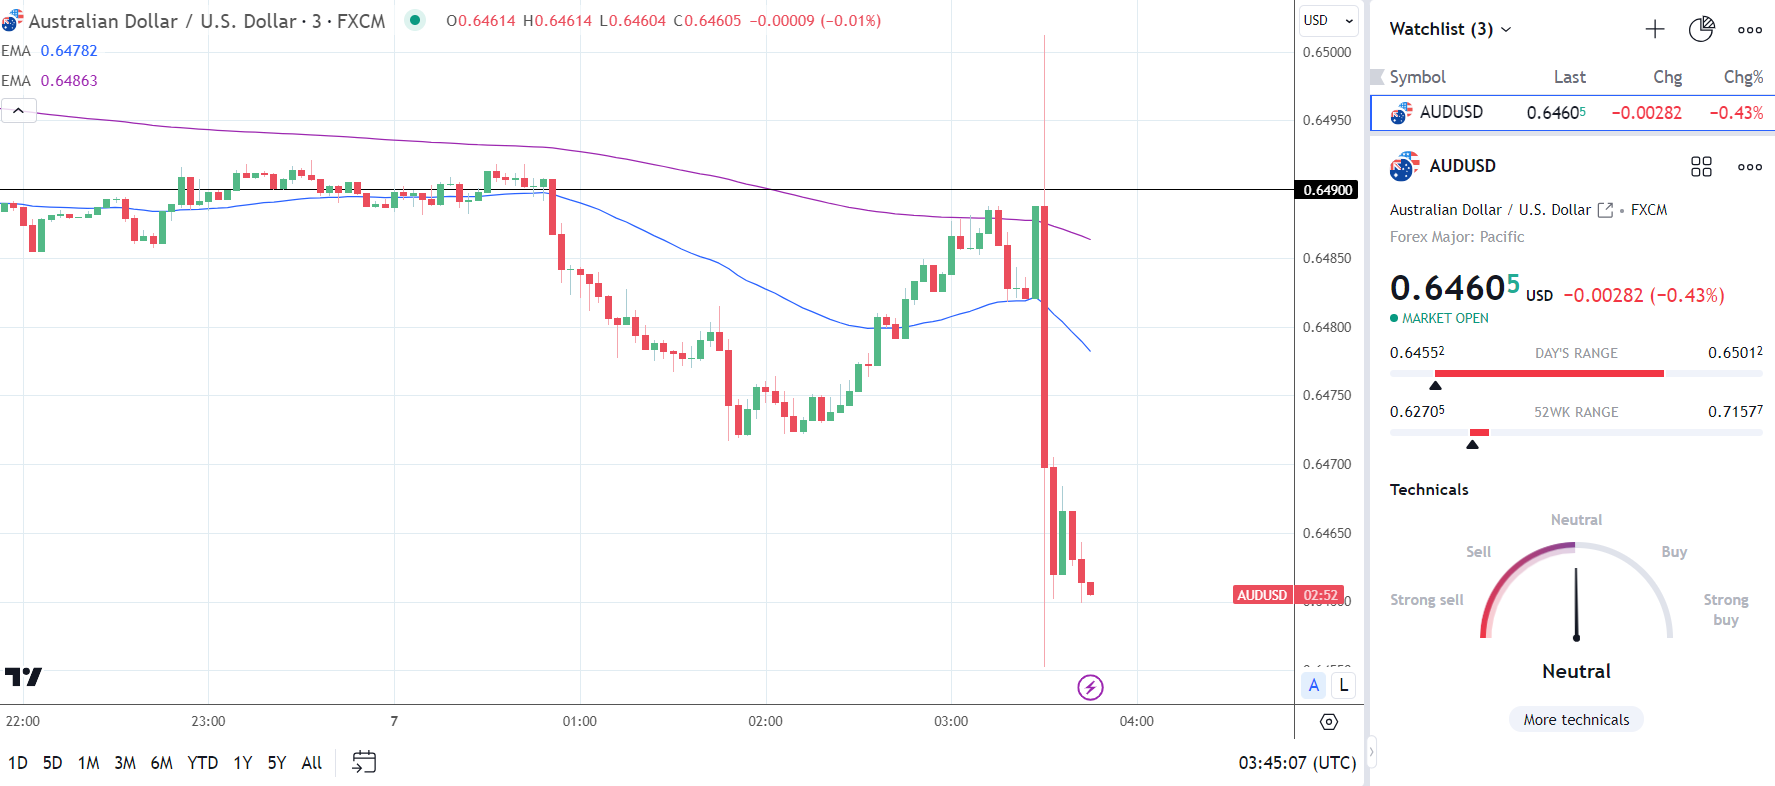
RBA hits the Aussie Dollar with a dovish rate hike.
071123 AUDUSD 3 Minute Chart

Next Up

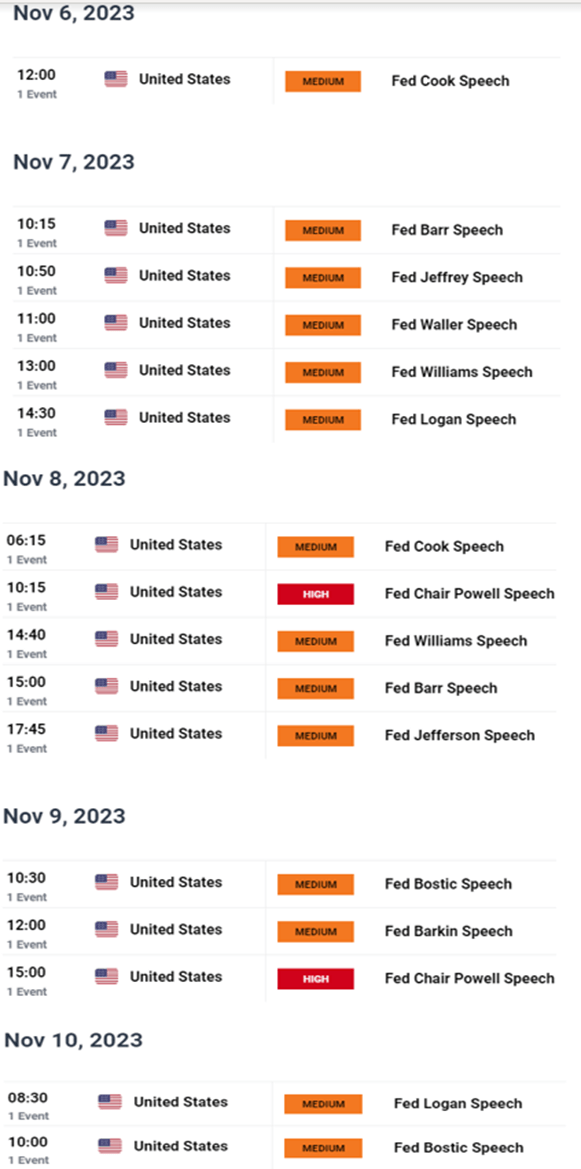
On Tuesday, FOMC member speeches will garner investor interest. FOMC voting members Michael Barr, Lorie Logan, Christopher Waller, and John Williams will speak. Fed Vice Chair John Williams traditionally has more influence on investor sentiment toward the Fed rate path. However, investors will likely respond to FOMC member references to the economy, inflation, and interest rates.

With Fed commentary in focus, investors will likely ignore US trade data for September. The US trade-to-GDP ratio is less than 30% and is unlikely to influence the Fed rate path.

Crypto News: XRP Jumped 19% in the Week on Optimism Toward a Ripple Win

Crypto News: XRP Jumped 19% in the Week on Optimism Toward a Ripple Win

Trading Derivatives carries a high level of risk to your capital and you should only trade with money you can afford to lose. Trading Derivatives may not be suitable for all investors, so please ensure that you fully understand the risks involved, and seek independent advice if necessary. A Product Disclosure Statement (PDS) can be obtained either from this website or on request from our offices and should be considered before entering into a transaction with us. Raw Spread accounts offer spreads from 0.0 pips with a commission charge of USD $3.50 per 100k traded. Standard account offer spreads from 1 pips with no additional commission charges. Spreads on CFD indices start at 0.4 points. The information on this site is not directed at residents in any country or jurisdiction where such distribution or use would be contrary to local law or regulation.


In the week ending November 5, XRP surged 18.9% to end the week at $0.6611. On Monday, November 6, XRP struck a high of $0.6887. XRP last stood at $0.70 on August 2.

Investor sentiment toward the SEC v Ripple case likely fueled the buyer appetite for XRP.

The crypto community awaits updates from the SEC and Ripple on progress, if any, toward a briefing schedule.

In October, the court ordered the SEC and Ripple to jointly propose a briefing schedule on related charges by November 9, 2023. The outstanding charges relate to the unlawful sale of XRP to institutional investors. If the two parties fail to agree to a briefing schedule, the court will arrange a contested briefing schedule.

The SEC is eying a $770 million penalty, while pro-crypto lawyers suggest a significantly lower penalty. On November 4, CryptoLaw US founder and amicus Curiae attorney John E. Deaton shared an optimistic perspective. Deaton believes there is a 90% chance of a favorable outcome for Ripple, saying,

“If Ripple ends up paying $20M or less it’s a 99.9% legal victory.”

BTC-Spot ETF Hopes to Keep BTC at the $35,000 Mark

The market euphoria toward the launch of a BTC-spot ETF remains intact. In the week ending November 5, BTC gained 1.34% to end the week at $35,061.

While investors target altcoins in a rotation toward trailing coins, BTC remains the bellwether for the crypto market. On Sunday, BTC-spot ETF news failed to spook investors, who are more focused on SEC approvals than more spot-ETF applications.

Bloomberg Intelligence ETF Analyst Eric Balchunas reacted to recent news of Vanguard opting out of the BTC-spot ETF race, saying,

“Vanguard ruling out doing a bitcoin ETF is like Radiohead ruling out doing a Christmas album. It’s just miles away from their DNA/brand. No big shocker here. This is tho big reason why most everyone else does want to launch one, less fee pressure when Vgrd not around.”

Technical Analysis

Bitcoin Analysis

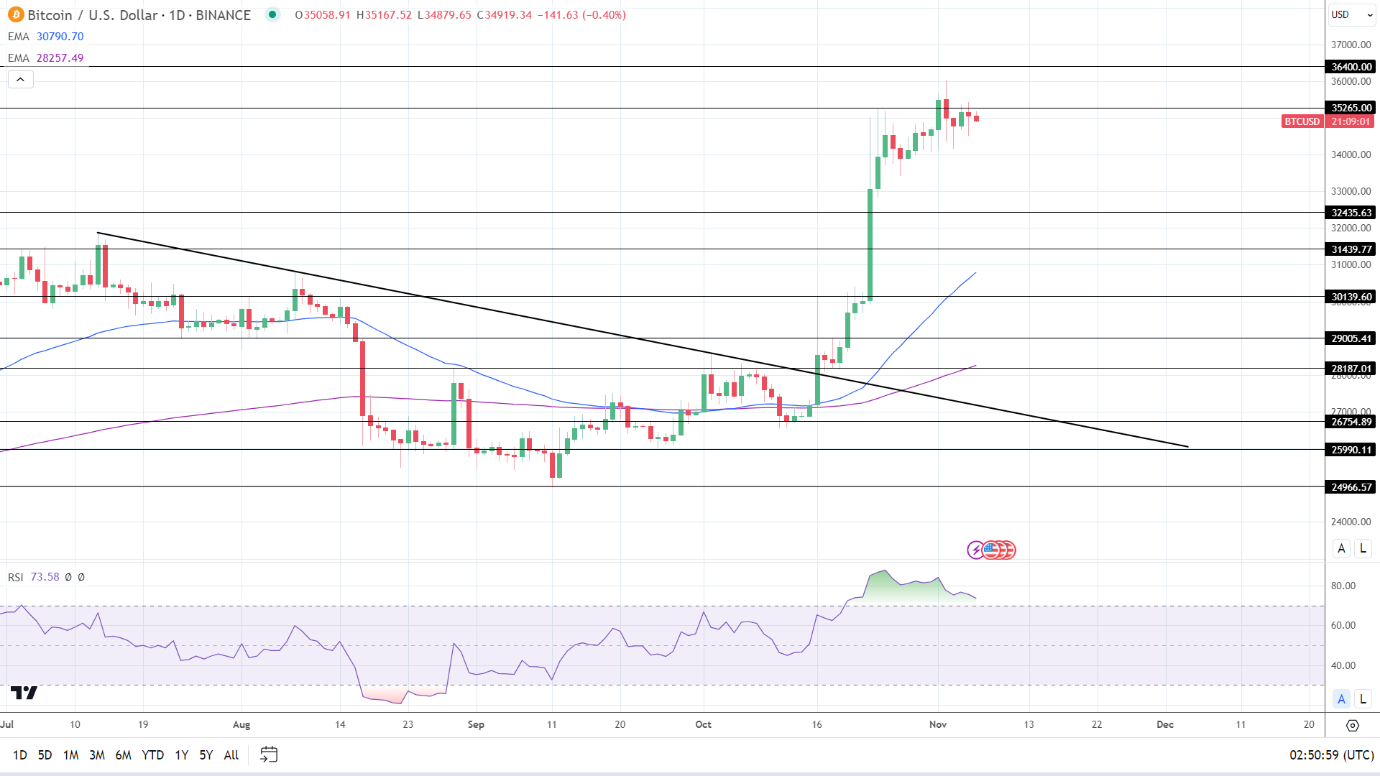
BTC remained above the 50-day and 200-day EMAs.

A BTC breakout from the $35,265 resistance level would support a move to the November 2 high of $36,024 and the $36,400 resistance level.

Crypto-spot ETF news is the focal point. Progress toward SEC approvals and an expected influx of institutional monies remain the driving force behind recent crypto gains. Hints of the SEC planning to decline one, some, or all the BTC-spot ETF applications could send BTC into retreat.

A BTC fall through the $34,000 would give the bears a run at the $32,436 support level.

The 14-Daily RSI reading of 73.58 shows BTC sitting in overbought territory. BTC may face intensifying selling pressure at the $35,265 resistance level.

BTC Daily Chart EMAs send bullish price signals.

BTCUSD 061123 Daily Chart

Ethereum Analysis

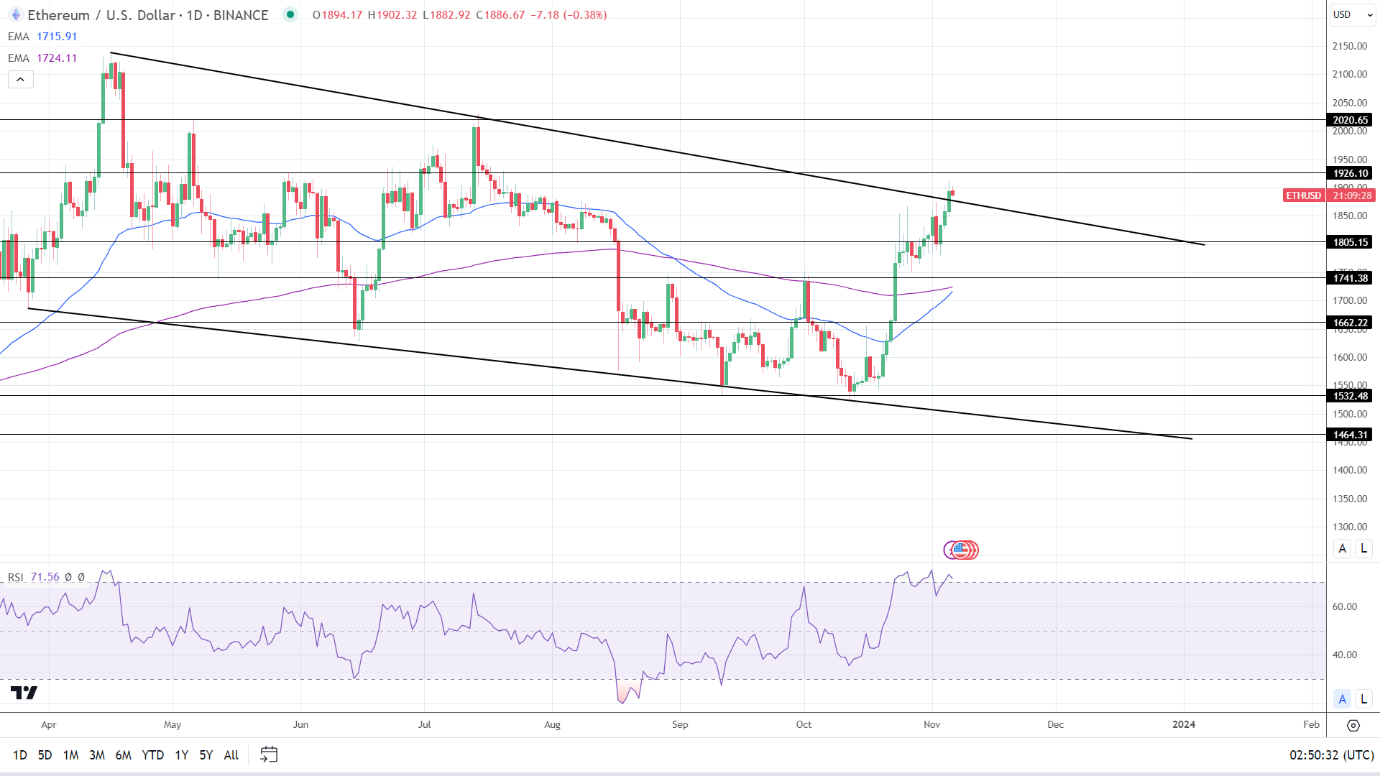
ETH held above the 50-day and 200-day EMAs.

Avoiding a fall below the trend line would support a move to the $1,926 resistance level and $2,000.

However, a break below the trend line would give the bears a run at the $1,805 support level. A fall through the $1,805 support level would bring sub-$1,800 into play.

The 14-period Daily RSI of 71.56 shows ETH in overbought territory. Selling pressure may peg ETH back from the $1,926 resistance level without an ETH-friendly catalyst.

ETH Daily Chart EMAs send bullish price signals.
ETHUSD 061123 Daily Chart
DAX Index: German Factory Orders and Services PMIs to Test the Bullish Sentiment

DAX Index: German Factory Orders and Services PMIs to Test the Bullish Sentiment

Friday DAX Overview

The DAX gained 0.30% on Friday. Following a 1.48% rally on Thursday, the DAX ended the day at 15,189.

Corporate Earnings Offset Impact of Weak Euro Area Economic Indicators

On Friday, German trade data sent a gloomy picture of the German economy. Exports tumbled by 2.4% in September, with imports falling by 1.7%. An unexpected rise in the Eurozone unemployment rate added to the negative market mood.

Trading Derivatives carries a high level of risk to your capital and you should only trade with money you can afford to lose. Trading Derivatives may not be suitable for all investors, so please ensure that you fully understand the risks involved, and seek independent advice if necessary. A Product Disclosure Statement (PDS) can be obtained either from this website or on request from our offices and should be considered before entering into a transaction with us. Raw Spread accounts offer spreads from 0.0 pips with a commission charge of USD $3.50 per 100k traded. Standard account offer spreads from 1 pips with no additional commission charges. Spreads on CFD indices start at 0.4 points. The information on this site is not directed at residents in any country or jurisdiction where such distribution or use would be contrary to local law or regulation.

However, corporate earnings countered the impact of the economic indicators on the DAX. The German auto sector took center stage, with BMW delivering solid earnings results.

US Economic Indicators Close the Door on Fed Rate Hikes

On Friday, the US Jobs Report and service sector PMI numbers closed the door on Fed rate hikes. Softer wage growth and an unexpected rise in the unemployment rate reflected the effects of the Fed on the labor market. The lower numbers were timely for riskier assets. On Wednesday, Fed Chair Powell discussed the need for a weaker labor market to restore price stability.

The ISM Services PMI reported a slowdown in service sector activity. The weaker-than-expected numbers tested the appetite for riskier assets on fears the FED raised rates too aggressively.

On Friday, the Nasdaq Composite Index rallied 1.38%, with the S&P 500 and the Dow gaining 0.66% and 0.94%.

The Friday Market Movers

Siemens Energy led the way again, surging by 8.70%. Buyer demand increased due to reduced concerns about key customers ending contracts.

Zalando and Vonovia rallied 7.86% and 7.78%, respectively. Vonovia bounced on rental growth and asset sales, while Zalando found support from easing Fed fear.

The auto sector contributed to session gains. Porsche and BMW ended the session with gains of 2.56% and 2.04%. Volkswagen and Mercedes Benz Group rose by 2.00% and 0.66%, respectively.

German Factory Orders and Services PMIs in the Spotlight

On Monday, German factory orders and euro area services PMIs will draw investor attention. A slide in factory orders and weaker-than-expected services PMIs could test the appetite for DAX-listed stocks.

Economists forecast factory orders to decline by 1.0% in September (Aug: 3.9%). Service sector PMIs could have more influence. According to preliminary PMI surveys, the German Services PMI fell from 50.3 to 48.0 and the Eurozone’s from 48.7 to 47.8 in October. Revisions to preliminary figures need investor consideration.

There are no US economic indicators to influence market risk sentiment later in the Monday session.

However, corporate earnings will move the dial. Out of Germany, BioNTech is on the calendar to release earnings results.

The futures markets point to a testy start to the Monday session. The DAX and the Nasdaq mini were down 3 and 4 points, respectively.

Short-Term Forecast

Corporate earnings must continue to fuel the positive sentiment as the markets expect an end to the Fed rate hike cycle. However, euro area economic indicators remain a headwind for DAX-listed stocks. In the near term, a deteriorating macroeconomic environment across the euro area and the US needs consideration.

DAX Technical Indicators

Daily Chart

The DAX remained below the 50-day and 200-day EMAs, affirming bearish price signals.

A DAX move through the 15,247 resistance level and the 50-day EMA would give the bulls a run at the 200-day EMA.

German factory orders, euro area services PMIs, and corporate earnings will be the focal points.

However, a break below 15,000 would support a move to the 14,957 support level.

The 14-day RSI reading of 53.54 indicates a DAX move to the 200-day EMA before entering overbought territory.

DAX Daily Chart sends bearish price signals.
DAX 061123 Daily Chart

4-Hourly Chart

The DAX remains above the 50-day EMA while sitting below the 200-day EMA, sending bullish near-term but bearish longer-term price signals. A DAX move through the 15,247 resistance level would bring the 200-day EMA into play.

However, a break below the 50-day EMA and the 14,957 support level would support a move toward the 14,575 support level.

The 67.45 14-4 hour RSI reading indicates a DAX move through the 15,247 resistance level before entering overbought territory.

4-Hourly Chart sends bullish near-term price signals.
DAX 061123 4-Hourly Chart
EUR/USD Forecast: Navigating Uncertainty – Analysis of EUR to USD Trends Post Jobs Report

EUR/USD Forecast: Navigating Uncertainty – Analysis of EUR to USD Trends Post Jobs Report

Friday Overview

The EUR/USD rallied 1.00%. Following a 0.49% gain on Thursday, the EUR/USD ended the day at $1.07277. The EUR/USD fell to a low of $1.06145 before rising to a high of $1.07467.

German Factory Orders and Euro Area Services PMIs in Focus

On Monday, German factory orders will draw early investor interest. The German manufacturing sector contributes less than 30% to the economy. However, a continued deterioration in sector activity would signal a weakening demand environment. Economists forecast factory orders to decline by 1.0% in September. In August, factory orders increased by 3.9%.

Trading Derivatives carries a high level of risk to your capital and you should only trade with money you can afford to lose. Trading Derivatives may not be suitable for all investors, so please ensure that you fully understand the risks involved, and seek independent advice if necessary. A Product Disclosure Statement (PDS) can be obtained either from this website or on request from our offices and should be considered before entering into a transaction with us. Raw Spread accounts offer spreads from 0.0 pips with a commission charge of USD $3.50 per 100k traded. Standard account offer spreads from 1 pips with no additional commission charges. Spreads on CFD indices start at 0.4 points. The information on this site is not directed at residents in any country or jurisdiction where such distribution or use would be contrary to local law or regulation.


Euro area services PMIs will also need consideration. Revisions to preliminary PMIs for October and PMI numbers for Italy will influence buyer sentiment regarding the EUR/USD. According to the preliminary Survey, the Eurozone Services PMI fell from 48.7 to 47.8 in October. The services sector accounts for more than 70% of the Eurozone economy. Weak figures would fuel recessionary fears.

Notably, a weaker demand outlook could ease pressure on the ECB to keep interest rates higher for longer. The markets may also begin considering the timing of an ECB rate cut.

FOMC Member Commentary in the Spotlight

On Monday, FOMC member commentary could influence sentiment toward the Fed interest rate path. FOMC voting member Lisa Cook is on the economic calendar to speak.

Reaction to the US Jobs Report and forward guidance on interest rates will be the focal points. The markets are betting on an end to the Fed rate hike cycle. Hawkish comments on inflation, the labor market, and the US economy could catch investors by surprise.

Short-Term Forecast:

Near-term EUR/USD trends now hinge on economic indicators from Germany. A marked deterioration in macroeconomic conditions could put an ECB rate cut on the map. However, the Fed pivot remains a tailwind for the EUR/USD despite investors expecting a euro area recession.

EUR/USD Price Action

Daily Chart

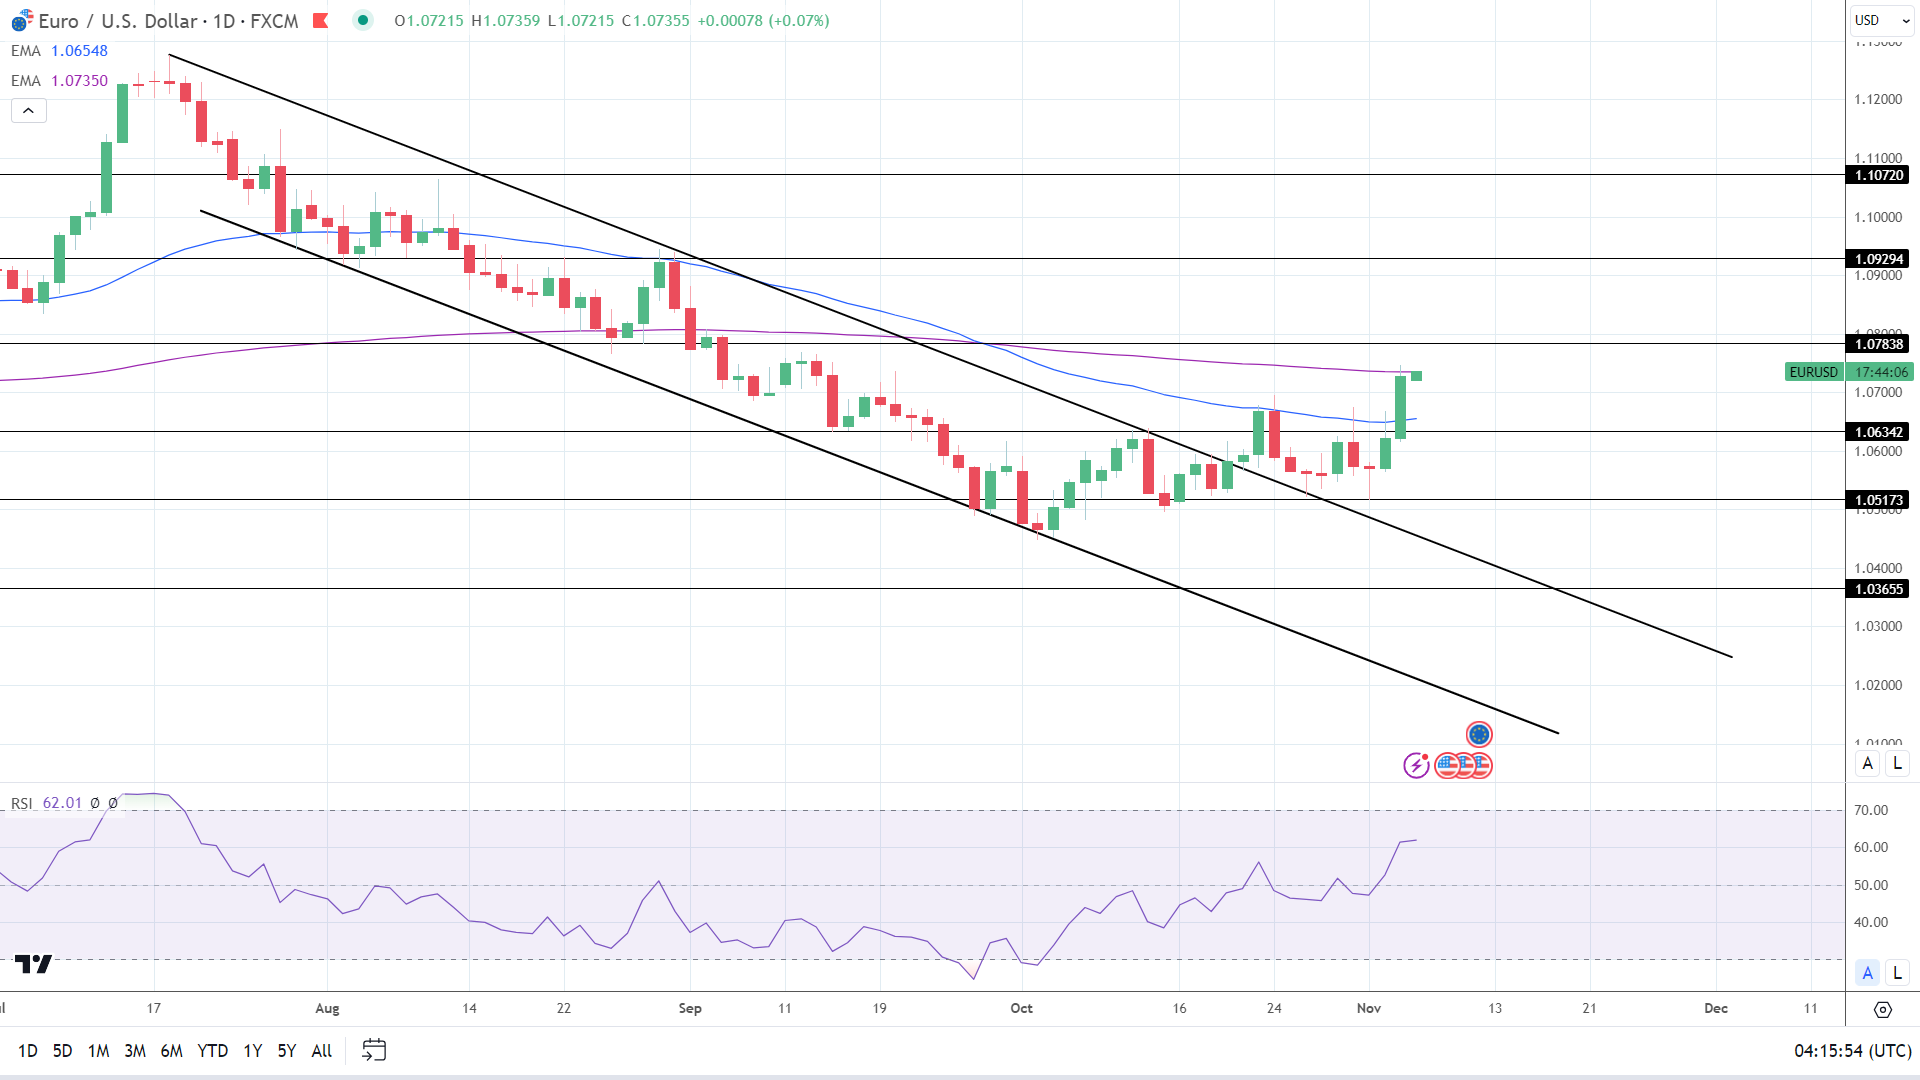
The EUR/USD sat above the 50-day and 200-day EMAs, sending bullish price signals.

A EUR/USD hold above the 200-day EMA would support a move to the $1.07838 resistance level.

Euro area economic indicators and Fed speeches are the focal points on Monday.

However, a drop below the 200-day EMA would give the bears a run at the 50-day EMA and the $1.06342 support level.

Weak economic indicators from the euro area and hawkish Fed speeches could sink the EUR/USD.

The 14-period Daily RSI, 62.01, suggests a EUR/USD move to the $1.07838 resistance level entering overbought territory.

EUR/USD Daily Chart sends bullish price signals.

EURUSD 061123 Daily Chart

4-Hour Chart

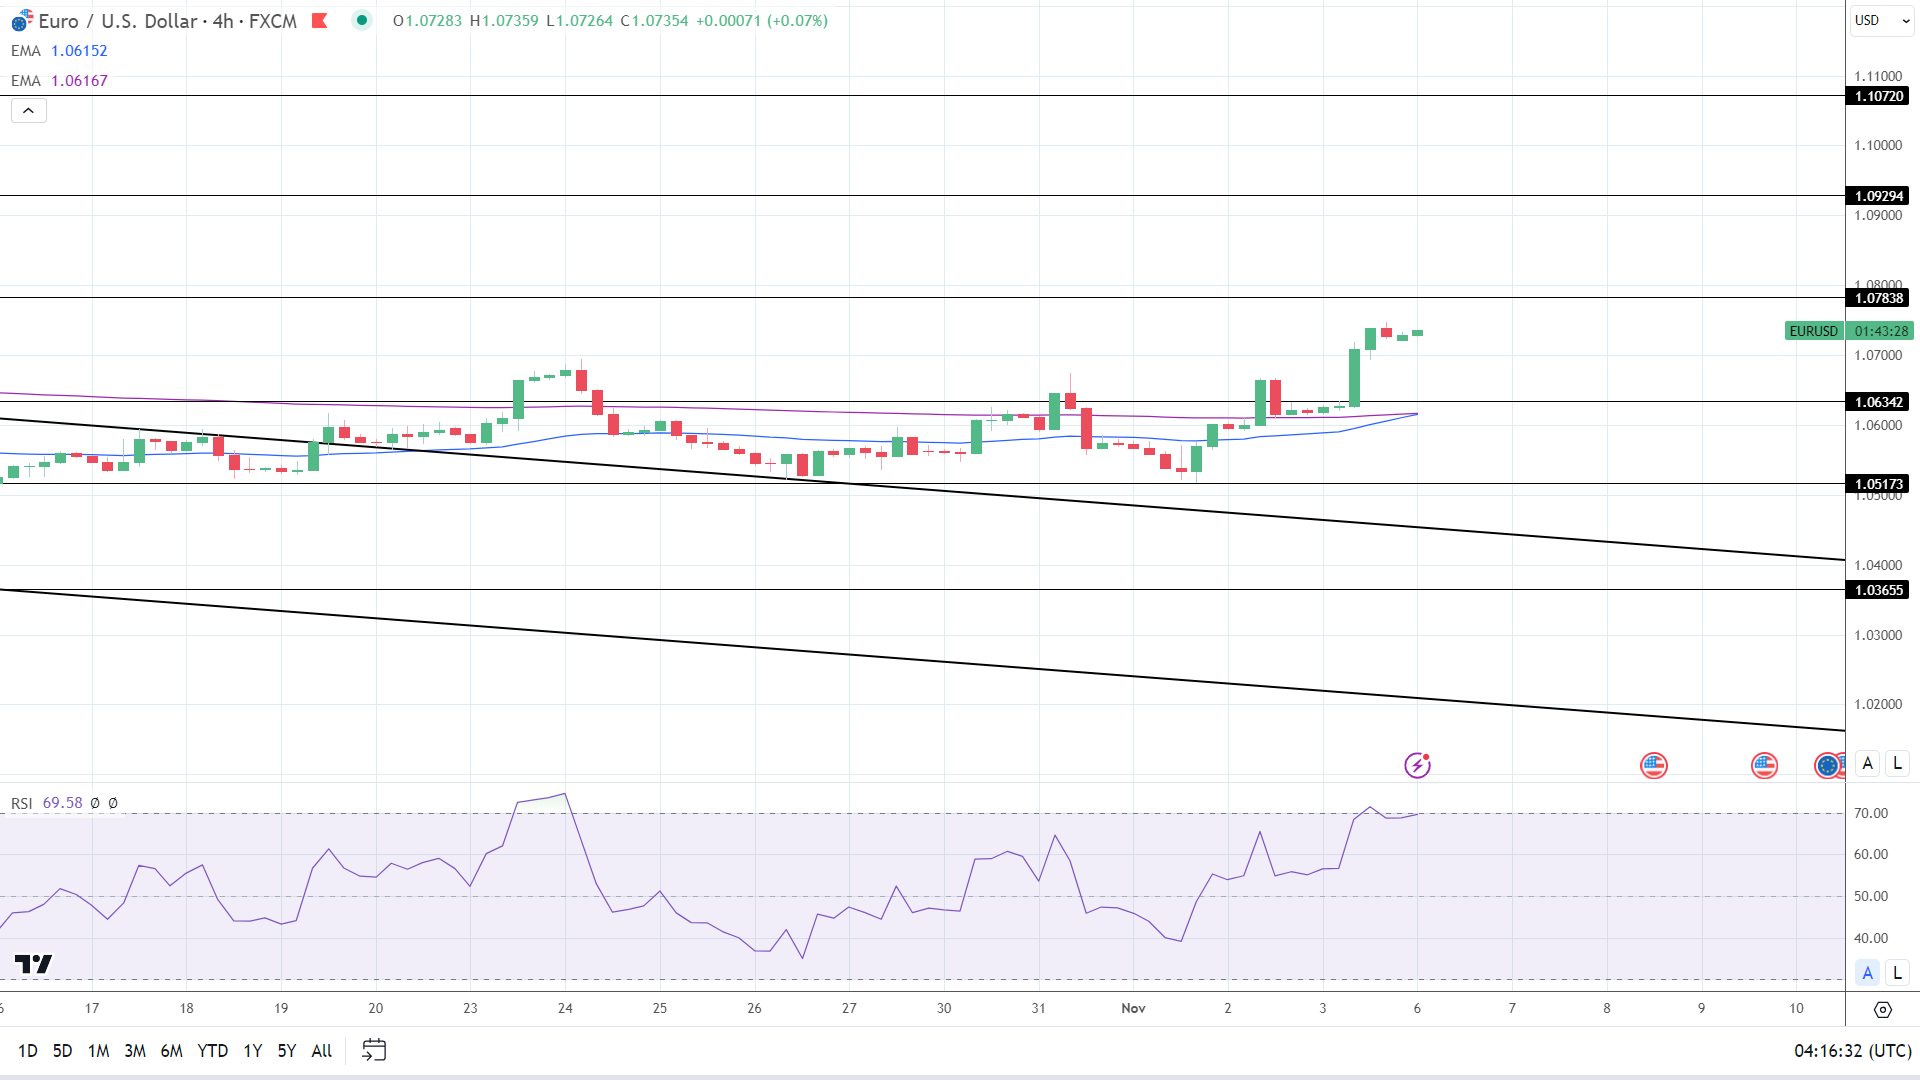
The EUR/USD sits above the 50-day and 200-day EMAs, sending bullish price signals. Significantly, the 50-day EMA converged on the 200-day EMA. A bullish cross would signal a possible EUR/USD rally.

A EUR/USD break above the $1.07838 resistance level would give the bulls a run at $1.08.

However, a fall below $1.07 would bring the $1.06342 support level and the EMAs into play.

The 14-period RSI on the 4-hour chart, 69.58, indicates a EUR/USD move to $1.0750 before entering overbought territory.

4-Hourly Chart EMAs affirm bullish price signals.
EURUSD 061123 4 Hourly Chart
Silver Prices Forecast: XAG/USD Reacts to Firm Yields as Traders Await Powell’s Remarks

Silver Prices Forecast: XAG/USD Reacts to Firm Yields as Traders Await Powell’s Remarks

Silver’s Yield-Driven Slide

Spot silver (XAG/USD) began the week on a subdued note as it succumbed to pressures from rising U.S. bond yields overnight, eagerly eyeing Federal Reserve Chair Jerome Powell’s insights into future rate moves. The precious metal’s luster diminished with a 0.25% drop to $23.15 per ounce, retracting after a failed attempt to breach the $23.50 mark.

Yield’s Magnetic Pull

The trajectory of silver prices is closely tethered to the U.S. 10-year Treasury yields, which have recently rebounded from a five-week low to 4.5910%. This climb spells potential trouble for silver, drawing investors away from the non-yielding asset and threatening to push prices below the vital $22.57 support level.

Trading Derivatives carries a high level of risk to your capital and you should only trade with money you can afford to lose. Trading Derivatives may not be suitable for all investors, so please ensure that you fully understand the risks involved, and seek independent advice if necessary. A Product Disclosure Statement (PDS) can be obtained either from this website or on request from our offices and should be considered before entering into a transaction with us. Raw Spread accounts offer spreads from 0.0 pips with a commission charge of USD $3.50 per 100k traded. Standard account offer spreads from 1 pips with no additional commission charges. Spreads on CFD indices start at 0.4 points. The information on this site is not directed at residents in any country or jurisdiction where such distribution or use would be contrary to local law or regulation.

Jobs Report and Monetary Policy

The weaker-than-anticipated jobs report has stirred up market conjecture around a possible halt in the Fed’s aggressive rate hiking pattern, casting the dollar down to a six-week low. The cooling labor market is prompting market players to brace for a rate stabilization as soon as December, with some predicting a policy softening come mid-next year.

Fed’s Communication Crucial for Silver

As Powell prepares to speak, the market’s pulse quickens, with nine Fed officials slated to provide updates. Despite holding rates steady recently, the possibility of future hikes has not been discounted, leaving investors parsing every word for policy direction.home

Silver’s Tentative Optimism

Silver’s immediate outlook seems tentatively positive, betting on a potential pause in rate hikes. Yet, the landscape remains fraught with uncertainties—any surge in Treasury yields or hawkish hints from Fed officials could tilt the balance, putting the key $22.57 support level to the test. As such, the bullish sentiment persists, but with a vigilant eye on central bank cues and economic indicators.

Technical Analysis

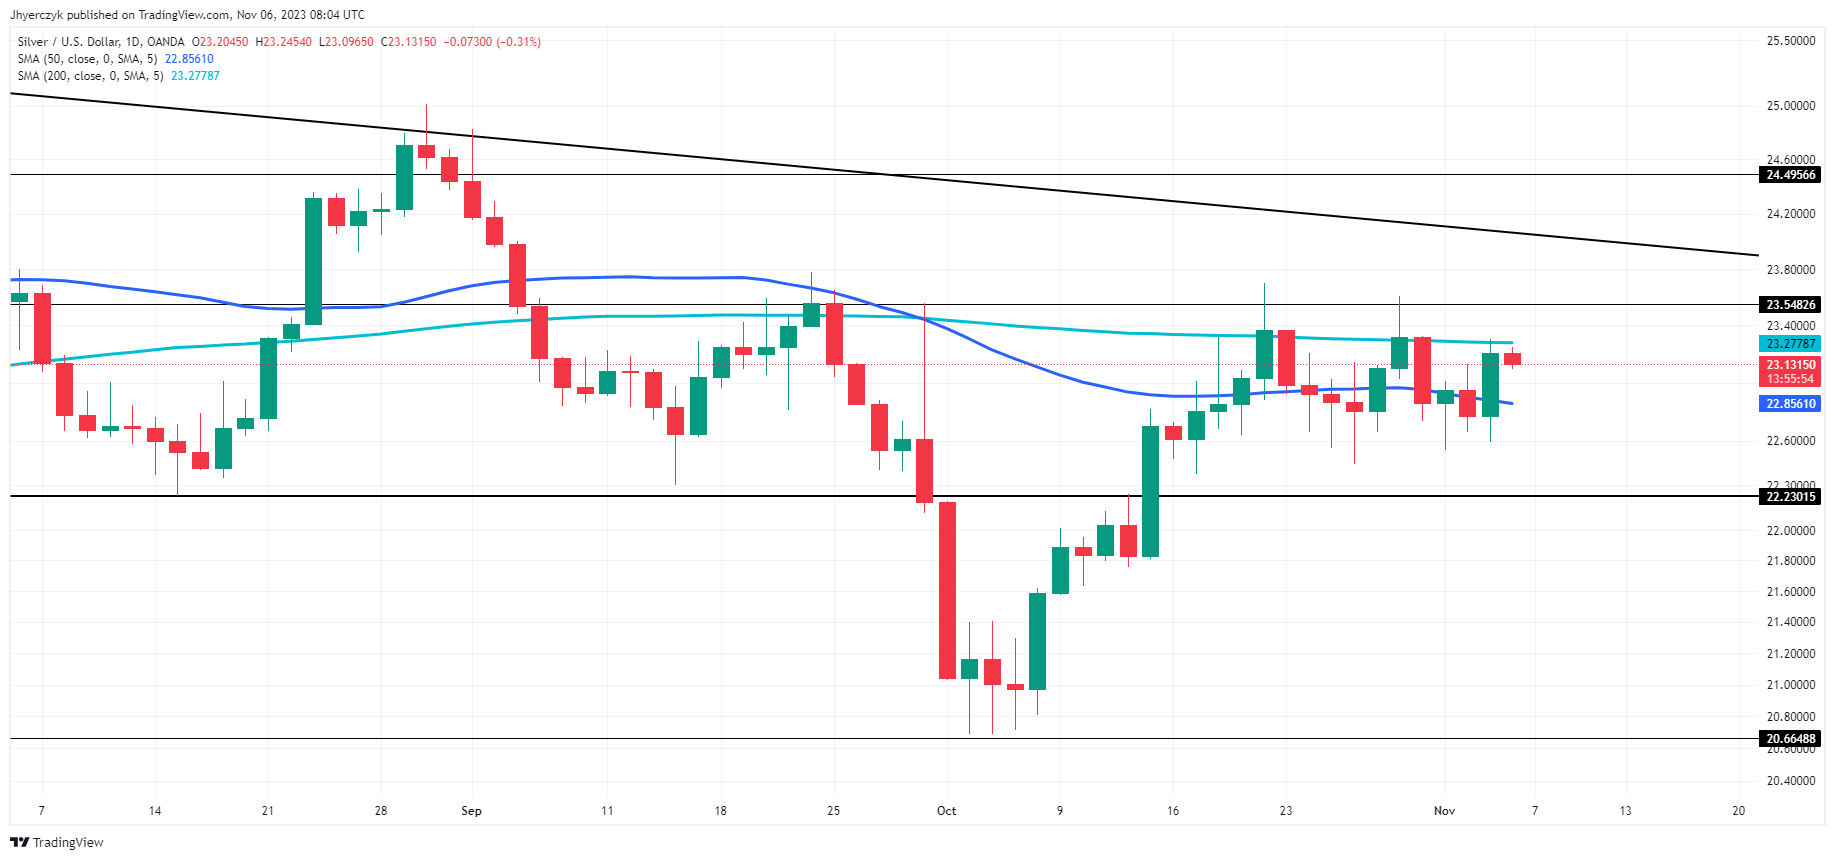
Daily Silver (XAG/USD)The current Daily price of silver (XAG/USD) at 23.14 is marginally below the previous close, indicating a slight bearish inclination in the short term.

It hovers below both the 200-day and 50-day moving averages, set at 23.38 and 22.86 respectively, suggesting a potential consolidation phase as it trades within this range.

The proximity of the price to minor resistance at 23.55 and trend line resistance at 24.06 presents a near-term ceiling that bulls must overcome to shift sentiment.

Conversely, support at 22.23 and 20.66 form crucial thresholds that could stifle bearish momentum if tested.

Without a clear break of these technical levels, the market sentiment appears neutral, awaiting directional cues. A breakout above 23.27 could trigger an acceleration to the upside, while a breakdown under 22.86 could lead to further downside pressure.

Gold Prices Forecast: Powell’s Speech to Steer XAU/USD

Gold Prices Forecast: Powell’s Speech to Steer XAU/USD

Gold Prices Retreat as U.S. Yields Climb

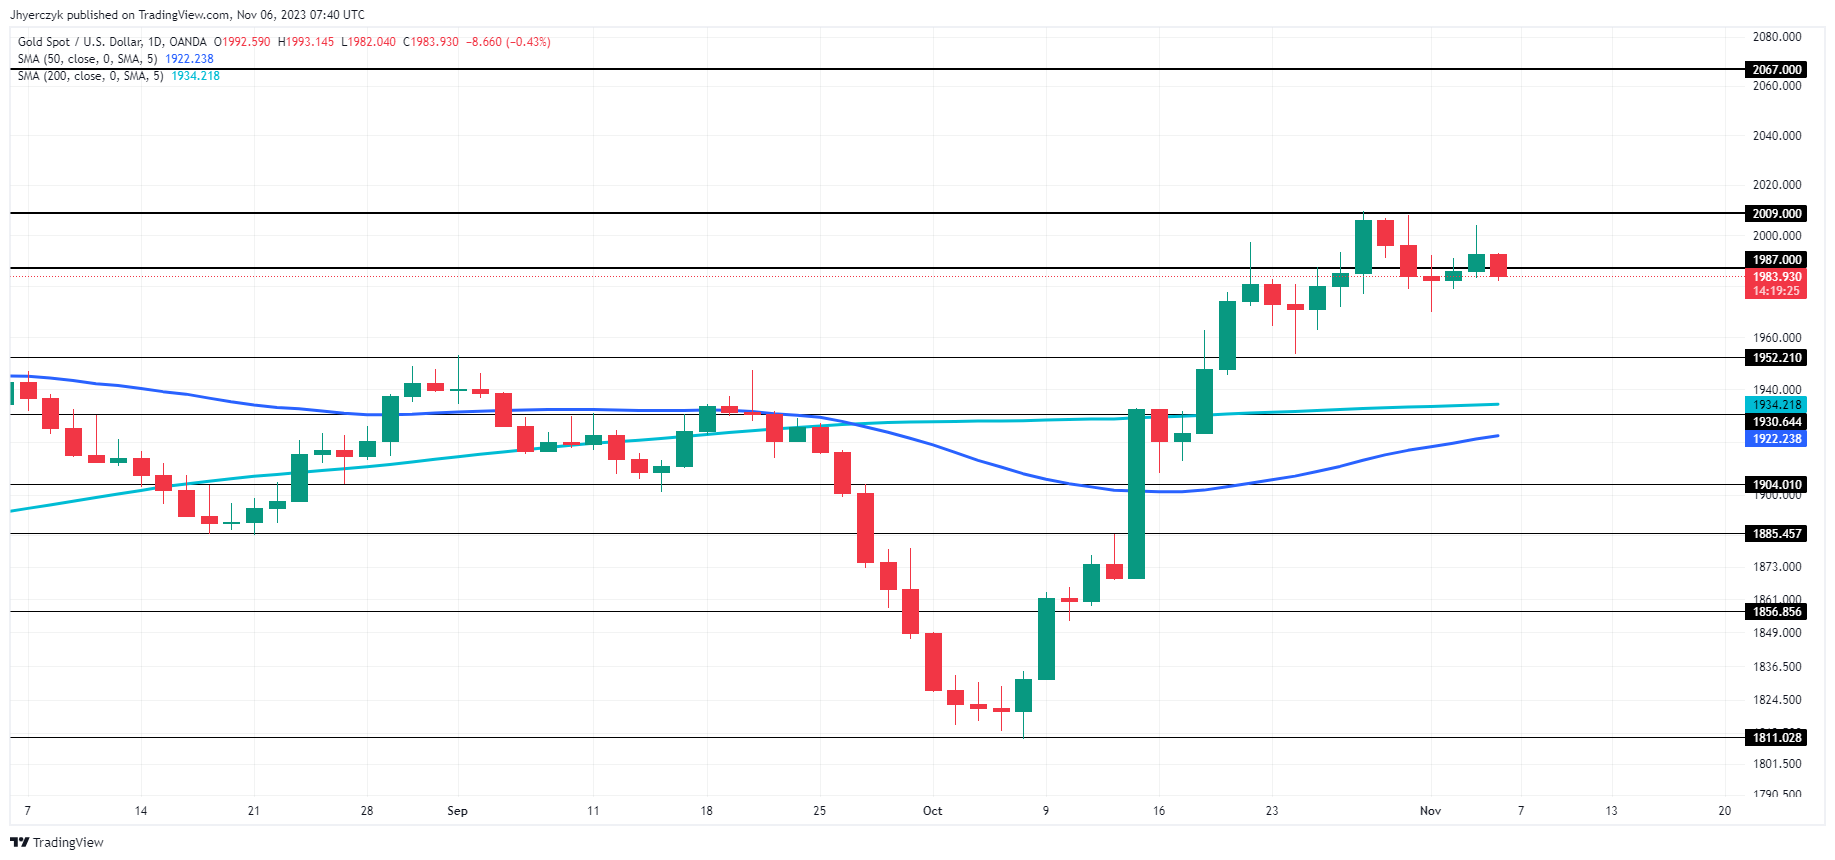
Spot gold (XAU/USD) dipped on Monday with an uptick in U.S. bond yields, anticipating Federal Reserve Chair Jerome Powell’s upcoming remarks to shed light on the interest rate trajectory. Gold’s shimmer waned, dropping 0.51% to $1,982.65 per ounce early in the day, after breaching the $2,000 threshold last week. Concurrently, U.S. gold futures saw a 0.45% decrease to $1,990.10.

Yield Influence and Support Levels

The immediate fate of gold hinges on the movements of U.S. 10-year Treasury yields. A resurgence in yields suggests potential for gold to fall beneath the crucial support of $1,969.91. Following a five-week low, the 10-year yield climbed to 4.5910%, diminishing gold’s allure as yields detract from the appeal of non-yielding assets like bullion.

Trading Derivatives carries a high level of risk to your capital and you should only trade with money you can afford to lose. Trading Derivatives may not be suitable for all investors, so please ensure that you fully understand the risks involved, and seek independent advice if necessary. A Product Disclosure Statement (PDS) can be obtained either from this website or on request from our offices and should be considered before entering into a transaction with us. Raw Spread accounts offer spreads from 0.0 pips with a commission charge of USD $3.50 per 100k traded. Standard account offer spreads from 1 pips with no additional commission charges. Spreads on CFD indices start at 0.4 points. The information on this site is not directed at residents in any country or jurisdiction where such distribution or use would be contrary to local law or regulation.

Labor Market Data and Rate Hike Speculation

A softer-than-expected jobs report catalyzed speculation that the Fed’s rate hikes might pause, pushing the dollar to a six-week trough. Employment growth decelerated in October, with wages posting the mildest year-on-year climb in over two years, hinting at a cooling labor market. Market participants now see a high likelihood of rates holding steady in December, with anticipations of policy easing by mid-year.

Fed Speeches and Rate Path

The week is rife with speeches from at least nine Fed officials, including Chair Powell. Despite maintaining rates this past week, the Fed has not ruled out future hikes. This strategic ambiguity keeps investors on alert for definitive signs of a shift in monetary policy.

ETF Dynamics and Gold’s Outlook

The SPDR Gold Trust reported a slight increase in holdings, reflecting a short-covering trend among speculators. Analysts at ANZ, noting the ETF’s rise, underscored the critical dependency of gold prices on the Fed’s interest rate decisions. As Powell’s speech nears, the financial world watches with bated breath, weighing each clue on gold’s future course.

Short-term Forecast

Gold’s short-term outlook hinges largely on upcoming Federal Reserve communications.

With traders pricing in high chances of the rate hike cycle pausing, and potentially shifting to easing by mid-2023, the immediate trajectory for gold appears cautiously bullish. However, any resurgence in U.S. Treasury yields or unexpected hawkish cues from Fed speeches could undermine this optimism, potentially pressuring gold to test the key support level near $1,969.91.

Hence, while the near-term sentiment leans towards bullish, it remains delicately balanced against pivotal economic indicators and central bank signals.

Technical Analysis

Daily Gold (XAU/USD)The current daily price of gold is trading below the previous close, indicating a slight pullback in the market. Despite this dip, the price remains above both the 200-day and 50-day moving averages, suggesting a general bullish trend over the medium to long term.

With the price nestled between minor support at 1952.21 and minor resistance at 1987.00, there’s room for fluctuations within this range. The proximity to key moving averages and the recent retraction from a higher close could imply that bullish sentiment is under pressure, yet the dominant trend still leans positive.


Oil Prices Forecast: Futures Gain as Saudi Arabia, Russia Extend Output Cut Commitments

Oil Prices Forecast: Futures Gain as Saudi Arabia, Russia Extend Output Cut Commitments

Oil Market Reacts to Output Cuts

Oil prices saw a modest increase on Monday amid pledges from major exporters to maintain significant production cuts, setting a scene of tighter supply. Investors also braced for potentially intensified U.S. sanctions on Iranian exports.

Saudi and Russian Commitments

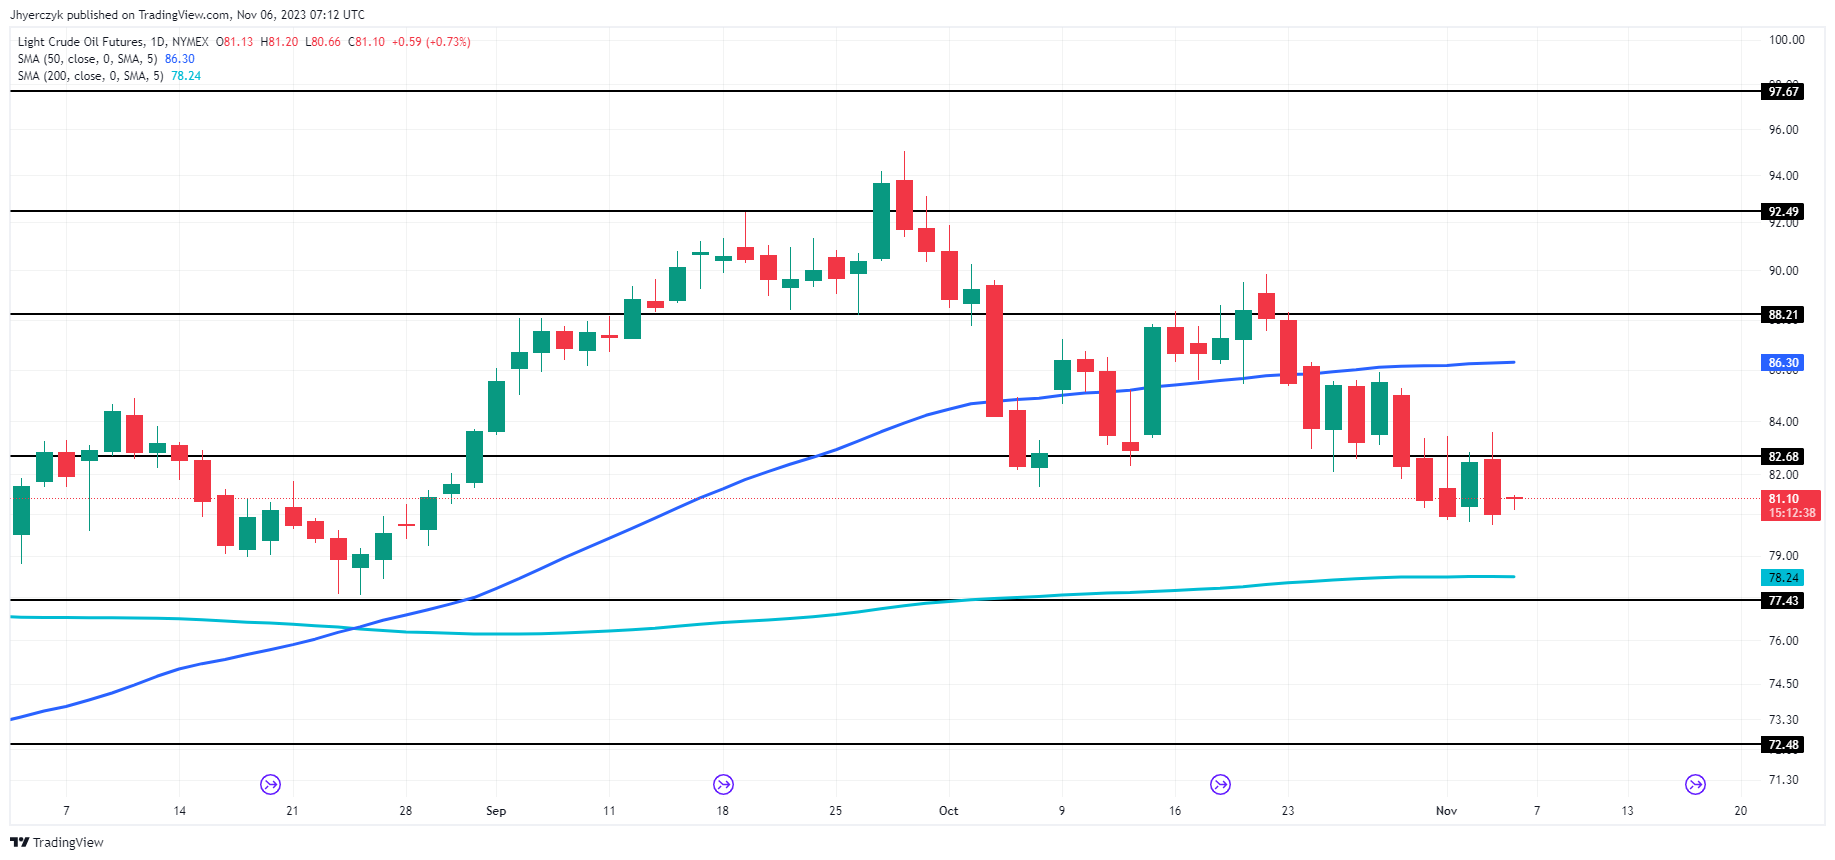
Brent crude futures experienced a lift of 0.59% to $85.39 a barrel, with U.S. West Texas Intermediate (WTI) following closely at a 0.75% rise to $81.11 a barrel. The upward trend came after Saudi Arabia’s confirmation of sustaining an additional voluntary cut, trimming 1 million barrels per day to cap their output at 9 million bpd. Russia mirrored this stance, upholding a 300,000 bpd cut from its exports.

Trading Derivatives carries a high level of risk to your capital and you should only trade with money you can afford to lose. Trading Derivatives may not be suitable for all investors, so please ensure that you fully understand the risks involved, and seek independent advice if necessary. A Product Disclosure Statement (PDS) can be obtained either from this website or on request from our offices and should be considered before entering into a transaction with us. Raw Spread accounts offer spreads from 0.0 pips with a commission charge of USD $3.50 per 100k traded. Standard account offer spreads from 1 pips with no additional commission charges. Spreads on CFD indices start at 0.4 points. The information on this site is not directed at residents in any country or jurisdiction where such distribution or use would be contrary to local law or regulation.


Market Surplus Forecasts

Analysts from ING project a market surplus in the upcoming quarter, which may encourage the continuance of production restraints by Saudi Arabia and Russia. Despite this, both Brent and WTI notched a 6% decline the previous week, as geopolitical concerns seemed to ease, with U.S. diplomatic engagements aiming to diminish regional tensions.

Geopolitical Risks and Price Support

The oil market currently does not heavily factor in geopolitical risks, keeping this as a potential catalyst for price hikes. For the week ahead, attention turns to China for economic indicators, following their less-than-stellar October factory data. WTI is expected to sustain above $80, with potential fallback to August lows if breached, while Brent should remain buoyed between $80 and $85, supported by the supply cuts, anticipated cessation of interest rate hikes, and a softening U.S. dollar.

Potential Impact of U.S. Sanctions on Iran

On the geopolitical front, the U.S. House of Representatives has passed a bill aiming to tighten sanctions on Iranian oil, targeting foreign entities processing Iranian petroleum. The impact of these potential sanctions on Iran’s oil exports remains to be seen, with factors like national security waivers and China’s import behavior playing significant roles. Domestically, the U.S. noted a decrease in active oil rigs, reaching the lowest count since January 2022, indicating a shift in production dynamics.

Short-Term Forecast

The short-term outlook remains cautious yet optimistic, as the market weighs supply constraints against geopolitical developments and economic data points.

Technical Analysis

Daily Light Crude Oil FuturesThe current daily price of light crude oil futures at 81.10 is trading above the main support level of 72.48, indicating a firm underlying market strength. It is also marginally below the minor resistance level of 82.68, suggesting a possible retest of this threshold.

The price sits comfortably above the 200-day moving average of 78.24, which is typically seen as a bullish market indicator, pointing to a longer-term uptrend. However, it remains below the 50-day moving average of 86.30, indicating that there may be some short-term bearish sentiment or a consolidation phase in the near term.

The mixed signals from the moving averages and proximity to minor resistance suggest a cautious outlook, with potential for both upside if the minor resistance is breached, and downside if the price retreats from these levels.

Overall, the sentiment leans cautiously bullish, with an emphasis on the word ‘cautiously’ due to the price’s position relative to the moving averages and resistance levels.

US Dollar Forecast: EUR/USD, GBP/USD and AUD/USD Break Out, USD/JPY Muted

US Dollar Forecast: EUR/USD, GBP/USD and AUD/USD Break Out, USD/JPY Muted

The broader U.S. dollar suffered heavy losses this past week after the Fed failed to guide investors toward pricing another interest rate hike for this cycle. Weaker-than-expected U.S. labor market and ISM services data reinforced the greenback’s retreat by driving Treasury yields in most maturities sharply lower. Against this backdrop, the euro, the British pound, and the Aussie staged a solid rally against their American counterpart. The Japanese yen, meanwhile, ended the week virtually flat, with the USD/JPY settling around the 149.50 mark.

This article focuses on EUR/USD, GBP/USD, AUD/USD, and USD/JPY from a technical perspective, examining critical price levels for the upcoming trading week.

Curious about the expected path for EUR/USD and the market catalysts that could spark volatility? Explore all the details in our Q4 euro trading forecast. Get your free copy now!

EUR/USD TECHNICAL ANALYSIS

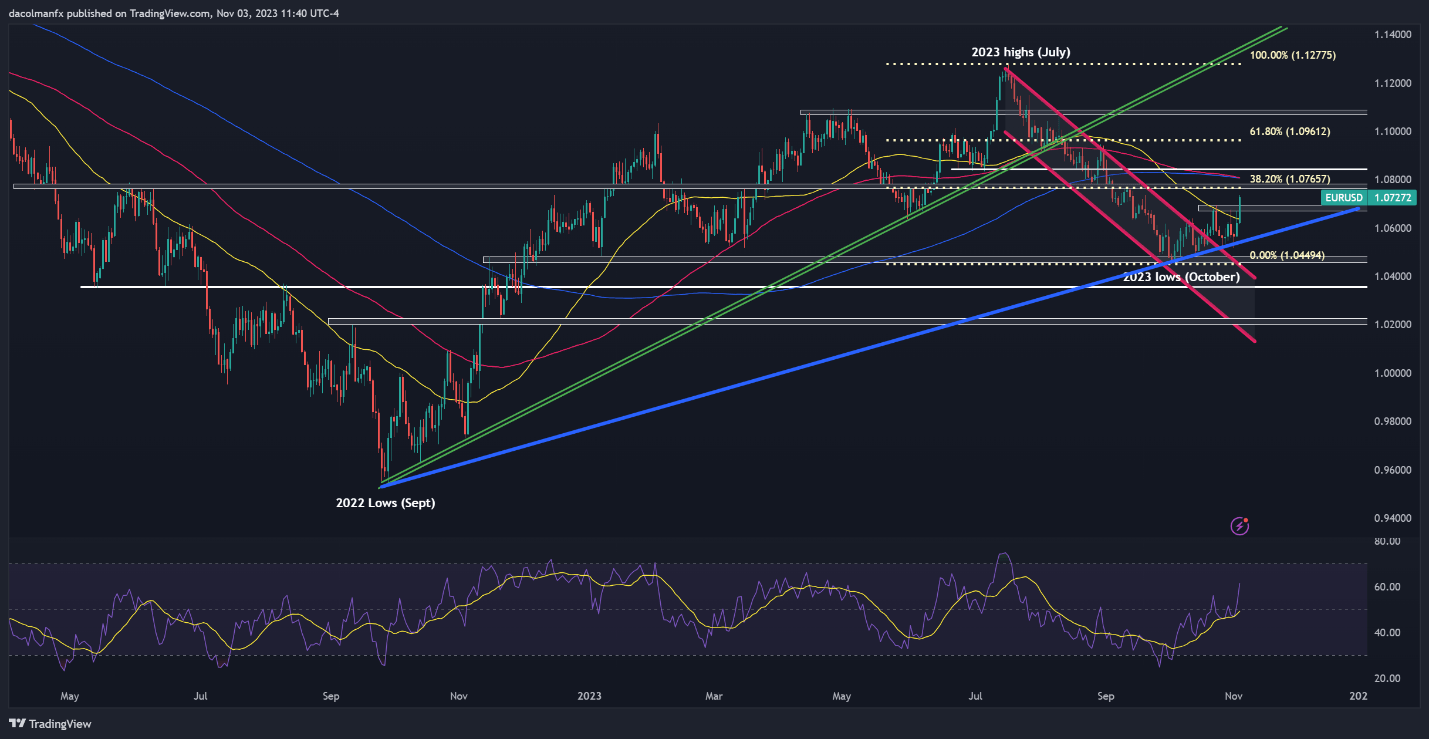
EUR/USD exploded to the upside heading into the weekend following disappointing U.S. economic reports, clearing former resistance in the 1.0670/1.0695 range. If this bullish breakout is sustained in the coming trading sessions, buyers could become emboldened to challenge Fibonacci resistance and the 200-day simple moving average near 1.0765 level. On further strength, the focus shifts to 1.0840.

On the other hand, if sellers return and regain command of the market, initial technical support is positioned at 1.0695/1.0670, but further losses may be in stored on move beneath this threshold, with the next bearish target at 1.0550. If dynamic trendline support at 1.0550 is violated, we could see a push toward this year’s lows around 1.0450.

EUR/USD TECHNICAL CHART

A screenshot of a computer screen  Description automatically generated

Access a well-rounded view of the Japanese yen’s fundamental and technical outlook by securing your complimentary copy of our Q4 trading forecast.

USD/JPY TECHNICAL ANALYSIS

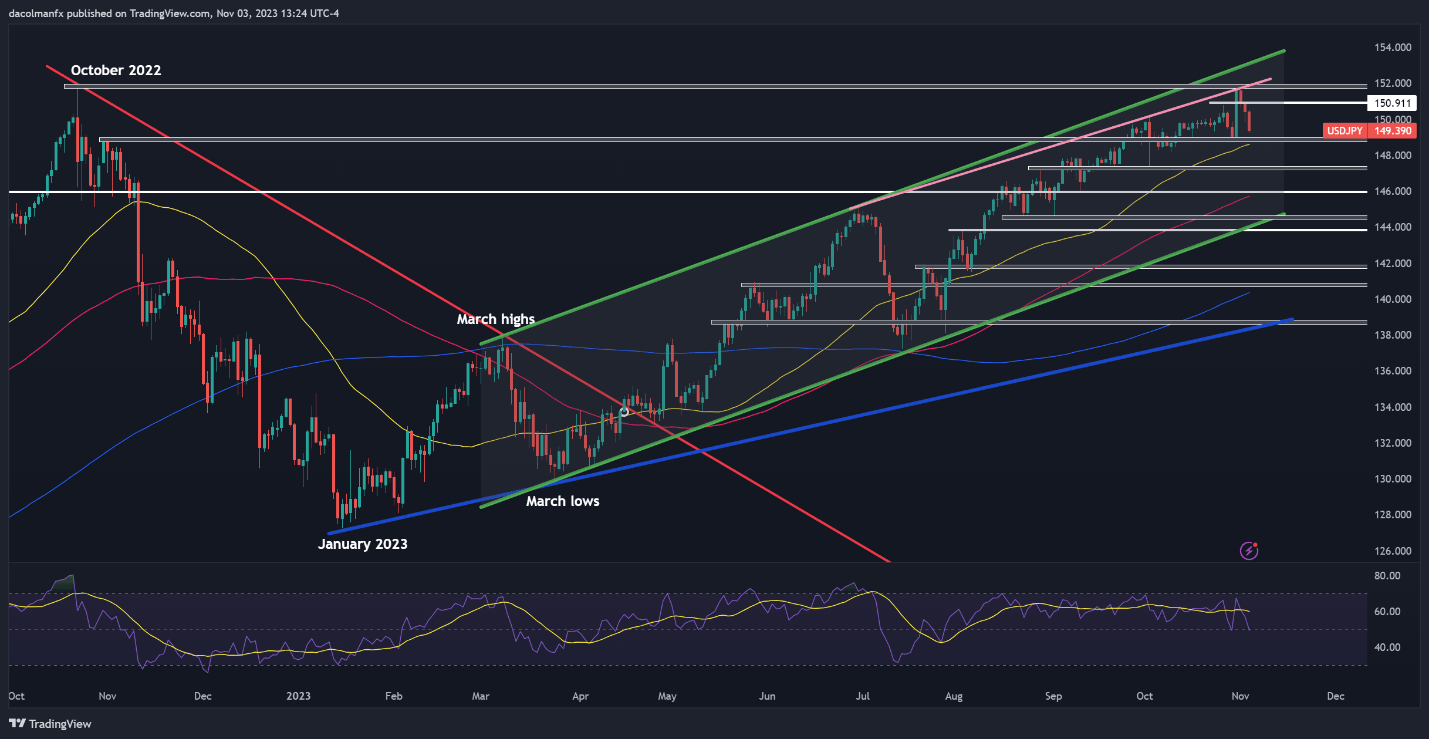
USD/JPY fell on Friday, extending its decline for the third consecutive day after failing to overcome technical resistance near the 152.00 mark. If losses gain impetus in the coming week, support is situated at 148.75. While the pair may have difficulty breaching this area, a clean breakdown could reinforce downside pressure, setting the stage for a descent towards 147.30.

Conversely, if the bullish camp regains control and triggers an upward reversal, overhead resistance spans from 151.95 to 152.00, where this year’s peak aligns with last year’s swing high. In the event of sustained strength, a potential rally towards 153.00 becomes conceivable. This ceiling is created by the upper limit of a medium-term rising channel.

USD/JPY TECHNICAL CHART

A screenshot of a computer screen  Description automatically generated


Gold/Silver Weekly Forecast: Investors Capitalize on Weak NFPs

Gold/Silver Weekly Forecast: Investors Capitalize on Weak NFPs

XAU/USD & XAG/USD FUNDAMENTAL BACKDROP

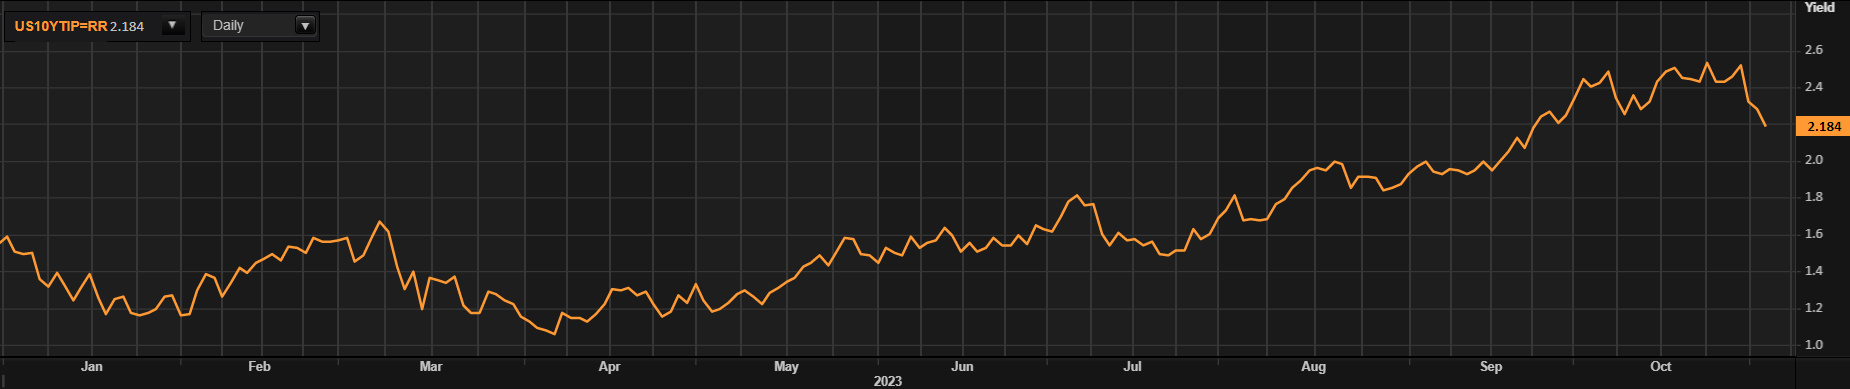
Gold prices exploited the weaker than expected Non-Farm Payrolls (NFP) report last week Friday that showed a higher unemployment rate and lower wage growth (a key contributor to inflationary pressures in the US). Although one release does not make a trend, this may be the beginning of a weaker jobs market within the region. The Federal Reserve would welcome such data in an environment where tight monetary policy conditions have heightened recessionary and stagflation concerns of recent. The known-on effect on financial markets saw a drastic decline in US Treasury yields, thus translating through to a fall in real yields (see graphic below). Overall, gold’s attractiveness has increased considering the opportunity cost of holding gold has decreased.

US REAL YIELDS (10-YEAR)

image1.png

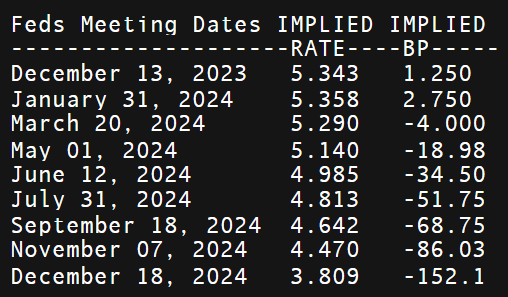
Money markets have shifted their interest rate expectations for the Fed by roughly 90bps from just a few weeks ago in terms of cumulative rate hikes by December 2024 (152bps) with the first cut projected around May/June as opposed to July.

IMPLIED FED FUNDS FUTURES

image2.png

From a geopolitical standpoint, the war between Israel-Hamas remains volatile and will continue to support gold prices due to its safe haven allure. While the war is relatively contained at this point, any escalation could stoke contagion fears, ultimately driving up the price of gold.

The week ahead (see economic calendar below) is relatively muted versus last week but Fed guidance will drive volatility throughout the week. With Fed Chair Jerome Powell in focus, other Fed officials are scheduled to speak as well. Capping off the quiet week will see Michigan consumer sentiment possibly aiding the US dollar if expectations are to prove true.

GOLD ECONOMIC CALENDAR

image3.png

Want to stay updated with the most relevant trading information? Sign up for our bi-weekly newsletter and keep abreast of the latest market moving events!

TECHNICAL ANALYSIS

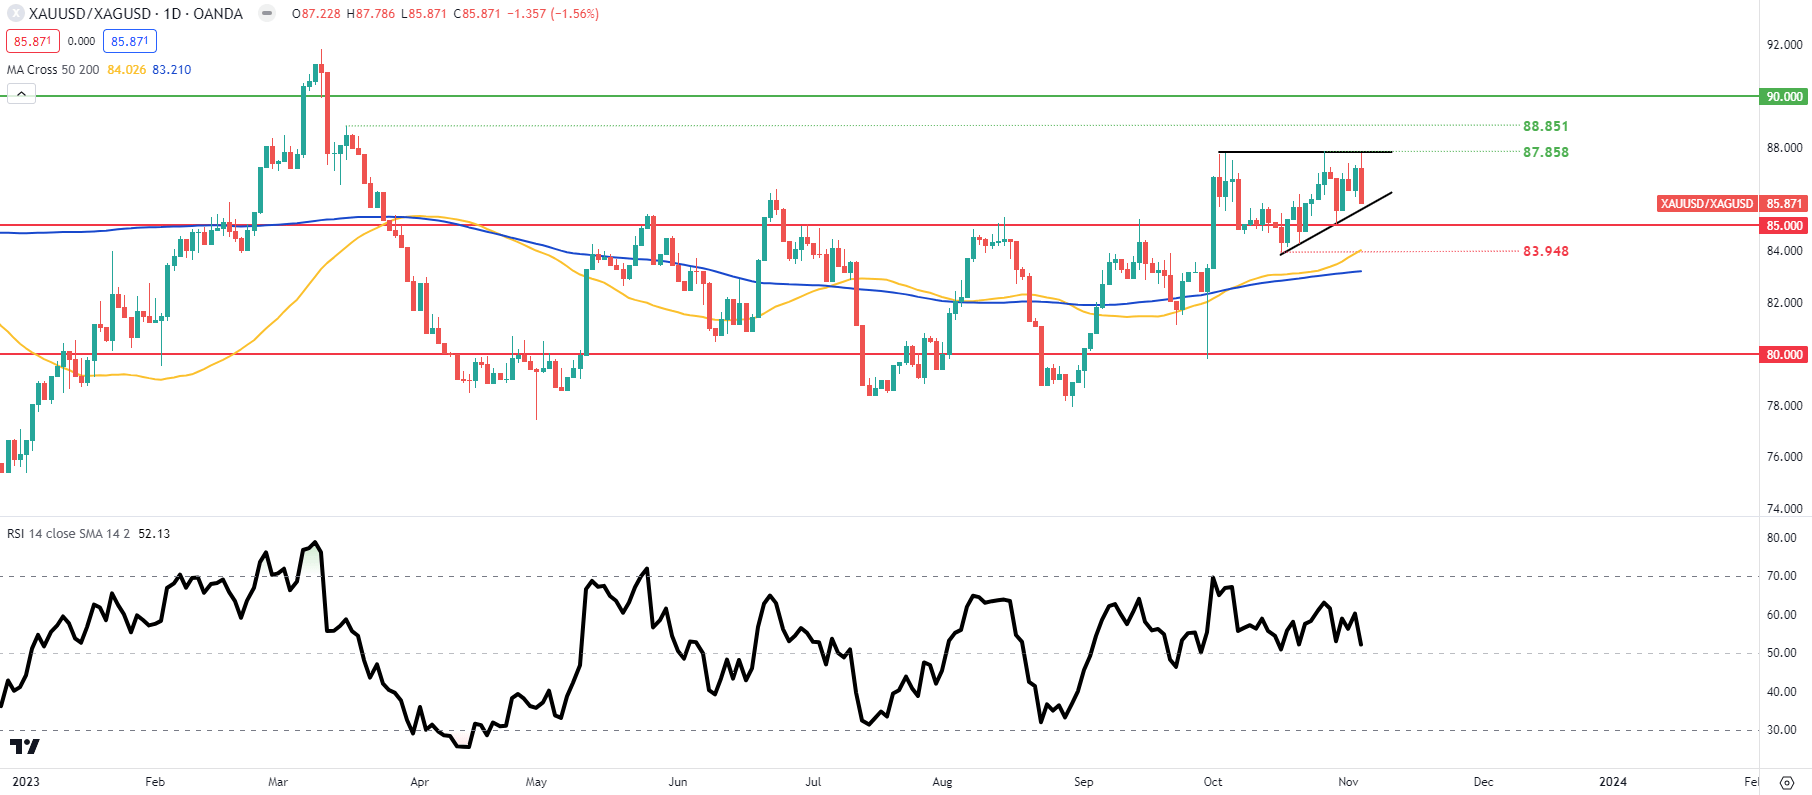
GOLD/SILVER RATIO DAILY CHART

image4.png

The gold/silver ratio price chart shows a developing ascending triangle pattern that could favor a further increase in the ratio reading. With gold and silver possibly staying elevated throughout the medium-term, gold may be the favorable metal.

MORE ON THE GOLD/SILVER RATIO HERE!

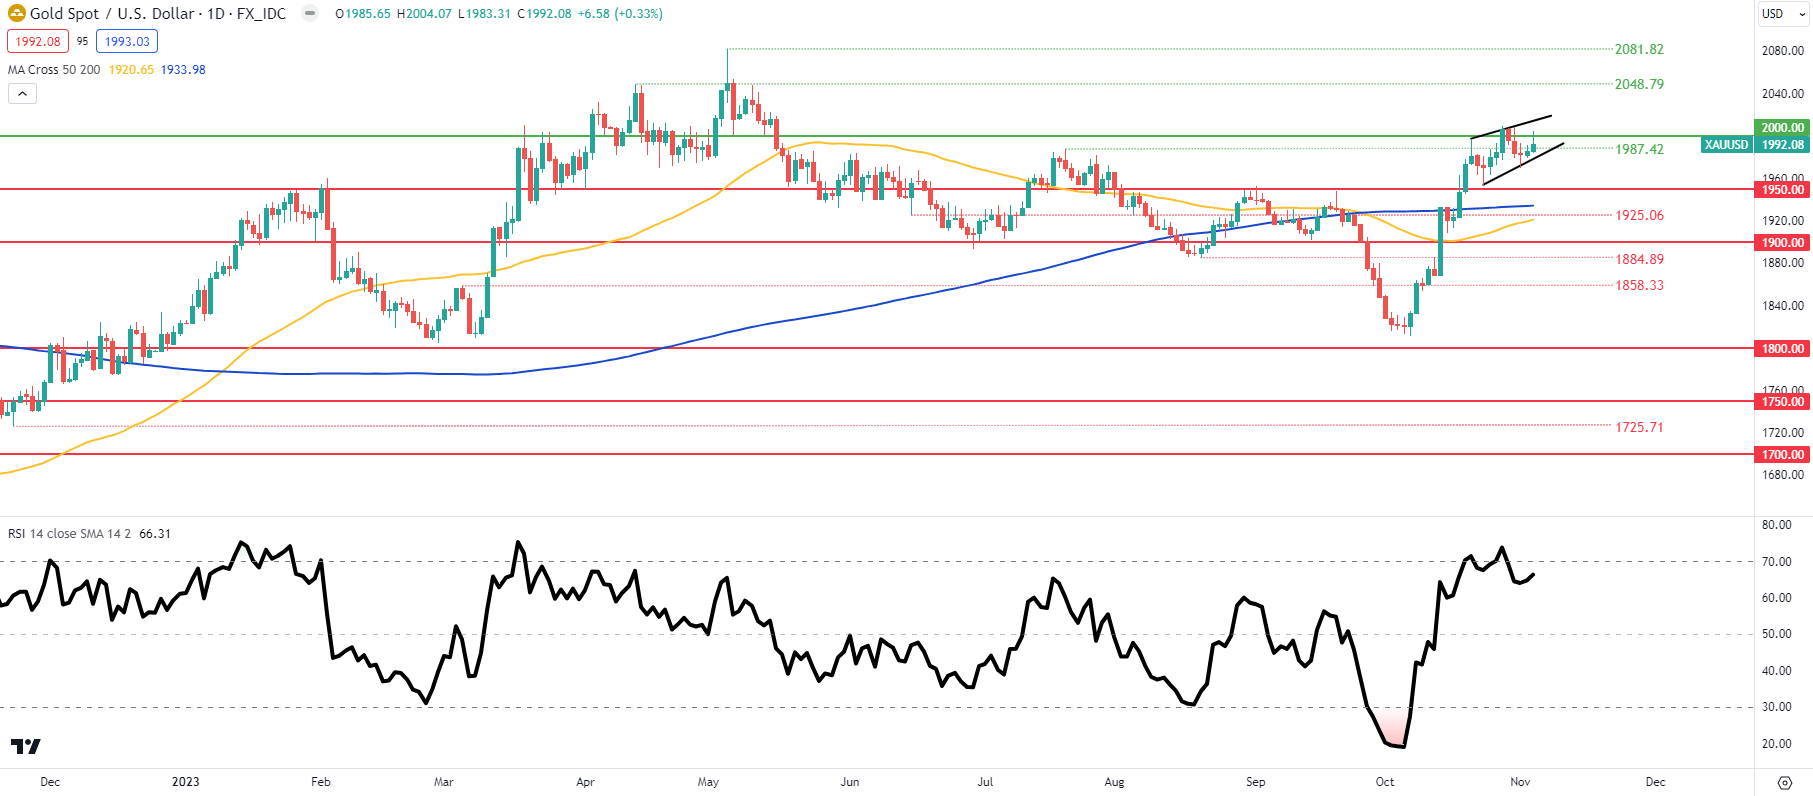
GOLD PRICE DAILY CHART

image5.png

Daily XAU/USD price action currently trades within a rising wedge type formation (black) that traditionally appears after a prior downtrend. In this case, the uptrend negates much of the patterns validity but with the Relative Strength Index (RSI) in overbought territory, a pullback may not be out of the questions. A longer-term view could see gold price pair back after which a potential golden cross could form, allowing for another leg higher for XAU/USD.

Markets Week Ahead: Gold Muted, Nasdaq 100, EUR/USD, GBP/USD Rip as US Yields Sink

Markets Week Ahead: Gold Muted, Nasdaq 100, EUR/USD, GBP/USD Rip as US Yields Sink

U.S. Treasury yields plummeted this past week after Fed Chair Powell failed to redirect investors toward pricing further monetary tightening and U.S. employment data revealed a sharp slowdown in hiring activity. The large retreat in yields sent the broader U.S. dollar reeling, paving the way for a furious rally in major currency pairs such as EUR/USD, GBP/USD and AUD/USD heading into the weekend.

Bond market dynamics also benefited risk assets, boosting both the S&P 500 and Nasdaq 100, which had their best week since November 2022. With sentiment clearly recovering and signs that a recession is not yet imminent, stocks may have room to run higher in the near term, with seasonality possibly providing an additional source of strength.

For a complete overview of the euro’s technical and fundamental outlook in the coming months, make sure to grab your complimentary Q4 trading forecast now!

Focusing on gold, bullion was subdued, unable to take advantage of the weaker U.S. dollar and falling government rates. This is probably because the geopolitical premium built up in the precious metal following the terrorist attacks in Israel has started to unwind, as the war against Hamas has not escalated into a wider regional conflict in the Middle East.

Looking ahead, there are no major economic reports in the U.S in the coming week., but several Federal Reserve members, including Powell, will speak publicly. Retail traders should closely follow these events and scrutinize official statements for insights into the central bank’s thinking and the likely path of monetary policy.

Any indication that the policymakers will tread carefully and refrain from hiking rates again could weigh on Treasury yields and the U.S. dollar, but support stocks and precious metals. Hawkish commentary could have the opposite effect on these assets. For a deeper dive into the catalysts that could guide markets and create volatility, be sure to check out selected forecasts put together by the DailyFX team.

Looking for actionable trading ideas? Download our top trading opportunities guide packed with insightful strategies for the fourth quarter!

US ECONOMIC CALENDAR

Source: DailyFX Economic Calendar

FUNDAMENTAL AND TECHNICAL FORECASTS

British Pound (GBP/USD) Reverses Sharply Higher After US Jobs Data

The US bond market is sending out a clear signal: interest rates have peaked and they are going down next year. This US dollar weakness is helping GBP/USD reverse its recent slump.

Australian Dollar Forecast: The RBA is Under Starters Orders

The Australian Dollar found some traction ahead of the RBA monetary policy decision in the aftermath of accelerating inflation. Will a rate hike further boost AUD/USD and AUD/JPY?

Japanese Yen Weekly Forecast: BoJ Tweak Fails to Inspire but Dollar Weakness Looks Promising for USD/JPY

The BoJ delivered a minimal tweak to policy this week with markets still betting on rate hikes in April 2024. USDJPY benefitted from a weaker US Dollar which should it continue could negate the need for full-blown BoJ FX intervention.

Euro Forecast: Euro Picks up after Markets Signal End to US Rate Hikes

EUR/USD was the main beneficiary of the dollar’s massive slide late on Friday after markets reduced the likelihood of another US hike amid slowing jobs data.

US Dollar Forecast: EUR/USD, GBP/USD and AUD/USD Break Out, USD/JPY Flat

In this article, we analyze EUR/USD, USD/JPY, GBP/USD, and AUD/USD from a technical standpoint, highlighting crucial price levels that may act as support or resistance in the upcoming week.