Dogecoin Whales Invest $250M amid 150% Price Rally: Can DOGE overtake PEPE?

Dogecoin Whales Invest $250M amid 150% Price Rally: Can DOGE overtake PEPE?

Key Points:

  • Dogecoin (DOGE) price popped above $0.20 in the early hours of March 5 to bring its weekly gains to the 150% mark
  • Bullish Dogecoin Whales have maintained a bullish outlook acquiring 1.3 billion DOGE between Feb 29, and March, signaling conviction that the price rally could advance even further.
  • The Parabolic SAR indicator suggests that the bulls can firmly in control of the market in the short-term, it current key support level holds.
Dogecoin DOGE Price

Dogecoin (DOGE) price popped above $0.20 in the early hours of March 5, its highest since December 3, 2024 and bringing its weekly gains to the 150% mark in the proccess. On-chain data shows that whale investors have are still buying millions of dollars worth of DOGE despite prices trending at 3-year peak.

Can bullish the Dogecoin whales keep up the buying trend long enough to drive the rally above the next milestone price at $0.30? 

Dogecoin Price Rallies 150% to Join Memecoin Mania

The memecoin market has delivered eye-popping gains in the past week. The likes of PEPE and BONK initially led the way, with the first wave of triple-digit gains.  Interestingly,  mega cap meme coins like Shiba Inu (SHIB) and Dogecoin (DOGE) have now joined the rally.

Dogecoin (DOGE) price action | Feb 28 - March 5, 2024 | Source: TradingView
Dogecoin (DOGE) price action | Feb 28 – March 5, 2024 | Source: TradingViewSeemingly inevitably, DOGE price has eventually broken out into triple-digit rally range. As seen above, between Feb 29 and March 5, DOGE has increased by 140% as the price broke above $0.30.

Whales Enter $250 million Buying Spree

The latest Dogecoin rally has seen price soar to a 3-year peak. But interestingly, on-chain data shows a strategic group of whale investors have continued buying DOGE rather than book profits at current prices.

Dogecoin (DOGE) Whales Wallet Balances vs. Price | Source: Santiment
Dogecoin (DOGE) Whales Wallet Balances vs. Price | Source: SantimentThe Santiment chart above depicts real-time changes in the balances controlled whale wallets holding at least 1 million DOGE (~$200,000). The red trendline shows that whale wallets held a cumulative balance of 53.41 billion DOGE as of Feb 29. But at press time on March that figure has skyrocketed to 54.75 billion DOGE.

This implies that crypto whales have acquired 1.34 billion DOGE worth approximately $250 million within the past week.

When whales keep buying an asset at 3-year peak, it suggests that the momentum is overwhelmingly bullish. With the largest stakeholders angling for gains, retail investors could take a cue and enter bullish positions as well.

Dogecoin Price Forecast: $0.30 is the Key Major Resistance to Beat

Drawing inferences from on-chain data analysis, Dogecoin whales buying spree amid a 140% rally puts DOGE in position to advance toward $0.30 in the weeks ahead.

At press time, Dogecoin is currently trading at $0.18, just above the Upper Bollinger band indicator. Breaking above the $0.25 psychological support could see DOGE price soar by another 50%.

Dogecoin (DOGE) Price Forecast | Source: TradingView
Dogecoin (DOGE) Price Forecast | Source: TradingViewHowever, there’s a chance the bears could negate this narrative if the DOGE price loses the vital $0.15 support. However, as depicted by the upper Bollinger band, the support buy-wall at $0.17 could pose a significant challenge to that scenario.

Bitcoin Price Targets 75k as Whales Invest $670M in 5-days

Bitcoin Price Targets 75k as Whales Invest $670M in 5-days

Bitcoin price soared to a new 2024 peak around $68,770 in the early hours of Tuesday March 5, raising bullish expectations of new BTC all-time highs above $70,000. On-chain data shows that BTC whale investors increased the buying pressure significantly in the last 5-days.

After 3-years on the back-foot, can BTC price bulls finally establish a steady support level above $70,000 territory in the days ahead?

Whale Investors Bought 10,000 BTC in First 5-days of March

The crypto market rally has intensified on Monday March 4, as BTC price came within a few hundred dollars of reaching new all-time highs. However, recent trends observed among Crypto whales suggests the milestone is only a matter of time.

The Santiment chart below shows the number of coins currently held in wallets with at least 10,000 BTC.  As seen below, this cohort of Bitcoin whales held a cumulative opening balance of 2.99 million BTC on March 1.

But interestingly, the BTC top holders have now added 10,000 BTC in the last 5-days, bringing their balances to 3 million BTC at press time on March 5.

Bitcoin (BTC) Whales Wallet Balances | Source: Santiment
Bitcoin (BTC) Whales Wallet Balances | Source: Santiment 


With BTC price currently hovering around $67,400 per coin, it implies the whale wallets have invested over $674 million in the last 5 trading days..  When the largest stakeholders within an crypto currency ecosystem make big purchases during a short period it puts upward pressure on prices.

Also, the ongoing Bitcoin rally is largely being drive by Bitcoin ETFs. Hence, the increase in the balances of these top-holder wallets signals that the ETFs buying frenzy has not cooled off despite Bitcoin price nearing all-time highs in the US markets.

And if retail investors and other strategic stakeholders take a cue from the BTC whales buying trend, BTC price could soon make the much-anticipated another major leap above $70,000.

Bitcoin Price Forecast: Breaking above $70,00 0 Could Catalyze Bigger Gains

Bitcoin top holders acquiring $670 million worth of BTC over the last 5-days appears to be the major catalyst behind the latest price upswing above $68,000. If the buying trend persists as the week unfolds, BTCC bulls could target a move towards the $75,000 area.

But first, BTC has to close the trading day above $69,000. In this scenario, the bulls must withstand the profit-taking wave from final cluster of 22,760  addresses that acquired 5.1 million BTC when prices last approached $70,000.

Breaking above that final resistance, could set the stage for BTC price to advance towards $75,000 retest as predicted.

Bitcoin (BTC) Price Forecast, March, 5 2024 | In/Out of the Money data | Source: IntoTheBlock
Bitcoin (BTC) Price Forecast, March, 5 2024 | In/Out of the Money data | Source: IntoTheBlockOn the downside, the bears could invalidate this prediction by staging another reversal below $60,000. But as observed in the past week, the looming buy-wall at the $63,000 territory offers significant short-term support for Bitcoin price.

Asia Market News: Hang Seng Index Slides on China PMIs and Policy Uncertainty

Asia Market News: Hang Seng Index Slides on China PMIs and Policy Uncertainty

China Sees Private Sector Activity Move Sideways in February

On Tuesday, service sector PMI numbers from China drew investor interest. In February, the Caixin Services PMI slipped from 52.7 to 52.5. Economists forecast the PMI to rise to 53.4.

The figures were significant, with the National People’s Congress opening on Tuesday morning. Despite the better-than-expected Caixin Manufacturing PMI numbers, the service sector PMI raises questions about domestic demand. Importantly, weaker domestic demand warrants further measures to support the economy.

As a result of the softer-than-expected Caixin Services PMI, the Caixin Composite PMI remained unchanged at 52.5. Economists forecast the Caixin Composite PMI to increase from 52.5 to 53.1. In February, the Caixin Manufacturing PMI increased from 50.8 to 50.9.

AUD/USD Has a Mixed Reaction to the PMI Numbers from China

Before the PMI numbers from China, the AUD/USD rose to a high of $0.65113 before falling to a low of $0.65037.

However, in response to the PMI numbers, the Aussie dollar fell from $0.65096 to a low of $0.65037 before steadying.

On Tuesday morning, the AUD/USD was down 0.01% to $0.65072. The AUD/USD avoided a more marked decline as investors awaited updates from the National People’s Congress. In addition to growth forecasts, the markets expect policy measures to support the real estate sector and bolster the economy.

AUD/USD shows reaction to Caixin Services PMI
AUDUSD 3 Minute Chart 050324

Asian Equity Markets Had a Mixed Start to the Tuesday Session

The ASX 200 showed a relatively muted response to the PMI numbers from China. However, the Hang Seng Index tumbled as investors reacted to the weaker-than-expected data.

This morning, the ASX 200 was up 0.04%, while the Hang Seng Index was down 1.65% to 16,322. The Nikkei joined the broader Asian equity markets in negative territory, falling 0.53% to 39,897.

Uncertainty about stimulus measures impacted the appetite for riskier assets.

Tokyo Inflation and the Japanese Yen

Hotter-than-expected inflation numbers for Tokyo failed to sink the USD/JPY. The USD/JPY recovered from an early pullback despite rising bets on an April Bank of Japan pivot from negative rates.

The annual inflation rate for Tokyo accelerated from 1.8% to 2.6% in February. Core inflation picked up from 1.8% to 2.5%.

However, the USD/JPY was down by just 0.02% to 150.492.

USD/JPY held steady despite inflation numbers from Tokyo.
USDJPY Hourly Chart 050324
Psychological Levels & Round Numbers in Forex Trading

Psychological Levels & Round Numbers in Forex Trading

What are psychological levels and how do they work?

Psychological levels are market price levels which are often key levels in forex denoted by round numbers. These round numbers frequently act as levels of support and/or resistance.

Psychological support and resistance consistently work because of fundamental human disposition. Human beings value simplicity; from a trading perspective this means valuing whole numbers. Traders often use these numbers as entry, exit or stop levels. These stops and limits can alter order flow and price changes.

Identifying psychological levels on forex charts

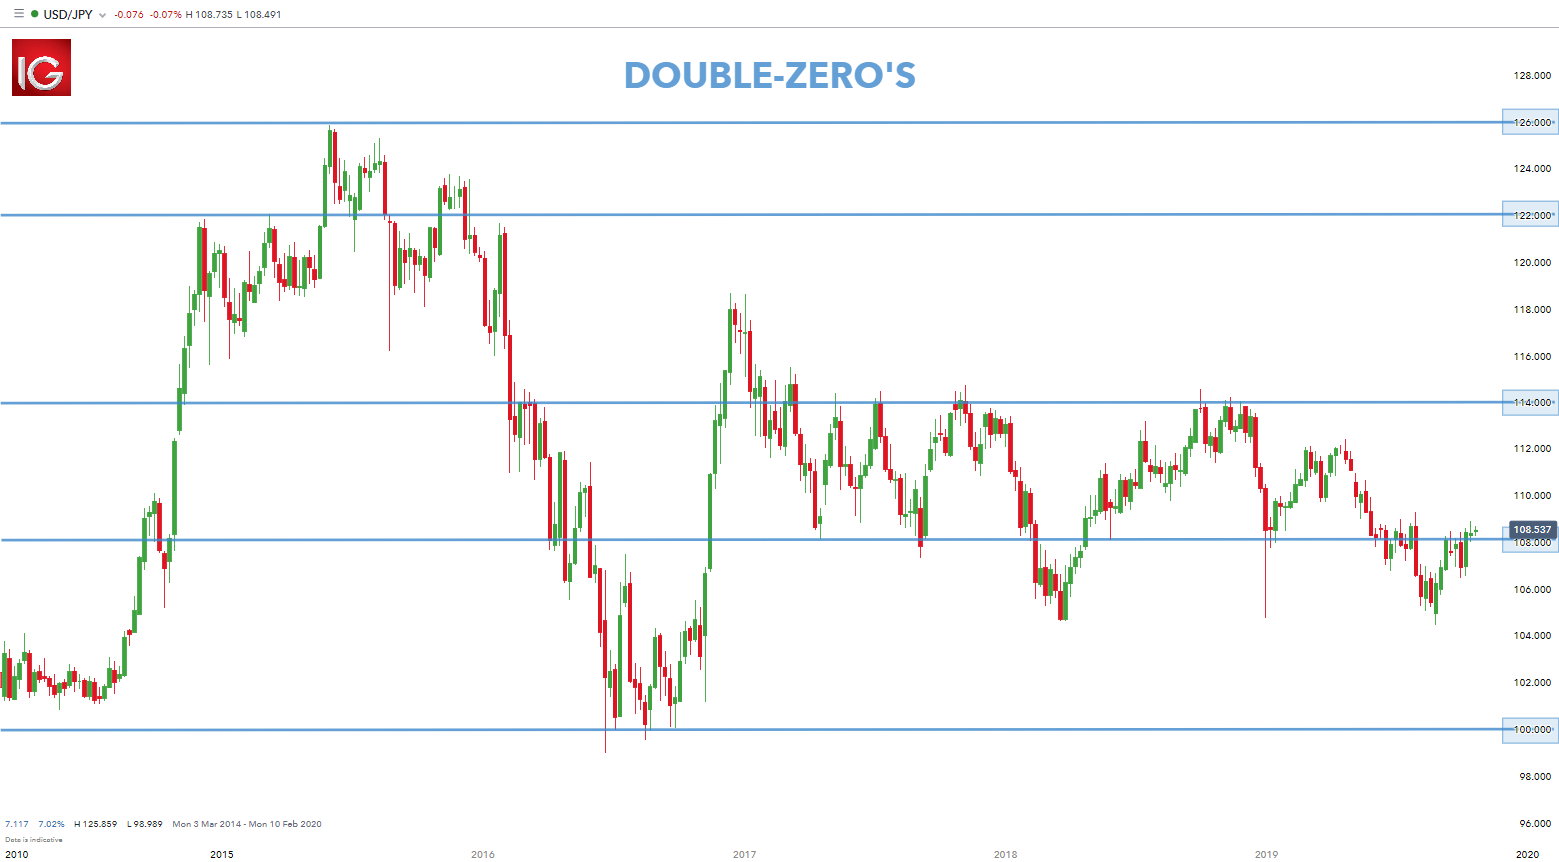
Traders will often call these whole number intervals ‘double-zeros,’ as these prices are at even numbers such as 1.31000 on EUR/USD, 1.57000 on GBP/USD or 132.00 on GBP/JPY. The chart below identifies the ‘double-zeros’ on the current USD/JPY chart.

psychological levels double-zero round numbers on USD/JPY chart

Some traders will take this a step further by looking at the number directly in the middle of these whole numbers or ‘the fifties.’ These levels, such as 1.31500 on EUR/USD or 131.50 on GBP/JPY can often come into play in the same manner as the ‘double-zeros.’

Traders will notice that there will often be some element of congestion at these key levels in forex as prices move up or down. The chart below illustrates USD/ZAR with ‘fifties’ denoted.

psychological levels the fifties USD/ZAR

Notice that many of the price swings on the above chart take place around one of these levels. Therefore, traders want to incorporate these levels into the support and resistance revisions. The chart below represents the initial USD/JPY chart with identified swing levels.

price swings at psychological levels

Consequently, these prices act as a psychological line which work well as support and resistance. Not every one of these prices act as a function of support or resistance, but enough do that these levels warrant the trader’s attention.

How to use psychological levels in forex trading

AUD/JPY weekly chart

forex inflection points

On the AUD/JPY chart above there are six strong inflections off the 75.00 price level. Each time price approached 75.00, the currency pair bounced back up. This is because:

  1. Traders saw the price of 75.00 and believed this is cheap which prompted long AUD trades off this level.
  2. As traders were opening short positions, profit targets were set at an even 75.00. This profit target order to close positions created demand in the market (traders were buying to cover, and this buying interest is considered ‘demand’).

After the first inflection, traders may not have been extremely bullish on the prospect of pushing price much lower than 75.000 as this price has already been exhibited as support.

In many ways, untested ‘psychological’ levels can be looked at like pivot points. An area where there maybe some element of support or resistance.

In general, round numbers such as 70.000 on AUD/JPY or 1.0000 on AUD/USD will garner more attention than a more pedestrian level like 71.000 on AUD/JPY. Most traders will often assign a higher degree of strength to the more rounded-intervals.

Where traders can really find value with these levels is when prices may have resisted or been supported there in the past. This tells the trader that others are noticing and acting on those prices, and the potential for the ‘self-fulfilling prophecy’ of technical analysis may potentially be considered with more strength.

Advantages and limitations of psychological levels

Key levels in forex should be assessed in line with the current trend and whether there is secondary technical suggestions in favor of the trade. Below are the advantages and limitations of psychological levels:

ADVANTAGES LIMITATIONS
Serves as key levels of support and resistance Not always 100% reliable as a key level
Easy to identify for novice traders Should be used as a guideline in conjunction with supporting indicators/technical analysis techniques
Can be implemented in all financial markets
How to Trade the Evening Star Candlestick Pattern

How to Trade the Evening Star Candlestick Pattern

What is an Evening Star Candlestick?

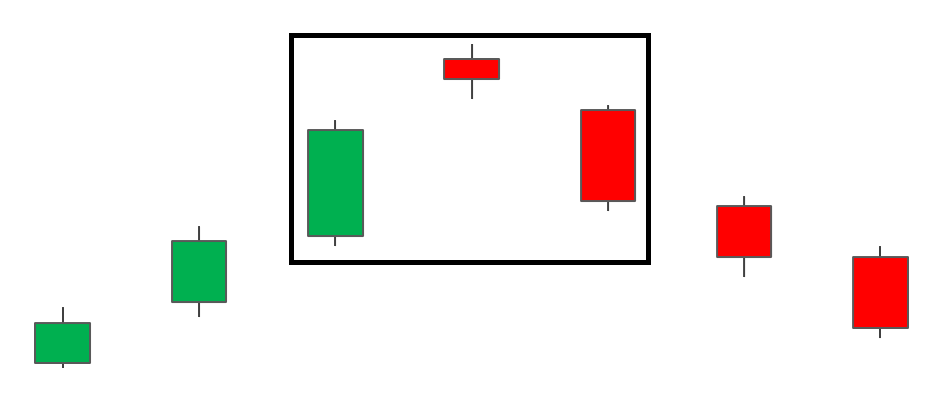
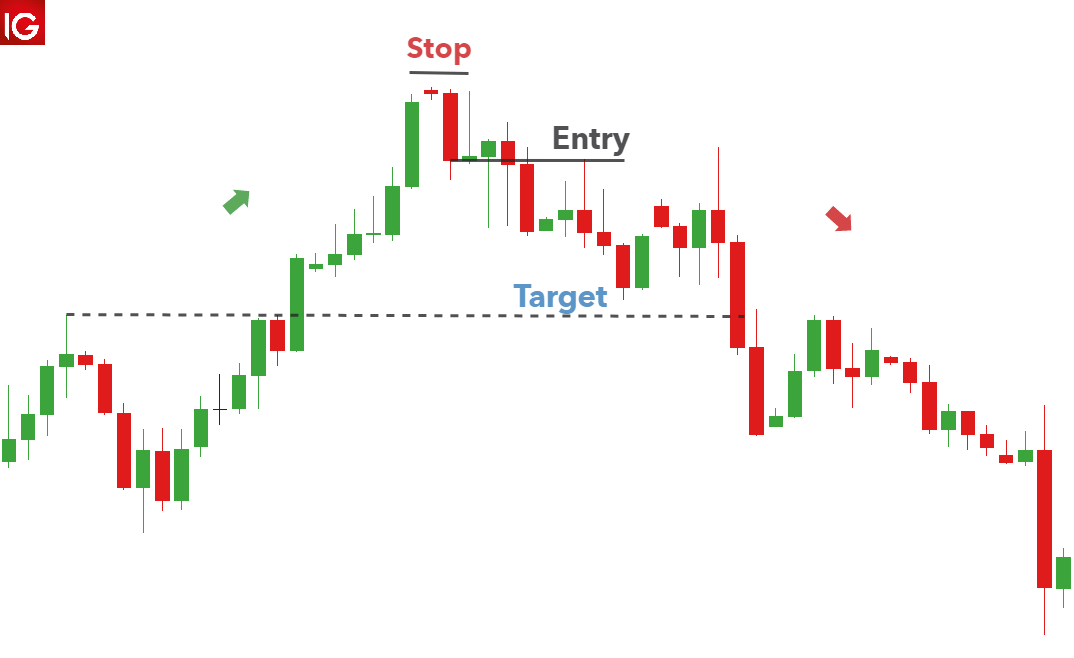
The Evening Star pattern is a three-candle, bearish reversal candlestick pattern that appears at the top of an uptrend. It signals the slowing down of upward momentum before a bearish move lays the foundation for a new downtrend.

evening star pattern

How to identify an Evening Star on Forex Charts

Identifying the Evening Star on forex charts involves more than simply identifying the three main candles. What is required, is an understanding of previous price action and where the pattern appears within the existing trend.

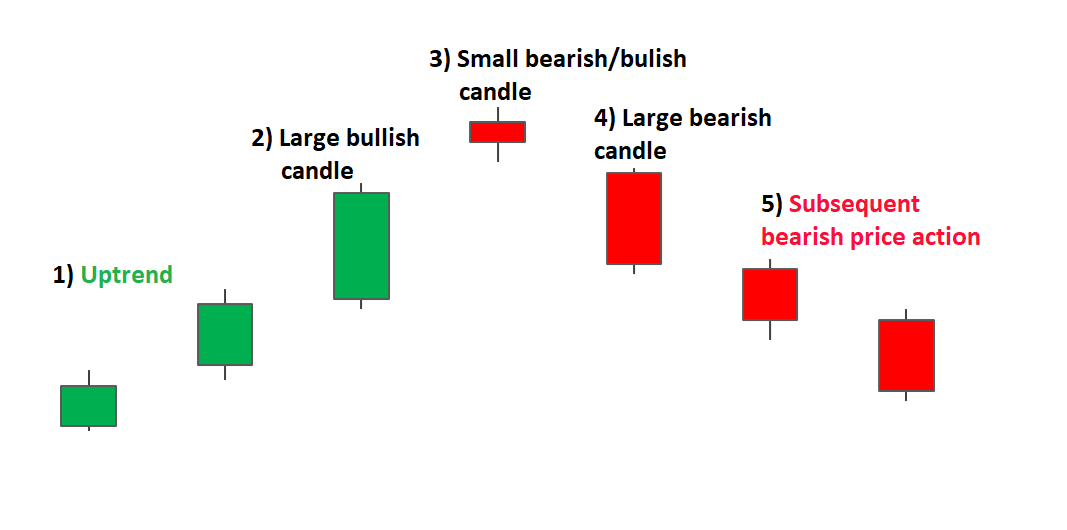
  1. Establish an existing uptrend: The market should be exhibiting higher highs and higher lows.
  2. Large bullish candle: The large bullish candle is the result of large buying pressure and a continuation of the existing uptrend. At this point traders should only be looking for long trades as there is no evidence of a reversal yet.
  3. Small bearish/bullish candle: The second candle is a small candle – sometimes a Doji candle – that presents the first sign of a fatigued uptrend. Often this candle gaps higher as it makes a higher high. It does not matter if the candle is bearish or bullish as the main takeaway here is that the market is somewhat undecided.
  4. Large bearish candle: The first real sign of new selling pressure is revealed in this candle. In non-forex markets, this candle gaps down from the close of the previous candle and signals the start of a new downtrend.
  5. Subsequent price action: After a successful reversal, traders will observe lower highs and lower lows but should always manage the risk of a failed move through the use of well-placed stops.

Bearish Evening Star Candle formation

Traders will often look for signs of indecision in the market where buying pressure subsides and leaves the market somewhat flat. This is the ideal place for a Doji candle to appear.

Evening Star Doji

Doji candles can be observed as the market opens and closes at the same level or very close to the same level. This indecision paves the way for a bearish move as bears see value at this level and prevent further buying. The appearance of the bearish candle after the Doji provides this bearish confirmation.

evening star doji candle

What about the Morning Star

The bullish version of the Evening Star is the Morning Star and it signifies a potential turning point in a falling market (bullish reversal pattern). The same analysis applied to the Evening Star can be implemented with the Morning Star however, it will be the opposite direction.

How to Trade the Evening Star Candlestick Pattern

The Evening Star pattern can be observed in the EUR/GBP chart below, where there is an established uptrend leading up to the formation of the reversal pattern.

Looking at the chart, once the formation has completed, traders can look to enter at the open of the very next candle. More conservative traders could delay their entry and wait to see if price action moves lower. However, the drawback of this is that the trader could enter at a much worse level, especially in fast moving markets.

Targets can be placed at previous levels of support or previous area of consolidation. Stops can be placed above the recent swing high, as a break of this level would invalidate the reversal. Since there are no guarantees in the forex market, traders should always adopt sound risk management while maintaining a positive risk to reward ratio.

Trading the Evening Star EUR/GBP

When trading the Evening Star on forex markets, the price will very rarely gap like they do with stocks and so the three-candle pattern usually opens very close to the previous closing level.

How reliable is the Evening Star in Forex Trading?

The Evening Star, like most candlestick patterns, should be assessed in line with the current trend and whether there is supporting evidence in favour of the trade, when looking at an indicator. Below are the advantages and limitations of the Evening Star pattern:

Advantages Limitations
Occurs frequently in the forex market A failed reversal is possible, and price could move further up
The pattern presents well-defined entry and exit levels
Evening Stars are easy to identify

Further Reading on Candlestick patterns

  • If you are new to candlesticks, read our guide to the top 10 candlestick patterns to trade the markets.
  • There are many reversal patterns so it is important to be able to identify them in the forex market. Some of the top reversal patterns include:

– Bearish engulfing

– Bearish Harami

– Morning Star

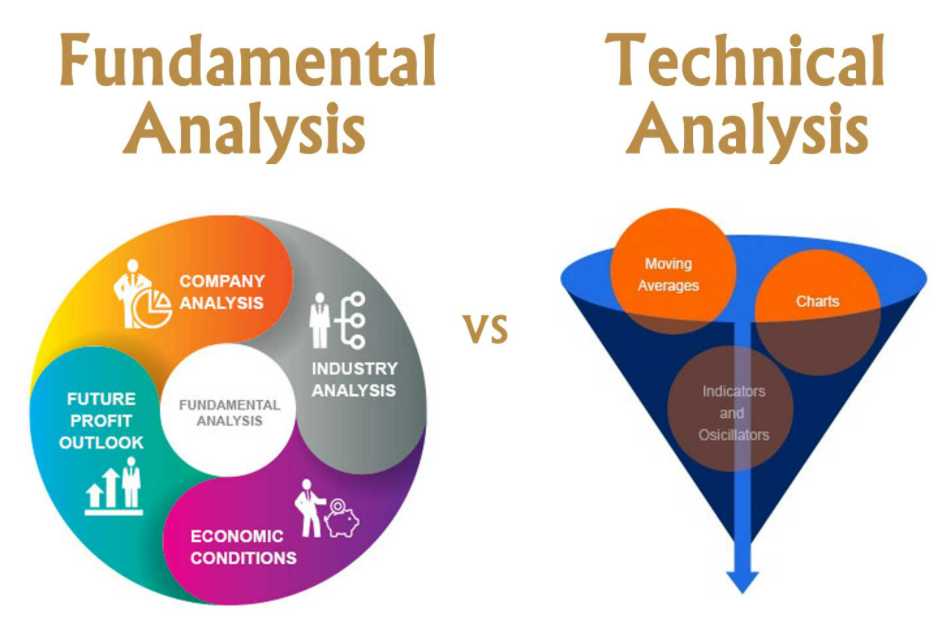
Technical vs Fundamental Analysis in Forex

Technical vs Fundamental Analysis in Forex

Fundamental Analysis

Fundamental analysis involves assessing the economic well-being of a country, and by extension, the currency. It does not take into account currency price movements. Rather, fundamental forex traders will use data points to determine the strength of a particular currency.

A fundamental forex trader will analyze the country’s inflation, trade balance, gross domestic product, growth in jobs and even their central bank’s benchmark interest rate.

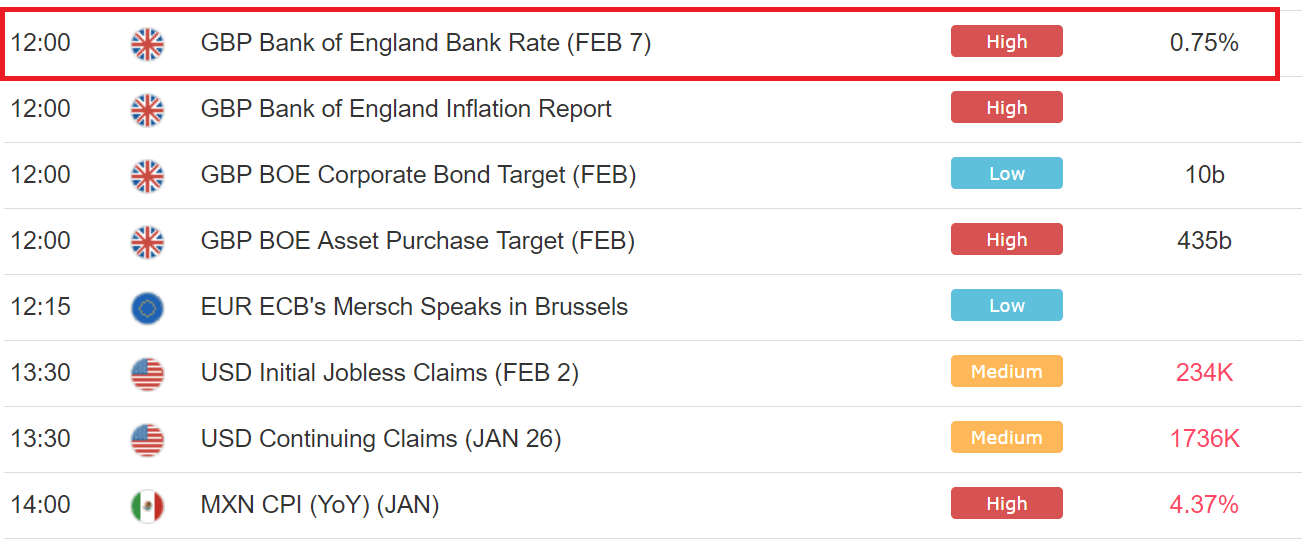
Below is an example of an economic calendar where fundamental traders will be able to keep up to date with the latest data releases. There are many data releases on any given day which is why traders should know how to filter the calendar to show relevant information only.
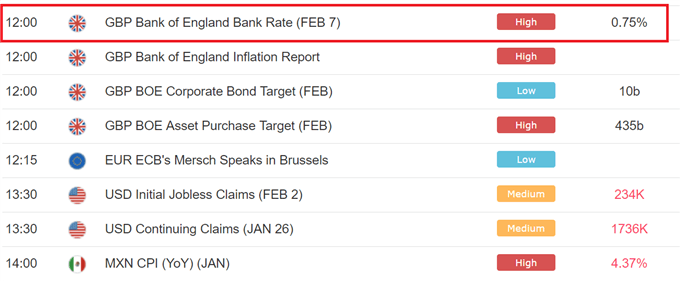
Fundamental analysis economic calendar

By assessing the relative trend of this and other data points, a trader is analyzing the relative health of the country’s economy and whether to trade the future movement of that country’s currency.

The table below summarizes the general effects that different economic data tends to have on the strength of a currency. However, this is not guaranteed as there are many factors that influence currency movements.

How economic data affects currencies

Expectations Effect on currency
Gross Domestic Product (GDP) Better than expected Positive
Consumer Price Inflation (CPI) Better than expected *Positive
Trade Balance Trade deficit (imports > exports) Negative
Central Bank benchmark rate Increase in interest rate Positive
ISM Manufacturing Index Better than expected Positive
PPI Producer Price Index Better than expected Positive

*Developed nations welcome moderate inflation as it is a sign of a growing economy. Developing nations view decreasing, or maintained, inflation as a positive statistic as this keeps price levels in check.

Technical Analysis

Technical analysis involves pattern recognition on a price chart. Technical traders look for price patterns such as triangles, flags, and double bottoms. Based on the pattern, a trader will determine the entry and exit points. Unlike fundamental traders, a technical trader is not as concerned about why something is moving because the trends and patterns on the charts are their signals.

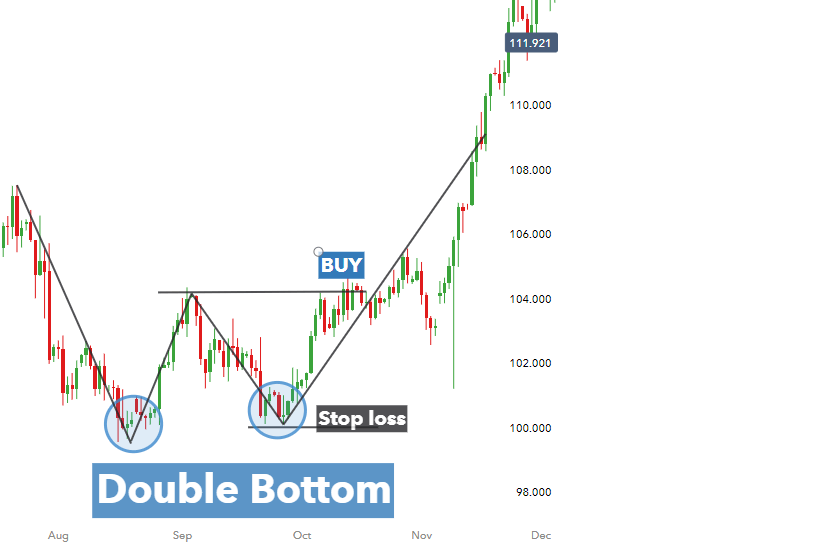
Below is an example of a chart pattern – the double bottom pattern. The market makes the first low, rebounds slightly before creating a new low and subsequently gains upward momentum as the trend reverses. Technical traders will look to set a stop loss at the recent (lowest) low and wait for the market to produce higher highs and higher lows before placing the long trade.
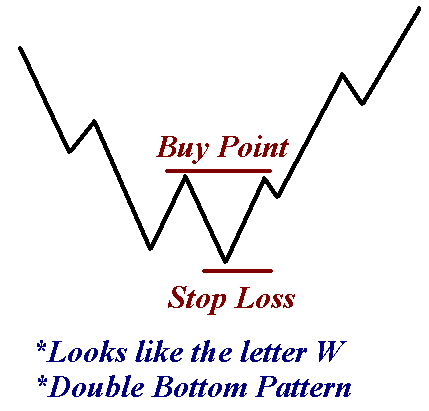
Head and shoulders pattern in technical analysis

In practice, technical traders will need to identify the pattern as shown below on the USD/JPY daily chart where the “W” shape can be seen.
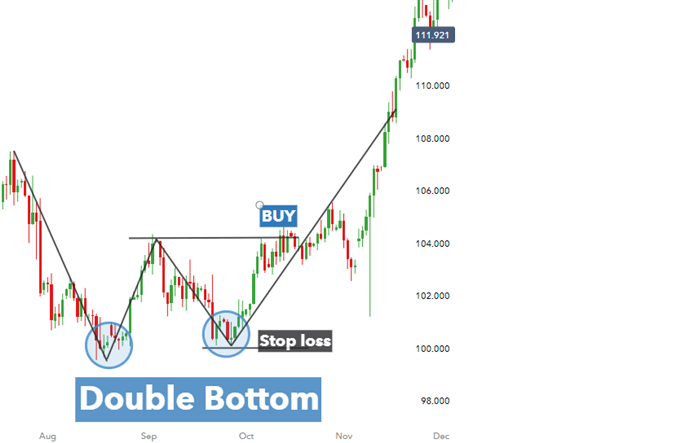
Double bottom chart pattern for USDJPY in technical analysis

A technical forex trader will assess the price action, trend, support and resistance levels observed on a chart. Many of the patterns used in technical analysis of forex markets can be applied to other markets as well.

Additionally, traders make use of indicators and oscillators which are added to a price chart when analyzing foreign exchange markets. Moving averages, Bollinger Bands, MACD, Relative Strength Index (RSI), and stochastic tend to be some of the more common tools in a technical traders tool box. Indicators are preferred by technical traders because they are easy to use and provide clear signals.

The benefits of technical analysis

Technical analysis does not include ‘black magic’ that many fundamentalists claim. Getting started in technical analysis can be done quickly by assessing the direction and strength of trends. Traders will use the trend analysis to help them determine which pair to trade and the direction to trade it.

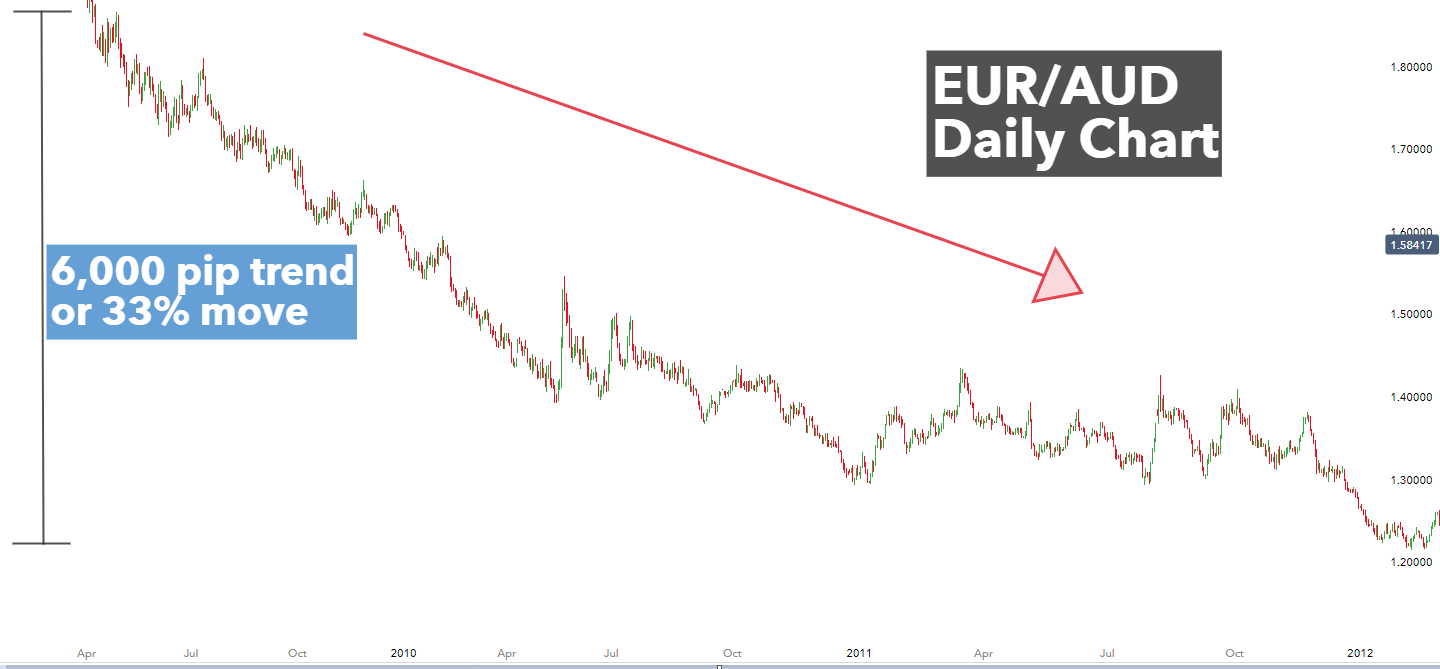
Below, is an example of how a technical trader would notice this 6,000 pip trend where the AUD is very strong relative to a very weak EUR (which is why the currency pair is moving down). Furthermore, it is clear to see that the currency pair is trading in a strong downward direction. This is referred to as a tend and traders make use of key levels, levels of support and resistance, and indicators to identify trends as soon as possible and with accuracy.
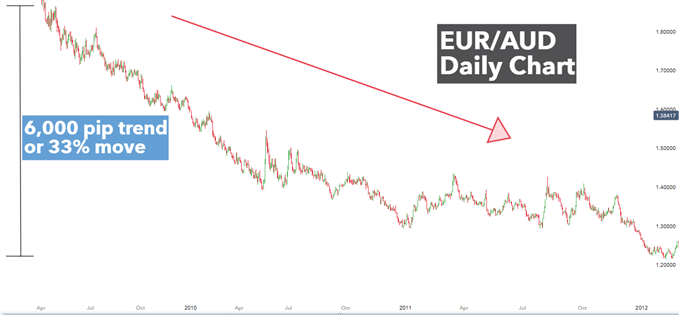
EUR/AUD daily chart showing strong downtrend

Finding out how to identify strong and weak currencies will provide traders with an indication of which currency pairs are most likely to trend and therefore lead to higher probability trades. A trader would trade in the direction of this particular trend by selling the EUR/AUD pair.

Technical vs Fundamental Analysis in Forex: Conclusion

Fundamental and technical analysis involve very different strategies and approaches to trading; offering unique value and insights to support trading decisions, and when to enter or exit a trade. While some traders prefer to use these types of analysis separately based on their preferred trading style and goals, many use a combination of the two. The benefits of combining fundamental and technical analysis are wide ranging.

Further reading to discover which type of analysis is best for you

  • Fundamental traders monitor economic data releases, and many do so with the intention of trading the news. It is essential that traders adopt sound risk management when doing so as volatility can spike immediately after important releases.
  • Technical traders have different styles and strategies. Explore these thoroughly to find out if this type of analysis suits your personality.
  • And if you are just starting out on your forex trading journey, you can learn the basics with our free New to Forex guide.

How Forex Traders Use ISM Data

How Forex Traders Use ISM Data

What is ISM?

The Institute for Supply Management (ISM) measures the economic activity from both the manufacturing side as well as the service side. Monthly ISM data releases include key information such as changes in production levels.

ISM was formed in 1915 and is the first management institute in the world with members in 300 countries. The data gleaned from its large membership of purchasing managers means ISM is a reliable guide to global economic activity, and as a result, currency prices. A country’s economy is often determined by its supply chain, as a result, the monthly ISM manufacturing and non-manufacturing PMI economic news releases are carefully watched by forex traders around the world.

ISM Surveys

ISM publishes three surveys – manufacturing, construction, and services – on the first business day of every month. The ISM Purchasing Managers Index (PMI) is compiled from surveys of 400 manufacturing purchasing managers. These purchasing managers from different sectors represent five different fields:

  1. Inventories
  2. Employment
  3. Speed of supplier deliveries
  4. Production level
  5. New orders from customers.

In addition, ISM construction PMI is released on the second business day of the month, followed by services on the third business day. Forex traders will look to these releases to determine the risks at any given time in the market.

How does ISM Impact currencies?

The Manufacturing and Non-manufacturing PMIs are big market movers. When these reports are released at 10:30am ET, currencies can become very volatile. Since these economic releases are based on the previous month’s historical data gathered directly from industry professionals, forex traders can determine if the US economy is expanding or contracting – much like non-farm payrolls (NFP) data.

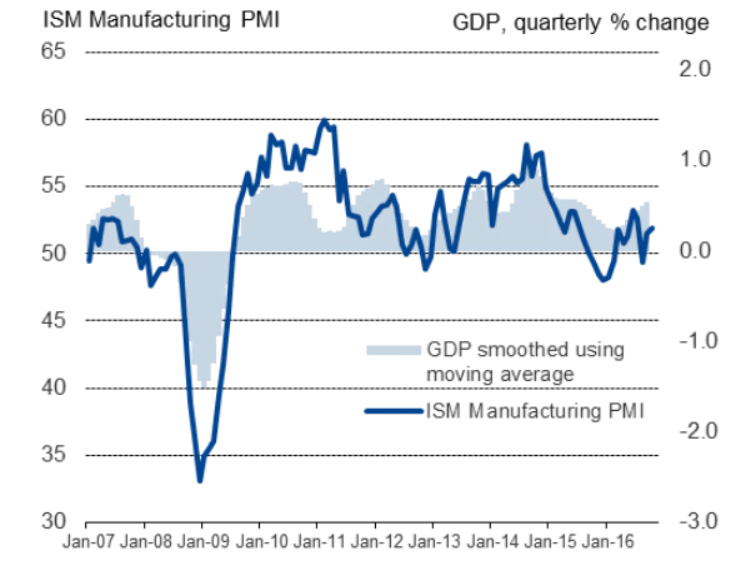
Currencies react with this information as it represents a gauge of US economic health (see image below).

ISM manufacturing PMI vs GDP

Source: Institute for Supply Management

How forex traders use ISM data

Forex traders will compare the previous month’s ISM data figure with the forecasted number that economists have published. If the released PMI number is better than the previous number and higher than the forecasted number, the US dollar tends to rally. This is where fundamental and technical analysis comes together to create a trade setup.

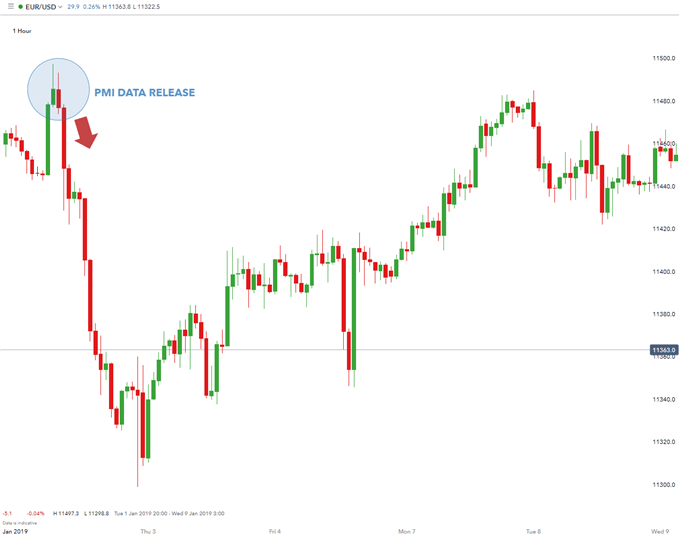
EUR/USD drops as a result of better than expected data

ism manufacturing index

In the example above, notice how the better than expected PMI number triggered a US dollar rally against the Euro. As seen in the chart (EUR/USD – one hour), the ISM Manufacturing PMI came in higher than the previous month at 54.9.

When an economic releases beats expectation, sharp fast moves can ensue. In this case, EUR/USD dropped 150 pips in a few hours. Traders often choose the Euro as the “anti-dollar” to take advantage of capital flows between two of the largest economies.

Read more on using pips in forex trading.

The Eurozone has large liquid capital markets which can absorb the huge waves of capital seeking refuge from the US. A weak US ISM Non-Manufacturing number usually leads to a dollar sell-off and a rise in the Euro. Another scenario is when the number released is in line with forecasts and/or unchanged from the previous month, then the US dollar may not react at all to the number.

Overall, an ISM PMI number above 50 indicates that the economy is expanding and is healthy. However, a number below 50 indicates that the economy is weak and contracting. This number is so important that if the PMI is below 50 for two consecutive months, an economy is considered in recession.

PMIs are also compiled for Euro zone countries by the Markit Group while US regional and national PMIs are compiled by ISM. As you can see, traders have good reason to pay special attention to the important releases from the ISM manufacturing index.

DAX Index Today: Eurozone Investor Confidence in Focus Amid ECB and Fed Chatter

DAX Index Today: Eurozone Investor Confidence in Focus Amid ECB and Fed Chatter

Overview of the DAX Performance on Monday

The DAX rose by 0.32% on Friday. Following a 0.44% gain on Thursday, the DAX ended the session at 17,735. Significantly, the DAX reached an all-time high of 17,817. On Friday, the DAX extended the winning streak to eight sessions.

Services PMIs, Eurozone Inflation, and Earnings Influenced

On Friday, private sector PMIs from China set the tone for the session. The Caixin Manufacturing PMI contributed to a positive Asian market session, rising from 50.8 to 50.9 in February.

However, upward revisions to preliminary euro area Manufacturing PMIs had a limited impact, with Eurozone inflation in the spotlight.

The German Manufacturing PMI declined from 45.5 to 42.5 in February, up from a preliminary 42.3. The Eurozone Manufacturing PMI slipped from 46.6 to 46.5, up from a preliminary 46.1.

More significantly, the core inflation rate for the Eurozone eased from 3.3% to 3.1% in February. The annual rate fell from 2.8% to 2.6%. Economists forecast core inflation and inflation rates of 2.9% and 2.5%, respectively.

The hotter-than-expected inflation figures eased bets on an April ECB rate hike, pressuring the DAX.

However, corporate earnings and rising bets on an H1 2024 Fed rate cut supported a positive end to the session.

US Economic Calendar Supported Bets on a June Fed Rate Cut

On Friday, ISM Manufacturing PMI and Michigan Consumer Sentiment Reports supported investor bets on a June Fed rate cut.

The ISM Manufacturing PMI declined from 49.1 to 47.8 in February. Significantly, the ISM Manufacturing Prices Index fell from 52.9 to 52.5.

In February, the Michigan Consumer Sentiment Index fell from 79.0 to 76.9, down from a preliminary 79.6. The Michigan Consumer Expectations Index declined from 77.1 to 75.2, down from a preliminary 78.4.

10-year US Treasury yields reacted to the reports, ending the session down 1.60% to 4.184%. The pullback in yields drove demand for riskier assets.

On Friday, the Dow ended the day up 0.23%. The Nasdaq Composite Index and the S&P 500 saw gains of 1.14% and 0.80%, respectively.

The Friday Market Movers

Daimler Truck Holding surged 18% on better-than-expected earnings, a dividend hike, and a positive outlook for 2024.

Tech stocks benefited from sentiment toward a June Fed rate cut. Infineon Technologies gained 2.69%, with SAP ending the session up 0.27%.

Shifting sentiment toward the timeline for an ECB rate cut supported bank stocks. Commerzbank and Deutsche Bank saw gains of 1.54% and 1.65%, respectively.

However, Volkswagen slid by 4.93%. Investors reacted to a weaker sales outlook for 2024. Porsche also ended the session in negative territory, falling 0.59%. However, Mercedes-Benz Group and BMW rose by 0.53% and 0.61%, respectively.

Eurozone Investor Confidence in Focus

On Monday, the Eurozone Sentix Investor Confidence Index will draw investor interest. Economists forecast the Index to increase from -12.9 to -10.8 in March. A less pessimistic outlook toward the Eurozone economy would support the appetite for DAX-listed stocks. However, the numbers are unlikely to influence the ECB interest rate trajectory.

Investors must track ECB chatter throughout the session, with the ECB’s interest rate decision looming. Inflation figures from Friday shifted the timeline for an ECB rate cut to June. Views on inflation, the economy, and interest rates would move the dial.

US Economic Calendar: Fed Speakers in the Spotlight

On Monday, investors must consider Fed speeches. Calls for patience vis-à-vis cutting interest rates could test bets on a June Fed rate cut.

According to the CME FedWatch Tool, the probability of a 25-basis point June rate cut rose from 52.3 to 52.8 in the week ending March 1.

There are no economic stats for investors to consider on Monday.

Short-term Forecast

Near-term trends for the DAX will hinge on services PMIs, the ECB monetary policy decision, and Fed Chair Powell. More hawkish-than-expected ECB and Fed guidance could test bets on H1 2024 rate cuts. However, US labor market data could also influence.

On Monday, the DAX futures and the Nasdaq mini were up 19 and 14 points, respectively.

DAX Technical Indicators

Daily Chart

The DAX hovered well above the 50-day and 200-day EMAs, affirming bullish price signals.

A DAX breakout from the Friday all-time high of 17,817 would give the bulls a run at the 18,000 handle.

Eurozone economic data, the ECB, and the Fed need consideration.

A break below the 17,700 handle would support a fall toward the 17,500 handle.

The 14-day RSI at 78.79 shows the DAX in overbought territory. Selling pressure could intensify at the ATH of 17,817.

DAX Daily Chart sends bullish price signals.
DAX 040324 Daily Chart

4-Hourly Chart

The DAX sat well above the 50-day and 200-day EMAs, affirming the bullish price signals.

A DAX break above the 17,817 all-time high would support a move toward the 18,000 handle.

However, a DAX drop below the 17,700 handle would give the bears a run at the 17,500 handle.

The 14-period 4-hour RSI at 76.96 shows the DAX sitting in overbought territory. Selling pressure could intensify at the all-time high of 17,817.

4-Hourly Chart affirms bullish price signals.
DAX 040324 4-Hourly Chart
EUR/USD, GBP/USD, DXY Price Forecast: DXY Bullish Above $103.80 Amid Key US/EU Data

EUR/USD, GBP/USD, DXY Price Forecast: DXY Bullish Above $103.80 Amid Key US/EU Data

EUR/USD and GBP/USD Price Forecast: Analysis and Events Ahead

The US Dollar’s trajectory has been shaped by a mix of economic indicators: the ISM Manufacturing PMI reported a contraction with a figure of 47.8, against expectations set at 49.5. This was complemented by the Revised UoM Consumer Sentiment Index, which slightly improved to 76.9, marginally above forecasts.

Similarly, the Manufacturing Prices and Construction Spending presented a nuanced picture of the US economy, with spending dipping by -0.2% against a forecasted growth of 0.2%.

In Europe, Manufacturing PMI figures have shown a consistent theme of contraction across key economies—Spain’s PMI at 51.5, Italy at 48.7, France at 47.1, and Germany at a particularly low 42.5, all indicating the manufacturing sector’s struggles.

Notably, the Eurozone’s Core CPI Flash Estimate year-over-year rose to 3.1%, exceeding the anticipated 2.9%, hinting at inflationary pressures that might influence ECB’s future policy moves.

For the GBP, recent data highlighted economic challenges, with the Nationwide HPI month-over-month at 0.7%, and the Final Manufacturing PMI at 47.5, both reflecting underlying economic pressures.

Events Ahead:

Looking ahead, there are no immediate US data releases, but the market is bracing for significant reports on Friday, including the Non-Farm Employment Change expected at 190K and the Unemployment Rate projected to remain steady at 3.7%.

In Europe, upcoming data like the French Government Budget Balance and the Spanish Unemployment Change, alongside the Sentix Investor Confidence, are anticipated to further guide the EUR/USD and GBP/USD pairs.

US Dollar Index (DXY)

Dollar Index
Dollar IndexThe Dollar Index slightly declined by 0.03%, settling at 103.881. This minor drop places the index just above a pivotal level, marked by the pivot point at $103.82. Looking ahead, immediate resistance is identified at $104.24, with subsequent levels at $104.44 and $104.69 posing potential challenges for upward movement.

Conversely, support is found at $103.60, followed by $103.43 and $103.16, offering cushioning against further drops. The 50 EMA stands at $103.97, slightly above the current price, while the 200 EMA matches the pivot, at $103.82, suggesting a balanced view between short-term and long-term trends.

The Dollar Index displays a bullish inclination above the $103.82 mark, indicating potential for growth if it sustains above this crucial threshold.

EUR/USD Technical Forecast

EUR/USD Price Chart - Source: Tradingview
EUR/USD Price Chart – Source: Tradingview

GBP/USD Price Chart - Source: Tradingview
GBP/USD Price Chart – Source: TradingviewThe GBP/USD pair modestly climbed by 0.07%, marking the price at 1.26618. This slight uptick indicates a cautious optimism among traders. Key price levels to watch include a pivot point at $1.2646, suggesting potential shifts in market direction.

Immediate resistance is found at $1.2682, with further barriers at $1.2700 and $1.2728 that could limit upward movement. Conversely, support lies at $1.2618, followed by $1.2582 and $1.2549, which may halt declines. The 50 EMA at $1.2649 closely aligns with the current pivot, reinforcing its significance.

The GBP/USD exhibits a bullish stance above $1.2646, hinting at further potential gains if it maintains above this threshold.

Bitcoin (BTC) News Today: GBTC Outflow Downtrend Expected

Bitcoin (BTC) News Today: GBTC Outflow Downtrend Expected

The Sunday Overview

On Sunday, BTC gained 1.80%. Reversing a 0.61% loss from Saturday, BTC ended the session at $63,139.

Investors Discount the Genesis-Linked GBTC Net Outflows

In the week ending March 1, 2023, the BTC-spot ETF market saw total net inflows of $1,722.5 million. The BTC-spot ETF market recorded the second-highest weekly net inflows since January 11 and the launch of the Nine.

iShares Bitcoin Trust (IBIT) contributed $2,050.5 million in net inflows, while Grayscale Bitcoin Fund (GBTC) saw net outflows surge to $1,455.7 million in the week ending March 1, 2023.

However, the Bitcoin-Spot ETF market saw net outflows of $140.0 million on Friday, March 1, leaving BTC in negative territory on Saturday, March 2. Investors attributed the net outflows to the February approval for Genesis Global Holdco LLC to liquidate GBTC shares worth approximately $1.3 billion. GBTC net outflow numbers from the week suggest a downward trend in GBTC net outflows and a return to net inflows for the BTC-spot ETF market.

GBTC Net Outlows Impact BTC-Spot ETF market trends.
BTC-spot ETF Market Flow Data – 01/03/24

Bitcoin and the US Federal Reserve: Fed Rate Cuts to Drive Buyer Demand

US economic indicators from Friday supported bets on a June Fed interest rate cut. Lower borrowing costs could drive demand for riskier assets.

According to the CME FedWatch Tool, the probability of a 25-basis point June Fed rate cut increased from 52.3% to 56.8% in the week ending March 1. This week, investors must consider Fed Chair Powell testimony on Wednesday and Thursday. The US Jobs Report (Fri) may also influence bets on a June Fed rate cut.

Nonetheless, BTC-spot ETF market flows will likely remain the main driver in the near term. On Monday, March 4, BTC struck a new 2024 high of $64,202 before easing back, highlighting the influence of the BTC-spot ETF market on buyer appetite.

Technical Analysis

Bitcoin Analysis

BTC hovered well above the 50-day and 200-day EMAs, sending bullish price signals.

A BTC break above the Monday high of $64,202 would support a move to the all-time high of $69,276.

BTC-spot ETF market flows need consideration.

However, a break below the $62,000 handle would give the bears a run at the $59,176 support level.

The 14-Daily RSI reading, 81.16, shows BTC in overbought territory. Selling pressure could intensify at the Monday high of $64,202.

BTC Daily Chart sends bullish price signalsl.
BTCUSD Daily Chart 040324

Ethereum Analysis

ETH remained well above the 50-day and 200-day EMAs, affirming bullish price signals.

An ETH move to the Monday high of $3,532 would support a run  at the $3,683 resistance level.

ETH-spot ETF-related updates also need consideration.

However, an ETH break below the $3,412 support level would bring the $3,200 support level into play.

The 14-period Daily RSI, at 81.58, shows ETH in overbought territory. Selling pressure could intensify at the Monday high of $3,532.

ETH Daily Chart sends bullish price signals.
ETHUSD Daily Chart 040324