Gold, Silver, Copper Daily Forecast: Powell’s Rate Hints Push Metal Up; Buy Now?

Gold, Silver, Copper Daily Forecast: Powell’s Rate Hints Push Metal Up; Buy Now?

Precious Metals Rally on Rate Cut Speculation

Gold is on the brink of its largest weekly gain in five months, closely approaching record highs, buoyed by Federal Reserve Chair Jerome Powell’s hints at potential mid-year rate reductions.

This week alone, gold’s spot prices soared by over 3.5%, marking the most significant weekly uptick since the escalation of the Israel-Hamas conflict in mid-October, poised for a third consecutive weekly rise.

Speculative trading has fueled this surge, but the underlying driver remains the anticipation of forthcoming rate cuts, reinforcing gold’s allure. Meanwhile, the dollar is set for its most considerable weekly decline this year, further enhancing gold’s attractiveness to investors holding other currencies.

Gold Prices Forecast

Gold - Chart
Gold – ChartOn March 8, Gold experienced a slight decrease of 0.11%, trading at $2157.040. Despite this dip, the technical framework suggests a bullish outlook. The day’s pivot point at $2146.02 acts as a foundation for future movements.

Resistance is anticipated at $2168.25, escalating to $2182.32 and $2196.38, indicating potential hurdles for upward momentum. Conversely, support levels are identified at $2127.87, descending to $2114.71 and further to $2098.83, providing a cushion against downward trends.

The 50-Day and 200-Day Exponential Moving Averages, at $2046.87 and $1984.01 respectively, reinforce a bullish sentiment, contingent on maintaining above the pivot.

Silver Prices Forecast

Silver - Chart
Silver – Chart

Silver edged higher by 0.06%, trading at $24.30. The metal’s trading pattern reveals a subtle uptick, anchored by a pivot point at $24.24. This pivot delineates the immediate battleground for bulls and bears. Resistance levels are staged at $24.53, $24.82, and $25.09, each marking a potential ceiling for price ascents.

Conversely, supports are established at $24.01, $23.69, and $23.33, providing floors that could stem any declines. With the 50-Day and 200-Day Exponential Moving Averages at $23.54 and $23.07 respectively, an upward channel is in play.

This technical stance suggests silver remains in a bullish domain above the $24.24 threshold, with a dip below potentially signaling a shift towards a selling trend.

Copper Prices Forecast

Copper - Chart
Copper – ChartCopper price dipped slightly by 0.09%, trading at $3.92139. This minor setback places it just below the day’s pivot point at $3.93, a critical juncture that delineates potential future movements. Resistance levels are set at $3.96, $3.98, and $4.01, challenging the metal’s upward momentum.

On the downside, support levels at $3.90, $3.87, and $3.83 offer a buffer against further declines. The 50-Day and 200-Day Exponential Moving Averages, at $3.87 and $3.84 respectively, suggest a narrow bullish window.

However, the current position below the pivot hints at a bearish trend, with a break above $3.93 required to reverse this bias.

German Industrial Production and Producer Prices Support ECB Rate Cut Bets

German Industrial Production and Producer Prices Support ECB Rate Cut Bets

German Industrial Production

Industrial production increased by 1.0% in January after sliding by 2.0% in December. Economists forecast industrial production to increase by 0.6%.

According to Destatis,

  • Production in construction jumped 2.7% month-on-month after sliding by 3.1% in December.
  • The chemical industry (+4.7%), food industry (+5.9%), and machinery maintenance and assembly (+11.1%) contributed to the increase in headline production.
  • However, the auto sector saw production tumble by 7.6% month-on-month.
  • Production in industry, excluding energy and construction, increased by 1.1%.
  • There were also increases in the production of consumer goods (+4.0%) and intermediate goods (+4.4%).
  • However, production of capital goods declined by 2.1%, with energy production down 3.7%.
  • Industrial production declined by 1.5% from November 2023 to January 2024.
  • Year-on-year, industrial production fell by 5.5%.

German Producer Prices

German producer prices increase by 0.2% month-on-month in January after declining by 1.2% in December. Economists forecast producer prices to increase by 0.2%. Notably, producer prices increased for the first time in five months.

Producer prices were down 4.4% year-on-year in January after declining by 5.1% in December. Economists forecast producer prices to fall by 6.6% year-on-year in January.

According to Destatis,

  • Energy prices slid by 11.7% year-on-year in January, contributing to the less marked decline in producer prices.
  • Prices for non-durable consumer goods increased by 1.1% year-on-year, with durable consumer goods prices up 1.6%.
  • Capital goods prices increased by 3.0%, with prices of motor vehicles, trailers, and semi-trailers (+2.4%) contributing to higher prices for capital goods.

German Economy and the ECB

Economic indicators from Germany continued to signal a Q1 2024 economic recession. The month-on-month numbers aligned with recent trade data from Germany. German trade data signaled a marked improvement in the demand environment, contrasting with factory orders.

Nonetheless, the latest data supported the ECB Staff revisions to inflation and growth forecasts and a June ECB rate cut.

EUR/USD Reaction to German Economic Indicators

Before the data from Germany, the EUR/USD fell to a low of $1.09422 before rising to a high of $1.09557.

However, in response to the numbers, the EUR/USD rose to a high of $1.09510 before falling to a low of $1.09435.

On Friday, the EUR/USD was down 0.04% to $1.09438.

EUR/USD reacts to German industrial production and producer prices.
080324 EURUSD 3 Minute Chart

Next Up

On Friday, Eurozone GDP and employment figures for Q4 will need consideration. According to 2d estimates, the Eurozone economy stalled in Q4 after contracting by 0.1% in Q3. Based on preliminary numbers, Eurozone employment increased by 0.3% quarter-on-quarter in Q4. In Q3, employment increased by 0.2% quarter-on-quarter.

However, the US Jobs Report will draw more interest. Softer labor market conditions would support bets on an H1 2024 Fed rate cut.

Economists expect nonfarm payrolls to increase by 200k and an unemployment rate of 3.7%. Significantly, economists predict average hourly earnings to ease from 4.5% to 4.4% year-on-year in February.

Beyond the numbers, investors must consider central bank commentary.

Japanese Yen Surges Against USD As Markets Again Mull BoJ Policy Exit

Japanese Yen Surges Against USD As Markets Again Mull BoJ Policy Exit

The Japanese Yen could be set for its biggest day of gains against the United States Dollar this year as investors seem increasingly to believe that the Bank of Japan will soon start to retreat from its venerable, ultra-loose monetary policy.

BoJ board member Junko Nakagawa said on Thursday that Japan’s economy was moving toward sustainably achieving a 2% inflation target, while a local news agency reportedly said that at least one board member is likely to favor the removal of negative interest rates at the March policy meeting which will release its decision on the 19th. If this sort of commentary stream keeps up, that looks like a serious date for the foreign exchange community’s diaries. The Japanese central bank has long been an outlier among developed-market authorities in actively attempting to generate some inflation while others have been forced to fight it. The prospect of a BoJ more in line with those others has understandably seen the Yen gain.

It’s worth noting, however, that markets have looked for change from the BoJ before, only to see those expectations shattered by a central bank for whom the time was never quite ripe. Given rising prices and wage pressures there would seem to be more to the story this time around, however, and the March BoJ meeting will be fascinating.

USD/JPY dropped by more than 1.5 Yen Thursday, appearing to stabilize in the European morning session. While the BoJ has been on investors’ minds, some broad Dollar weakness in the wake of Federal Reserve Chair Jerome Powell’s Congressional testimony in the previous session is also playing its part. He didn’t add much to what the markets already knew, however, reiterating that interest-rate cuts will likely be appropriate this year assuming data permit, but hearing this again was enough to send the Dollar lower.

USD/JPY Technical Analysis

USD/JPY Daily Chart Compiled Using TradingView

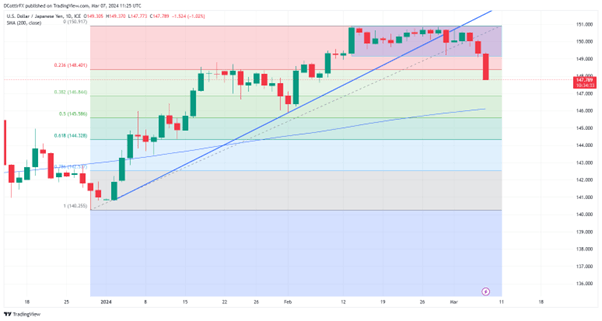
USD has retreated back to levels not seen since early February, although it’s notable that the previously dominant uptrend from the lows of January had already been broken in the course of the range-trade seen between February 13 and 29.

USD/JPY has fallen below the first Fibonacci retracement of its climb from those January lows to February 13’s significant four-month peak. That retracement comes in at 148.401 and it could be instructive to see whether the pair ends this week below that level. Should it do so there’s likely support in the 147.78 region ahead of the second retracement point at 146.84.

Despite three sessions of falls USD/JPY remains significantly above its 200-day moving average. That now offers support at 146.095 and might be a tempting target for Dollar bears.

Technical vs Fundamental Analysis in Forex

Technical vs Fundamental Analysis in Forex

Understanding the differences between fundamental and technical analysis in forex trading

There is a great debate about which type of analysis is better for a trader. Is it better to be a fundamental trader or a technical trader? In this article we will explore what the difference is between these two types of traders and which pieces of information forex traders in particular tend to look at.

Technical vs fundamental analysis comparison

Technical Analysis Fundamental Analysis
Definition Forecast price movements using chart patterns Various economic data used to establish value/ target price
Data considered Price action (charts) Inflation, GDP, interest rates etc
Time horizon Short, medium and long term Medium and long term
Skillset required Chart analysis Economics & statistical analysis

Fundamental Analysis

Fundamental analysis involves assessing the economic well-being of a country, and by extension, the currency. It does not take into account currency price movements. Rather, fundamental forex traders will use data points to determine the strength of a particular currency.

A fundamental forex trader will analyze the country’s inflation, trade balance, gross domestic product, growth in jobs and even their central bank’s benchmark interest rate.

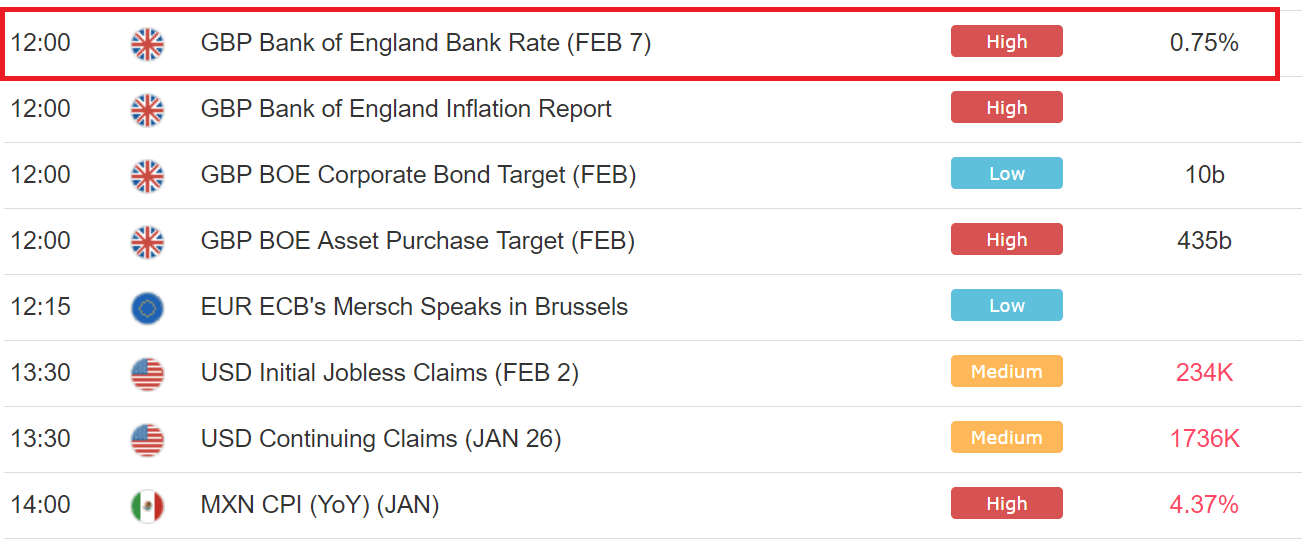
Below is an example of an economic calendar where fundamental traders will be able to keep up to date with the latest data releases. There are many data releases on any given day which is why traders should know how to filter the calendar to show relevant information only.
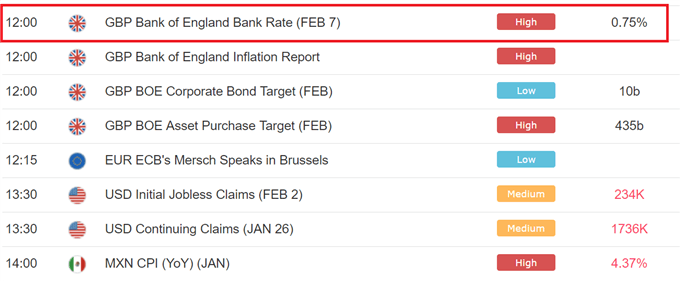
Fundamental analysis economic calendar

By assessing the relative trend of this and other data points, a trader is analyzing the relative health of the country’s economy and whether to trade the future movement of that country’s currency.

The table below summarizes the general effects that different economic data tends to have on the strength of a currency. However, this is not guaranteed as there are many factors that influence currency movements.

How economic data affects currencies

Expectations Effect on currency
Gross Domestic Product (GDP) Better than expected Positive
Consumer Price Inflation (CPI) Better than expected *Positive
Trade Balance Trade deficit (imports > exports) Negative
Central Bank benchmark rate Increase in interest rate Positive
ISM Manufacturing Index Better than expected Positive
PPI Producer Price Index Better than expected Positive

*Developed nations welcome moderate inflation as it is a sign of a growing economy. Developing nations view decreasing, or maintained, inflation as a positive statistic as this keeps price levels in check.

Technical Analysis

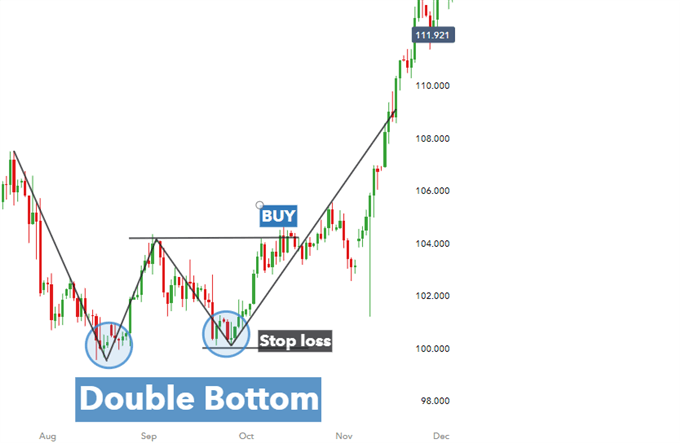
Technical analysis involves pattern recognition on a price chart. Technical traders look for price patterns such as triangles, flags, and double bottoms. Based on the pattern, a trader will determine the entry and exit points. Unlike fundamental traders, a technical trader is not as concerned about why something is moving because the trends and patterns on the charts are their signals.

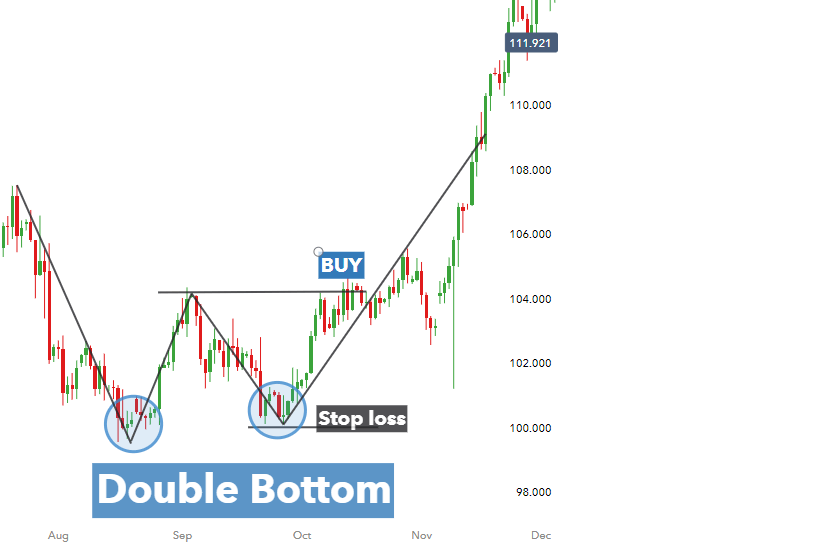
Below is an example of a chart pattern – the double bottom pattern. The market makes the first low, rebounds slightly before creating a new low and subsequently gains upward momentum as the trend reverses. Technical traders will look to set a stop loss at the recent (lowest) low and wait for the market to produce higher highs and higher lows before placing the long trade.
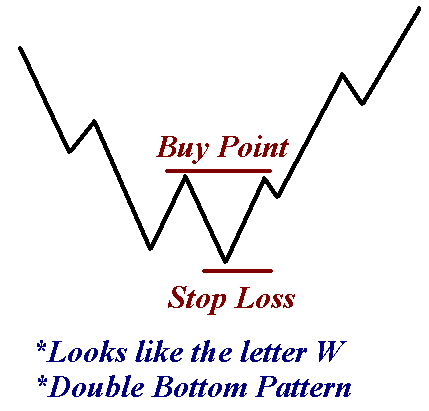
Head and shoulders pattern in technical analysis

In practice, technical traders will need to identify the pattern as shown below on the USD/JPY daily chart where the “W” shape can be seen.
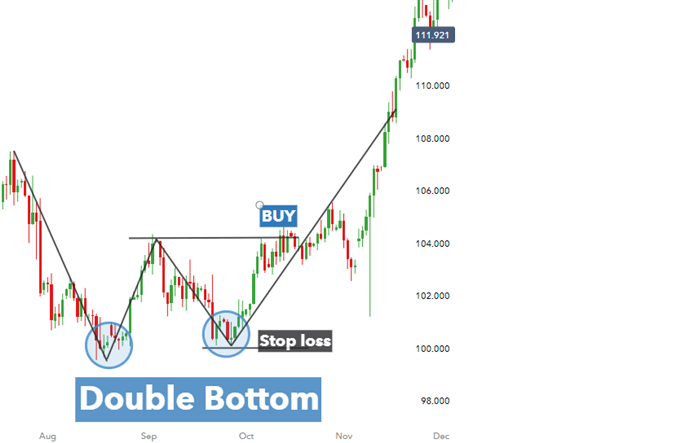
Double bottom chart pattern for USDJPY in technical analysis

A technical forex trader will assess the price action, trend, support and resistance levels observed on a chart. Many of the patterns used in technical analysis of forex markets can be applied to other markets as well.

Additionally, traders make use of indicators and oscillators which are added to a price chart when analyzing foreign exchange markets. Moving averages, Bollinger Bands, MACD, Relative Strength Index (RSI), and stochastic tend to be some of the more common tools in a technical traders tool box. Indicators are preferred by technical traders because they are easy to use and provide clear signals.

The benefits of technical analysis

Technical analysis does not include ‘black magic’ that many fundamentalists claim. Getting started in technical analysis can be done quickly by assessing the direction and strength of trends. Traders will use the trend analysis to help them determine which pair to trade and the direction to trade it.

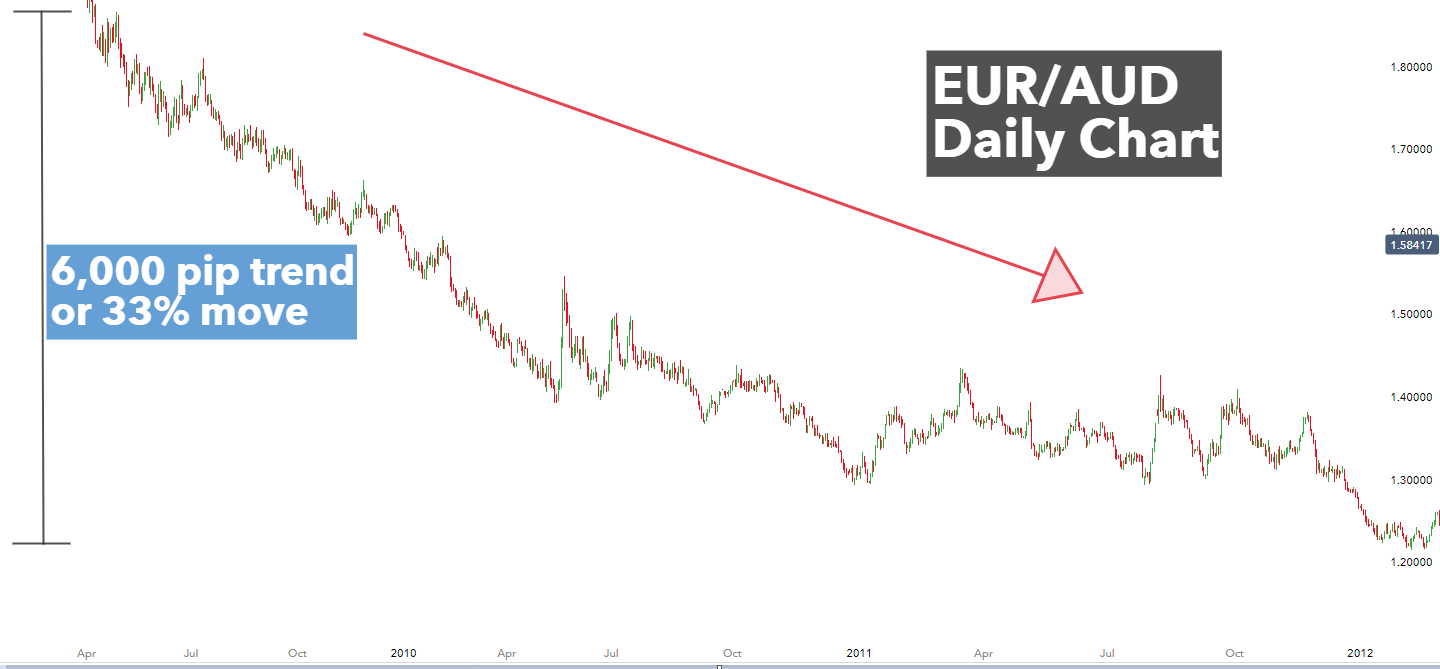
Below, is an example of how a technical trader would notice this 6,000 pip trend where the AUD is very strong relative to a very weak EUR (which is why the currency pair is moving down). Furthermore, it is clear to see that the currency pair is trading in a strong downward direction. This is referred to as a tend and traders make use of key levels, levels of support and resistance, and indicators to identify trends as soon as possible and with accuracy.
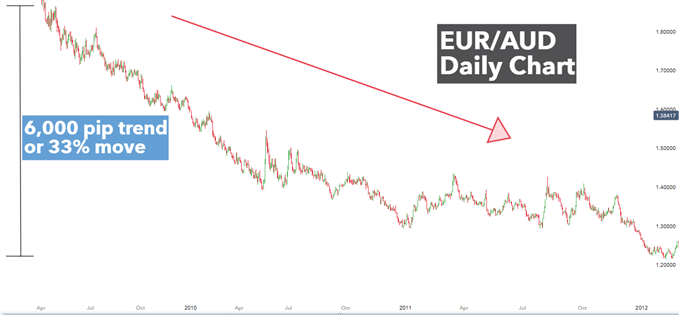
EUR/AUD daily chart showing strong downtrend

Finding out how to identify strong and weak currencies will provide traders with an indication of which currency pairs are most likely to trend and therefore lead to higher probability trades. A trader would trade in the direction of this particular trend by selling the EUR/AUD pair.

Technical vs Fundamental Analysis in Forex: Conclusion

Fundamental and technical analysis involve very different strategies and approaches to trading; offering unique value and insights to support trading decisions, and when to enter or exit a trade. While some traders prefer to use these types of analysis separately based on their preferred trading style and goals, many use a combination of the two. The benefits of combining fundamental and technical analysis are wide ranging.

Further reading to discover which type of analysis is best for you

  • Fundamental traders monitor economic data releases, and many do so with the intention of trading the news. It is essential that traders adopt sound risk management when doing so as volatility can spike immediately after important releases.
  • Technical traders have different styles and strategies. Explore these thoroughly to find out if this type of analysis suits your personality.
  • And if you are just starting out on your forex trading journey, you can learn the basics with our free New to Forex guide.

Improve Your Trading Bias

Improve Your Trading Bias

What is bias in trading?

Trading bias is a predisposition or perspective of the financial markets whereby traders believe there is a higher probability of a certain outcome as opposed to any other alternate possibilities.

These trading biases are determined by technical and/or fundamental factors that support a specific outlook that explains market behaviour. This often relates to market trends being either bullish/bearish which signals appropriate trading strategy and style.

Why do Traders Need Bias?

Traders need bias in order to form trade decisions that align with their specific trading strategy. The end goal is to make good decisions with real money on the line. There are so many decisions to be made on each trade that it can be overwhelming and can often lead to errors.

For example, a trader needs to determine what market to trade, when to get in, how long to hold the trade, when to get out, and what trade size. There are many other decisions that enter in as well such as, do I move my stop loss, do I take partial profits and scale out (there are many more choices to be made, but you get the point).

In the trading world, a newer trader often gets hung between the potential for profit and the possibility of loss. They don’t have enough experience to produce and overwhelming emotion about the trade set up. They in essence, lack the confidence and ability to ‘control’ a positive outcome and wind up freezing with indecisiveness. As a result, they let other things improperly anchor that emotion for them like their recent demo results.

Newer traders tend to rely solely on outcomes to develop their perceptions. The problem with the outcomes is that even though some of those trades may have been profitable, they are likely riskier over the long run.

The below are the main components a trader needs to determine a trading bias:

  • What market to trade?
  • What direction do I trade?
  • When to get in?
  • When to get out?
  • Trade size?
 What market to trade

The market to trade is often a confusing place to begin for novice traders. Traders often gravitate toward popular markets that do not provide the relevant trade opportunities. At DailyFX, the sentiment tool can help traders select the appropriate market by producing long/short retail percentages.

This is not the only method by which traders can select a market to trade. Many traders use their specific trading strategy (e.g. trend trading) to identify appropriate markets. Other traders prefer using fundamental analysis; exploring such as political news or macroeconomic events as a foundation as to which markets to trade.

What direction do I trade

Trade direction is usually linked to the market trend which again ties into the trading strategy. This could be short- or long-term trend indications depending on the trader’s preference for trading time horizon.

When to get in and out

Trading the markets encompass technical and fundamental analysis. These can be traded in isolation or a combination to determine buy and sell points. These entry and exits are generally determined by technical tools such as indicators (moving averages) or by trading breakouts using price action.

Trade size

Trade size is essential to any trading plan. Novice traders often overlook this aspect and trade irrationally. Trade size needs to be taken into consideration according to account size/balance. At DailyFX, we suggest using a trade size so that you are not risking more than 5% on all open positions.

How to Develop Trading Bias using Technical Indicators

Supporting information provided by technical indicators – such as the moving average – can assist traders in acquiring a trading bias.

Moving Average:

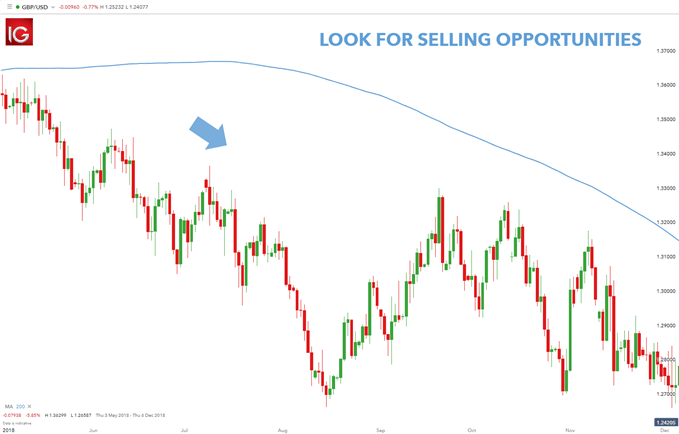
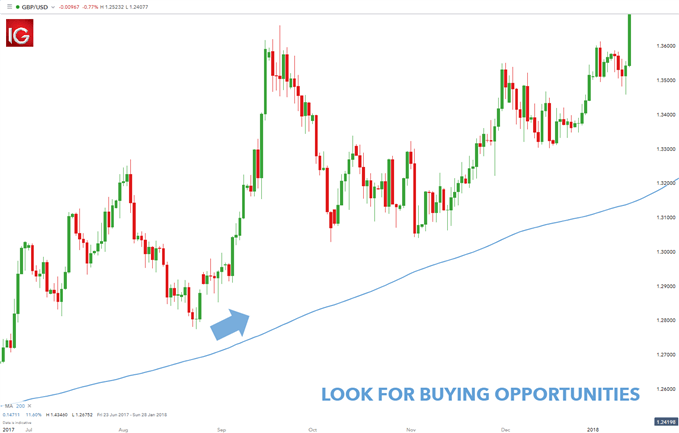
Moving averages are another tool traders can use to determine a trading bias. Typically, traders use a 200-period simple moving average (MA). Traders can apply this indicator to any graph and see if price is either above or below the moving average. If price is above the average, traders can take a bias that the trend is up and look for opportunities to buy. Conversely if price is below the average, traders can say that the trend is down while having a trading bias to sell.

The charts below show trading bias using moving averages on GBP/USD. The 200 period MA has been added, and price is trading well below the indicator. Knowing this, short term day traders can take this information and form a bias to look for sell positions. This bias could be held until prices start to move back up towards a higher high and penetrate the moving average line. The opposite is true for prices trading above the MA as seen in the second chart.

Bearish trading bias:

GBP/USD bearish tradig bias

Bullish trading bias:

GBP/USD bullish trading bias

Price Action:

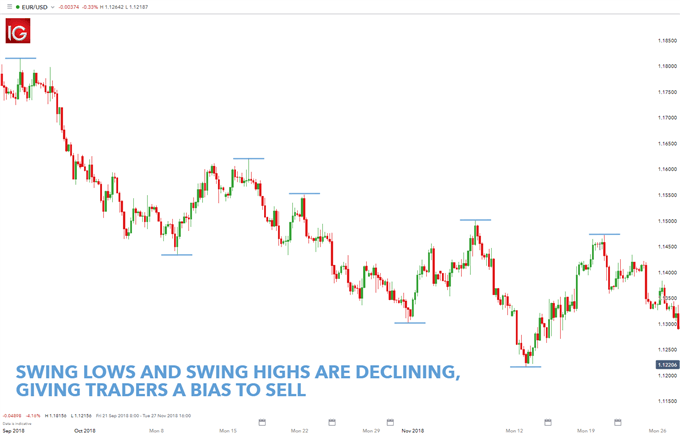
The first way to identify a trading bias is through price action. Traders can view a chart and see if prices are generally rising or falling through the identification of a swing high or low. If prices are getting higher, and the lows are advancing as well, traders should form a bias to buy. If prices are declining (lower lows and lower highs), traders should have a specific bias to sell. By reviewing 200-300 periods on the chart, this technique can be used with virtually any trading strategy.

EUR/USD price action trading bias:

EUR/USD price action trading bias

The chart above depicts a EUR/USD four-hour chart. Traders will begin their analysis by looking back on nearly two months’ worth of data. This will show traders approximately 300, four-hour candles. Notice how prices are slowly moving down to new lows for the period selected. This shows that the market is in a downtrend, which can allow traders to form a bias to sell.

NFP and Forex: What is NFP and How to Trade It?

NFP and Forex: What is NFP and How to Trade It?

What is the NFP?

The non-farm payroll (NFP) figure is a key economic indicator for the United States economy. It represents the number of jobs added, excluding farm employees, government employees, private household employees and employees of nonprofit organizations.

US Non Farm Payroll historical results

NFP releases generally cause large movements in the forex market. The NFP data is normally released on the first Friday of every month at 8:30 AM ET. This article will explain the role NFPs play in economics and how to apply NFP release data to a forex trading strategy.

How does the NFP affect forex?

NFP data is important because it is released monthly, making it a very good indicator of the current state of the economy. The data is released by the Bureau of Labor Statistics and the next release can be found on an economic calendar.

Employment is a very important indicator to the Federal Reserve Bank. When unemployment is high, policy makers tend to have an expansionary monetary policy (stimulatory, with low interest rates). The goal of an expansionary monetary policy is to increase economic output and increase employment.

So, if the unemployment rate is higher than usual, the economy is thought to be running below its potential and policy makers will try to stimulate it. A stimulatory monetary policy entails lower interest rates and reduces demand for the Dollar (money flows out of a low yielding currency). To learn exactly how this works, see our article on how interest rates effect forex.

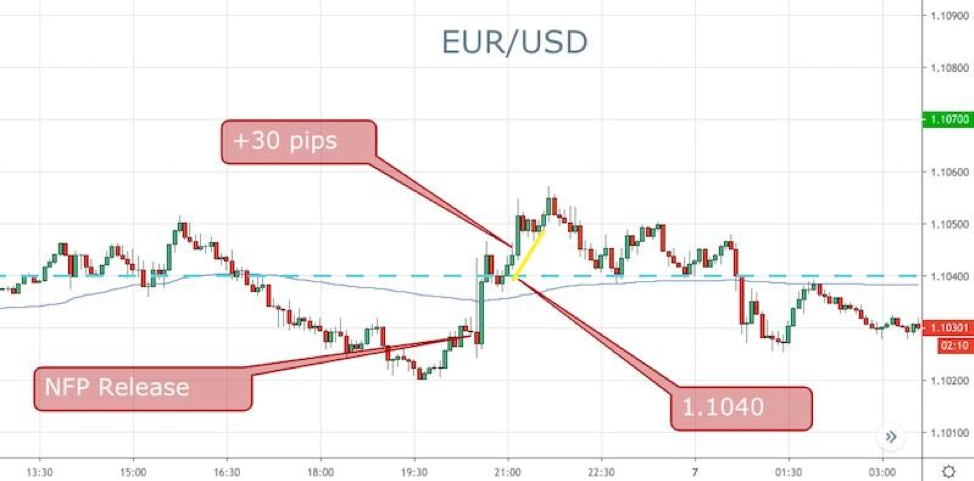
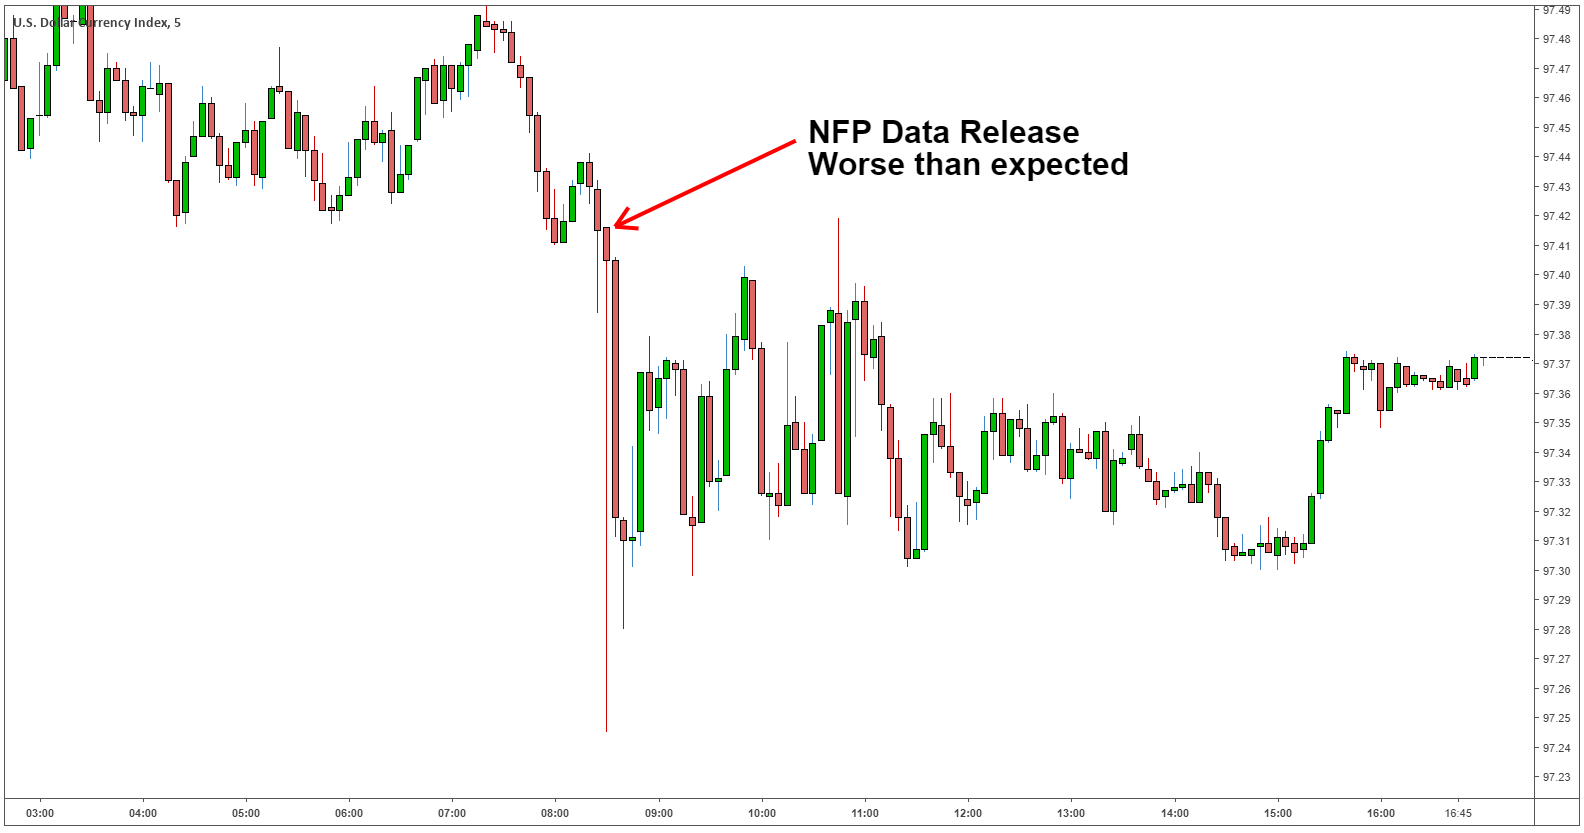
The chart below shows how volatile forex can be after an NFP release. The expected NFP results for March 8, 2019 were 180k (job additions), the actual result disappointed with only 20k jobs being added. As a result, the Dollar Index (DXY) depreciated in value and volatility increased.

NFP forex reaction

Forex traders must be wary of data releases like the NFP. Traders could get stopped-out due to the sudden increase in volatility. When volatility increases, spreads do too, and increased spreads can lead to margin calls.

Which currency pairs are most affected by NFP

The NFP data is an indicator of American employment, so your currency pairs that include the US Dollar (EUR/USD, USD/JPY, GBP/USD, AUD/USD, USD/CHF and others) are most affected by the data release.

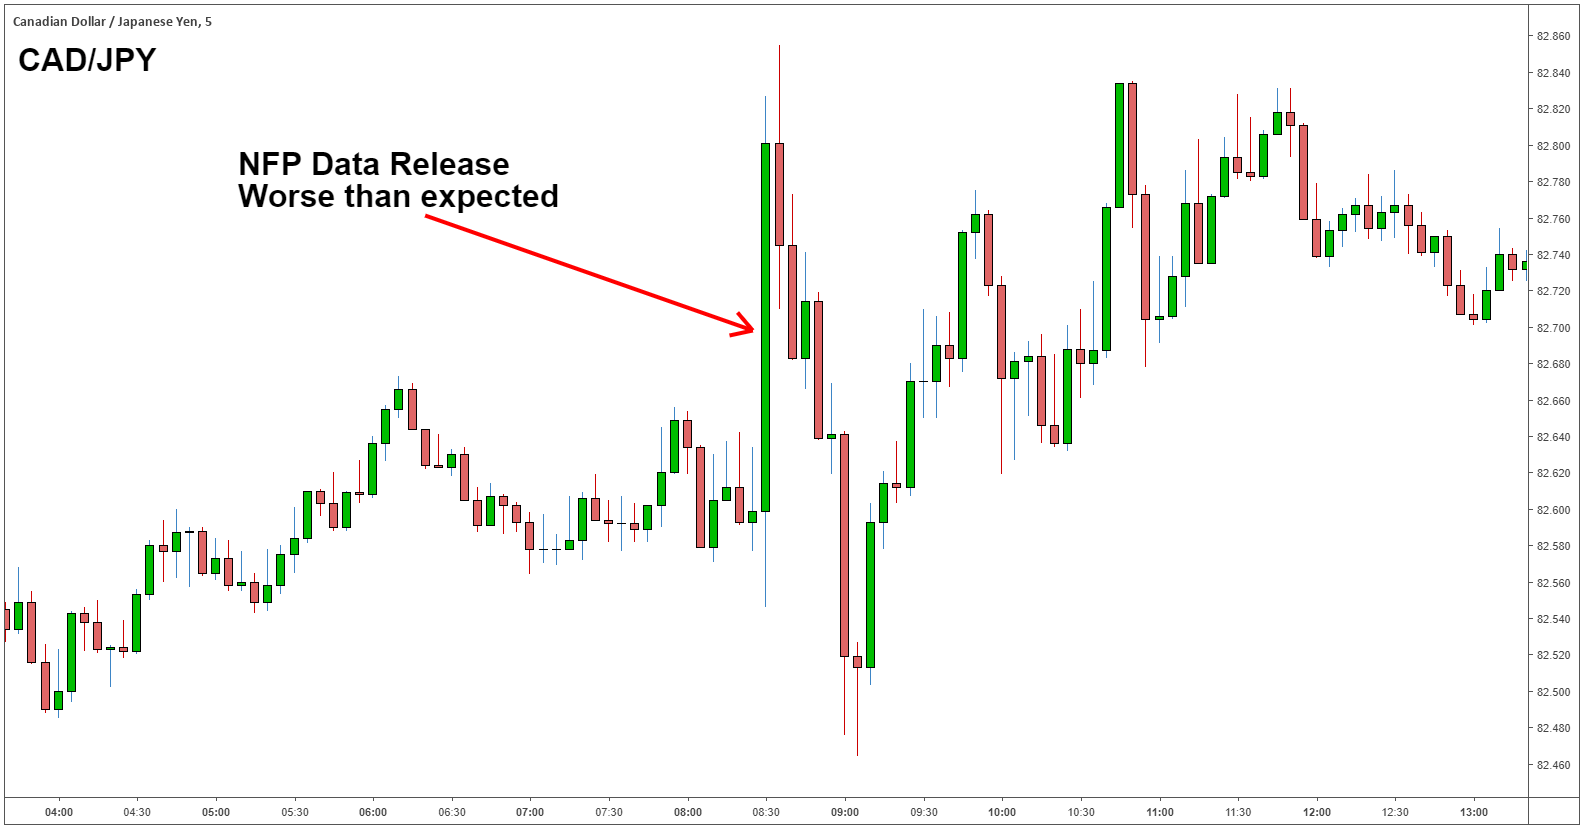
Other currency pairs also display an increase in volatility when the NFP releases, and traders must be aware of this as well, because they may get stopped out. The chart below shows the CAD/JPY during the NFP data release. As you can see, the increase in volatility could stop a trader out of their position even though they are not trading a currency pair linked to the US Dollar.

CAD/JPY NFP reaction

Non-farm payroll release dates

The Bureau of Labor statistics normally releases the NFP data on the first Friday of each month at 8:30 AM ET. The release dates can be found on the Bureau of Labor Statistic’s website.

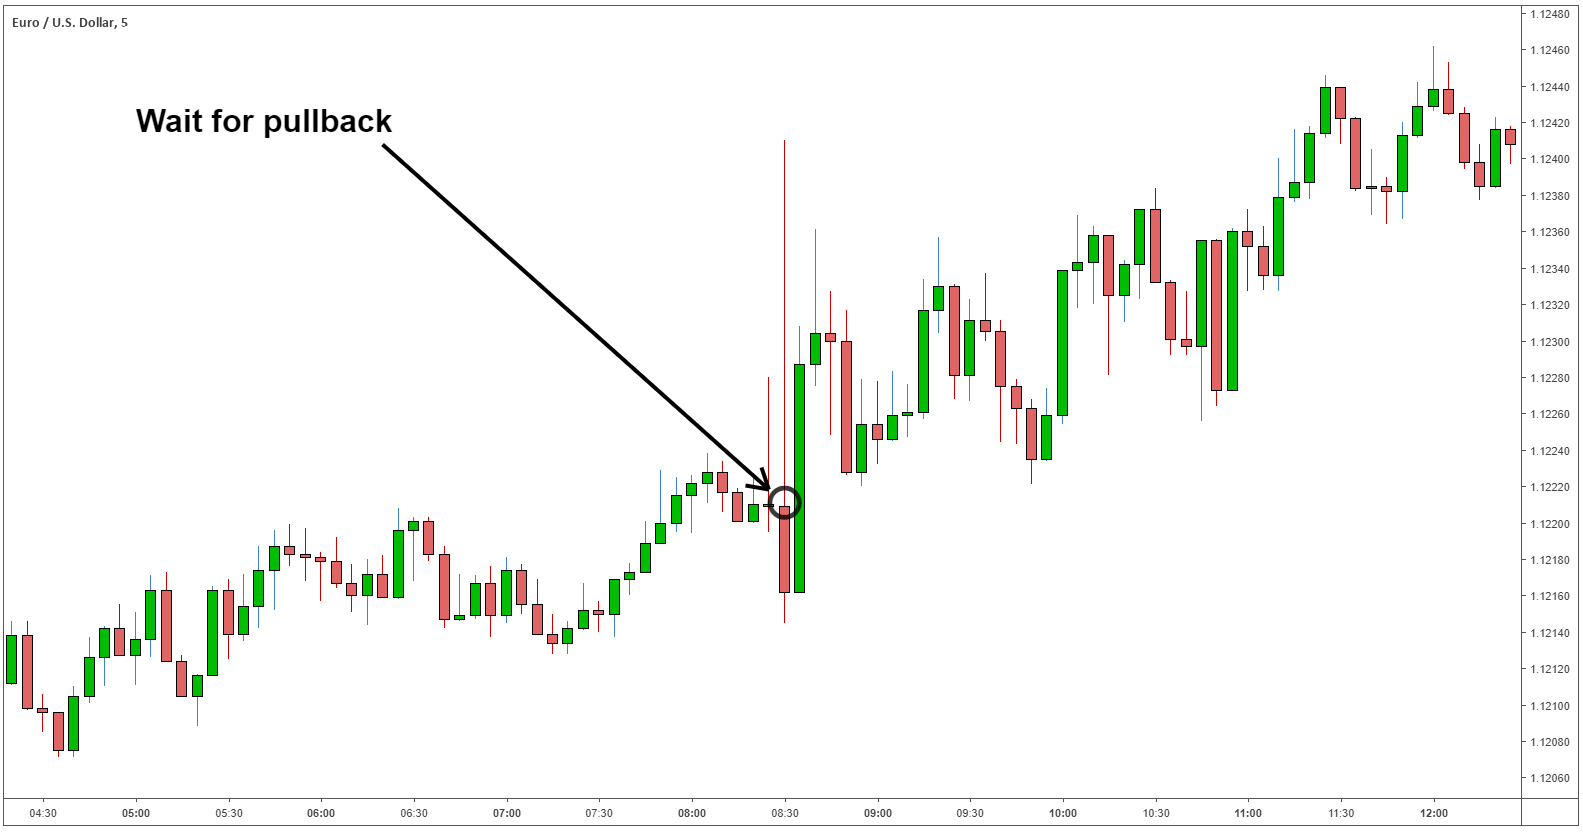
Due to the volatile nature of the NFP release, we recommend using a pull-back strategy rather than a breakout strategy. Using a pullback strategy, traders should wait for the currency pair to retrace before entering a trade.

Using the same example as above (NFP results 20k vs 180k expected) we expect the US Dollar to depreciate. In the example below, we use the EUR/USD. Because the NFP data came out worse than expected, we forecast the EUR/USD to appreciate.

EUR/USD NFP data pullback strategy

Trading the NFP data releases: Top tips & further reading

Here are a few tips to remember when using NFP data releases to inform your forex trading:

  1. NFP data is released on the first Friday of every month.
  2. The NFP data release is accompanied with increased volatility and widening spreads.
  3. Currency pairs not related to the US Dollar could also see increased volatility and widening spreads.
  4. Trading the NFP data release can be dangerous due to the increase in volatility and possible widening of spreads. To combat this, and to avoid getting stopped-out, we recommend using the appropriate leverage, or no leverage at all.
EUR/USD, GBP/USD, DXY Price Forecast: ECB Rate Decision in Highlights

EUR/USD, GBP/USD, DXY Price Forecast: ECB Rate Decision in Highlights

EUR/USD and GBP/USD Price Forecast: Analysis and Events Ahead

The Dollar Index has witnessed a minor decline, reflecting investor reactions to U.S. labor market data, including a 140K rise in ADP Non-Farm Employment Change against an anticipated 149K, and the Fed Chair’s testimony.

EUR saw a notable dip in German Factory Orders by -11.3%, much lower than the -6.0% forecast, while GBP showed resilience with a 0.4% increase in Halifax HPI m/m, although below the 0.8% expectation.

Events Ahead

Focus intensifies with the upcoming U.S. Unemployment Claims projected at 217K and Powell’s second testimony. The climax builds towards Friday’s reports: Average Hourly Earnings expected at 0.2%, Non-Farm Employment Change forecasted at 198K from the previous 353K, and the Unemployment Rate anticipated to hold steady at 3.7%.

For EUR/USD, the ECB’s rate decision and policy statements are critical. A hawkish or dovish stance could either bolster or pressure the Euro.

US Dollar Index (DXY)

Dollar Index
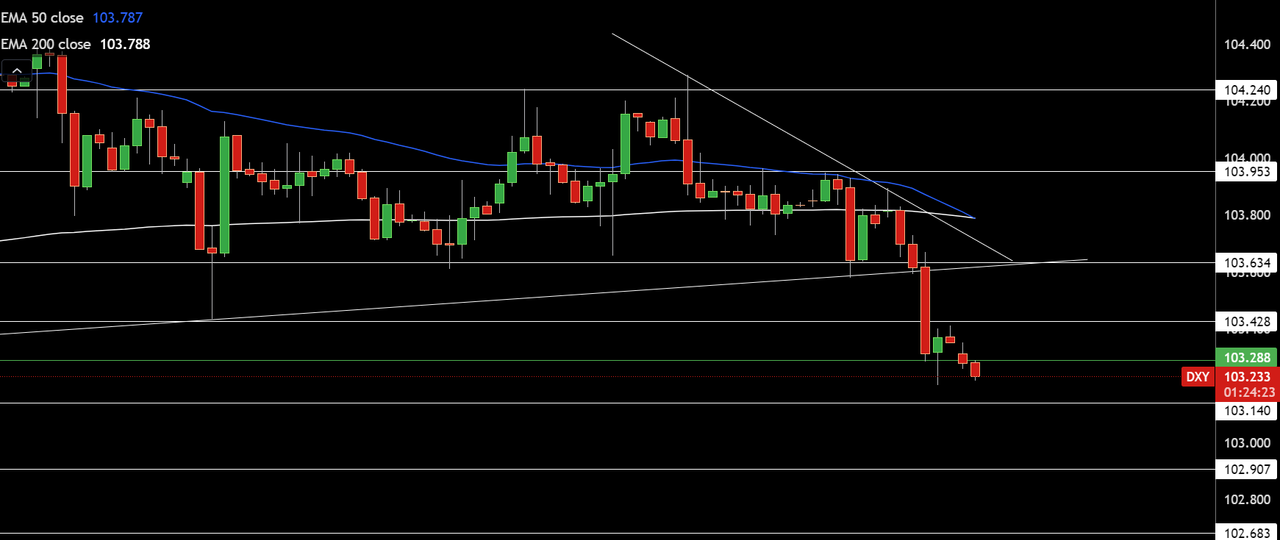
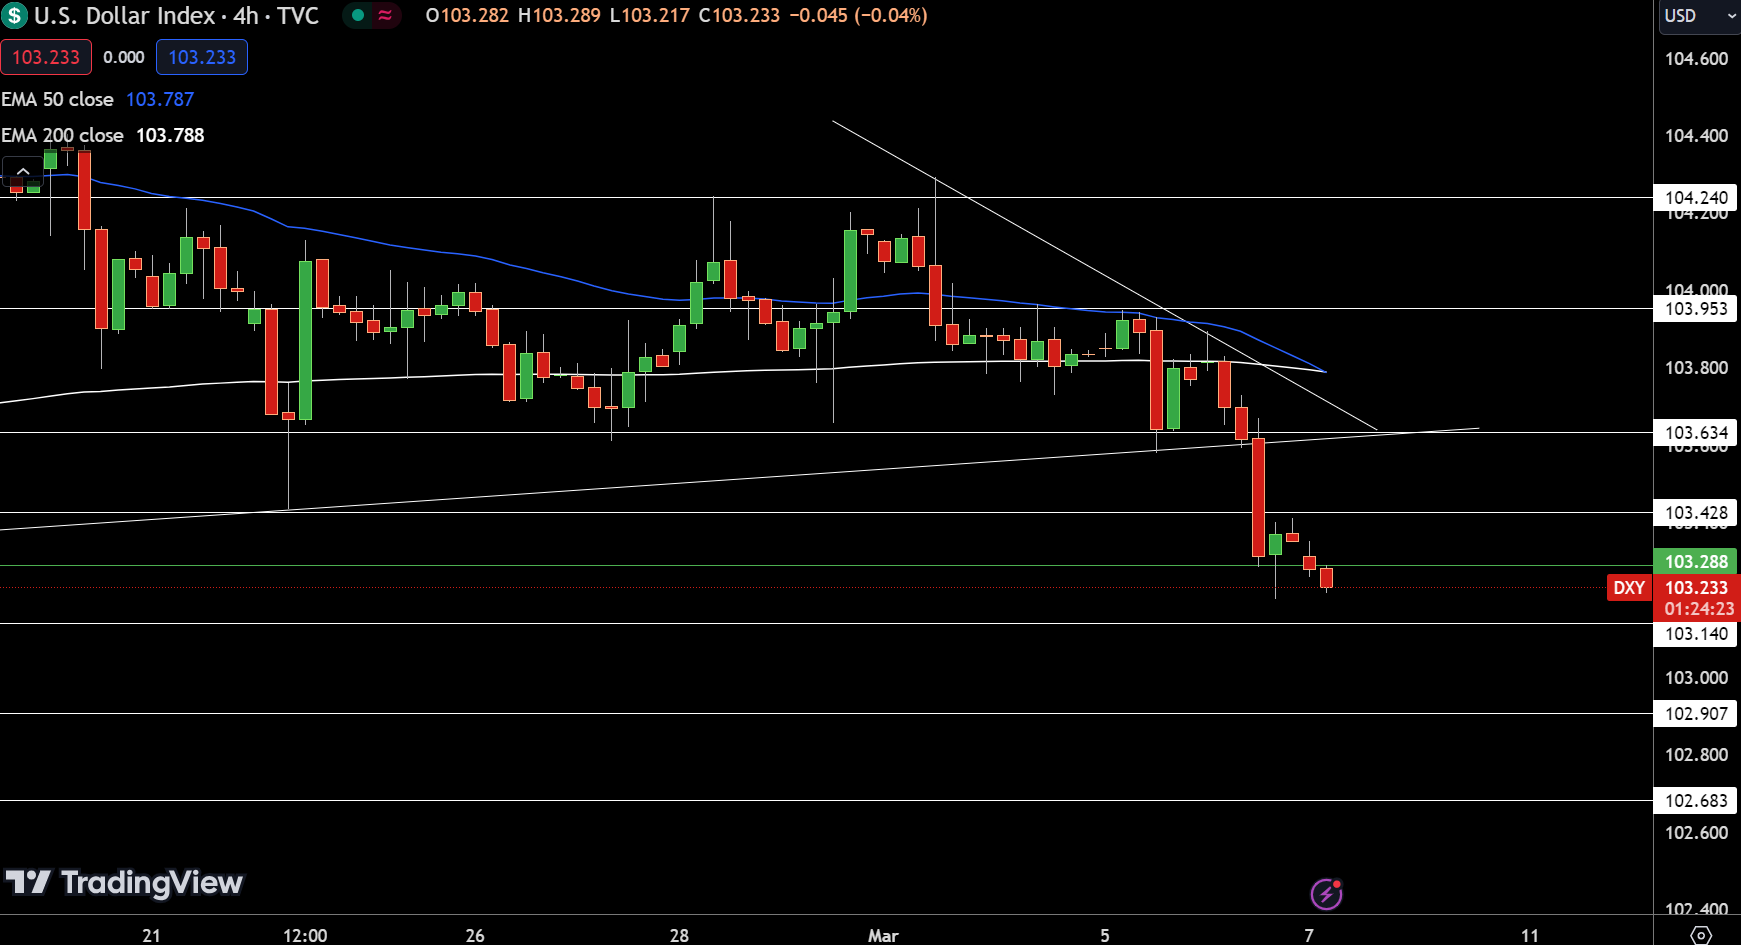
Dollar IndexThe Dollar Index today exhibits a slight downtrend, decreasing by 0.08% to settle at 103.233, underscoring subtle yet present market apprehensions. Situated marginally below its pivot point at 103.288, the index currently navigates a narrow trading range. It faces immediate resistance at 103.428, with subsequent hurdles at 103.634 and 103.953 potentially challenging any bullish momentum.

Conversely, the support structure is clearly defined at 103.140, extending down to 102.907 and further to 102.683, marking critical zones where buyers may emerge to stall further declines.

The juxtaposition of the 50-day and 200-day Exponential Moving Averages, both hovering around 103.787 and 103.788 respectively. Given these dynamics, the outlook for the Dollar Index is cautiously bearish below the 103.288 mark.

EUR/USD Technical Forecast

EUR/USD Price Chart - Source: Tradingview
EUR/USD Price Chart

Resistance levels loom at 1.0916, 1.0939, and 1.0963, marking potential ceilings for further advances. Support is established at 1.0867, with additional cushions at 1.0822 and 1.0796 to catch potential pullbacks.

The 50-day and 200-day Exponential Moving Averages, at 1.0849 and 1.0833 respectively, bolster the bullish perspective, provided the pair remains above the pivot point. However, dipping below 1.0893 could pivot the outlook to bearish, emphasizing the criticality of this threshold in dictating the short-term direction.

GBP/USD Technical Forecast

GBP/USD Price Chart - Source: Tradingview
GBP/USD Price Chart
The GBP/USD pair nudged up slightly by 0.01%, positioning itself at 1.27378, indicating a cautious optimism among traders. The currency sits above its pivotal mark of 1.2715, signaling a potential bullish undertone in today’s market dynamics.

Resistance points are clearly marked at 1.2758, 1.2783, and 1.2807, which could serve as ceilings for any forthcoming price ascensions. Conversely, the pair finds immediate support at 1.2673, with further safety nets at 1.2647 and 1.2600, ready to mitigate any downturns.

The 50-day and 200-day Exponential Moving Averages, recorded at 1.2682 and 1.2655 respectively, support the bullish outlook as long as the pair remains above the pivot.

Gold, Silver, Copper Daily Forecast: Powell’s Hint Sparks Gold’s Rally to $2,300

Gold, Silver, Copper Daily Forecast: Powell’s Hint Sparks Gold’s Rally to $2,300

Metals Navigating Highs Amid Powell’s Rate Cut Hints

Gold’s upward trajectory continues, reaching new highs for the seventh straight day, fueled by weaker U.S. economic indicators and Fed Chair Jerome Powell’s hints at potential rate cuts if inflation declines. This surge is partly attributed to significant futures purchases. Powell’s comments and softer labor market data have diminished U.S. Treasury yields and the dollar’s value, enhancing gold’s attractiveness.

Silver and copper also reflect this trend, with investors closely watching for further economic cues, especially from the upcoming U.S. Non-Farm Payrolls (NFP). Central bank purchases, driven by geopolitical uncertainties and a global growth slowdown, notably from China, underline gold’s status as a secure investment, with notable demand from countries like China, Turkey, Russia, and Poland.

Gold Prices Forecast

Gold - Chart
Gold – ChartIn today’s gold market, the price has ascended by 0.47%, reaching $2158.25. The pivotal point for the session stands at $2146.02, marking a crucial juncture for future movements.

Resistance levels are identified at $2168.25, $2182.32, and $2196.38, potentially challenging upward momentum. Conversely, support is found at $2127.87, with additional levels at $2114.71 and $2098.83, offering a buffer against declines.

Technical analysis, bolstered by three consecutive bullish engulfing candles and the 50 and 200-day EMAs at $2042.37 and $1982.27 respectively, underscores a prevailing bullish trend, suggesting a strong buying interest above the pivot point.

Silver Prices Forecast

Silver - Chart
Silver – Chart

Silver‘s trading session witnessed a minor decline of 0.24%, positioning the price at $24.11. The analysis identifies a pivot point at $24.05, which is critical for determining future market direction. Resistance levels are mapped out at $24.30, $24.53, and $24.82, posing challenges for upward price movements.

Support levels, on the other hand, are established at $23.69, $23.33, and $23.02, offering foundational support in case of a downturn. With the 50-day and 200-day Exponential Moving Averages at $23.31 and $22.99 respectively, the market sentiment leans bullish above the pivot point.

A descent below this critical juncture could, however, trigger a more pronounced selling trend.

Copper Prices Forecast

Copper - Chart
Copper – ChartIn today’s commodities market, Copper has shown a modest increase of 0.31%, bringing its price to $3.88. Our analysis identifies a critical pivot point at $3.87, suggesting a bullish sentiment if sustained above this level. Key resistance points are set at $3.90, $3.93, and $3.96, which Copper must overcome to continue its upward trajectory.

Conversely, support levels are found at $3.84, $3.82, and $3.79, crucial for preventing further declines. The 50-day and 200-day Exponential Moving Averages, at $3.86 and $3.83 respectively, reinforce the bullish outlook. However, a dip below the pivot could signal a shift to a bearish market.

USD/JPY Forecast: Wage Trends Fuel Yen Strength Amid Fed Rate Cut Bets

USD/JPY Forecast: Wage Trends Fuel Yen Strength Amid Fed Rate Cut Bets

USD/JPY Movement on Wednesday

The USD/JPY fell by 0.46% on Wednesday. Following a 0.32% loss on Tuesday, the USD/JPY ended the session at 149.346. The USD/JPY rose to a high of 150.084 before falling to a Wednesday session low of 149.092.

Labor Market Data Supports BoJ Pivot from Negative Rates

On Thursday, labor market data from Japan garnered investor interest. Overtime pay and average cash earnings supported bets on an April Bank of Japan pivot from negative rates.

Overtime pay increased by 0.4% year-on-year in January after falling 0.7% in December. Significantly, average cash earnings rose by 2% year-over-year in January after rising by 1% in December. Economists forecast average cash earnings to increase by 0.5%.

The pickup in wages could fuel consumer spending and drive demand-driven inflation. Upward wages and household spending trends would enable the BoJ to exit negative rates to ensure price stability.

Significantly, the wage data coincides with spring wage negotiations, pivotal for BoJ plans to exit negative rates. The USD/JPY responded to the data, falling to an early low of 149.075.

With wages in focus, investors must also consider BoJ chatter. Views on wages, inflation, and the timeline to exit negative rates could move the dial.

US Economic Calendar: The Fed and Jobless Claims in Focus

On Thursday, US jobless claims data warrants investor attention. After weaker-than-expected labor market data on Wednesday, a spike in jobless claims could fuel bets on an H1 2024 Fed rate cut.

Economists forecast initial jobless claims to remain at 215k in the week ending March 2, 2024.

A weaker labor market environment could impact wage growth and lower disposable income. Downward trends in disposable income could affect consumer spending plans and dampen demand-driven inflation. A softer inflation environment may allow the Fed to cut interest rates to support demand and avoid a hard landing.

While the numbers need consideration, Fed Chair Powell will deliver a second day of testimony. The second session tends to yield few surprises. Nonetheless, investors must consider deviation from the Wednesday script. FOMC member Loretta Mester is also on the calendar to speak. Views on the timeline for a rate cut could move the dial.

Short-term Forecast

Near-term trends for the USD/JPY will hinge on wage negotiations in Japan and the US Jobs Report. A weaker-than-expected US Jobs Report jump in wages in Japan could tilt monetary policy divergence toward the Yen. The Fed is eying rate cuts, while the BoJ is considering a pivot from negative rates.

USD/JPY Price Action

Daily Chart

The USD/JPY hovered above the 50-day and 200-day EMAs, sending bullish price signals.

A USD/JPY breakout from the 149.500 handle would bring the 150.201 resistance level into play.

BoJ chatter, US jobless claims, and Fed commentary need consideration.

However, a drop below the 149 handle would support a fall to the 50-day EMA (148.564) and the 148.405 support level.

The 14-day RSI at 47.13 suggests a USD/JPY drop below the 148 handle before entering oversold territory.

USD/JPY Daily Chart sends bullish price signals.
USDJPY 070324 Daily Chart

4-Hourly Chart

The USD/JPY sat below the 50-day and 200-day EMAs, sending bearish price signals.

A USD/JPY break above the 200-day EMA would support a move toward the 50-day EMA and the 150.201 resistance level.

However, a drop below the 149 handle would give the bears a run at the 148.405 support level.

The 14-period 4-hour RSI at 23.59 shows the USD/JPY in oversold territory. Buying pressure could intensify at the 149 handle.

4-Hourly Chart sends bearish price signals.
USDJPY 070324 4 Hourly Chart
Bitcoin (BTC) Price at Crossroads —$75k Breakout or Shocking $50k Reversal?

Bitcoin (BTC) Price at Crossroads —$75k Breakout or Shocking $50k Reversal?

BTC price rebounded to daily-timeframe peak of $67,716 on March 6 after having dipped 13% in the wake of the widespread profit-taking trades that heralded Bitcoin’s new all-time high.  On-chain data reveals that the bearish catalysts that drove BTC price to a weekly low of $59,548 are still in play.

What are the chances of a Bitcoin price witnessing a breakout above $75,000 in the coming days?

BTC price reversal triggered by record-breaking profit-taking

Tuesday March 5, marked the first time Bitcoin price traded above $69,090 in hits eventful 15-year history. Remarkably, the milestone was heralded by rapid sell-offs by traders looking to cash-in on their profitable positions.

Within the next 24 hours, rapid sell-offs accelerated by dramatic long liquidations in the derivatives markets saw BTC price rapidly drop as low as $59,458.

Thanks ETF demand and frantic covering purchases from leveraged traders, BTC was able to hold the $59,000 support and rebounded above $67,000. However, on-chain data trends suggest the bearish tailwinds could linger a few more days and hold BTC price rally in a consolidation phase.

In confirmation of this stance, on-chain data trends shows how Bitcoin long-term investors had entered a record-breaking profit-taking wave ahead of the price retracement on March 6. rejection.

Santiment’s Age Consumed metric, tracks real-time swings in long-term investors trading activity, by multiplying the number of recently-moved coins by the number of days since they were ast traded.

Rising values of the Age Consumed metric implies that more long-held coins are  being traded and vice-versa. Bitcoin (BTC) Age Consumed vs. Price | Source: Santiment

Bitcoin (BTC) Age Consumed vs. Price | Source: SantimentAs seen above, BTC Age Consumed recorded significant spikes over the past week BTC edged closer to the $70,000 milestone. After trending above 40 million in each of the last 3 trading days, it soared to 67.2 million coin days destroyed on March 6, a move that quickly tipped the momentum in the bears’ favor.

Long-term holders often take profits when price hit critical milestones. Hence, the sell-off that heralded BTC’s new all-time high was widely-anticipated.

However, if long-term holders keep selling over an prolonged period it could accelerate the price downtrend, or significantly slow down the next rally.

Hence, strategic swing traders will keep their eye on the long-term holders’ disposition in the days ahead as vital indicator of  the prospects  Bitcoin price advancing towards $75,000 or surrendering to a $50,000 reversal.

Bitcoin Price Prediction: Prolonged Consolidation within $60,000 – $69,000

From an on-chain perspective, Bitcoin price is now more likely to consolidate within the $60,000 to $69,000 channel, unless the ongoing selling trend observed among long-term holders abates.

In affirmation of this stance, IntoTheBlock’s global in/out of the money data shows that the looming buy-wall at $59,300 makes for the bears to stage a brazen  attempt at a reversal below $50,000.

As seen below, 545,650 addresses had acquired 337,460 BTC at the minimum price of $59,323. If the hold their positions, BTC price will likely rebound from that area as earlier observed on March 6.

Bitcoin (BTC) Price Prediction, Feb 23, 2024 | Source: IntoTheBlock
Bitcoin (BTC) Price Prediction, March, 2024 | Source: IntoTheBlockIn event of an upswing, the selling pressure from bearish traders capitalizing they psychological resistance at $70,000 range, make a $75,000 unlikely outcome in the near-term.