Bitcoin (BTC) News Today: Catalyst Needed for BTC Breakout Above $70,000

Bitcoin (BTC) News Today: Catalyst Needed for BTC Breakout Above $70,000

BTC-Spot ETF Market Statistics Delivered a Five-Day Winning Streak

On Sunday, March 10,  BTC extended its winning streak to five sessions. BTC-spot ETF market flows for the week ending March 8 contributed to BTC gains of 9.38% in the week ending March 10.

Notably, the BTC-spot ETF market flipped Grayscale Bitcoin Trust (GBTC) to become the largest BTC holder, with 405k BTC. iShares Bitcoin Trust (IBIT) flipped MicroStrategy (MSTR), with 196k BTC.

After an impressive run of net inflows in the week ending March 8, the focus will likely turn to demand. Continued inflows at current levels may materially impact the availability of BTC and push BTC prices higher.

Michael Saylor, MicroStrategy founder and Chairman, shared a chart highlighting BTC interest on Sunday, saying,

“Interest in Bitcoin is hitting an All-Time High everywhere in the world.”

On Monday, March 11, BTC and the broader crypto market may need a catalyst to kick-start another bullish week. BTC-spot ETF market flow data for Monday, March 11, will likely impact buyer appetite for BTC and the broader market.

BTC was down 0.89% to $68,449 on Monday, March 11. Investor caution influenced buyer appetite for Meme Coins. Shiba inu coin (SHIB) and dogecoin (DOGE) were down 3.04% and 1.94%, respectively. Floki inu (FLOKI) declined by 3.43% through the Monday morning session after surging 86.51% in the week ending March 10.

ETH-spot ETF chatter also drew interest as investors considered the prospects of an ETH-spot ETF market.

ETH-Spot ETF May Approval Window Remains Open Amidst Approval Uncertainty

On Sunday, ETFStore President Nate Geraci shared his views on the lay of the land for an ETH-spot ETF Market, saying,

“If ether futures aren’t *highly* correlated w/ spot market, then why did SEC approve ether futures ETFs in Oct… How does that protect investors? Not saying SEC gonna approve spot ether ETFs, but not sure how they deny based on lack of correlation. Would be pretty bad look IMO.”

Geraci added,

“And while there’s no existing court case compelling SEC to approve spot ether ETFs… There really shouldn’t need to be IMO. Grayscale victory = precedent. Options for SEC are to unwind yrs of implicit acceptance of ether as commodity or face new lawsuit(s) if issuers so choose.”

Whether ETH is a commodity or a security has created uncertainty about an ETH-spot ETF market. Despite the uncertainty, ETH outperformed BTC in the week ending March 10, rallying 11.20% to end the week at $3,881.

Technical Analysis

Bitcoin Analysis

BTC hovered well above the 50-day and 200-day EMAs, affirming bullish price signals.

A BTC break above the March 8 all-time high of $70,076 would support a move toward the $75,000 handle.

BTC-spot ETF market flows need consideration.

However, a drop below the $67,000 handle would give the bears a run at the $65,000 handle.

The 14-Daily RSI reading, 73.56, shows BTC sitting in overbought territory. Selling pressure may intensify at the March 8 all-time high of $70,076.

BTC Daily Chart sends bullish price signals.
BTCUSD 110324 Daily Chart

Ethereum Analysis

ETH sat well above the 50-day and 200-day EMAs, sending bullish price signals.

An ETH breakout from the Friday high of $4,013 would bring the $4,200 handle into play.

Chatter about ETH-spot ETFs remains the main driver.

However, an ETH drop below the $3,800 handle would give bears a run at the $3,683 support level.

The 14-period Daily RSI, at 79.43, shows ETH in overbought territory. Selling pressure may intensify at the March 8 high of $4,013.


ETH Daily Chart sends bullish price signals.
ETHUSD 110324 Daily Chart
Natural Gas and Oil Forecast: Geopolitical Tensions vs. China Demand In Play

Natural Gas and Oil Forecast: Geopolitical Tensions vs. China Demand In Play

Impact on Energy Markets: China’s Demand and Geopolitical Tensions

Oil prices are facing downward pressure due to concerns over China’s sluggish demand, despite OPEC+’s continued supply cuts. The situation is somewhat offset by geopolitical risks in the Middle East and Russia, which could limit losses.

Mixed reactions to U.S. job data and China’s ambitious 5% growth target for 2024 also play roles in market sentiment. However, OPEC+’s decision to extend production cuts into the second quarter might tighten the market.

Meanwhile, escalating tensions in the Middle East and around Russia contribute to uncertainties that could affect global energy supplies, influencing both Natural Gas and Oil forecasts.

Natural Gas Price Forecast

NG Price Chart
NG Price ChartNatural Gas (NG)‘s market dynamics show a significant upturn, with prices ascending by 1.77% to $1.8960, as charted on a 4-hour timeframe. The current pivot stands at $1.8494, delineating critical market movements.

Resistance levels are observed at $1.9173, $1.9790, and $2.0570, suggesting potential ceilings for price advancements. Conversely, support levels at $1.7856, $1.7257, and $1.6772 mark thresholds where buying interest may rejuvenate.

Technical indicators, including a 50-Day Exponential Moving Average (EMA) at $1.8996 and a 200-Day EMA at $1.9786, hint at nuanced market sentiments. The near-term breach above $1.9175 could trigger a sell-off, underlining a tactical pivot for traders. Despite this, Natural Gas remains fundamentally bullish above $1.8494.

WTI Oil Price Forecast

WTI Price Chart
WTI Price Chart

Technical indicators reveal a 50-Day Exponential Moving Average (EMA) at $78.53, suggesting a slight bearish momentum against the 200-Day EMA at $77.07. The current market stance below the pivot indicates a bearish outlook, with a shift above $77.99 possibly altering the trend to a more bullish inclination.

Brent Oil Price Forecast

UKOIL Price Chart
UKOIL Price Chart

Gold, Silver, Copper Daily Forecast: Eye CPI Data, Sell XAU Under $2,185

Gold, Silver, Copper Daily Forecast: Eye CPI Data, Sell XAU Under $2,185

Gold, Silver, and Copper Await U.S. Inflation Data

Gold prices hovered near record highs, anticipating U.S. inflation data that may influence Federal Reserve rate decisions. Last week, expectations of rate cuts, fueled by Fed Chair Jerome Powell’s comments on nearing comfortable inflation levels and lukewarm U.S. labor data, propelled gold to new heights.

The dollar’s weakness and falling Treasury yields also supported bullion prices. Attention now shifts to Tuesday’s U.S. consumer price index, expected to reveal a slight ease in inflation, yet above the Fed’s target.

Copper prices remained steady, reflecting mixed economic indicators from China, the top importer. Despite a rise in China’s copper imports in the early year, factory activity’s slowdown suggests tempered demand, as indicated by recent inflation data. The metals market is keenly awaiting further economic cues, especially U.S. inflation figures, for directional clarity.

Gold Prices Forecast

Gold - Chart
Gold – ChartGold‘s price today marks a slight decrease, trading at $2,177.39, down by 0.10%. Analyzing the 4-hour chart, the metal’s pivot point is at $2,182.54, indicating key price movements ahead.

Resistance levels are set at $2,196.38, $2,214.26, and $2,232.38, while support is found at $2,155.35, followed by $2,131.04 and $2,110.03. The 50-Day Exponential Moving Average (EMA) at $2,052.843 and the 200-Day EMA at $1,986.155 both suggest a longer-term uptrend, despite current pressures.

A Doji candle formation near the $2,185 level hints at potential selling pressure. The overall trend suggests bearish momentum below $2,185, with a break above this level potentially shifting the bias to bullish.

Silver Prices Forecast

Silver - Chart
Silver – Chart

Silver‘s market price slightly declined to $24.28, marking a decrease of 0.11% as observed on the 4-hour chart. The metal’s pivot point at $24.55 serves as a key determinant for future movements, with resistance levels identified at $24.82, $25.09, and $25.35.

Support levels are positioned at $24.01, indicating the immediate floor, followed by stronger supports at $23.59 and $23.29. Technical indicators, including a 50-Day Exponential Moving Average (EMA) at $23.72 and a 200-Day EMA at $23.15, underscore a prevailing bullish trend over the longer term, despite short-term setbacks.

The trend for silver appears bearish beneath $24.55, yet a surge above this threshold could signal a shift towards a more bullish sentiment.

Copper Prices Forecast

Copper - Chart
Copper – ChartCopper‘s current trading price of $3.89 reflects a modest increase of 0.05%, as seen in the 4-hour chart. The metal’s pivot point is at $3.91, with resistance levels anticipated at $3.94, $3.97, and $3.99.

Conversely, immediate support is found at $3.88, with subsequent levels at $3.86 and $3.82, suggesting potential areas for price stabilization. The 50-Day Exponential Moving Average (EMA) stands at $3.88, closely aligned with the 200-Day EMA at $3.84, indicating a slightly bullish trend over the longer term.

The overall outlook for copper is bullish above $3.88, yet a descent below this critical juncture could trigger a significant selling pressure.

The Market News Today: BlackRock’s iShares ETF Surpasses MicroStrategy in Bitcoin

The Market News Today: BlackRock’s iShares ETF Surpasses MicroStrategy in Bitcoin

BlackRock’s ETF Overtakes MicroStrategy in Bitcoin Holdings

In just under two months, BlackRock’s iShares Bitcoin ETF (IBIT) has outstripped MicroStrategy in Bitcoin holdings. As of the latest reports, IBIT possesses 195,985 Bitcoin, surpassing MicroStrategy’s 193,000 tokens. The surge in BlackRock’s holdings follows continuous, substantial inflows since the ETF’s inception on January 11. This rise places IBIT ahead of other spot products in the market, barring Grayscale Bitcoin Trust. Meanwhile, MicroStrategy, despite a recent $700 million capital raise aimed at increasing Bitcoin holdings, trails behind. The demand for new spot ETFs like IBIT has significantly fueled Bitcoin’s over 60% price increase this year, with the cryptocurrency recently hitting a record high of $70,136. (CoinDesk)

Nvidia Hits $2 Trillion Cap, Rises as Top Tech Titan

Nvidia, the prominent chip maker, has reached a staggering $2 trillion market cap, positioning itself as one of the top three companies globally, behind only Microsoft and Apple. This monumental growth is primarily fueled by the increasing demand for GPUs (graphics processing units) essential for powering AI technologies across various sectors, including healthcare and finance. Beyond its core chip business, Nvidia is significantly expanding its venture capital endeavors, investing in nearly three dozen AI-focused startups in the past year alone – a threefold increase from 2022. This strategic diversification has proved lucrative, with the value of Nvidia’s investments skyrocketing to approximately $1.55 billion. CEO Jensen Huang emphasizes the vast potential of this expanding ‘ecosystem,’ underscoring Nvidia’s critical role in supporting a wide array of industries leveraging AI, further cementing the company’s dominant position in the tech world. (Business Insider)

Walmart’s AI Search Revolution: One-Stop Shopping for Event Planning Challenges Google

Walmart is set to transform online shopping with its generative AI, aiming to become a singular destination for event planning needs. CEO Doug McMillon, after the company’s February earnings call, highlighted the significant improvement in their app’s search function, made more efficient and solution-oriented thanks to generative AI. This innovation positions Walmart not just as a product provider but as an event planner, simplifying the customer experience. The move reflects a broader shift in the retail sector, with major players like Instacart, Amazon, and Shopify also integrating AI in search and shopping processes. This tech evolution is reshaping how consumers find products, potentially challenging Google’s dominant position in search. The future of online shopping could see a seamless blend of AI-driven personalized recommendations and efficient search functions, offering a more intuitive and convenient experience for customers. (CNBC)

Silver Set to Outshine Gold Amid Rate Cut Expectations

Gold’s impressive rally, with prices recently hitting a peak of $2,178 per ounce, could see a continuation as investors anticipate interest rate cuts. However, silver is poised to steal the spotlight in the latter half of the year. Despite gold’s strong performance, silver’s dual role as both a precious and industrial metal places it in a unique position for growth. Current spot silver prices are at $24.36 per ounce, showing modest gains after a significant 5% increase last week. Market strategists suggest that silver’s potential outperformance is linked to expectations of global economic growth, particularly if the U.S. Federal Reserve cuts rates as inflation nears target levels. This shift could see silver, often seen as gold’s underperforming relative, emerge as a stronger investment choice, especially given its widespread industrial applications, from electronics to solar panels. Analysts indicate that a sustained move above the $24 mark could signal further upside for silver, outpacing gold in the coming quarters. (CNBC)

China’s Real Estate: No Bailout, Shift to Manufacturing Focus

China’s struggling real estate sector is set for a reality check, as authorities, led by Housing Minister Ni Hong, dismiss the possibility of a major bailout for developers. In a firm stance, Ni announced that companies facing severe insolvency should either declare bankruptcy or undergo restructuring, adhering to market principles and legal norms. This tough approach is part of a broader effort to clamp down on property market speculation and reduce the sector’s overwhelming influence on the economy. The government’s focus has shifted towards bolstering high-end manufacturing, rather than emphasizing the once-dominant real estate industry. Despite some financing relief for certain developers, the overarching national policy remains unaltered. Real estate, previously accounting for about a quarter of China’s GDP, is now receiving significantly less attention in governmental discussions, aligning with Beijing’s aim to diversify and stabilize the economy. (CNBC)

Markets Week Ahead: Gold Soars, Rate Cuts Near, Nasdaq and Nvidia Wobble

Markets Week Ahead: Gold Soars, Rate Cuts Near, Nasdaq and Nvidia Wobble

Market Wrap and Week Ahead – w/c March 11th

Recent commentary from ECB President Christine Lagarde and Federal Reserve Chairman Jerome Powell suggest that both central banks are looking to start a series of interest rate cuts in June.

In his testimony to the Senate Banking Committee on Thursday, Fed Chair Jerome Powell indicated that interest rates could soon be on the way down. ‘If the economy does as expected, we think carefully removing the restrictive stance of policy will begin over the course of the year’, Powell said Thursday.

Friday’s latest US Jobs Report also showed the closely watched unemployment rate rise unexpectedly from 3.7% to 3.9%, while average earnings slowed further.

US Dollar Falls Further After US NFP Beat But January Number Revised Lower

Also Thursday, post-policy decision commentary from ECB’s Lagarde also pointed to the end of H1 as an appropriate time to start cutting borrowing costs.

‘We are making good progress towards our inflation target and we are more confident as a result…But we are not sufficiently confident. We need clearly more evidence and more data. We will know a little more in April, but we will know a lot more in June.’

Earlier, ECB staff projections cut inflation and growth forecasts for the next three years.

Euro (EUR/USD) Drifts Marginally Lower, ECB Leaves All Policy Rates Unchanged

In Japan, recent commentary from Bank of Japan officials suggests that if the current round of wage negotiations produce the expected results, then the BoJ may well start to hike interest rates soon, with the markets already pricing in a 60%+ chance of a hike this month.

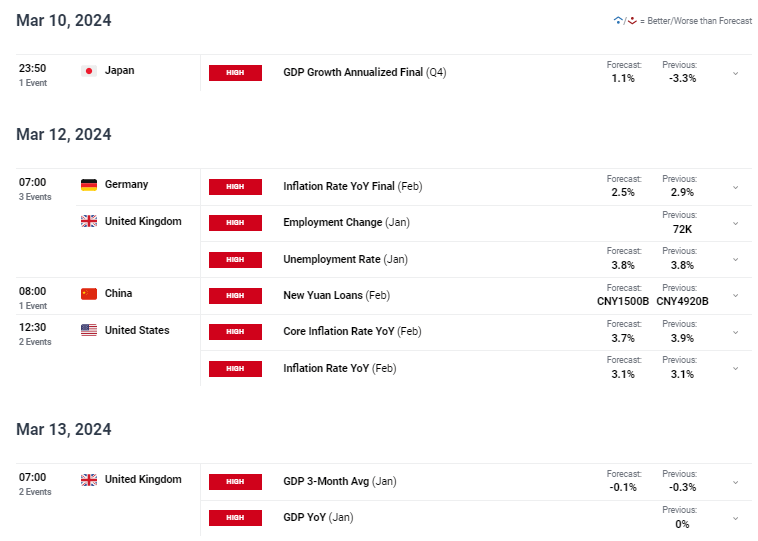
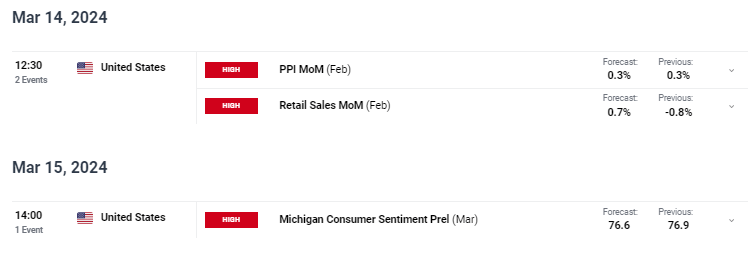
High Importance Economic Releases and Events – w/c March 11th.

There are a few important data releases that can inject a further shot of volatility into a range of asset classes. The standout next week is the latest US inflation report, followed by UK employment and growth data.

Learn how to trade economic data releases and events with our complimentary guide

image1.pngimage2.png

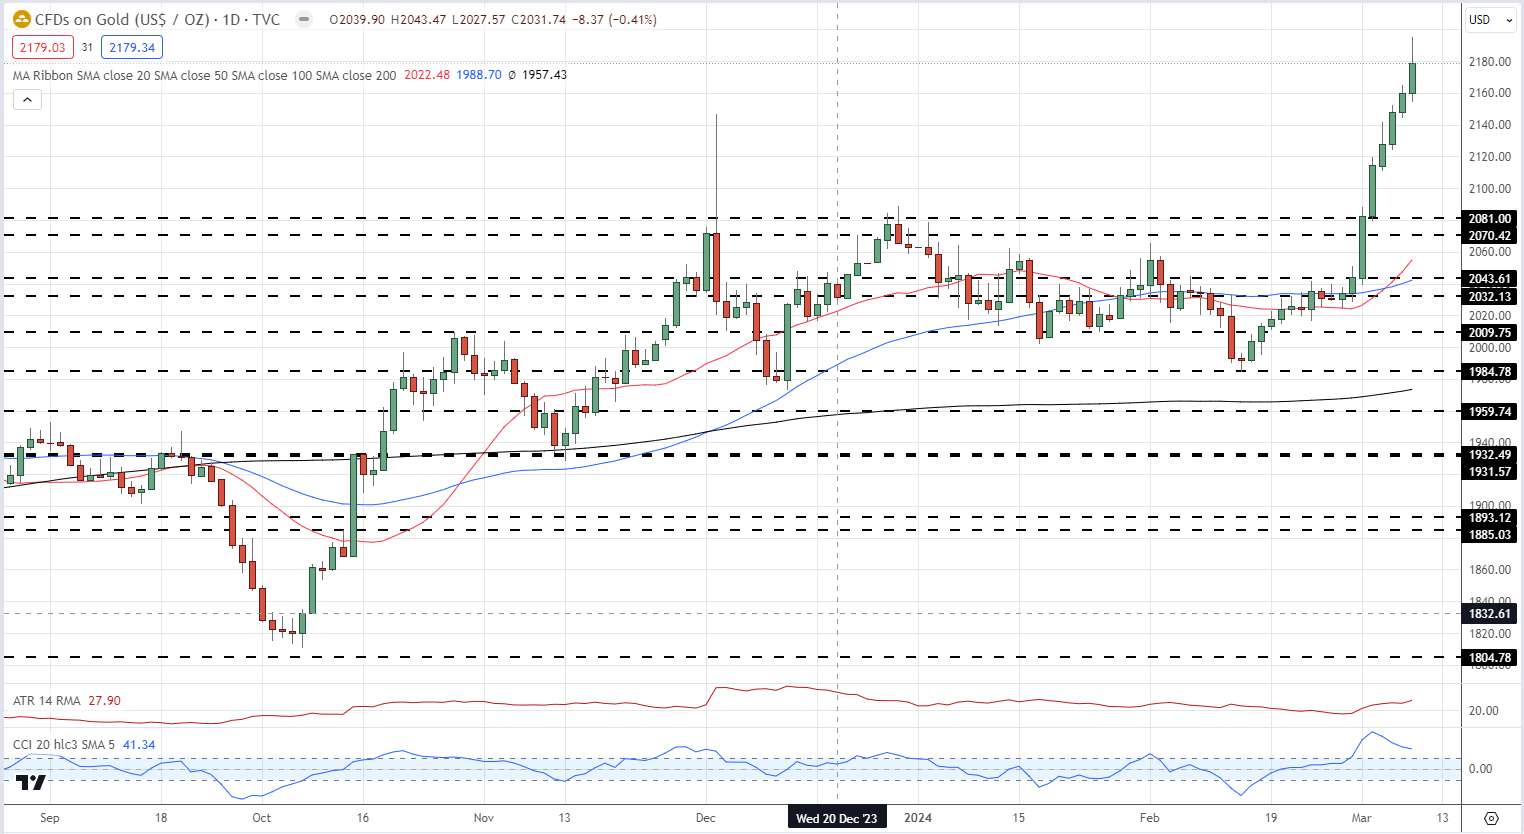
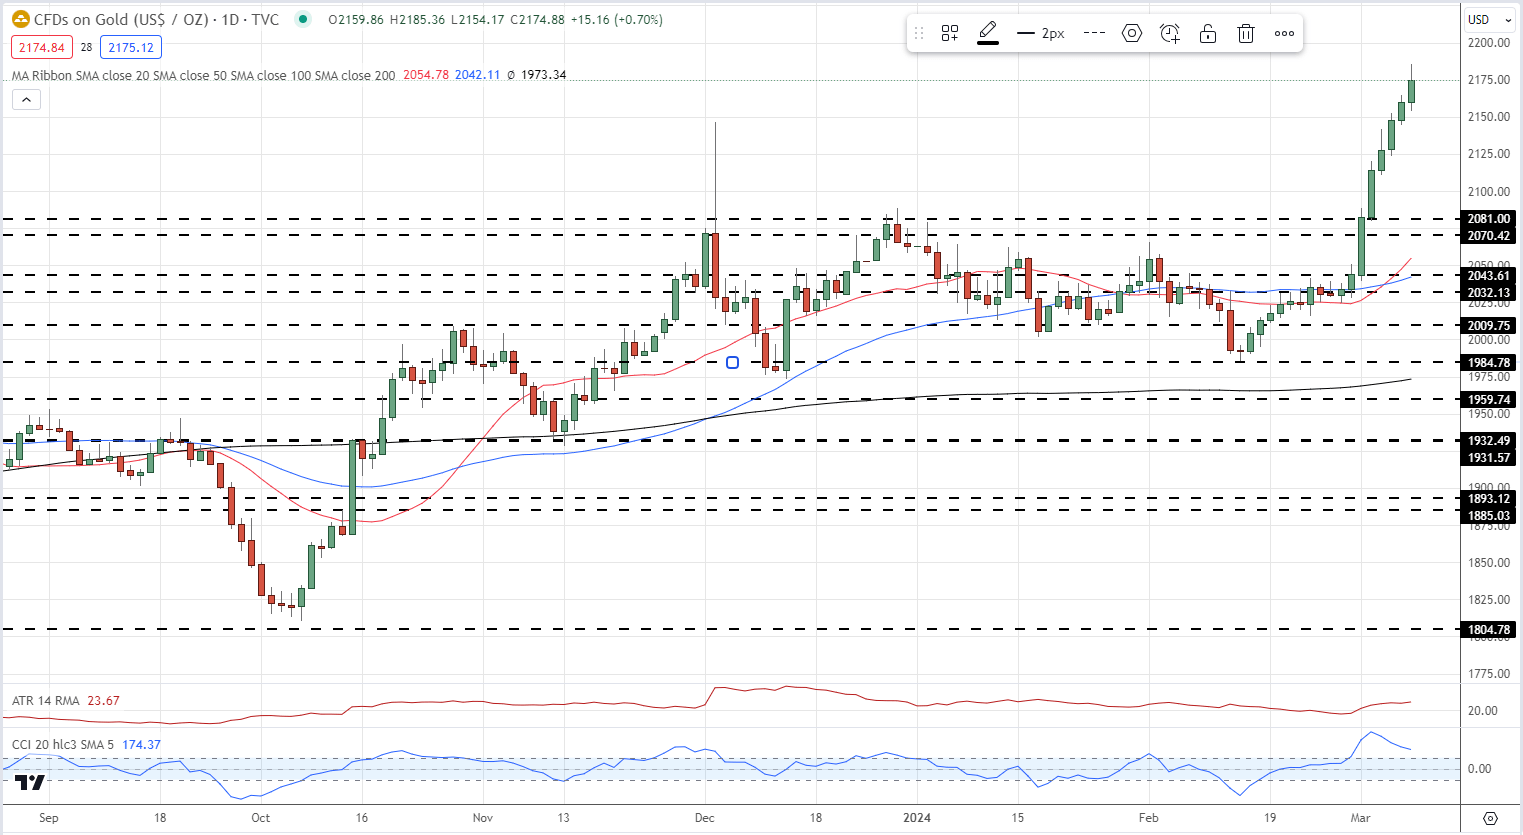
This week saw gold continue to push higher and make a couple of fresh record highs. The precious metal is being driven ever higher on a combination of increased rate cut expectations, Chinese demand, and safe haven buying.

Gold Daily Price Chart

image3.png

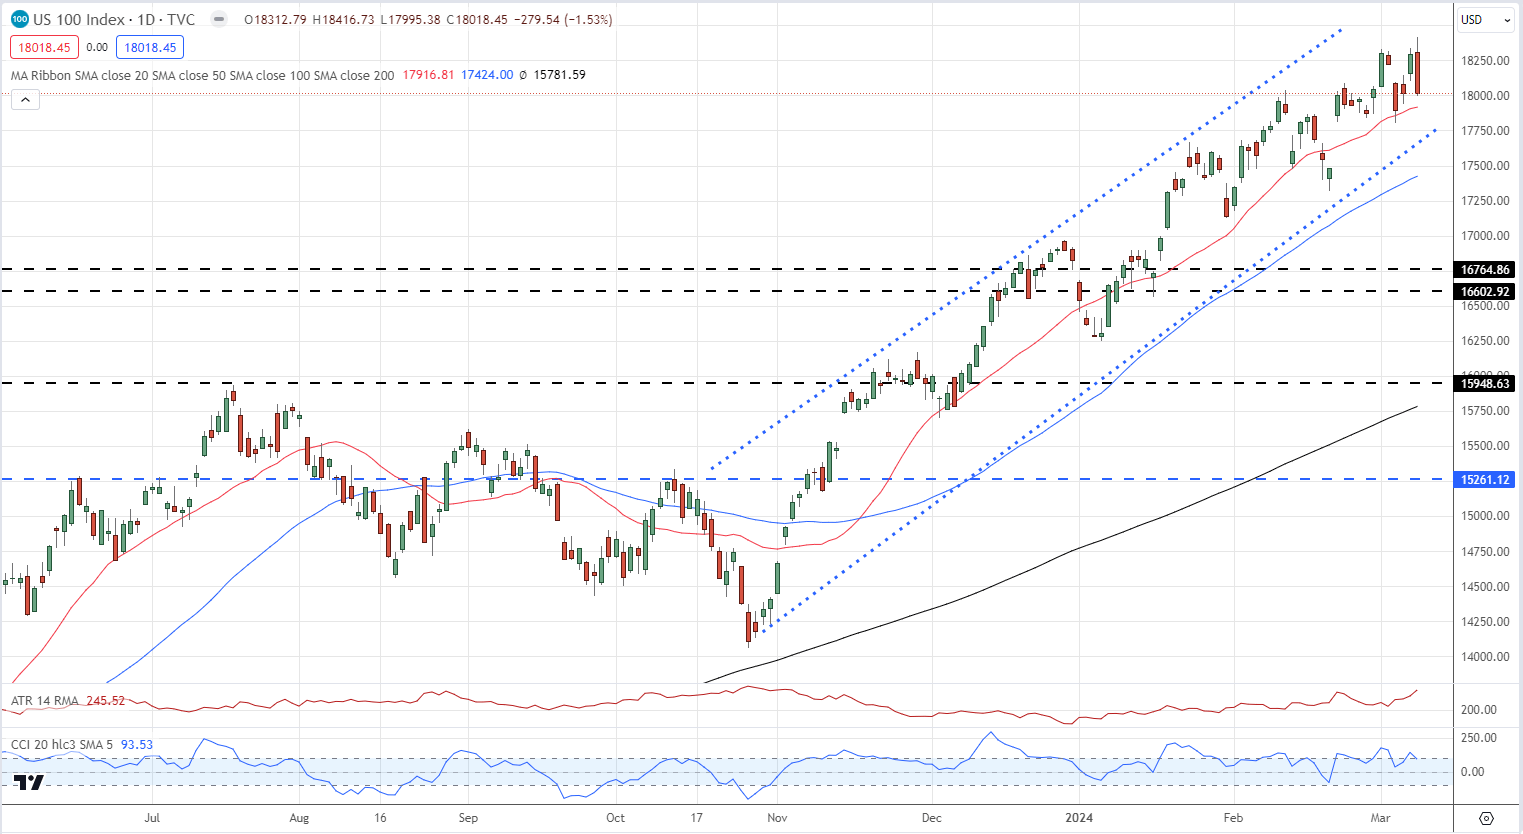
US indices pushed marginally higher over the week although Friday’s sell-off, noticeable in the Nasdaq, is worth taking note of. Friday’s sell-off, while damaging, still leaves Nasdaq in a bullish trend with the indices making an unbroken series of higher lows and higher highs over the past five months.

Nasdaq 100 Daily Chart

image4.png

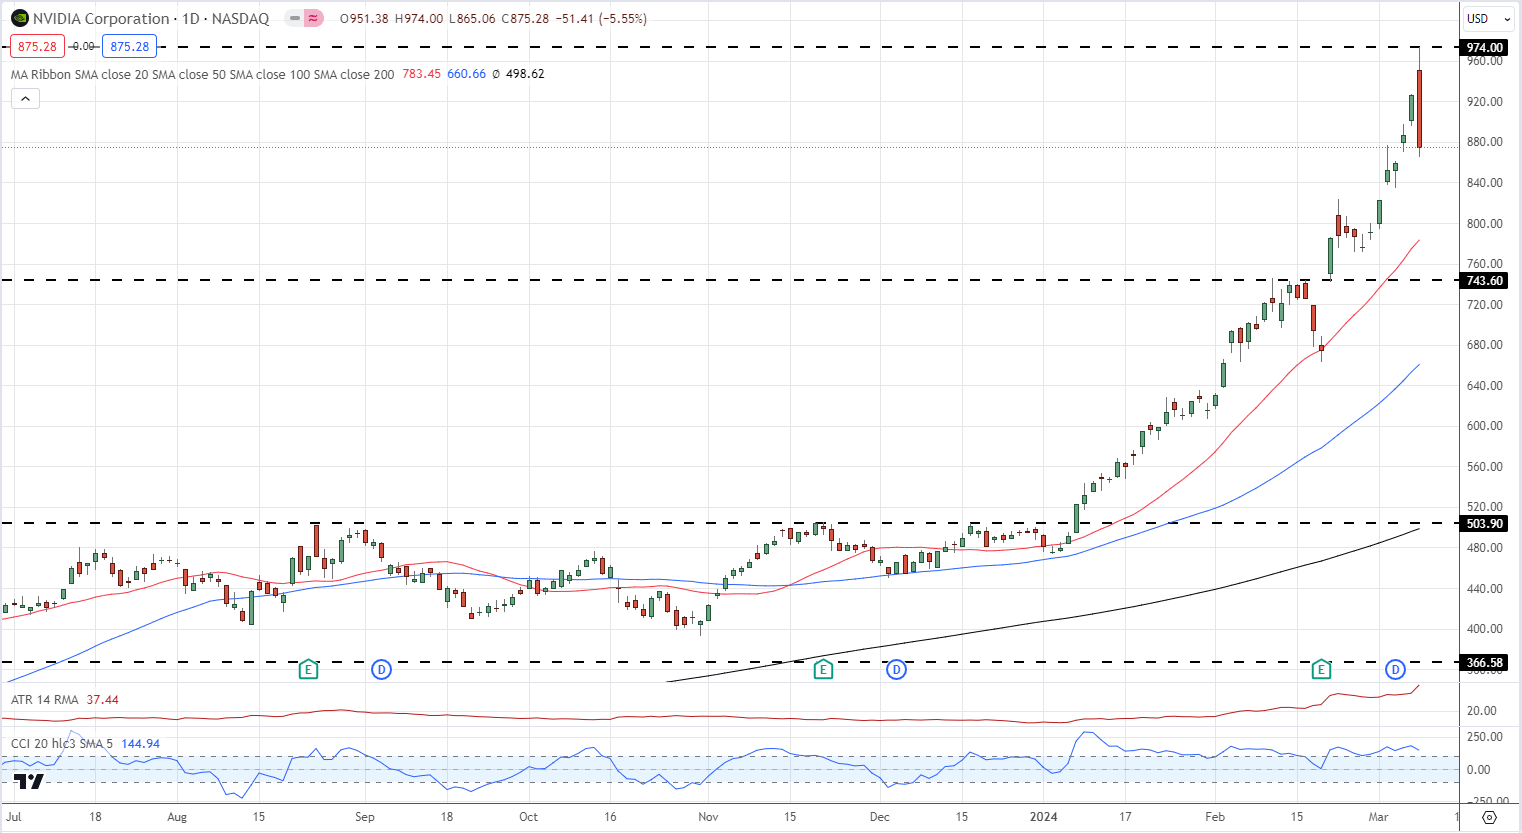
One company that bucked its recent bullish trend, Nvidia, turned sharply lower on Friday. Chip giant Nvidia is one of the largest quoted companies and has an oversized impact on various US indices. It will be worth following Nvidia next week to see if Friday’s move was an aberration.

Nvidia Daily Chart

image5.png


Gold Price Outlook – Rally Looks Set to Continue on Positive US Rate Cut Backdrop

Gold Price Outlook – Rally Looks Set to Continue on Positive US Rate Cut Backdrop

The daily gold price chart continues to move higher into fresh territory. While the CCI indicator shows gold as being overbought, the daily candle setup remains positive. Over the last six sessions, gold has opened at the day before’s closing price before steadily pushing higher, leaving it difficult for bullish traders who are looking for a short-term sell-off to enter the market. There may be a short-term period of consolidation, with $2,100/oz. and then $2,081/oz. looking solid support levels, but the path of least resistance for gold over the coming weeks looks higher.

Gold Daily Price Chart

image3.png

Retail trader data show 42.92% of traders are net-long with the ratio of traders short to long at 1.33 to 1.The number of traders net-long is 2.18% lower than yesterday and 6.78% lower from last week, while the number of traders net-short is 0.19% lower than yesterday and 45.36% higher from last week.

We typically take a contrarian view to crowd sentiment, and the fact traders are net-short suggests Gold prices may continue to rise.

US Dollar Forecast: US CPI to Spark Next Big Move – EUR/USD, USD/JPY, GBP/USD

US Dollar Forecast: US CPI to Spark Next Big Move – EUR/USD, USD/JPY, GBP/USD

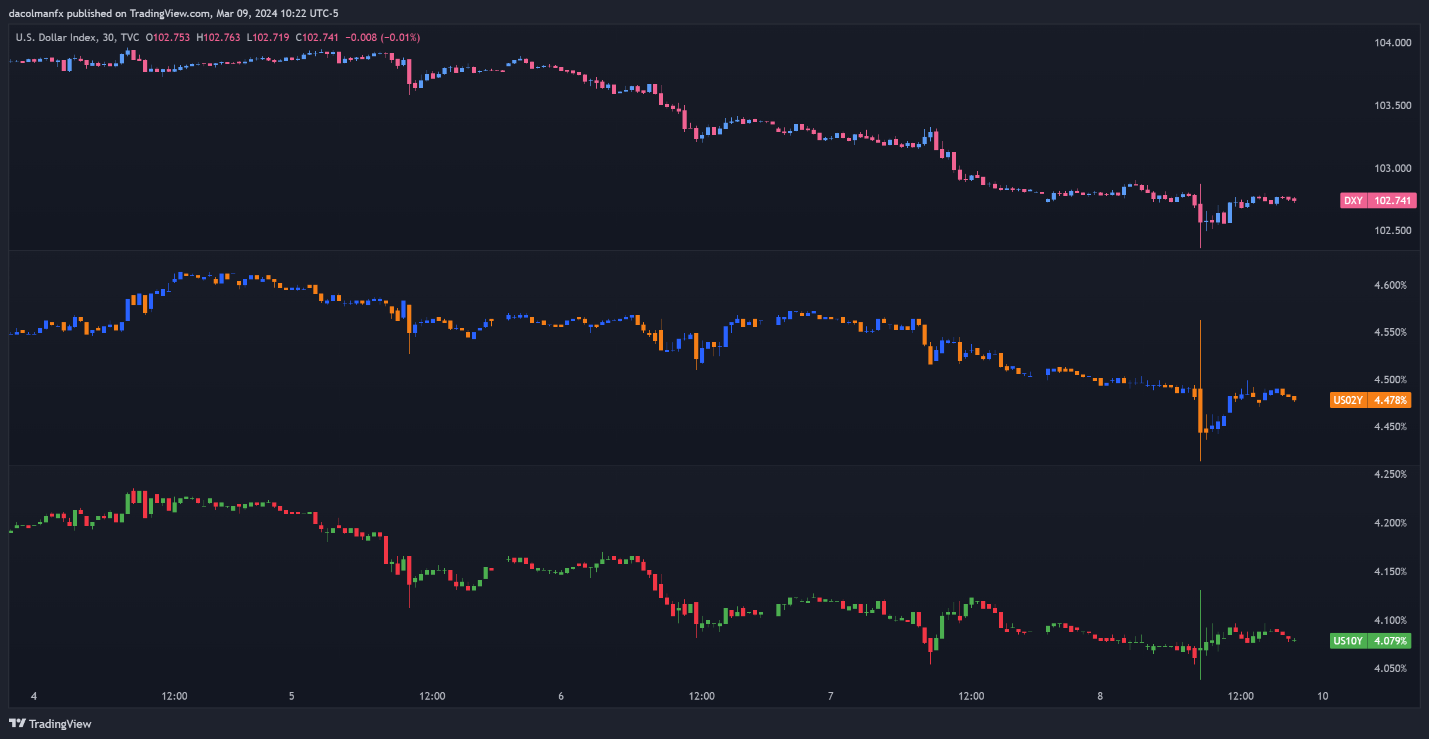
The U.S. dollar fell sharply last week, pressured by falling U.S. Treasury yields on growing expectations that the Federal Reserve may soon begin to reduce borrowing costs for the US economy. By the end of the week after all the twists and turns, the DXY index had plummeted by 1.10%, marking its worst weekly performance since early December.

US DOLLAR INDEX VS US BOND YIELDS

A screenshot of a graph  Description automatically generated

Source: TradingView

Although Fed Chairman Powell indicated that the central bank is not yet sufficiently assured that consumer prices are on a sustained path toward convergence to the 2.0% target to slash interest rates imminently, he also suggested that policymakers are “not far” from gaining greater confidence in the inflation outlook to finally pull the trigger.

Eager to discover what the future may have in store for the U.S. dollar? Find comprehensive answers in our quarterly forecast! Get it today!

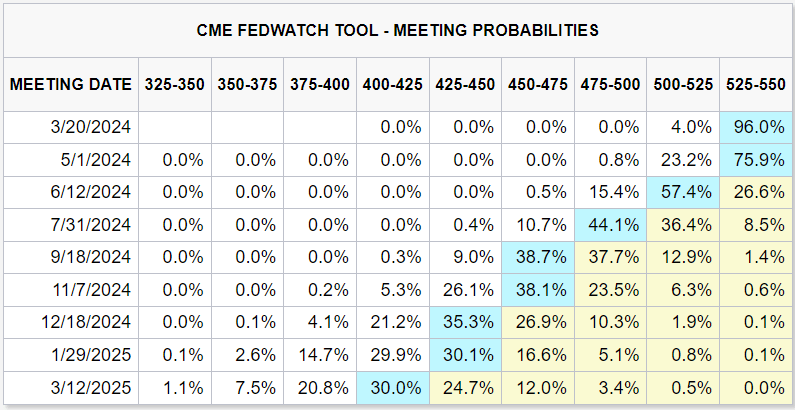
Powell’s remarks to Congress, coupled with mixed U.S. employment figures that revealed an unexpected uptick in the jobless rate to 3.9% in February, bolstered bets that the Fed could deliver its first cut of the cycle in June, raising the odds of this event to 57% on Friday from 52% two days earlier. The chart below shows current Fed meeting probabilities.

image2.png

Source: CME Group

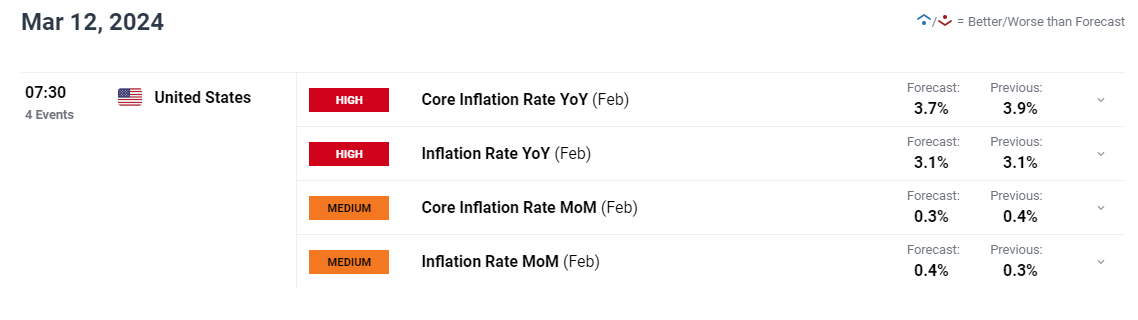
Looking ahead, while U.S. dollar bears have regained the upper hand, the tables could turn in the coming days. For example, if February’s US inflation data, to be released on Tuesday, beats consensus estimates by a wide margin, mirroring January’s upside surprise, the mood could change at the drop of a hat, allowing bulls to mount a comeback.

The following table provides an overview of Wall Street CPI forecasts as of Friday.

UPCOMING US INFLATION REPORT

image3.png

CPI numbers indicating minimal progress on disinflation should be bullish for the U.S. dollar, as it could spark a hawkish repricing of the Fed’s roadmap. This is because, in such a scenario, investors would expect the Fed to keep interest rates higher for longer, which would mean a delay in monetary policy easing.

Meanwhile, a subdued inflation report below consensus estimates should be bearish for the greenback. This would validate Wall Street’s dovish outlook, leading to an extension of the recent pullback in yields. Given the potential market impact of the upcoming consumer price index survey, traders should follow its release closely, paying particular attention to the trend in core metrics.

Want to know where EUR/USD is headed over the coming months? Explore all the insights available in our quarterly forecast. Request your complimentary guide today!

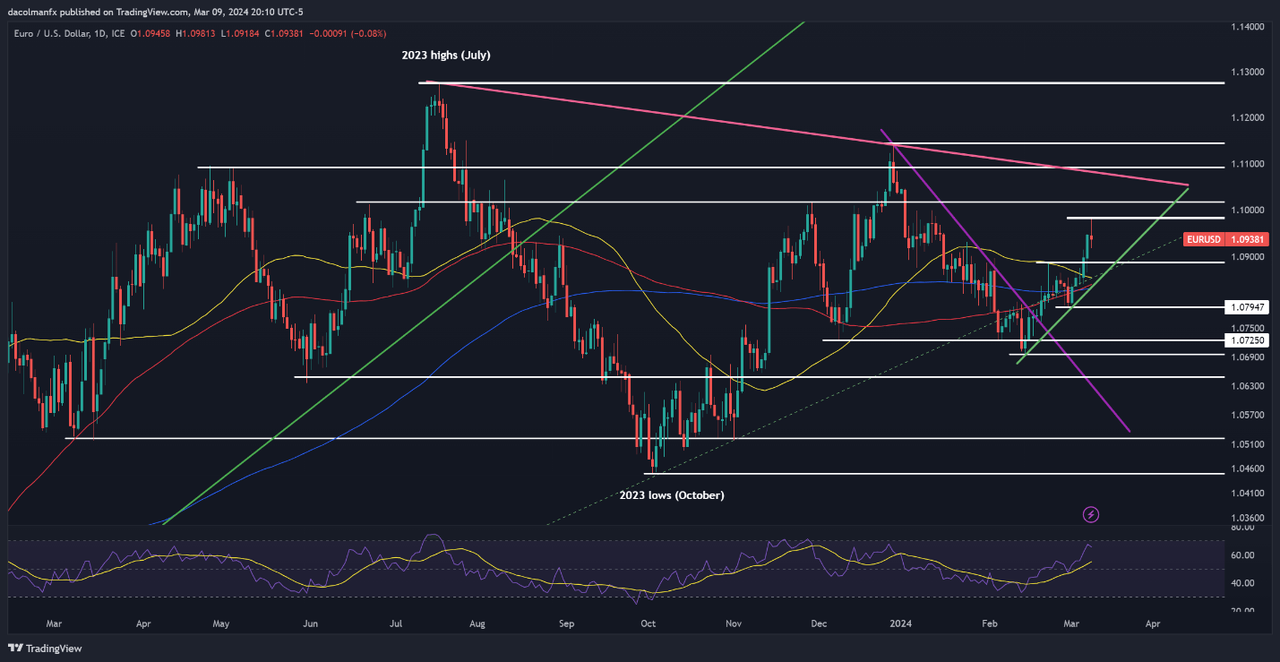
 EUR/USD FORECAST – TECHNICAL ANALYSIS

EUR/USD has rallied sharply in recent days, pushing past several important thresholds during the upswing. If gains pick up traction over the coming week, a key ceiling to monitor emerges at 1.0980, followed by 1.1020. Subsequent strength would then shift focus to trendline resistance at 1.1075.

Conversely, if sellers unexpectedly stage a comeback and drive prices lower, the first technical floor to keep an eye on is located at 1.0890. In the event of further losses beyond this point, the spotlight will be on confluence support at 1.0850 and 1.0790 thereafter.

USD/JPY FORECAST – TECHNICAL ANALYSIS

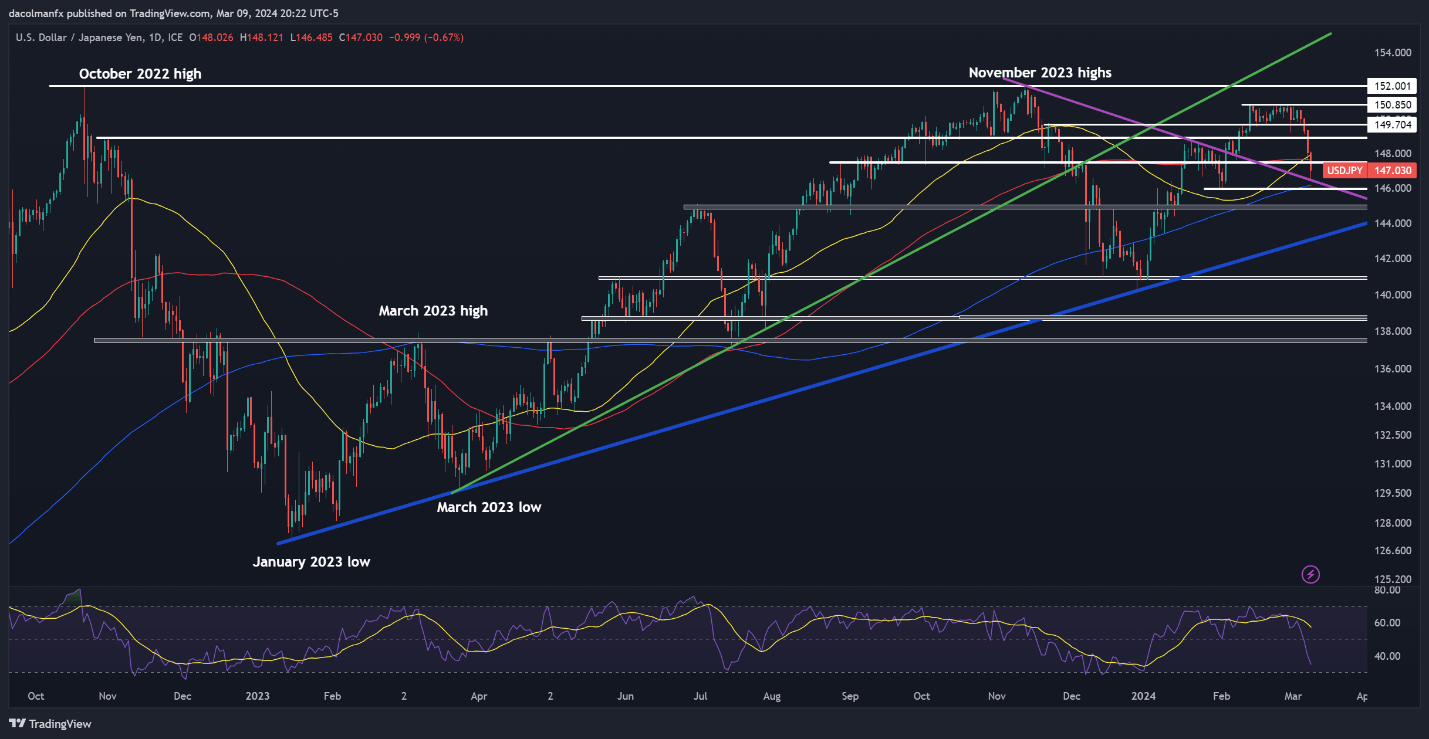
USD/JPY plummeted this week, slipping below 147.50 and closing at its lowest point since early February. If losses continue over the coming trading sessions, initial support appears at 146.50. Below this level, attention will be on the 200-day simple moving average slightly above the 146.00 mark.

On the other hand, if U.S. dollar bulls manage to trigger a rebound, resistance is anticipated around 147.50. Beyond that threshold, all eyes will be on 148.90. Looking higher, a further move to the upside could see market interest shift towards 149.70, followed by 150.90.

USD/JPY PRICE ACTION CHART

image5.png

Interested in learning how retail positioning can offer clues about GBP/USD’s directional bias? Our sentiment guide contains valuable insights into market psychology as a trend indicator. Download it now!

EUR/USD, GBP/USD, DXY Price Forecast: Biden’s Tax Plan & US NFP In Play

EUR/USD, GBP/USD, DXY Price Forecast: Biden’s Tax Plan & US NFP In Play

EUR/USD and GBP/USD Price Forecast: Analysis and Events Ahead

President Joe Biden’s State of the Union address, advocating for increased corporate taxes and more affordable healthcare and housing, sets a significant backdrop for traders. This comes as the forex market anticipates critical economic data releases that could impact currency valuations.

Events Ahead

  • In the U.S., key indicators to watch include Average Hourly Earnings (expected at 0.2%), Non-Farm Employment Change (forecasted at 198K against a previous 353K), and the Unemployment Rate (anticipated to remain steady at 3.7%). These figures will offer insights into the labor market’s health and potentially influence the Dollar Index.
  • For the Eurozone, German Industrial Production surprisingly increased by 1.0%, hinting at economic resilience. Further data points like the French Trade Balance (expected at -6.5B) and Revised GDP q/q (projected at 0.0%) will provide a clearer picture of the Eurozone’s economic condition.

US Dollar Index (DXY)

Dollar Index
Dollar IndexOn March 8, the Dollar Index remained steady at 102.778, with a pivot point at 102.906, acting as a crucial marker for determining the Index’s direction. It faces immediate resistance at 103.166, with subsequent levels at 103.428 and 103.634 potentially challenging upward movements.

Support is found at 102.517, with further buffers at 102.239 and 101.912 safeguarding against declines. The 50-Day and 200-Day Exponential Moving Averages, at 103.595 and 103.736 respectively, hint at underlying pressure, positioning the trend as bearish below the pivot.

EUR/USD Technical Forecast

EUR/USD Price Chart - Source: Tradingview
EUR/USD Price Chart – Source: Tradingview

GBP/USD Price Chart - Source: Tradingview
GBP/USD Price Chart – Source: TradingviewOn today’s date, the GBP/USD pair remained stable, marking a price of 1.28089. The technical analysis positions the pivot point at 1.2820, signaling a crucial juncture for future price action. Resistance levels are staged at 1.2857, 1.2893, and 1.2928, outlining potential hurdles for upward movement.

Conversely, the pair finds immediate support at 1.2785, with additional support levels at 1.2752 and 1.2712, serving as buffers against declines. The 50-Day and 200-Day Exponential Moving Averages, at 1.27069 and 1.26635 respectively, indicate a slight bullish inclination.

Nevertheless, the current sentiment suggests a bearish trend below 1.2820, with potential for a bullish shift upon breaking above this pivotal threshold.

Natural Gas and Oil Forecast: US-China Demand Spurs Energy Demand

Natural Gas and Oil Forecast: US-China Demand Spurs Energy Demand

Rising Demand and Federal Reserve’s Dovish Stance Fuel Oil Rally

Oil prices have surged, with demand spikes in key markets like the U.S. and China, and positive signals from the Federal Reserve on potential rate cuts bolstering the outlook. U.S. fuel inventories are declining sharply, hinting at robust demand, which may intensify as the American driving season approaches.

Meanwhile, China and India are showing increased oil consumption linked to strong industrial activities. However, this year’s demand growth in China may lag behind 2023’s surge. The softened stance of the Federal Reserve on interest rates, coupled with a weaker U.S. dollar, has also underpinned oil’s ascent.

Additionally, the temporary shutdown of TC Energy’s Keystone pipeline, which has since resumed, offered brief support to prices.

Natural Gas Price Forecast

NG Price Chart
NG Price ChartNatural Gas (NG) ticked down marginally to $1.85, registering a decline of 0.11%. Today’s trading positions the pivot point precisely at $1.85, suggesting a market at equilibrium but with potential for movement.

Resistance levels are pegged at $1.92, $1.98, and $2.06, each a test for the commodity’s upward momentum. Meanwhile, supports are established lower at $1.79, $1.73, and $1.68, where declines may find a floor.

The 50-Day and 200-Day Exponential Moving Averages stand at $1.91 and $1.99, respectively, indicating a slender bullish inclination above the current price. A sustained stance above $1.85 may continue the bullish narrative; conversely, slipping below could lead to accelerated selling pressure.

WTI Oil Price Forecast

WTI Price Chart
WTI Price Chart

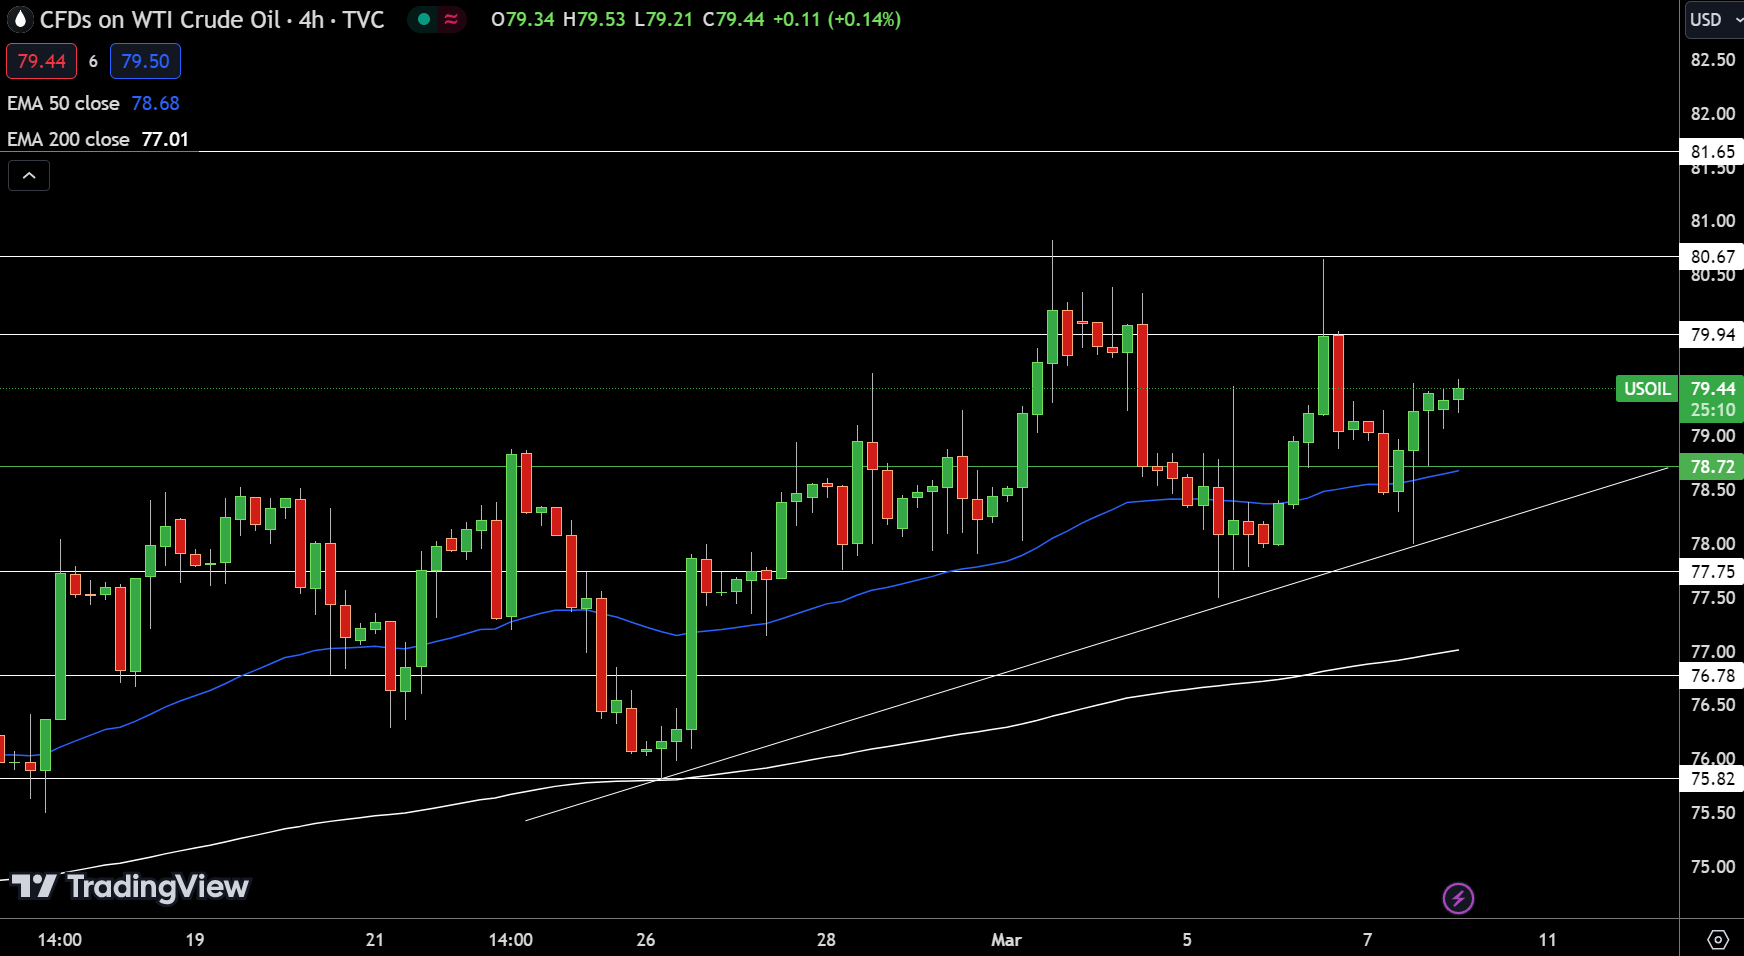
Technical indicators shed light on the market’s pulse: the 50-Day Exponential Moving Average (EMA) at $78.68 and the 200-Day EMA at $77.01 both suggest underlying buying interest, keeping the short-term trend cautiously bullish. In summary, USOIL’s trajectory remains bullish as long as it sustains above the $78.70 benchmark.

Brent Oil Price Forecast

UKOIL Price Chart
UKOIL Price Chart

Bitcoin (BTC) News Today: Return to $69,000 Hinged on US Job and Flow Data

Bitcoin (BTC) News Today: Return to $69,000 Hinged on US Job and Flow Data

Grayscale Bitcoin Fund Outflows Continued Downtrend

On Thursday, BTC advanced by 1.21%. After gaining 3.66% on Wednesday, BTC closed the session at $66,975.

BTC-spot ETF market flows contributed to the session gains. Significantly, Grayscale Bitcoin Fund (GBTC) saw net outflows fall from $332.5 million (March 5) to $276.2 million (March 6), according to figures from BitMEX Research. Outflows trended downwards for the fourth consecutive session from $598.9 million on February 29.

iShares Bitcoin Trust (IBIT) continued to lead the way on March 6, with net inflows of $281.7 million. Fidelity Wise Origin Bitcoin Fund (FBTC) saw net inflows of $205.7 million. Notably, there were no net outflows across the Nine for the first time since February 27. However, total net inflows fell from $684.4 million (March 5) to $332.1 million (March 6).

BTC-Spot ETFs on Target for Four Consecutive Days of Net Inflows

According to Farside Investors, GBTC saw net outflows increase to $374.8 million on March 7. Excluding flow data for IBIT and FBTC, BTC-spot ETF market net outflows stood at $290.3 million for March 7 early in the Friday session.

Another positive session of net inflows for IBIT and FBTC would deliver a fourth consecutive session of total net inflows for the BTC-spot ETF market.

Positive flow trends continue to support BTC at current price levels.

Bets on a June Fed Rate Cut Contribute to Recent Gains

On Thursday, the Nasdaq Composite Index rallied 1.51%. Rising bets on a June Fed rate cut supported buyer demand for riskier assets. Hopes of an H1 2024 Fed rate cut contributed to gains for BTC and the broader crypto market.

Fed Chair Powell delivered a second day of testimony on Thursday, fueling investor bets on an H1 2024 Fed rate cut. The Fed Chair stuck to the Wednesday script, saying rate cuts were likely later in the year. The US Jobs Report is out later today and could influence near-term BTC price trends if the BTC-spot ETF market sees net outflows on Thursday (March 7).

The total crypto market cap increased by 1.63%, ending the Thursday session at $2,466 billion. However, dogecoin (DOGE) and shiba inu (SHIB) saw further losses. DOGE fell by 0.06%, with SHIB ending the session down 5.20%. Investors continued to lock in profits after hitting highs on Tuesday (March 5).

BTC Daily Chart sends bullish price signals.
BTCUSD 080324 Daily Chart

Ethereum Analysis

ETH remained well above the 50-day and 200-day EMAs, affirming bullish price signals.

An ETH break above the Friday high of $3,943 would support a move to the $4,000 handle.

ETH-spot ETF-related chatter also needs consideration.

However, an ETH drop below the $3,800 handle would bring the $3,683 support level into view.

The 14-period Daily RSI, at 84.95, shows ETH in overbought territory. Selling pressure could intensify at the Friday high of $3,943.

ETH Daily Chart sends bullish price signals.
ETHUSD 080324 Daily Chart