UK Inflation Falls to a Two-Year Low, GBP/USD Stable, All Eyes on the Fed

UK Inflation Falls to a Two-Year Low, GBP/USD Stable, All Eyes on the Fed

According to the latest Office for National Statistics data, UK inflation fell faster than expected in February, pushed lower by falling food prices. Headline inflation fell to 3.4%, down from 4% in January and marginally lower than market forecasts of 3.5%, while core inflation fell to 4.5%, down from 5.1% and a fraction below market estimates of 4.6%. Good news for the Bank of England as it continues to bring price pressures down to 2%.

image1.png

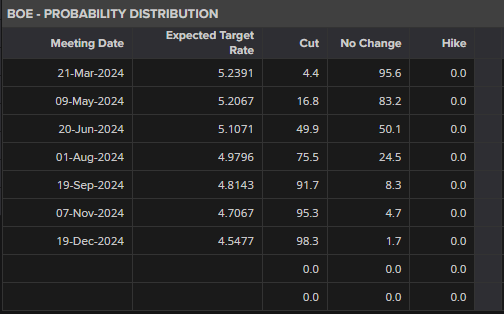
The Bank of England is fully expected to leave interest rates untouched tomorrow at its latest MPC meeting, although today’s data will encourage the more dovish BoE members to press harder for a rate cut. Financial markets are fully pricing in the first move in the UK Bank Rate at the August meeting, although the probabilities of a cut at the June meeting have risen slightly post-inflation data to around 50%.

image2.png

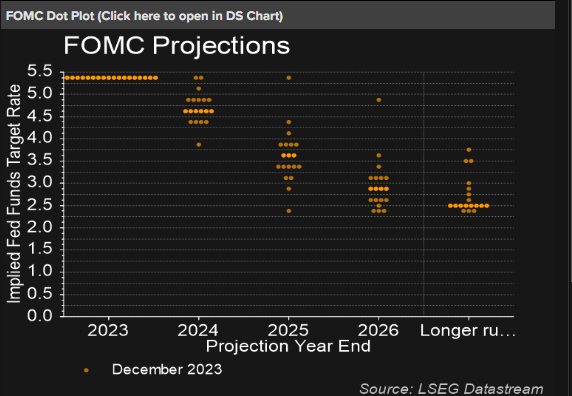
Later today – 18:00 UK – the Federal Reserve will announce their latest monetary policy decision with the US central bank fully expected to leave all policy settings untouched. Chair Powell will also announce the latest dot plot, a visualization of Fed members’ thoughts on future interest rate levels. The current FOMC projections are centered around 4.625%, suggesting three 25 basis points this year. The new dot plot and Chair Powell’s commentary will be key for the US dollar going forward.

image3.png

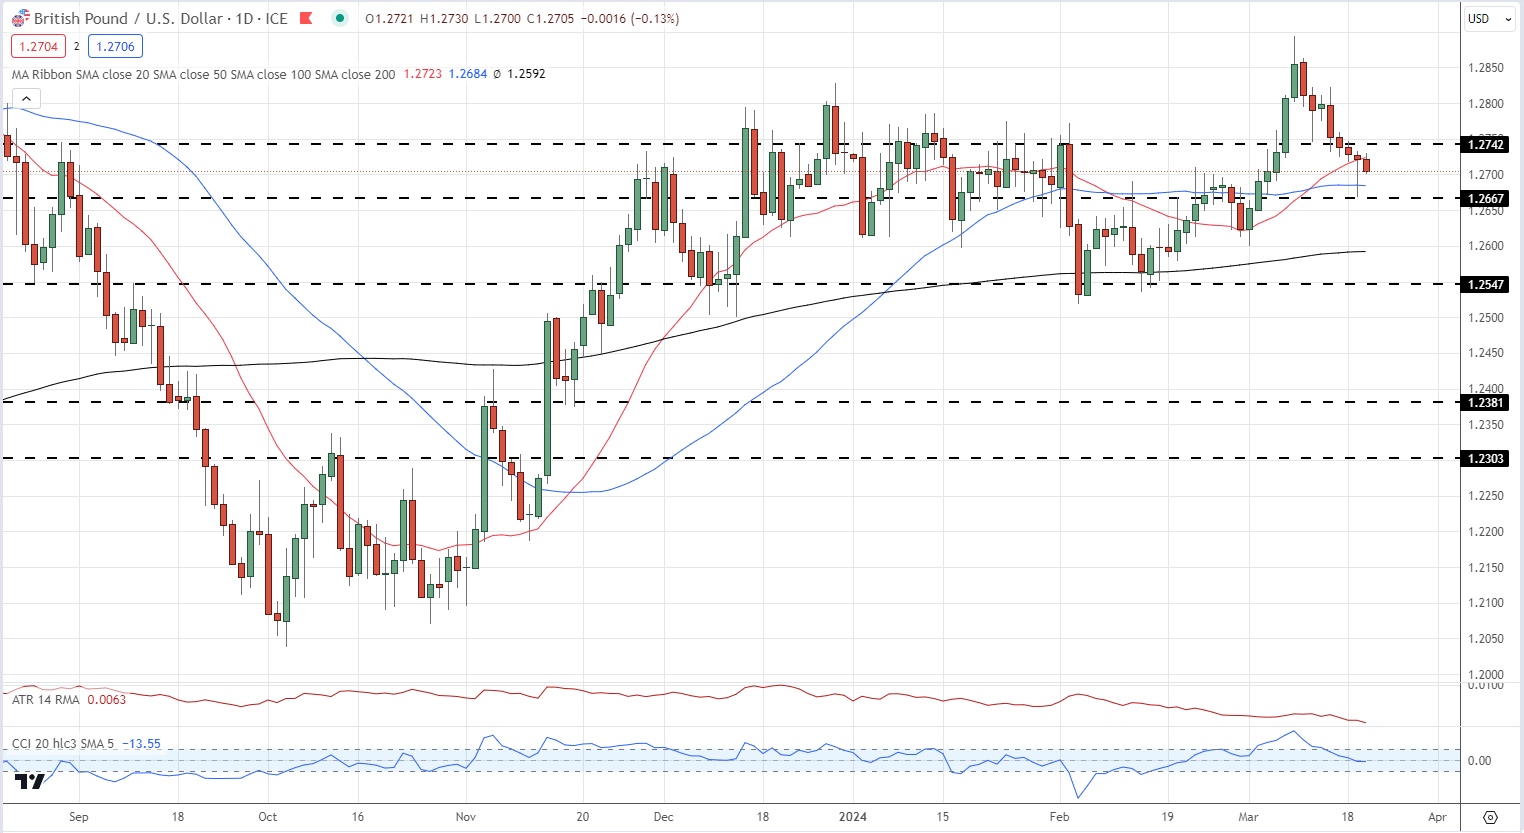
GBP/USD has drifted marginally lower post-data but remains in thrall of today’s Fed decision. Cable is clinging on to the 1.2700 level at the moment but any US dollar strength could see GBP/USD test 1.2667 ahead of this evening’s announcement. Currently 1.2742 acts as first resistance.

GBP/USD Daily Price Chart

image4.png

IG Retail data shows 52.58% of traders are net-long with the ratio of traders long to short at 1.11 to 1.The number of traders net-long is 1.55% lower than yesterday and 22.23% higher than last week, while the number of traders net-short is 3.04% higher than yesterday and 21.02% lower than last week.

We typically take a contrarian view to crowd sentiment, and the fact traders are net-long suggests GBP/USD prices may continue to fall.

Fed Seen Holding Rates Steady; Policy Outlook to Drive Markets, US Dollar

Fed Seen Holding Rates Steady; Policy Outlook to Drive Markets, US Dollar

The Federal Reserve will release its March monetary policy announcement on Wednesday. Consensus estimates overwhelmingly suggest that the institution led by Jerome Powell will hold its benchmark rate unchanged at its current 5.25% to 5.50% range, effectively maintaining the status quo for the fifth consecutive meeting. Moreover, analysts widely anticipate that the central bank will keep its quantitative tightening program intact for now, continuing to reduce its bond holdings gradually.

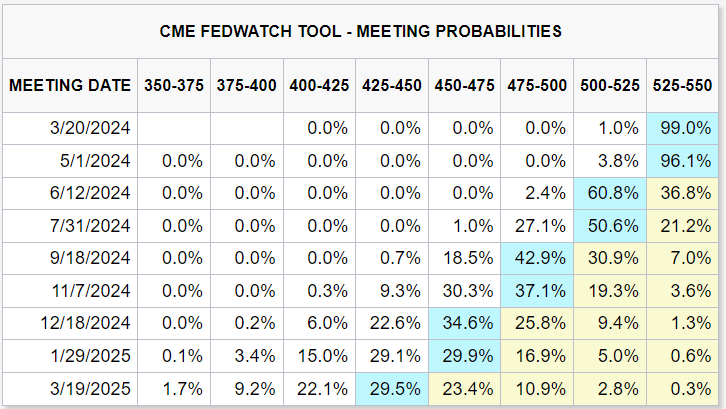
While the decision on interest rates themselves may not deliver dramatic surprises, markets will be laser-focused on the forward guidance. With that in mind, the FOMC may repeat that it does not expect it will be appropriate to reduce borrowing costs until it has gained greater confidence that inflation is converging sustainably toward 2 percent – a move that would indicate more evidence on disinflation is needed before pulling the trigger. Current FOMC meeting probabilities are shown below.

image1.png

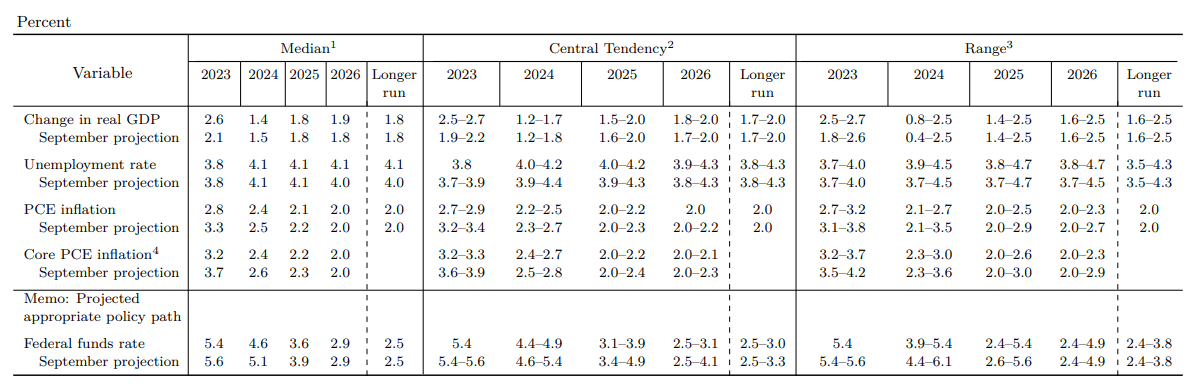
In terms of macroeconomic projections, the Fed is likely to mark up its gross domestic product and core PCE deflator forecasts for the year, reflecting economic resilience and sticky price pressures evidenced by the last two CPI and PPI reports. The revised outlook could compel policymakers to signal less monetary policy easing over the medium term, potentially scaling back the three rate cuts initially envisioned for 2024 to only two (this information will be available in the dot plot).

The following table shows projections from the December FOMC meeting.

For a complete overview of the U.S. dollar’s technical and fundamental outlook, grab a copy of our free quarterly forecast!

image2.png

Source: Federal Reserve

If the Federal Reserve signals a greater inclination to exercise patience before removing policy restraint and shows less willingness to deliver multiple rate cuts, we could see U.S. Treasury yields and the U.S. dollar charge upwards in the near term, extending their recent rebound. Meanwhile, stocks and gold, which have rallied strongly recently on the assumption that the central bank was on the cusp of pivoting to a looser stance, could be in for a rude awakening (bearish correction).

The Federal Reserve Bank: A Forex Trader’s Guide

The Federal Reserve Bank: A Forex Trader’s Guide

The Federal Reserve System (the Fed) was founded in 1913 by the United States Congress. The Fed’s actions and policies have a major impact on currency value, affecting many trades involving the US Dollar. Find out about the history of the Fed, its influence on USD and how to trade Fed monetary policy decisions.

The US Federal Reserve Bank

What is the Federal Reserve?

The Federal Reserve is the central bank of the United States. It was founded to create a stable, flexible monetary and financial system for the nation. Its general duties are to set monetary policy and oversee effective economic operation, ultimately serving the public interest.

To meet these top-level directives, the Fed performs five general functions:

  1. Promote maximum employment, stable pricing and moderate interest rates long term
  2. Reduce risk where possible to create a stable financial system
  3. Develop safety within financial institutions
  4. Champion safety within payment and settlement systems
  5. Advocate consumer protection through a supervisory stance.

To execute day-to-day operations, the nation is divided up into 12 Federal Reserve Districts, each of which is served by a separately incorporated Reserve Bank. These districts and member banks operate independently while being supervised by the Federal Reserve Board of Governors.

Who owns the Fed?

The Fed is both a private and public institution. The Board of Governors is a government agency, while the banks themselves are structured like private corporations – member banks hold stock and earn dividends.

Who is the Federal Reserve chairman?

As of August 2019, the chairman of the Federal Reserve is Jerome Powell, who has served in this office since February 5, 2018. He is the 16th person to have held the position and will serve a four-year term. Before his appointment, Mr Powell served as a member of the Board of Governors from May 25, 2012. He also currently serves as Chairman of the Federal Open Market Committee, which looks after monetary policy.

Which banks make up the Fed?

The 12 Federal Reserve Districts, each with their own Reserve Bank, are:

  • Boston
  • New York
  • Philadelphia
  • Cleveland
  • Richmond
  • Atlanta
  • Chicago
  • St. Louis
  • Minneapolis
  • Kansas
  • Dallas
  • San Francisco

How is the Fed held accountable to its functions?

The Fed is accountable to the public, as well as to the US Congress. The Chair and Federal Reserve officials testify in front of Congress, while the system of setting monetary policy is designed to be clear and transparent. In the interests of accountability, the Federal Open Market Committee (FOMC) will publish statements following all annual meetings. All financial statements are audited independently once a year to ensure financial accountability as well.

Key Economic Mandates of the Federal Reserve System

US monetary policy is the core mandate of the Federal Reserve bank. The statutory objectives of this monetary policy are outlined by the Congress and are:

  • Maximum employment: The monetary policy set out by theFOMC should ensure unemployment remains low, working to boost the economy where needed so that businesses thrive, make a profit and hire more staff to grow
  • Price stability: The Fed defines price stability as an inflation rate of 2% in the long term
  • Moderate long-term interest rates: This works alongside price stability – when an economy is stable, long-term interest rates remain at a moderate level

The Fed aims to achieve its monetary policy through its influence over interest rates and the general financial climate. This can lead to volatility of the US Dollar, ahead of Fed announcements and changes to policies.

Federal Open Market Committee

Monetary policy is set by the Federal Open Market Committee (FOMC), which oversees the open market operations of the Federal Reserve System. They set a target for the federal funds rate at FOMC meetings; this is the interest rate that they want banks to offer to each other for overnight loans. While the FOMC doesn’t control the rate, it can influence it in three main ways:

  • Open market operations. This means the buying and selling of government bonds on the open market – selling bonds decreases monetary supply with the aim of increasing interest rates. Buying bonds puts money back into the economy, with the aim of decreasing interest rates
  • Discount rate. This is the rate that banks pay to borrow money from the Fed. When this rate is lower, then it is also more likely the federal funds rate will be lower too
  • Reserve requirements. Banks need to hold a certain percentage of customers’ deposits to cover withdrawals – this is the reserve requirement. When these are raised, banks can’t loan as much money and must ask for higher interest rates. When lowered, banks can loan more money and ask for lower interest rates.

How Does the Federal Funds Rate Affect the US Dollar?

The Fed’s interest rate, also known as the Fed funds rate, is set by the Board of Governors of the Federal Reserve System. The current interest rate and the expectations of future interest rate changes can both affect the value of the US Dollar. If traders anticipate a change in interest rates based on announcements from the Board of Governors, this can cause the Dollar to appreciate or depreciate in value against other currencies.

This table sets out the way in which market expectations and rate changes can affect the value of the dollar:

Market expectations Actual Results Resulting FX Impact
Rate Hike Rate Hold Depreciation of currency
Rate Cut Rate Hold Appreciation of currency
Rate Hold Rate Hike Appreciation of currency
Rate Hold Rate Cut Depreciation of currency

Find out more about the impact of interest rates on the foreign exchange market.

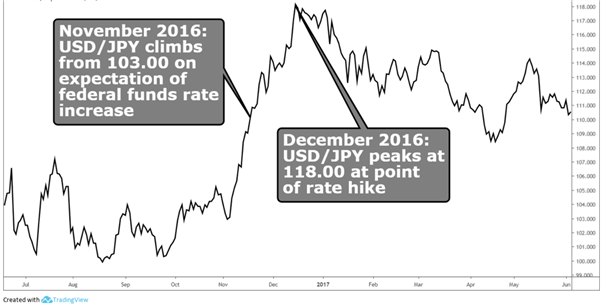
As you can see in the chart below, the Dollar strengthened against the Yen in the leadup to the Fed’s interest rate announcement in December 2016 because it was widely expected that the fed funds rate would increase. The pair peaked at around 118.371 on the day of the announcement, December 14, 2016.

USD/JPY chart before and after Fed hikes in 2016

Chart to show the impact of Fed hikes on USD/JPY

How to Trade the Fed Monetary Policy Decisions

In order to prepare for Fed rate change decisions, traders should follow these two key steps:

  1. Keep up with news from the Fed. The FOMC holds eight regular meetings a year, where policies and interest rates are discussed and agreed upon. Keeping up with news ahead of these meetings is the best way to make predictions about interest rates, and whether to buy or sell the US dollar
  2. Keep with news from the markets. Rest assured that it won’t just be you speculating on interest rates – ahead of Federal Reserve meetings and announcements, many forex traders will be watching what happens very closely. Keep an eye out for others’ predictions and forecasts, and stay well informed enough that you can have your own opinions and add your own logic to that of others

No method of predicting interest rate decisions can ever be completely accurate and surprises do occur. It’s always important to protect yourself when trading forex, so make sure you place stops in advance to ensure you keep your losses to a minimum should the markets move against you.

Remember to stick to your trading plan and never place a trade where you wouldn’t be able to afford the losses. Trades can go both ways. No matter how sure you feel that they will work in your favour, there’s always the chance that they might not.

What is Leverage in Forex? Forex Leverage Explained

What is Leverage in Forex? Forex Leverage Explained

Many people are attracted to forex trading due to the amount of leverage that brokers provide. Leverage allows traders to gain more exposure in financial markets than what they are required to pay for. Traders of all levels should have a solid grasp of what forex leverage is and how to use it responsibly. This article explains forex leverage in depth, including how it differs to leverage in stocks, and the importance of risk management.

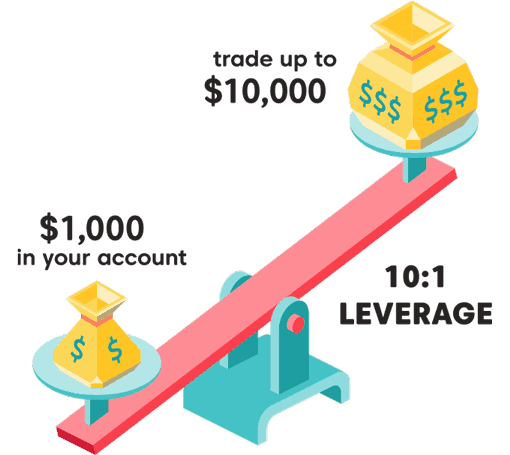
Leverage in forex fulchrum example showing margin and full trade size

What is leverage in forex trading?

Leverage in forex is a useful financial tool that allows traders to increase their market exposure beyond the initial investment (deposit). This means a trader can enter a position for $10,000 worth of currency and only need $1000, in a ten-to-one leverage scenario. However, it is essential to know that gains AND losses are magnified with the use of leverage. In adverse market scenarios, a trader using leverage might even lose more money than they have as deposit.

Leverage of ten-to-one means that traders can gain exposure to a notional value or trade size, ten times more than the deposit/margin that is required to fund the trade. This can be thought of in a similar fashion to putting a 10% deposit down on a house; you gain access to the entire house while only funding 10%of the full value.

Leverage is usually expressed as a ratio:

Leverage expressed in words Leverage expressed as a ratio
Ten-to-one 10:1
Thirty-to-one 30:1
Fifty-to-one 50:1

The amount of forex leverage available to traders is usually made available through your broker and the amount of leverage will vary according to regulatory standards that preside in different regions.

Leverage in forex vs leverage in shares

Forex leverage differs to the amount of leverage that is offered when trading shares. This is due to the fact that the major FX pairs are liquid and typically exhibit less volatility than even the most frequently traded shares. As a result, hedging risk and getting in and out of trades is more manageable in the $5.1 trillion a day FX market.

How is forex leverage calculated?

Traders require the following to calculate leverage:

  • The notional value of the trade (trade size)
  • The margin percentage

Brokers often provide traders with a margin percentage to calculate the minimum equity needed to fund the trade. Margin and deposit can be used interchangeably. Once you have the margin percentage, simply multiply this with the trade size to find the amount of equity needed to place the trade.

Equity = margin percentage x trade size

To calculate leverage, simply divide the trade size by the required equity.

Leverage = trade size/ equity

Forex leverage example

Below is a typical example of how to calculate leverage using the above formulas:

  • Trade size: 10 000 units of currency (one mini contract on USD/JPY with a trade size equal to $10 000)
  • Margin percentage: 10%

Equity = margin percentage x trade size

0.1 x $10 000

=$1 000

Leverage = trade size/ equity

$10 000 / $1 000

= 10 times or 10:1

The example highlights the basics of how forex leverage is used when entering a trade. However, it must be noted that traders should not simply calculate the minimum amount needed to enter a trade and then fund the account with that exact amount. Traders must be mindful of margin calls if the position moves in the opposite direction, bringing the account equity below an acceptable level determined by the broker.

Trading forex with leverage has the potential to produce large losses. We have calculated a typical scenario of how the use of excessive leverage can impact a trading account and tabulated the results.

 How to manage forex leverage risk

Leverage can be described as a two-edged sword, providing both positive and negative outcomes for forex traders. This is why it is essential to determine the appropriate effective leverage and incorporate sound risk management.

Top traders make use of stops to limit their downside risk when trading forex. At DailyFX we recommend risking no more than 1% of the account equity on any single trade and no more than 5% of the account equity for all open trades at any point in time.


Bank of Japan Exits Negative Interest Rate Policy but Remains Supportive

Bank of Japan Exits Negative Interest Rate Policy but Remains Supportive

BoJ’s Hawkish Actions Accompanied by Dovish Rhetoric

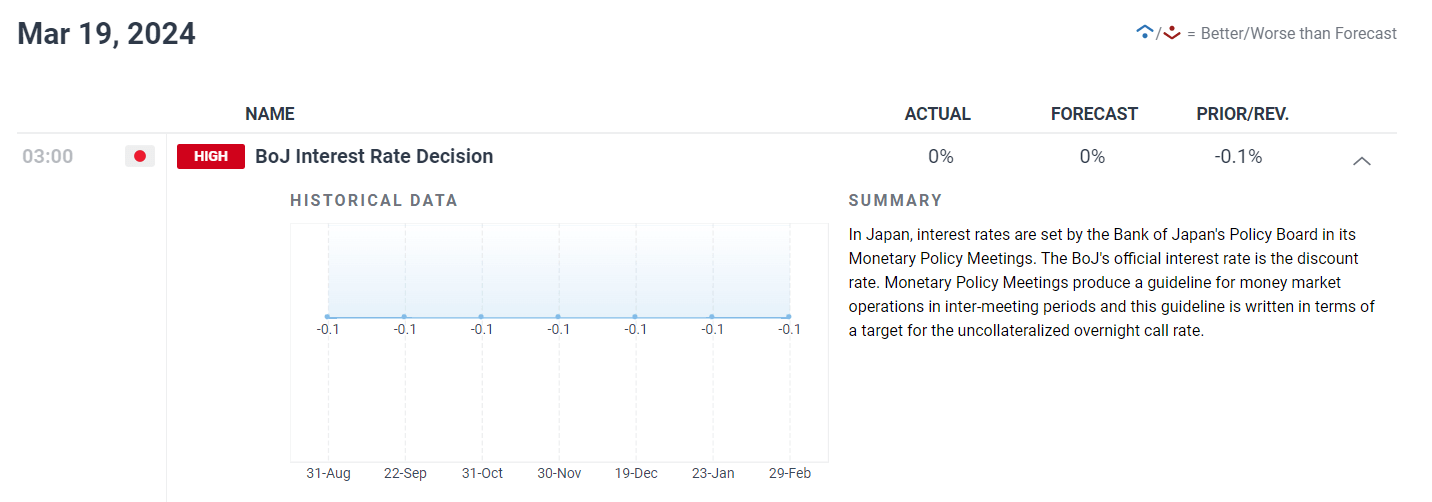
The Bank of Japan (BoJ) voted to raise the benchmark interest rate into the 0% – 0.1% range in a historic move that marks the end of the Bank’s negative interest rate policy which was implemented to combat deflation that plagued the nation for years. The move sees the policy rate up into positive territory after 8 years and marks the first rate hike in 17 years.

In the lead up to the meeting, the market assigned a 44% chance of a hike, with greater conviction of a hike materializing in April, which meant the hike came as a slight surprise. Moments before the announcement, Nikkei Asia ‘leaked’ the upcoming decision to hike and end to yield curve control (YCC), agency proving to be a reliable source for recent BoJ policy decisions.

image1.png

Customize and filter live economic data via our DailyFX economic calendar

Learn how to prepare and setup for major news or data releases that have the potential to move markets:

Japanese (10-year) government bond yields ease as BoJ Vows to continue purchases

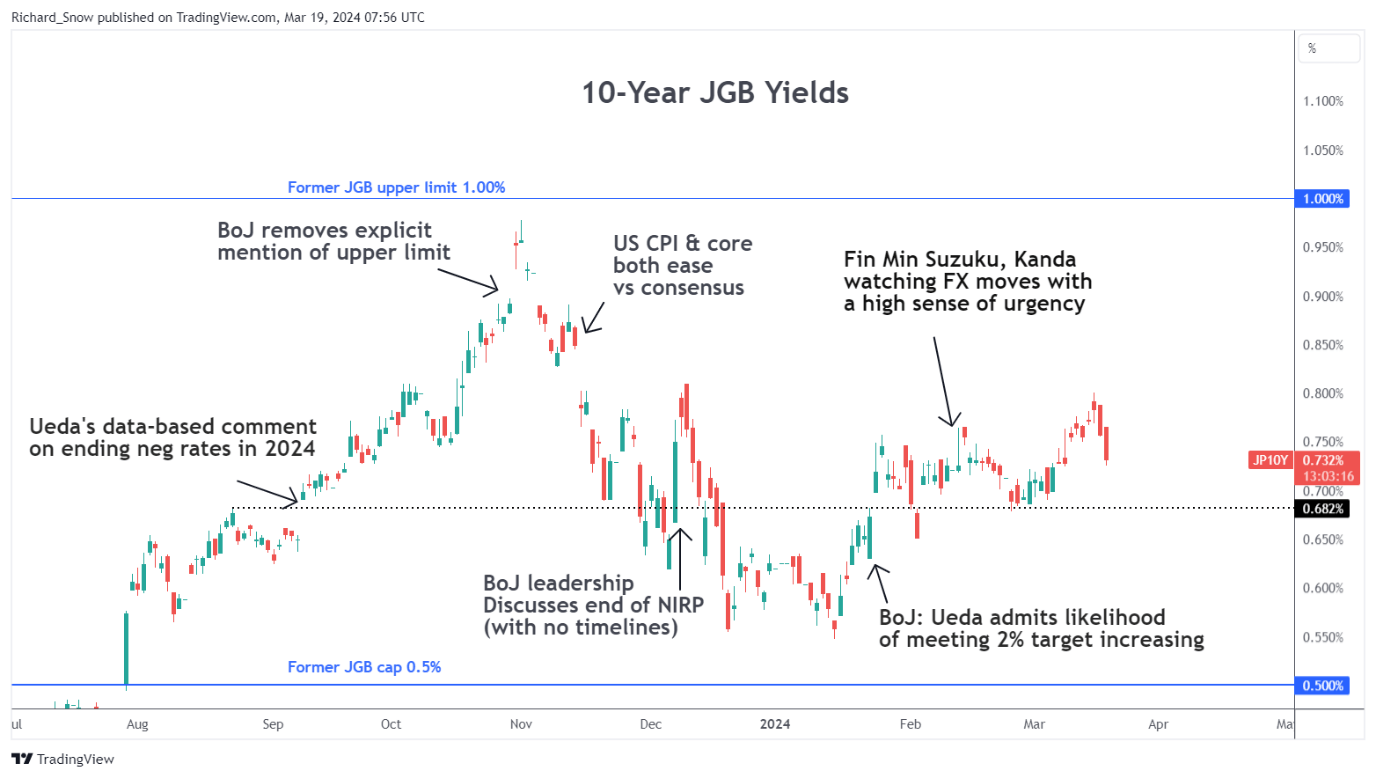
Alongside the rate hike, the BoJ has removed the official target for 10-year Japanese government bonds but stressed it will maintain purchases around the same level as before to maintain an orderly market (contain any potential blowout in borrowing costs for the Japanese government). The immediate effect of the announcement brought about a further decline in yields, which didn’t help the yen.

10-Year Japanese Government Bonds (Daily)

image2.png

Learn how to approach USD/JPY currency trading, understanding the fundamental considerations every trade should know:

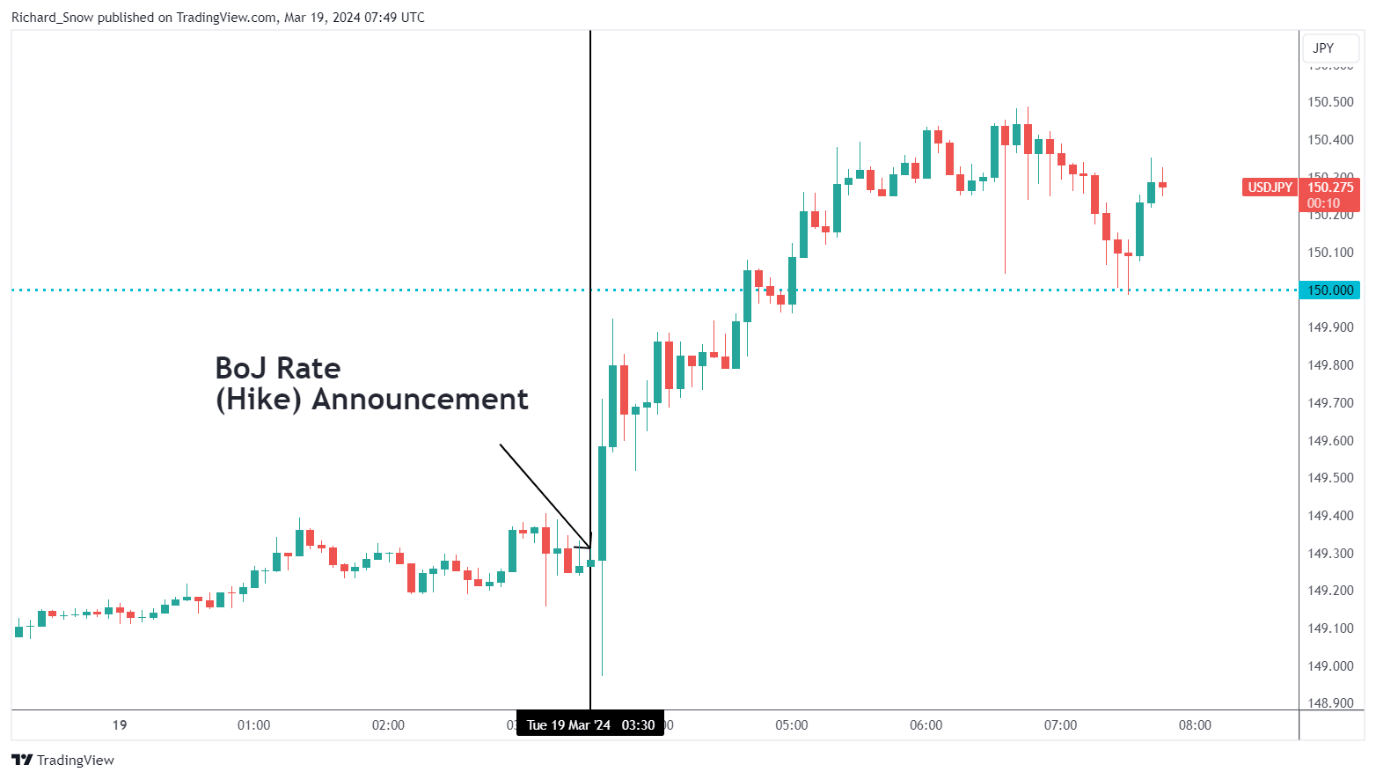
Yen depreciated further after the announcement – USD/JPY back above 150.00

USD/JPY continued the move higher as the yen came under pressure in the moments following the BoJ announcement. Typically, a surprise rate hike lifts the local currency but the lack of forward guidance around subsequent rate hikes meant that interest rate differentials are likely to work against the yen in a low volatility environment – favouring a continuation of the carry trade.

The US dollar is also helping the rally as markets now anticipate a July rate cut instead of June. This has come as a result of hotter-than-expected inflation data (in some form or another) since December and rising energy prices (oil and natural gas).

When asked about future hikes the Bank of Japan Governor Ueda mentioned that the April forecasts will shed more light on that and later on he spoke about the need to witness the right conditions in order to continue raising interest rates.

USD/JPY 5-Min Chart

image3.png

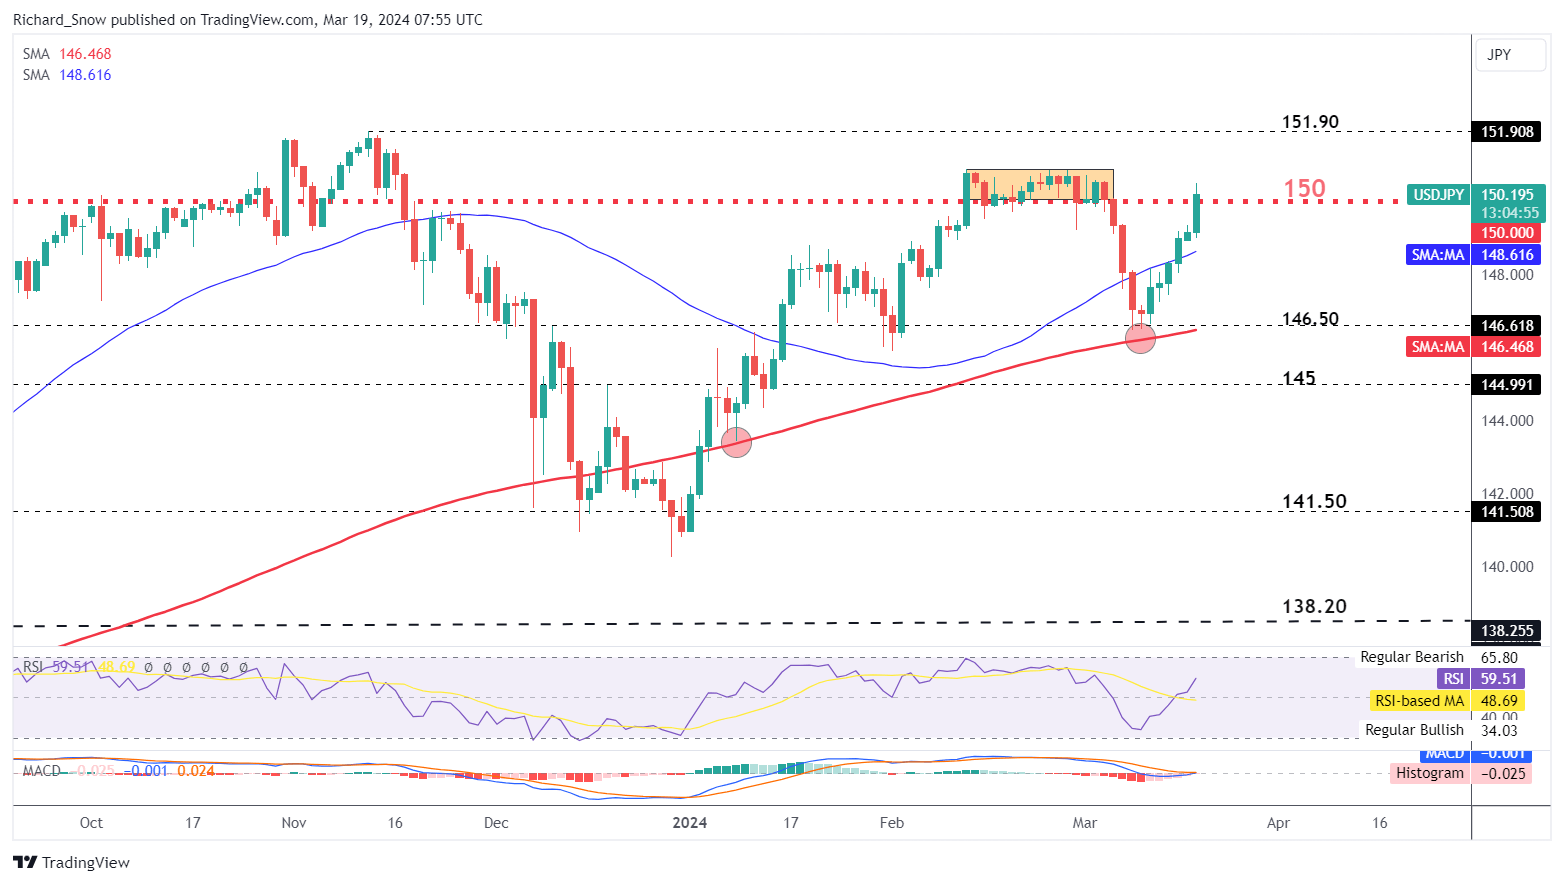
The daily USD/JPY chart shows the large green candle rising above the 150 marker once again, to the dissatisfaction of the Japanese finance ministry which has previously voiced its dissatisfaction with yen depreciation around similar levels.

In the absence of a more hawkish BoJ and while fundamentals continue to support the dollar, USD/JPY may continue to rise further with 151.90 the next level of consideration. A positive carry trade, low volatility and markets delaying the start of rate cuts in the US continues to support the bullish move in the pair.

USD/JPY Daily Chart

image4.png


Trading the Gold-Silver Ratio: Strategies and Tips

Trading the Gold-Silver Ratio: Strategies and Tips

WHAT IS THE GOLD-SILVER RATIO?

The gold-silver ratio is simple. It is the number of silver ounces you would need to trade to receive one ounce of gold at current market prices. For example, when gold price is trading at $1000 per ounce and silver price is trading at $16.67 per ounce the gold-silver ratio will be equivalent to 60.

  • The gold to silver ratio has averaged around 60 from 2001 to 2017. With highs breaching 80 (ounces of silver to one ounce of gold) and lows sinking to around 40.
  • The ratio tends to increase during times of economic distress. The cause of this relationship is due to gold generally outperforming silver during recessions, leading to increases in the ratio.
  • The ratio peaked at 100 in 1991 when silver prices dropped to extreme lows.

OW THE GOLD-SILVER RATIO WORKS

  • When the gold price increases faster than the silver price the ratio will increase .
  • When the silver price increases faster than the gold price the ratio will decrease .
  • When the gold price decreases faster than the silver price the ratio will decrease.
  • When the silver price decreases faster than the gold price the ratio will increase.

Source: Bloomberg data

The graph above shows the gold to silver ratio for the past several decades. In 1991 silver was trading at extremely low prices- causing a peak in the gold-silver ratio, denoted by the blue circle in the graph above.

It is also worth noting the spike in the ratio during the 2008 subprime-mortgage crisis, caused by surging gold prices and silver not performing as well. This is denoted by the red circle in the graph above.

HOW TO TRADE THE GOLD-SILVER RATIO

There are many ways to use the ratio to your advantage. Keep reading for the top two strategies on trading the gold-silver ratio.

1) USING THE GOLD-SILVER RATIO TO DETERMINE THE METAL WITH THE STRONGEST TREND AND TRADE IT:

Traders can use the gold-silver ratio to determine which metal may outperform the other and then place a trade accordingly.

A trader could use these five steps to enter a trade on either gold or silver using the ratio:

1) Determine the trend on a gold-silver ratio chart by adding trend lines to the chart. You can use DailyFX’s chart to view the gold-silver ratio by entering “XAUUSD/XAGUSD” in the search bar.

2) Using the time-frame of your choice, determine the trend on gold and silver individually.

3) Use this table to help you determine a bias:

GOLD-SILVER RATIO TREND GOLD AND SILVER TREND SIGNAL
Gold-Silver RatioUptrend Gold and silver inUptrend Buy Gold
Gold-Silver RatioUptrend Gold and Silver inDowntrend Sell Silver
Gold-Silver RatioDowntrend Gold and Silver inUptrend Buy Silver
Gold-Silver RatioDowntrend Gold and Silver inDowntrend Sell Gold

4) Identify trading opportunities using price action or technical indicators time entries in the direction of the trend.

5) Identify a trade size appropriate for the account size and set stop-losses and take-profits and execute the trade.

Here’s an example using the five steps:

1) Let’s say we open our gold to silver ratio chart on 8 February 2016.We draw our trend lines and the trend lines indicate that the ratio is in a current uptrend as shown in the chart below showing a four-hourly timeframe.

2) Our next step is to determine the individual trend for gold and silver. So, we open the charts and draw our trend lines and notice that both gold and silver are trending upwards as shown in the charts below.

3) The table above indicates that when the gold-silver ratio is trending upwards and gold and silver are both in an uptrend we should buy gold because it has been outperforming silver.

GOLD-SILVER RATIO UPTREND GOLD AND SILVER IN UPTREND BUY GOLD

4) Since the beginning of February, gold has increased drastically in price. We should wait for a modest pull-back before attempting to enter the market. Once we do enter the market, we can place our stop-loss below the trend line and our take-profit above the previous high to ensure a positive risk-reward ratio on the trade.

5) We determine an appropriate trade size for our account, execute the trade and set our stop-loss and take profit.

Market Value Ratios and How Traders Can Use Them

Market Value Ratios and How Traders Can Use Them

What are market value ratios?

Market value ratios are formulas that are used to provide insights into a company’s share price. There are many formulas that are used in various combinations for different analytical techniques. One thing is for sure, market value ratios give equity analysts a basic framework of a company and can possibly help to identify undervalued or overvalued stocks.

5 significant market value ratios to understand

Different ratios provide different types of feedback to the investor. Relying on one specific ratio is never wise as a single data point may only give one perspective while other ratios could obviate this singular view with an opposing indication. That is, a broader outlook (multiple ratios) give rise to more informed investment decisions. Below is a list of important market value ratios to keep in mind when analysing stocks:

  1. P/E Ratio
  2. Dividend Yield Ratio
  3. Market Capitalization
  4. Book Value Per Share
  5. Price-to-Book Ratio

1. Price-to-earnings (P/E) ratio = Price per share/Earnings per share (EPS)

The P/E ratio also knows as the price/earnings multiple is one of the most popular ratios used by investors to determine the value of a share. This ratio measures the current share price against the earnings per share (EPS). The P/E ratio simply indicates the amount an investor would pay for $1 of a company’s earnings.

Different industries or stock sectors can have varying P/E averages/ranges at which they trade. For example, the property sector may have a P/E ratio of 20, while financial services may only have an average P/E ratio of 12. This is important to factor in when valuing a stock.

A high P/E ratio could imply that the stock is more richly valued because investors are paying a higher price for each dollar of the company’s earnings. This may also display investor confidence in that the higher price reflects expected increases in future earnings, or growth potential.

A low P/E ratio may show investors that the price of the stock is relatively low compared to earnings, suggesting the stock may be undervalued. Alternatively, this can also mean low consumer confidence in terms of future growth, or potential headwinds that the company may have to face down-the-road.

Limitations of the P/E ratio

The ratio overlooks a company’s EPS growth projections. Stocks with high P/E ratios can still be attractive ‘buy’ options for investors as future EPS growth will ultimately bring the P/E ratio down. In addition to this, company debt is not directly factored either which may have a significant financial impact on a company.

2. Dividend yield ratio = Annual dividend/Share price

The dividend yield ratio helps investors understand the return on investment. This ratio shows the proportion of dividends that a company pays out in comparison to the market price of its stock.

It is important to note that many companies do not pay dividends which excludes this ratio. Younger companies will often reinvest profits back into the business rather than paying dividends in the effort of achieving stronger potential growth rates; while older, more mature companies may be more open to returning a portion of their net profits to shareholders.

A high or low yield can be interpreted depending on the company and relative industry. Mature companies may not have the same growth potential as a younger, fast growing company. So, in turn, some mature companies may display higher yields as opposed to lower yields from younger companies.

To conclude, the dividend yield ratio does not necessarily have a direct impact on stock valuations, but rather shows investors how much of a company’s net profits have been returned to shareholders, thereby allowing investors to choose stocks that may align to their investment needs.

Limitations of the dividend yield ratio

Dividend yield figures may be misinterpreted. For example, high yields may present themselves due to a falling share price as opposed to increased dividends. Also note – dividends are not guaranteed, and companies may cut their dividends in the future, particularly if company or industry performance suffers. This can lead many investors that are ‘chasing’ yield in a difficult space if the company later announces a reduction or altogether skipping of future dividend payments.

3. Market capitalization = Share price × no. of shares outstanding

This figure represents the size of the company. Large cap stocks are companies with values of more than $5 billion, while mid cap companies have market capitalization of between $1 and $5 billion. Small cap companies carry market caps of less than $1 billion; and this is a very key component of segmentation in equity markets.

It’s important to note that share price itself is not necessarily indicative of company size. If XYZ corporation had a $50 share price but a $2 billion valuation, it would be smaller than ABC corporation with a $20 share price and a $10 billion valuation. ABC would fit the description of large cap, while XYZ would be considered a mid-cap stock.

Limitations of market capitalization

This merely looks at the value of the stock at that particular moment in time, and has little leading quality. It can, however, enable an investor to structure their portfolio more efficiently in the effort of meeting their goals; enabling a focus on either larger, more developed companies or smaller companies that may carry greater growth potential.

4. Book value per share = (Shareholders equity – Preference stock)/No. shares outstanding

The book value per share represents the value of equity that remains after deducting debts and assuming that the company’s assets were liquidated. The book value per share is a measure that is not forward looking in its mathematical makeup. If a company is trading below its book value, that may be a sign that something else is going on or that investors are cautious of potential risks ahead that may adversely affect the company; thus, this measure is a possible indicator of the health of a company and how optimistic investors may be about future growth potential.

Limitations of the book value per share

Based on the book value of a company which excludes intangible assets into the equation. Comparing market value per share and book value per share can be flawed because of the composition of the formulas and the potential disconnect of ignoring growth potential.

5. Price-to-book-ratio (P/B) = Market value/Book value

This P/B ratio is used to find how a company is valued by comparing its market value to the book value. If the ratio is greater than one, the stock is trading at a premium to book value; if it is less than one, the stock price is trading below the book value.

A ratio greater than one suggests that the stock price of a company is trading at value more than the worth of its equity. This could signal to investors that the company has promising profit forecasts and that investors are willing to pay a premium for this future projection. Higher expected growth rates can often bring on higher P/E or P/B ratios as investors are anticipating stronger growth ahead.

A price-to-book ratio of less than one indicates that investors are unwilling to pay even the book value of a company. A lower ratio can highlight investor fear or pessimism of what might be ahead for that particular company.

Limitations of the P/B ratio

The P/B ratio ignores the intangible assets of a company which in the modern era is a large component of many stock valuation techniques.


What is the Best Time Frame to Trade Forex?

What is the Best Time Frame to Trade Forex?

Traders utilize varying time frames to speculate in the forex market. The two most common are long- and short-term-time frames which transmits through to trend and trigger charts. Trend charts refer to longer-term time frame charts that assist traders in recognizing the trend, whilst trigger chart pick out possible trade entry points. This article will explore these forex trading time frames in depth, whilst offering tips on which can best serve your trading goals.

How to decide the best time frame to trade forex

As mentioned above, the best time frame to trade forex will vary depending on the trading strategy you employ to meet your specific goals. The table below summarizes variable forex time frames used by different traders for trend identification and trade entries, which are explored in more depth below:

CHART DAY TRADING SWING TRADING POSITION TRADING
TREND CHART 30 minutes – 4 hours Daily Weekly
TRIGGER CHART 5 – 60 minutes 2 – 4 hours Daily

Main forex trading time frames

Traders utilize different strategies which will determine the time frame used. For example, a day trader will hold trades for a significantly shorter period than that of a swing trader. Read our guide for a basic introduction to different trading styles.
1) Position trading time frames

The position trading time frame varies for different trading strategies as summarized in the table above. This could fluctuate from daily to yearly under the ‘long-term’ definition.

Many new traders tend to avoid this approach because it means long periods of time before trades are realized. However, by many accounts, trading with a shorter-term (day trading) approach can be far more problematic to execute successfully, and it often takes traders considerably longer to develop their strategy.

Position trading (longer-term) approaches can look to the monthly chart for grading trends, and the weekly chart for potential entry points.

Position trading example

After the trend has been determined on the monthly chart (lower highs and lower lows), traders can look to enter positions on the weekly chart in a variety of ways. Many traders look to utilize price action (as seen in the weekly chart below) for determining trends and/or entering positions, but indicators can absolutely be utilized here as well.

Monthly AUD/JPY trend chart:

AUD/JPY Monthly Chart

Weekly AUD/JPY trigger chart:

AUD/JPY Weekly Chart

2) Swing trading time frames

After a trader has gained comfort on the longer-term chart, they can then look to move slightly shorter in their approach and desired holding times. This can introduce more variability into the trader’s approach, so risk and money management should be addressed before moving down to shorter time frames.

Swing trading is a happy medium between a long-term trading time frame and a short-term, scalping approach. One of the best benefits of swing trading is that traders can get the benefits of both styles without necessarily taking on all the downsides. As a result, this makes swing trading a very popular approach to the markets.

Swing traders will check the charts a couple times per day in case any big moves occur in the marketplace. This affords traders the benefit of not having to watch markets continuously while they’re trading. Once an opportunity is identified, traders place the trade with a stop attached and monitor at a later stage to see the progress of the trade.

Another advantage of this approach is that the trader is still looking at charts often enough to seize opportunities as they exist. This eliminates one of the downsides of longer-term trading in which entries are generally placed on the weekly/daily charts.

Swing trading example

For this approach, the daily chart is often used for determining trends or general market direction and the four-hour chart is used for entering trades and placing positions (see below). The daily chart shows the recent swing high and low respectively. Traders usually trade swings back in the direction of the preceding trend – in this example the preceding trend is upwards.

Now that the trade direction has been identified, the swing trader will then diminish the time frame to four-hours to look for entry points. In the example below, there is a clear price resistance level that the swing trader will look at when entering a long trade. Once price breaks or the candle closes above the designated resistance level, traders can look to enter.

Daily USD/ZAR trend chart:

USD/ZAR Daily Chart

4-hour USD/ZAR trigger chart:

USD/ZAR 4-Hour Chart

3) Day trading time frames

Day trading can be one of the most difficult strategies of finding profitability. Newer traders implementing a day trading strategy are exposing themselves to more frequent trading decisions that may not have been practiced for very long. This combination of experience and frequency opens the door for losses that might have been prevented had the trader opted for a slightly longer approach like swing trading.

The scalper or day trader is in the unenviable position of needing the price to move quickly in the direction of the trade. Therefore, the day trader becomes tied to the charts as they seek the market’s trends for that day. Obsessing over charts for long periods of time can lead to fatigue. The shorter-term approach also affords a smaller margin of error.

Generally, there is less profit potential in short-term trading which leads to tighter stops levels. These tighter stops mean higher probability of failed trades as opposed to longer-term trading.To trade with a very short-term approach, it’s advisable for a trader to get comfortable with a longer-term, and swing-trading approach before moving down to the very short time frames.

Resembling longer-term trading, day traders can look to evaluate trends on the hourly chart and locate entry opportunities on the ‘minute’ time frames such as five or ten-minute charts. The one-minute time frame is also an option, but extreme caution should be used as the variability on the one-minute chart can be very random and difficult to work with. Once again, traders can use a variety of triggers to initiate positions once the trend has been determined – price action or technical indicators.

Day trading example

The charts below use the hourly chart to determine the trend – price below 200-day moving average indicating a downtrend. The second 10-minute chart uses the RSI indicator to assist in short-term entry points. In this case, the trader only identifies overbought signals on the RSI (highlighted in red) because of the longer-term preceding downtrend.

Hourly EUR/USD trend chart:

EUR/USD Hourly Chart

10-minute EUR/USD trigger chart:

EUR/USD 10 Min Chart

Using multiple time frame analysis

The best time frame to trade forex does not necessarily mean one specific time frame. It is possible to combine approaches to find opportunities in the forex market. Find out more in our guide to multiple time frame analysis.

EUR/USD Stumbles as ECB Official Calls for Two Rate Cuts Before the Summer

EUR/USD Stumbles as ECB Official Calls for Two Rate Cuts Before the Summer

ECB Member Favours Multiple Rate Cuts Ahead of the Summer

The Greek central bank head, Yannis Stournaras (dove) mentioned in an interview this morning that there remains around 30% of past tightening yet to filter into the real economy, stressing the need to move the needle on rates ahead of the Fed.

The European economy has stagnated since Q4 2024, with GDP growth oscillating around zero percent while the US shows remarkable economic resilience. Therefore, there is some logic behind the recent call to ease monetary policy in an attempt to support the ailing economy.

Stournaras went as far as to advocate for two cuts before the summer break which means a total of 50 basis points shaved off the current benchmark interest rate. The ECB official warned against exaggerating the potential for a wage-price spiral as Christie Lagarde and other governing council members turned their focus on wage negotiations and the potential for higher wages adding to inflation concerns.

Immediate Market Reaction

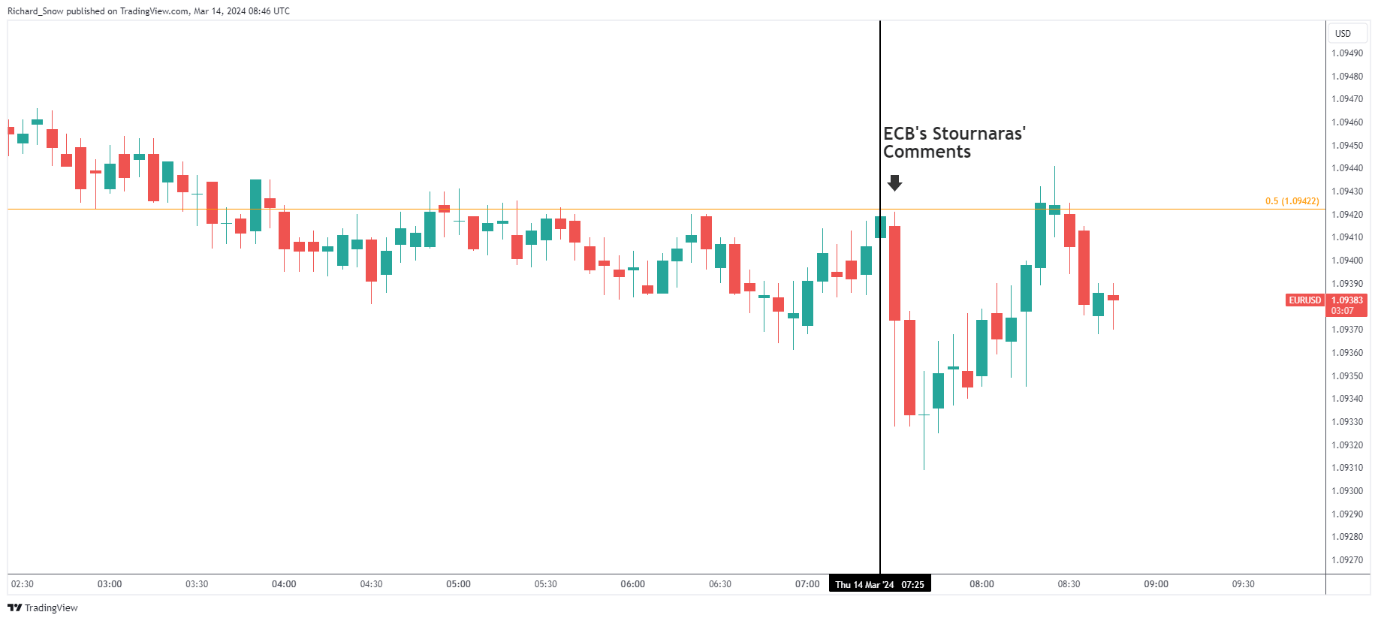
EUR/USD dropped as Stournaras’ statements filtered appeared across trading monitors, but the pair managed to stabilise moments after.

EUR/USD 5-Minute Chart

image1.png

EUR/USD Flirts with Familiar Zone of Resistance

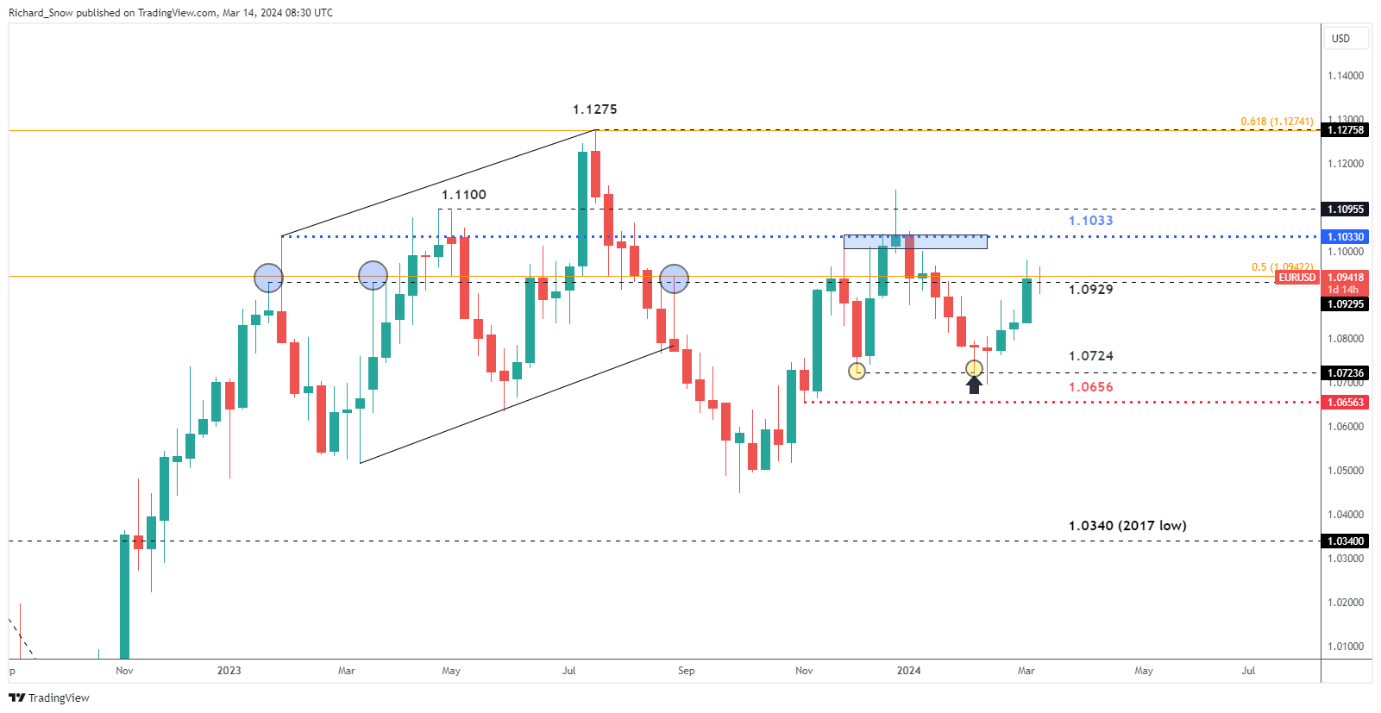
The weekly EUR/USD chart shows the pair struggling for bullish momentum around the 1.0930/1.0940 zone that had sent prices lower on multiple occasions in 2023. This week is rather light as far as the economic calendar is concerned meaning consolidation around current levels may continue. Notable US data includes PPI and retail sales later today with tomorrow’s University of Michigan consumer sentiment survey able to provide limited volatility into the end of the week depending on whether inflation expectations are much changed.

EUR/USD Weekly Chart

image2.png

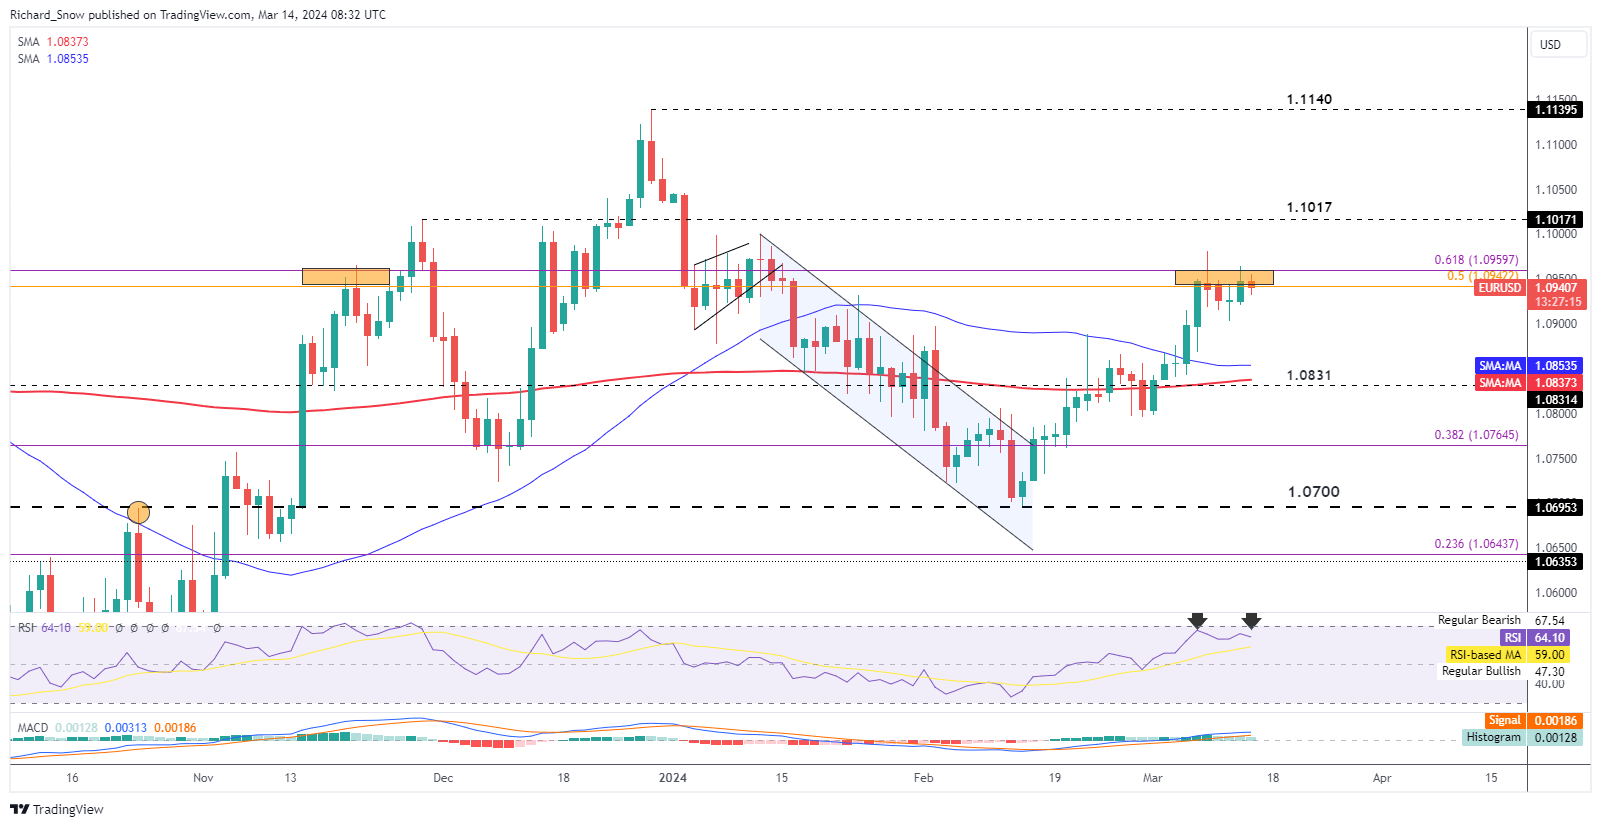
The daily chart highlights the resistance zone as the area between the two Fibonacci retracements which are made up of the 2020 to 2022 major decline and the 2023 decline. The levels of interest correspond to the 50% and 61.8% retracements of the respective, implied Fibonacci projections.

Price action remains above the 50 and 200-day simple moving averages (SMAs) – which is typically bullish. However, price momentum appears to be stalling and the 50 SMA reveals as much, dropping lower towards the 200 SMA. Should the bullish move continue, a break above 1.0960 will be required with subsequent momentum, eying 1.1017.

EUR/USD Daily Chart

image3.png

What are Retail Sales and Why is it Important to Traders? A Guide

What are Retail Sales and Why is it Important to Traders? A Guide

As an illustration, in the U.S. the major component of the retail sales figure are auto dealers which is why the Census Bureau report contains a ‘Retail Sales Ex Autos’ and ‘Retail Sales Ex Gas/Autos’ to eliminate any potential irregularity (volatility) from the auto industry – this exclusion is also referred to as ‘Core Retail Sales’ in some instances. Graphically, the data should present similar to the below economic calendar:

Graphical user interface  Description automatically generated with low confidence

Consumer spending is a key metric that drives economic activity so monitoring this data is essential for a company’s wellbeing as well as decision making (monetary and fiscal) going forward.

For example, when spending increases, business activity increases thus stimulating the economy and driving foreign investment. This in turn will impact other key economic components such as durable goods orders, consumer confidence, balance of trade, GDP and inflation to name just a few.

How is Retail Sales Measured? Examples of Retail Sales

The U.S. retail sales index comprises of various retailer types as shown below (Source: U.S. Census Bureau):

  • Motor vehicle and parts dealers
  • Furniture and home furniture stores
  • Electronics and appliance stores
  • Building material, garden equipment & supplies dealers
  • Food and beverage stores
  • Health and personal care stores
  • Gasoline stations
  • Clothing and clothing accessories stores
  • Sporting goods, hobby, musical instrument & book stores
  • General merchandise stores
  • Miscellaneous store retailers
  • Non-store retailers (online)
  • Food services & drinking places

The above categories are then weighted and accordingly using a sampling frame predefined by the U.S. Census Bureau and is subject to periodic changes.

Retail Sales and Inflation

Positive retail sales data cannot always be taken at face value as the figure produced by the RSI is not adjusted for inflation. A positive figure once adjusted for CPI inflation can result in a net drop in retail sales. When inflation is high, the per dollar expenditure is reduced in terms of purchasing power which is why factoring in inflation is important for an all-inclusive representation of the economy.

How to Trade Retail Sales?

Trading retail sales is by no means straightforward but there are a few historical and noteworthy relationships between RSI and other markets. Beginning with the equity markets, retail sales traditionally exhibits a positive correlation to stocks because an increase in sales lends itself to higher company earnings. The graphic below shows how the U.S. equity markets (SPX) largely track fluctuations in retail sales data with an expected higher parallel with the retail sector as measured by the SPDR Retail ETF (orange).

U.S. RETAIL SALES VS S&P500 INDEX VS SPDR RETAIL ETF (2017 -2022)

Chart, line chart, histogram  Description automatically generated

Considering retail sales is largely comprised of auto sales in the U.S. (roughly 20% of the index), investors following the automotive industry can take clues from the motor vehicle sub category as to the current state and short-term outlook for local automotive manufacturers. The chart below outlines the rapport between the two variables by highlighting the positive correlation between retail sales data and two class leading manufacturers in Ford Motor Company and General Motors Company respectively. The same logic can be extended through to the other sub categories and utilized as an input for stock analysis in those corresponding fields.

U.S. RETAIL SALES VS FORD MOTOR CO. & GENERAL MOTORS CO. (2012 -2022)

Chart, histogram  Description automatically generated

Retail Sales in the Forex Market

As a general rule of thumb, improved retail sales usually translates to a positive for the home currency in question, while also adding to market volatility pre and post release. Following on with the U.S. as a template, retail sales data can have an influential impact on the central bank’s (Federal Reserve) decision making process. For example, if retail sales are slowing, the economic outlook may be considered bleak which may prompt the Fed to loosen monetary policy by cutting interest rates in hopes of stimulating the economy – the opposite will apply if retail sales are growing.

Supporting this positive correlation between currency and retail sales, the chart below shows a 6-month snapshot between U.S. retail sales data and the Dollar Index (DXY). There is a clear positive association between the two variables but as with all financial market analysis, there are always other factors at play that need to be considered in the evaluation process.

U.S. RETAIL SALES VS DXY (2022)

Chart, line chart  Description automatically generated

Retail Sales: A Summary

Retail sales can assist traders regardless of trading style/strategy – technical analysis, fundamental analysis or a combination of the two. Understanding retail sales data can enhance one’s understanding of financial markets and the economics behind certain price movements. Retail sales can be incorporated across all financial market asset classes including stocks, FX, commodities and fixed income making it a great macro indicator for the broader market.