EUR/USD, GBP/USD, DXY Price Forecast: Will an Overbought DXY See a Correction?

Market Overview

On Friday, the German Import Prices recorded a surprising halt in decline, registering at 0.0%, notably better than the anticipated -0.4% and a significant improvement from the previous -1.0%.  Whereas, the Retail Sales in the UK also defied expectations, remaining flat at 0.0% against a forecasted -0.4% decline, indicating a resilient consumer sector amidst economic headwinds.

The German Ifo Business Climate Index surpassed forecasts, coming in at 87.8 against an expectation of 85.9, marking an uptick from the previous 85.5. Lastly, the CBI Industrial Order Expectations in the UK matched previous figures at -18, better than the anticipated -20.

Events Ahead

Key among these are comments from FOMC Member Bostic and the anticipated New Home Sales data, expected to show an increase to 675K from 661K. Additionally, the week is packed with significant reports, including the U.S. Final GDP quarter-over-quarter, pegged at 3.2%, and the Revised University of Michigan Consumer Sentiment at 76.5, alongside Pending Home Sales, projected at 1.5% from a previous -4.9%.

The GBP/USD braces for impacts from domestic fronts with the CBI Realized Sales and remarks from MPC Member Mann at the Royal Economic Society Conference in Belfast, offering fresh insights into the UK’s economic outlook.

US Dollar Index (DXY)

Dollar Index

Dollar IndexThe Dollar Index experienced a slight decline, dipping by 0.07% to 104.359, hinting at momentary bearish pressure within a largely bullish long-term trend. Today’s key pivot point stands at 104.492, marking the threshold between potential upward momentum and continued bearish trend.

With immediate resistance levels poised at 104.736, 104.978, and peaking at 105.277, the path for a bullish resurgence is clear, should the index cross above the pivot. Conversely, support levels at 104.184, 103.985, and 103.678 offer a safeguard against further declines.

The proximity of both the 50 and 200-Day EMAs below the current price strengthens the long-term bullish outlook, albeit with a cautious note for potential shifts above or below the pivotal 104.492 mark.

EUR/USD Technical Forecast

EUR/USD Price Chart - Source: Tradingview

EUR/USD Price

On the downside, immediate support is identified at 1.0788, followed by 1.0766 and 1.0744, offering a safety net against potential declines. The near convergence of the 50 and 200-Day EMAs around 1.0867 and 1.0861 respectively, indicates a tightly contested market, with the pair’s direction likely hinging on its ability to breach the pivotal 1.0833 mark.

GBP/USD Technical Forecast

GBP/USD Price Chart - Source: Tradingview

GBP/USD Price ChartThe GBP/USD pair experienced a slight uptick of 0.07%, reaching 1.26104, as it navigates through a cautiously optimistic market environment. Currently situated above the pivotal point of 1.2574, it confronts immediate resistance at 1.2628. Surpassing this could see challenges at 1.2661 and further at 1.2716, delineating potential upward momentum.

On the downside, support is firmly placed at 1.2536, with subsequent levels at 1.2501 and 1.2465 poised to cushion any downward movements. The convergence of the 50 and 200-Day EMAs around 1.2701 and 1.2697 respectively reinforces a bullish sentiment, conditional on maintaining above the critical threshold of 1.2574.

The Market News Today: Global Markets Brace as PCE, GDP Data Set Stage

Key Week Ahead with GDP, PCE Index, and Earnings in Focus

This week, markets brace for a data surge, headlined by the PCE Price Index and GDP’s third estimate. Key earnings from GameStop, McCormick, and Walgreens Boots Alliance are also on deck. Investors are watching new home sales and durable goods orders for economic health indicators, while consumer confidence and manufacturing indices provide further insights. Personal income and spending figures will offer clues about consumer behavior, setting the stage for a pivotal week in financial markets, ending with Good Friday’s market closure.

Stock Futures Ease Amid Ongoing Rally; Market Optimism Persists

Stock futures saw a slight retreat Monday morning, following a period of sustained gains in major U.S. stock indexes. The Dow Jones, S&P 500, and Nasdaq Composite have recently achieved new all-time closing highs, with the Dow nearing the 40,000 mark. This rally has been fueled by the Federal Reserve’s dovish rate policy and a strong interest in tech stocks, particularly those driven by AI advancements. Investor sentiment remains high, reflecting confidence in the market despite concerns over an overextended rally and interest rate trends. (CNBC)

JPMorgan Warns Bitcoin Still Overvalued Despite Recent Decline

JPMorgan’s latest analysis reveals that Bitcoin remains overbought, despite its recent price drop. The bank predicts continued selling pressure as the halving event nears, citing overoptimistic positioning. Metrics like futures positions and bitcoin futures’ premium over spot prices support this view. The report also highlights a decrease in spot Bitcoin ETF inflows, challenging earlier predictions of a year-end rally. The analysis comes amid CEO Jamie Dimon’s ongoing skepticism about Bitcoin, contrasting with the market’s previous high expectations for post-halving gains. (Bitcoin.com)

Dollar Holds Firm, Yen Near Decade Low Amid Currency Intervention Threat

The dollar remains strong against a backdrop of global rate shifts, with the yen struggling near a 32-year low despite Japan’s potential intervention. Japanese authorities warn the yen’s weakness doesn’t match economic fundamentals, hinting at possible action to support it. Meanwhile, expectations that the Fed will maintain higher rates contrast with potential ECB and BoE cuts, pressuring the euro and sterling. The dollar index saw a modest rise, as central banks globally navigate divergent monetary policies amid fluctuating economic data. (Reuters)

Oil Edges Up Amid Supply Woes, Gold Climbs on Rate Cut Hopes

Oil prices recorded a slight rise at the start of the week, driven by intensifying geopolitical tensions and a decrease in the U.S. oil rig count, hinting at potential supply constraints. Concurrently, gold prices experienced an increase, buoyed by the prospects of upcoming Federal Reserve rate cuts and a softer dollar. These movements reflect the market’s response to unfolding international events and central bank policy speculations, influencing both commodities’ trajectories in global markets.

Litecoin price forecast: 90,000 new users acquire LTC ahead of Bitcoin Halving

Litecoin (LTC) price opened trading on Monday, March 25 just below $90 mark, having maintained an upward momentum since the recent bullish reversal on March 20. On-chain data shows that while new entrants are trooping in to the Litecoin ecosystem, speculative traders are also placing bullish bets ahead of the forthcoming Bitcoin halving.

Can Litecoin price break above $100 before the halving date?

Litecoin pulls 90,000 new users ahead of Bitcoin Halving

Bitcoin upcoming 4th halving event scheduled for April 20 has dominated media headlines in recent weeks, as strategic investors move to front-run possible price impact.  This has triggered a paradigm shift in investment patterns across the crypto markets, predominantly on rival Proof of Work (PoW) projects.

Currently trading at $89, LTC price has been limited to only 12% gains for the month, after multiple unsuccessful attempts at establishing a steady support base above the $90.

However, on-chain data trends now show a flurry of new users have trooped into the Litecoin network ahead of the Bitcoin halving, a move that could trigger a parabolic price breakout.

Santiment’s Total Amount of Holders chart below tracks the net-growth in the number of new funded wallets created on a cryptocurrency network. It essentially measures growth in user acquisition and active investor base.

Litecoin (LTC) Total Amount of Holders vs. Price | March 2024 | Source: Santiment
Litecoin (LTC) Total Amount of Holders vs. Price | March 2024 | Source: SantimentThe number of active Litecoin holders stood at 7.92 million at the close of Feb 29. But as of March 25, that figure has balooned to $8.01 million unique addresses holding LTC.

This means means that the number of LTC holder wallets have increased by 90,000 addresses in the March 2024.

An increase in funded wallets not only means increase in number of users, but it is also a bullish indicator of fresh capital flowing into the ecosystem.

It is widely speculated that when rewards for Bitcoin mining get halved on April 20, many unprofitable miners could turn towards other PoW networks.

Hence, it appears that strategic investors have been aping-in to other prominent PoW networks like Litecoin in hopes that the forthcoming Bitcoin halving event will impact their prices and network sophistication. positively.

Litecoin (LTC) Price Forecast: Rocky road to $100

Given that LTC price action has been closely and positively correlated to the changes in the number of holders, it is highly likely that a persistent increase in funded wallets could drive Litecoin price towards $100 in the days ahead.

However, in the near-term the bulls face major resistance at the $95 area. As shown in the Coinglass chart below, $6.4 million leveraged SHORT LTC positions are due to be liquidated if Litecoin price breaks above $94.

Given that this is a high-liquidity price range, a strategic LONG traders could attempt to execute take-profit orders at minimal slippage, while SHORT traders looking to mitigate losses could also simultaneously deploy stop-loss orders.

This key factors could trigger another Litecoin price retracement from the $94 area in the week ahead.

But considering the fresh capital inflows from new entrants trooping in ahead of the Bitcoin halving, Litecoin price has a fair change of scaling that sell-wall and advancing toward $100 as predicted.

Litecoin LTC price forecast, March 2024 | Source: Coinglass
Litecoin LTC price forecast, March 2024 | Source: CoinglassOn the flipside, the broader crypto market takes another dip this week, Litecoin price stands the risk  of a reversal below $80. However, the chart above illustrates that the bulls could mount a major support buy-wall at $87 price mark to avoid liquidations worth over $7.2 million.

Dogecoin Price Forecast: SHORT Traders Face $20M Losses if this Happens

Dogecoin (DOGE) price surged above $0.17 on Monday, March 25, up 58% within the monthly time frame. On-chain data shows that thousands of new users trooping into the Dogecoin network following Elon Musk’s recent payments licensing move.

With SHORT traders desperate to avert over $20 million in losses can DOGE price maintain an upward momentum in the week ahead?

10,000 New Users Joined Dogecoin Ecoystem in the last 3-days

After struggling for demand in Mid-March, Dogecoin price swung into an upward trajectory on March 20, as markets reacted to Elon Musk Twitter/X Payments LLC arm announced the acquisition of operational licenses in 3 US states.

DOGE price bounced 30% from $0.12 to $0.16 within the 24 hours of the news, as the Dogecoin ecosystem reacted positively to yet another bullish Elon Musk  narrative.

However, at press time on March 25, Dogecoin has now stretched its gains even further above $0.17 territory, sparking hopes of a prolonged price uptrend.

On-chain data shows that beyond the Dogecoin existing holders’ positive reactions, new entrant trooping into the ecosystem are adding more depth and intensity to the market demand.

Santiment’s Total Amount of Holders chart below tracks the net-growth in the number of new funded wallets created on a blockchain network. It serves as proxy for measuring growth in user acquisition and active investor base.

Dogecoin (DOGE) Total Amount of Holders vs. Price | March 2024 | Source: Santiment
Dogecoin (DOGE) Total Amount of Holders vs. Price | March 2024 | Source: SantimentDogecoin funded wallets have increased by 70,000 addresses in the March 2024 hitting 6.58 million active wallets as of March 25. Notably, 10,000 of those have funded their wallets in the last 4-days,  in aftermath of X Payments’ license acquisition.

An increase in funded wallets not only means increase in number of users, but it is also a bullish indicator of fresh capital flowing into the ecosystem.

It appears that X Payments’ license acquisition has stirred up optimism that Dogecoin could achieve global adoption surge if Elon Musk’s fulfills the long-term proposition to integrate DOGE into Twitter/X.

Historical, also shows that DOGE price action has been closely and positively  correlated to the changes in the number of funded wallets. Hence, strategic traders will keep an eye on the future developments surrounding this event.

Dogecoin (DOGE) price forecast: SHORT Traders to Lose $20M if DOGE breaks above $0.20

In the near-term, if the Dogecoin network continues to adds to its 70,000 newly-funded wallets, DOGE price could head toward the $.20 target in the week ahead.

However, Coinglass Liquidation map shows that the bears could mount a significant sell-wall at the $0.18 territory.

As seen below, SHORT traders currently have over $20 million leveraged futures contracts due to be liquidated if Dogecoin price surges above $0.18.

To avoid booking such large losses, the bears could activate tight stop-loss orders in the coming days. The sell pressure could in advertently slow down the DOGE price ascent.

But if the new entrant keep bringing in fresh capital as observed above, Dogecoin could attract sufficient demand to scale the looming sell-wall at $0.18, and potentially drive the rally above $0.20 as predicted.

Dogecoin (DOGE) price forecast, March 2024 | Source: Coinglass
Dogecoin (DOGE) price forecast, March 2024 | Source: CoinglassBut if the SHORT traders’ top-loss orders triggers an outsized bearish market reaction, Dogecoin price stands the risk of major downswings below $0.15.

However, this outcome seems unlikely, as the bulls currently hold leveraged positions worth over $65 million that could get triggered if price fall $0.16 price level.


XRP News Today: Empower Oversight Unveils New Details in SEC Conflict Probe

SEC vs. Ripple Case Takes Center Stage

The investor focus will return to the ongoing SEC v Ripple case this week. The SEC will release a redacted version of the remedy-related opening brief on Tuesday, March 26. Investors expect the SEC to argue for a punitive disgorgement for selling unregistered securities to institutional investors.

In July 2023, Judge Torres ruled that Ripple breached Section 5 of the 1933 Securities Act for selling unregistered XRP to institutional investors.

The SEC will release the redacted opening brief amidst heightened scrutiny. Significantly, the Office of Inspector General (OIG) is close to concluding an investigation into alleged crypto conflicts of interest within the SEC.

Evidence of financial conflicts of interest could impact SEC plans to appeal a second ruling from July 2023. Judge Analisa Torres ruled that programmatic sales of XRP do not satisfy the third prong of the Howey Test.

The investigation relates to former SEC director William Hinman.

Hinman allegedly received millions of dollars from his previous employer, Simpson Thacher, while guiding crypto regs at the SEC. Hinman returned to Simpson Thacher after leaving the SEC. In a highly publicized 2018 speech, Hinman said that Bitcoin (BTC) and Ethereum (ETH) are not securities. Simpson Thacher is in a group that promotes Enterprise Ethereum.

On Tuesday, Empower Oversight will further scrutinize the SEC vs. Ripple case. Founder Jason Foster and President Tristan Leavitt will discuss the IG Report and SEC lawsuits in a livecast on CryptoLaw.

Empower Oversight vs. the SEC

On March 18, Empower Oversight sued the SEC for more crypto conflict-related documents. Empower Oversight announced the lawsuit, saying,

“By slow walking their response to our FOIA request, the SEC is stonewalling Empower’s oversight into SEC officials with conflicts of interest on cryptocurrency issues. The public has a right to see all documents that relate to how these public officials violated ethics guidance and how the agency failed to hold them accountable.”

On March 14, Empower Oversight requested records relating to possible ethical violations. The March 14 request expanded the investigation to include documents relating to former SEC Chair Jay Clayton.

Former Chair Clayton reportedly moved to One River Asset Management after leaving the SEC. One River Asset Management is a hedge fund focused on BTC and ETH. The letter to the FOIA highlighted that Clayton stated bitcoin is not a security and affirmed Hinman’s speech about ETH,

Links between Clayton and crypto-related firms go back to 2022. Empower Oversight noted that Clayton became an advisor to Electric Capital in 2022. Electric Capital is a Consensys investor. Consensys is a developer of Ether.

The SEC filed charges against Ripple Labs on Chair Clayton’s last day at the SEC.

XRP Price Action

Weekly Chart sends bullish price signals.
XRPUSD 250324 Weekly Chart

Daily Chart

XRP hovered above the 50-day and 200-day EMAs, sending bullish price signals.

An XRP move through the $0.6609 resistance level could give the bulls a run at the $0.70 handle. A breakout from the $0.70 handle could signal a move to the $0.7467 resistance level.

SEC-related news and SEC vs. Ripple case-related chatter need consideration.

Conversely, a drop below the 50-day EMA could give the bears a run at the 200-day EMA and the $0.5740 support level. Buying pressure could intensify at the $0.5740 support level. The 200-day EMA is confluent with the support level.

The 14-day RSI reading, 52.23, indicates an XRP move to the $0.70 handle before entering overbought territory.

XRP Daily Chart affirms bullish price signals.
XRPUSD 250324 Daily Chart

4-Hourly Chart

On the 4-hourly, XRP sat above the 50-day and 200-day EMAs. The EMAs affirmed the bullish price signals.

An XRP return to the $0.65 handle would support a move to the $0.6609 resistance level.

However, a drop below the 50-day EMA could signal a drop below the $0.60 handle. A fall through the $0.60 handle could give the bears a run at the $0.5740 support level.

The 4-hourly RSI, with a reading of 56.14, suggests an XRP break above the $0.6609 resistance level before entering overbought territory.

XRP 4-hourly chart reaffirmed the bullish price signals.
XRPUSD 250324 4-Hourly Chart

British Pound Weekly Forecast – GBP, Gilt Yields Slide, FTSE 100 Rallies Further

GBP/USD is trading around lows last seen one month ago after the Bank of England gave a strong hint that they may start cutting interest rates in June. Going into the meeting, market forecasts pointed at the August meeting for the first UK Bank Rate cut, but this changed rapidly after the MPC meeting on Thursday. GBP/USD fell from a high of 1.2800 to around 1.2650 and this sell-off has continued as we go into the weekend. Sterling is currently trying to find a balance against the US dollar, and this will be made harder next week due to a lack of any important events or data releases, and a UK Bank Holiday on the Friday. Support is seen at 1.2591 (200day sma), 1.2547, and then the 50% Fib retracement at 1.2471.

GBP/USD Daily Price Chart

image1.png

IG Retail data shows 64.55% of GBP/USD traders are net-long with the ratio of traders long to short at 1.82 to 1.The number of traders net-long is 39.00% higher than yesterday and 21.10% higher from last week, while the number of traders net-short is 29.34% lower than yesterday and 30.53% lower from last week.

We typically take a contrarian view to crowd sentiment, and the fact traders are net-long suggests GBP/USD prices may continue to fall.

UK government bond yields also fell sharply post-BoE as traders began pricing in lower UK borrowing costs. The rate-sensitive UK 2-year gilt opened this week with a yield of 4.35% before drifting lower into the meeting. This move lower accelerated yesterday and today with the yield touching a low of 4.08%. The chart suggests a break below 4.07% brings a near-term target of 3.96% into focus.

UK 2-Year Gilt Yield

image2.png

The FTSE 100 had a much better week as a weaker rate backdrop saw traders push the indices to a new one-year high. A weaker GBP/USD also helped fuel the move, boosting profits of FTSE 100 companies that earn US dollars abroad. With GBP/USD unlikely to push higher in the short term, the FTSE 100 will push higher. The FTSE 100 all-time high of 8044 is set to come under pressure in the weeks ahead.

FTSE 100 Daily Chart

image3.png

What is your view on the British Pound, Gilt yields, and the FTSE 100

Markets Week Ahead: Gold Overreacts, Sterling Sinks and USD Advances

Gold Whipsaws and Signals a Potential Momentum Shift

The precious metal rose phenomenally in the wake of the FOMC meeting and updated summary if economic projections. The US dollar acted as the release valve for all the hawkish sentiment that had been priced into the market. US activity, jobs and inflation data printed on the higher side of estimates in the lead up to the March meeting, resulting in some corners of the market speculating the Fed may feel obliged to remove one rate cut from the calendar.

This view helped the spur on the dollar. However, the Fed narrowly maintained their December projection of requiring three 25 basis point cuts for 2024, sending the greenback sharply lower and gold higher – to a new all-time high.

Now that markets have has a few days to digest the data and Fed guidance, the greenback has resumed the more medium-term uptrend, sparking a sharp reversal for gold. The potential evening start suggests that gold prices may continue to moderate in the week to come.

Gold Daily Chart

image1.png

Source: TradingView, prepared by Richard Snow

Gold trading involves not only a sound application of technical principles but also a comprehensive understanding of the various fundamental drivers of the precious metal. Learn the basics that all gold traders ought to know:

Sterling Sinks after Hawkish MPC Members Give in

The Bank of England kept the bank rate on hold, as expected, but markets were more interested in the vote split after the February meeting revealed a three-way split in the decision to hike, hold or cut interest rates.

Most Read: Bank of England Leaves Rates Unchanged, Vote Split Turns Dovish, GBP/USD Slips

However, the encouraging February inflation print appears to have convinced the two remaining hawks on the committee to vote for a hold, with the votes tallying 8 in favour of a hold and the single vote to cut from well-known dove Swati Dhingra. The coming week is very quiet form the perspective of scheduled risk events, with Good Friday rendering it a shorter trading week for a number of western nations, including the US and UK. PCE data on Friday amid what is likely to be less liquid conditions has the potential to raise volatility into the weekend.

GBP/USD Daily Chart

image2.png

If you’re puzzled by trading losses, why not take a step in the right direction? Download our guide, “Traits of Successful Traders,” and gain valuable insights to steer clear of common pitfalls:

Gold Weekly Forecast: Gold Spike Reveals Overzealous Fed Reaction

Gold Volatility Spike Heads Lower, Alongside the Precious Metal Itself

GVZ, or the gold volatility index, witnessed a strong move higher on Thursday as markets digested the recent Fed statement and latest summary of economic projections. The projections invalidated a growing belief in the market that the Fed will be forced to forgo a third rate cut in 2024 due to robust US data and resulted in a dovish repricing in the dollar.

However, it has not taken long for markets to rally behind the dollar once again – something that is likely to keep the greenback supported into Friday’s PCE data which falls on Good Friday.

The chart below reveals gold’s recent responsiveness to the dollar (DXY) and shorter-term yields like the US 2-year yield. The aggressive move higher corresponded with falling yields and a lower USD but shortly thereafter,

Daily Gold Chart with DXY and 2-Year US Treasury Yields

image1.png

Potential Evening Star Emerges Moments After Printing the New All-Time High

An evening star could be emerging as the week came to a close, although the middle candle has a very notable upper wick which is not synonymous with the candle stick pattern. Nevertheless, price action suggests the recent move higher was an overreaction to the Fed news, as prices continued to ease into the weekend.

At the start of the coming week, the prior high of $2146.80 comes immediately into view as an early indication of whether bears may set the tone for the week. It’s a quiet week apart from final Q4 GDP data for the US and UK just to list a few and then on Friday PCE data for the month of Feb is due.

The dollars strong, immediate recovery poses a challenge for further upside for gold over the shorter-term and with few catalysts to choses from next week, gold may consolidate around the prior all time high with a view to trade lower.

Daily Gold Chart (XAU/USD)

image2.png

The weekly chart helps put golds multi-week advance into perspective. The week before the one that’s just passed revealed a bit of a slowdown in bullish momentum and the candle relating to the most recent trading week that’s just come to a close, reveals a rejection of higher prices.

Weekly Gold Chart

image3.png

Gold Soars to New All-Time High After the Fed Reaffirmed Rate Cut View

The Fed Gave Gold the Green Light after Reaffirming Rate Cut View

The Federal Reserve announced their latest monetary policy statement yesterday alongside the summary of economic projections. The immediate takeaways from the announcement include the Fed sticking with the original, three interest rate cuts this year alongside upward revisions to both inflation and growth.

Fed Summary of Economic Projections, March 2024

image1.png

Source: Federal Reserve, Summary of Economic Projections March 2024

Questions have been raised over just how tight economic conditions are in the US given the resilience of both the jobs market and economic growth. Naturally this has led to much speculation over the ‘neutral rate’ which is the Fed funds rate that is neither accommodative nor restrictive and was previously thought to be 2.5%. The March forecasts include upward revisions to the Fed funds rate for the entire forecast horizon and more notably saw a slight rise in the long-run rate rate from 2.5% to 2.6% – perhaps a nod to a higher theoretical neutral rate.

Ahead of the announcement markets had priced in the potential for the Fed to ease up on rate cut expectations in light of robust economic data and hotter-than-expected inflation prints that have emerged in some way or another since December 2023.

Therefore, the confirmation of the Fed’s December rate projections resulted in a dovish repricing in the dollar and shorter dated yields like the 2-year Treasury yield, providing gold with the ammunition to forge a new all-time high on Thursday.

Gold 5-Minute Chart

image2.png

Source: TradingView, prepared by Richard Snow

Learn how to prepare ahead of a market moving news/data with the easy to implement strategy outlined in our guide below:

Gold Soars to New All-Time High

Gold continued its bullish run after Wednesday’s FOMC meeting provided the catalyst. Bullish continuation was something highlighted in the previous gold update, as long as prices consolidated above the prior all-time high of 2146.80 – which they had.

The new high of around 2222 has put down a new marker for gold bulls, backed by higher central bank purchases, most notably from China in recent times. The precious metal may be due for a temporary pullback after the large move and could soon find resistance it the dollar recovers and continues its recent uptrend. Support remains back at 2146.

Daily Gold (XAU/USD) Chart

image3.png

Stay up to date with the latest breaking news and themes driving the market by signing up to out newsletter:

Top Continuation Patterns Every Trader Should Know

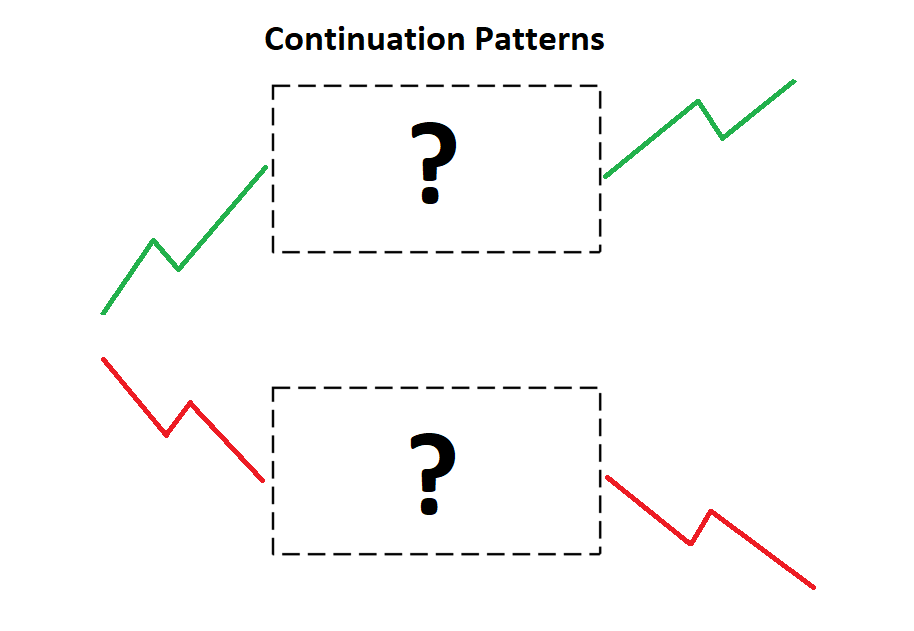
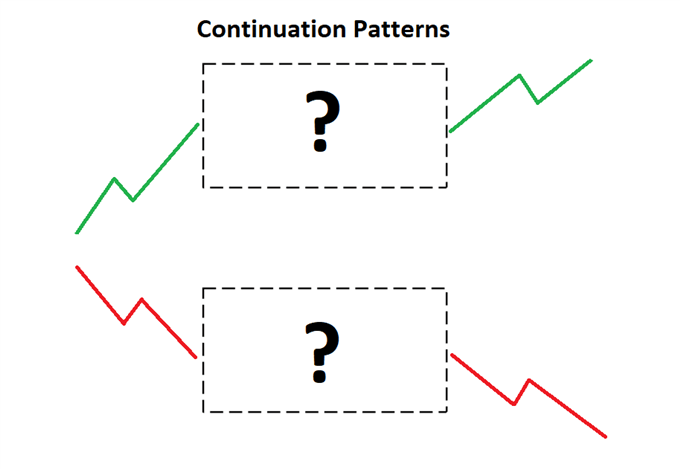
What are continuation patterns?

Continuation Patterns are recognizable chart patterns that signify a period of temporary consolidation before continuing in the direction of the original trend. Consolidation appears in the form of sideways price movement. The pattern completes itself upon a strong breakout of the consolidation zone, resulting in the continuation of the preceding trend. Continuation patterns usually play out over the short to intermediate term.

continuation chart patterns

Bullish continuation patterns

Bullish continuation patterns appear midway through an uptrend and are easily identifiable. The main bullish continuation patterns are introduced below.

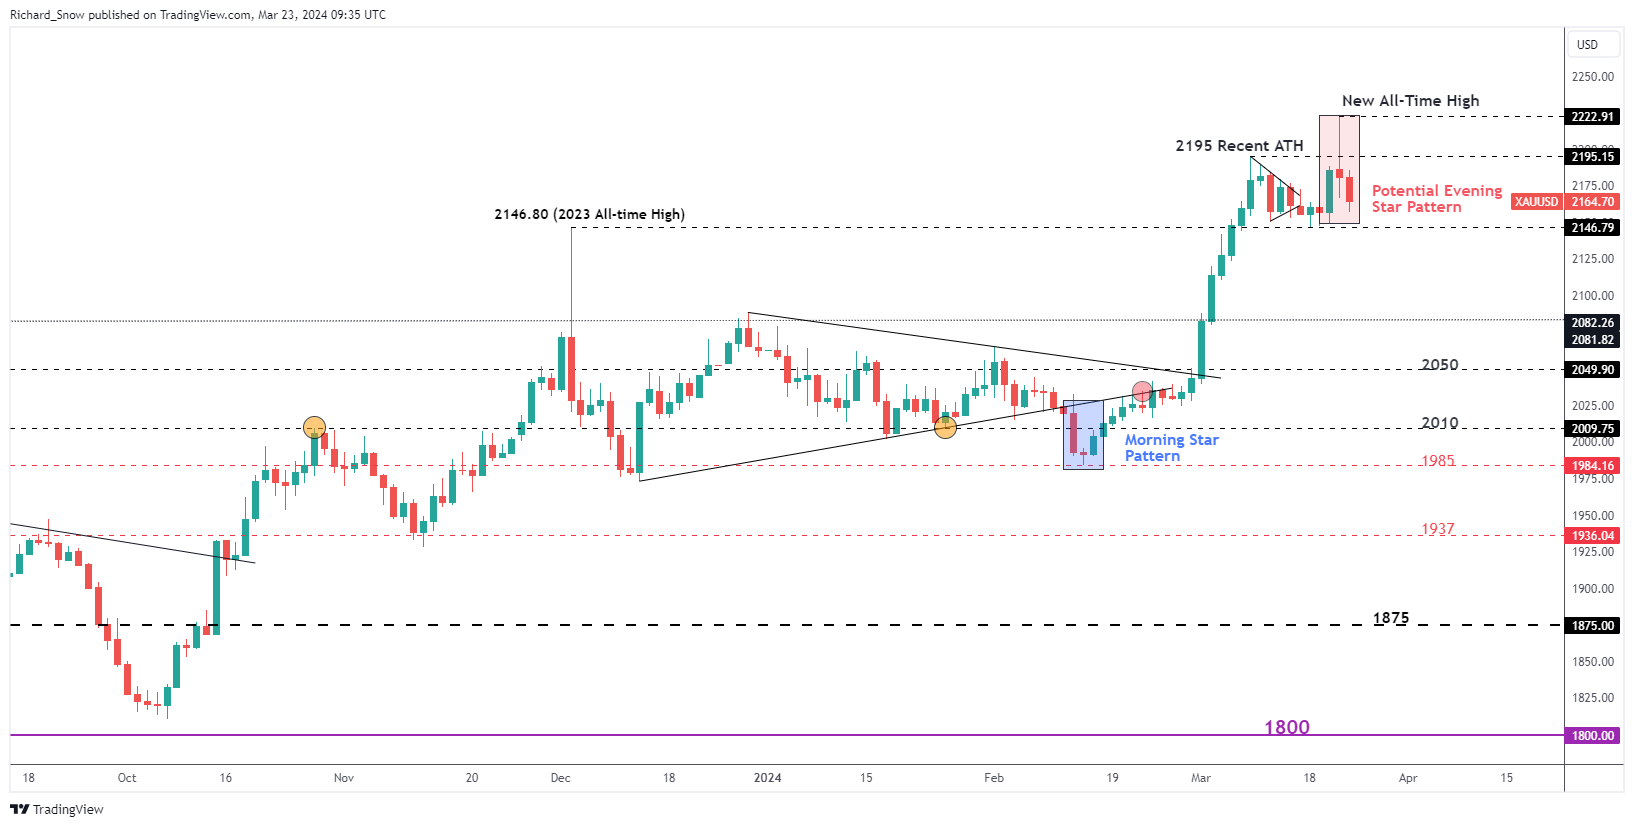
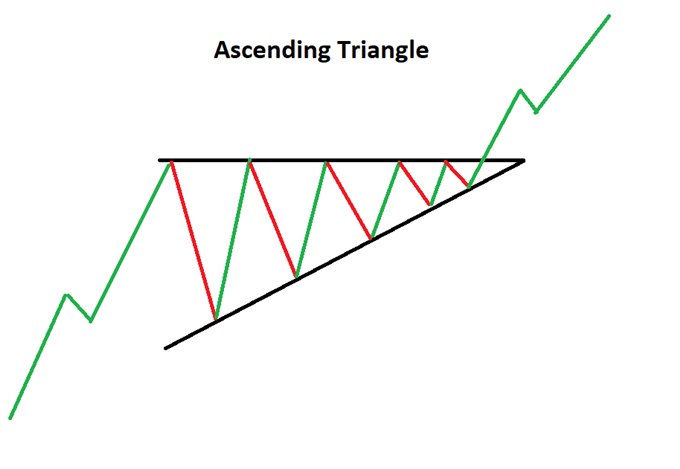
1. Ascending triangle

An ascending triangle pattern is a consolidation pattern that occurs mid-trend and usually signals a continuation of the existing trend. The pattern is formed by drawing two converging trendlines (flat upper trendline and rising lower trendline), as price temporarily moves in a sideways direction. Traders look for a subsequent breakout, in the direction of the preceding trend, as a cue to enter a trade.
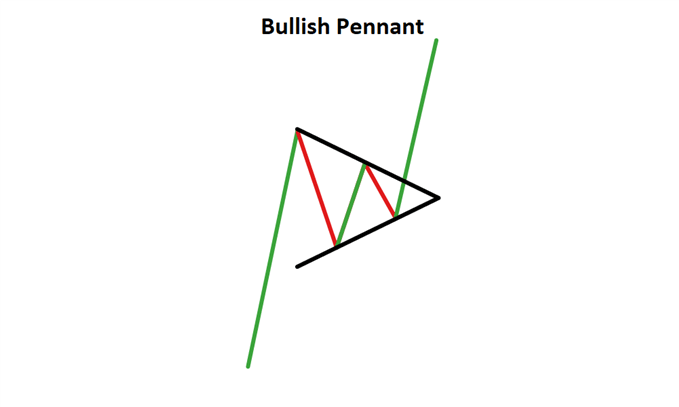
Ascending triangle continuation pattern

2. Bullish Pennant

A bullish Pennant pattern is a continuation chart pattern that appears after a security experiences a large, sudden upward movement. It develops during a period of brief consolidation, before price continues to move in the direction of the trend with the same initial momentum.

The triangular pattern is called a Pennant, which is made up of numerous forex candlesticks and is not to be confused with the larger, symmetrical triangle pattern.
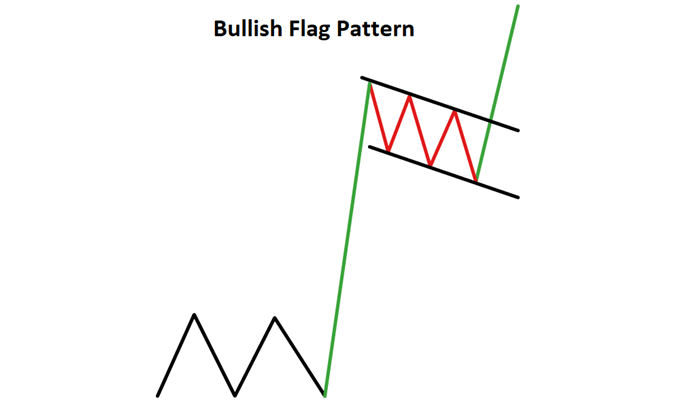
Bullish pennant continuation pattern

3. Bullish Flag

The bullish flag pattern is a great pattern for traders to master. Explosive moves are often associated with the bull flag as it provides a temporary respite to a sharp initial move. The bull flag and pennant pattern appear under the same conditions (sharp and sudden move in price) however the bull flag can offer more attractive entry levels.

The bull flagis characterized by a downward sloping channel denoted by two parallel trendlines against the preceding trend.

Bullish flag continuation candlestick pattern

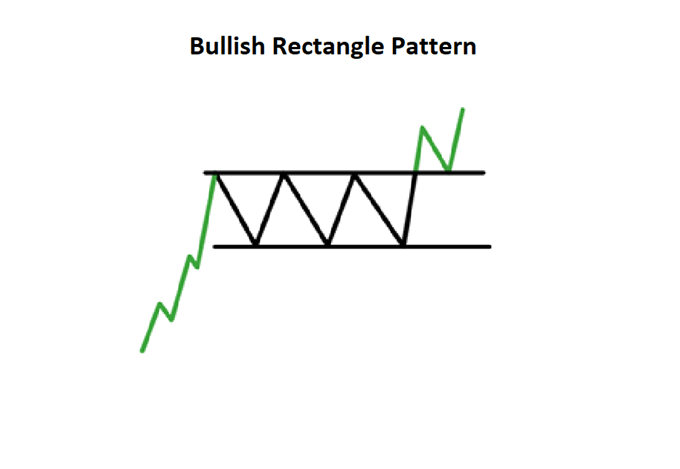
4. Bullish Rectangle pattern

The rectangle pattern characterizes a pause in trend whereby price moves sideways between a parallel support and resistance zone. The pattern indicates a consolidation in price before continuing in the original direction of the existing trend. The added benefit of this pattern is that traders have the opportunity to trade within the range or trade the eventual breakout, or both.

Bullish rectangle pattern

Bearish continuation candlestick patterns

Bearish continuation patterns appear midway through a downtrend and are easily identifiable. The bearish versions of the similar patterns introduced above have the same impact but in the opposite direction. The main bearish continuation patterns are introduced below.

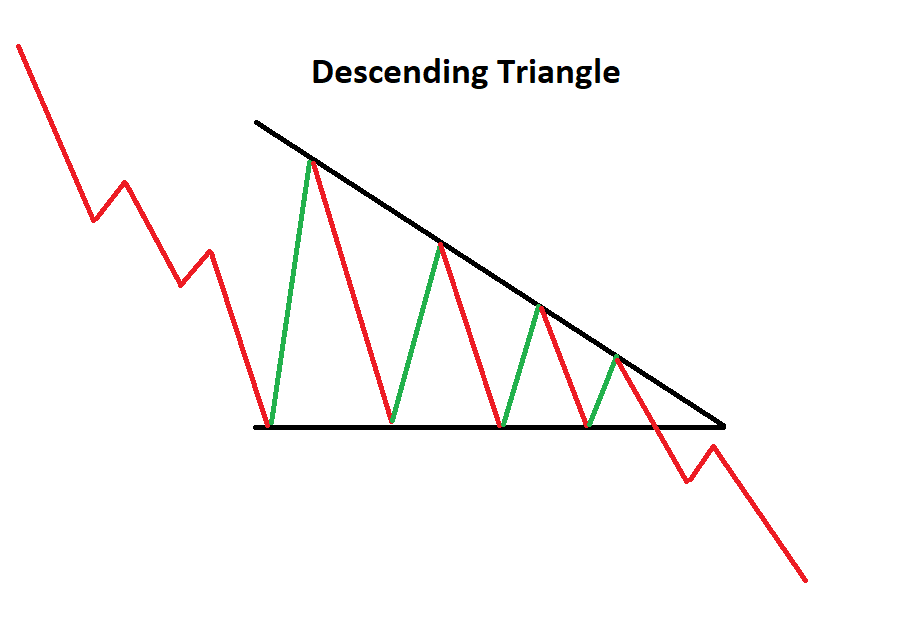
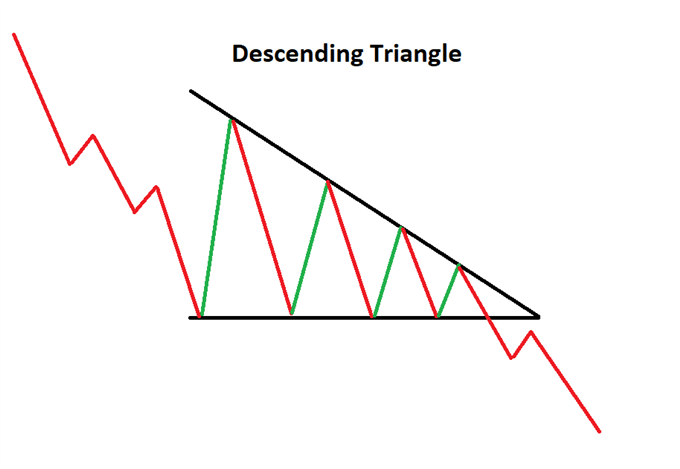
1. Descending Triangle

The descending triangle pattern is a consolidation pattern that occurs mid-trend and usually signals a continuation of the existing downtrend. The pattern is formed by drawing two converging trendlines (descending upper trendline and flat lower trendline), as price temporarily moves in a sideways direction. Traders look for a subsequent breakout, in the direction of the preceding trend, as a milestone to enter a trade.
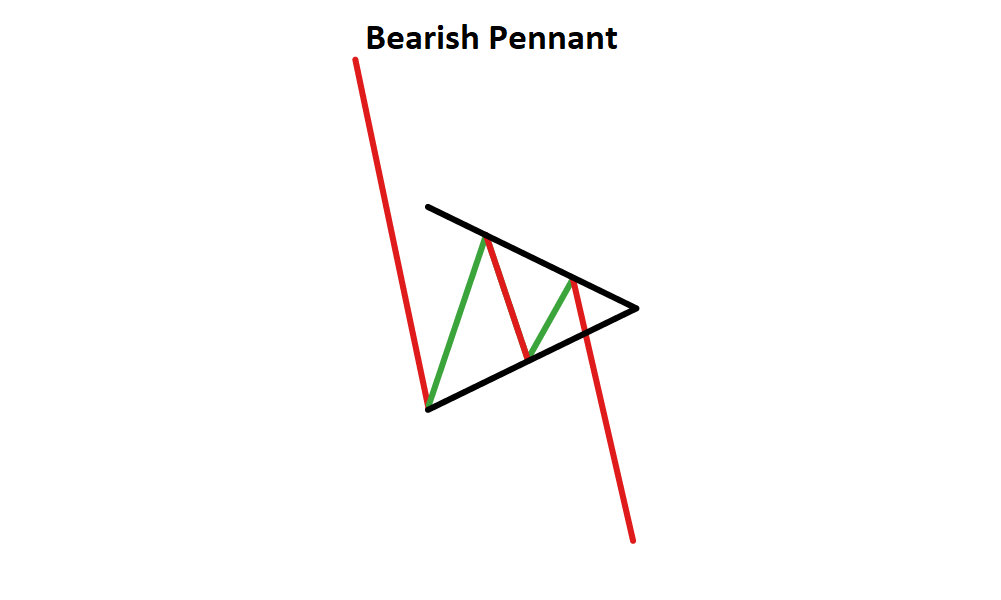
Descending triangle continuation pattern

2. Bearish Pennant

The bearish pennant is a continuation chart pattern that appears after a security experiences a large, sudden drop. It develops during a period of brief consolidation, before price continues lower, in the direction of the prevailing trend.
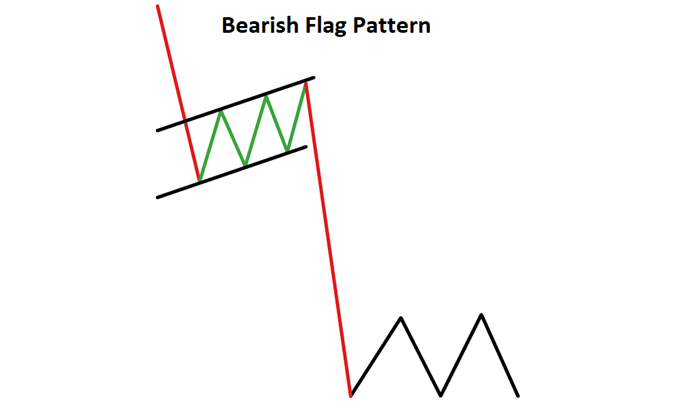
bearish pennant continuation pattern

3. Bearish flag

Just like the bullish flag, the bearish flag is often associated with explosive moves before and after the appearance of the flag.

The bear flagis characterized by an upward sloping channel denoted by two parallel trendlines slanting against the preceding trend.The flag is not to be confused with the rectangle pattern. The flag is completed in a much shorter time period (one to three weeks) compared to the rectangle pattern and has a noticeable gradient.
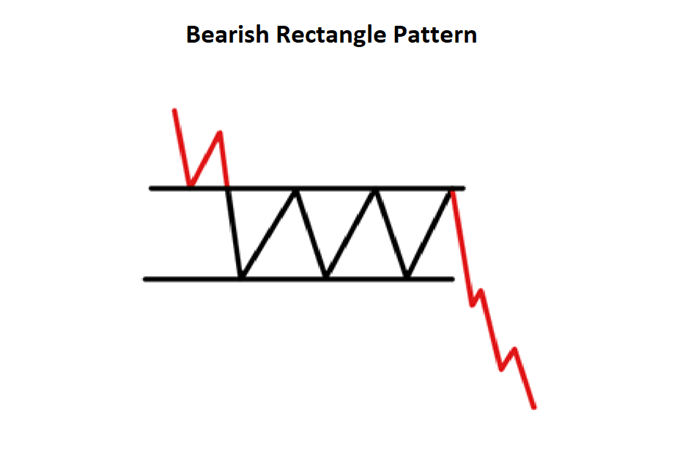
bearish flag candlestick pattern

4.Bearish Rectangle

The bearish rectangle pattern characterizes a pause in trend whereby price moves sideways between a parallel support and resistance zone. The pattern indicates a consolidation in price before continuing in the original direction of the existing trend. Traders have the opportunity to trade within the range or trade the eventual breakout, or both.

Bearish rectangle pattern

Trading continuation patterns

Continuation patterns tend to be goodindicators of future price movement,provided traders adhere to the following tips:

  1. Identify the direction of the trend before price starts to consolidate.
  2. Make use of trendlines to identify which continuation pattern may be developing.
  3. After successfully identifying the continuation pattern, set appropriate stops and limits while adhering to a positive risk to reward ratio.
  4. Traders can wait for a strong breakout in the direction of the trend before entering. Furthermore, traders should consider placing a tight stop to protect from a false breakout and trail this stop if the market moves favorably. Consider this and other risk management strategies to employ.

Are continuation patterns the same for forex and stock trading?

Yes, continuation patterns are the same for forex and stock trading. While there are noticeable differences when comparing forex vs stocks, continuation patterns can be applied with the same conviction. It’s not about the market itself, but is more about what the pattern reveals about price action.