How to Trade Bullish Flag Patterns

How to Trade Bullish Flag Patterns

The bull flag pattern is a great pattern to add to a forex trader’s technical arsenal. Explosive moves are often associated with the bull flag. This article will look at the potentially higher probability forex trading opportunities of the bull flag pattern.

Learn to trade the bull flag pattern: Main talking points

  • What is a bull flag?
  • How to identify a bullish flag on forex charts
  • Bull flag trading strategy
  • How reliable is the bull flag?
  • Bull flag vs bear flag

What is a bull flag?

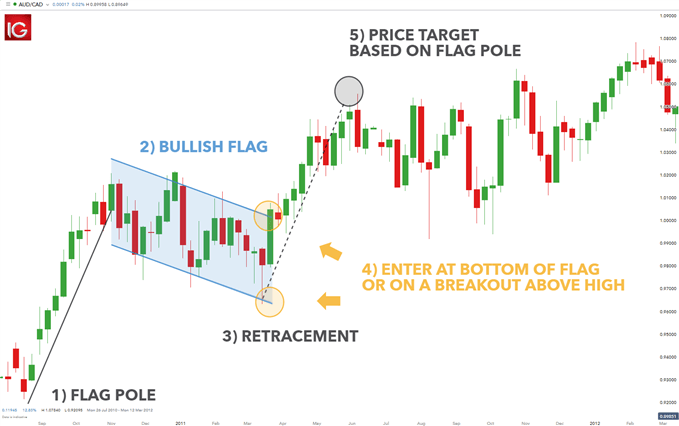
A bull flag is a continuation pattern that occurs as a brief pause in the trend following a strong price move higher. The bull flag chart pattern looks like a downward sloping channel/rectangle denoted by two parallel trendlines against the preceding trend.

During this period of consolidation, volume should dry up through its formation and resolve to push higher on the breakout. The actual price formation of the bull flag resembles that of a flag on a pole hence its namesake.

Bull flag pattern:
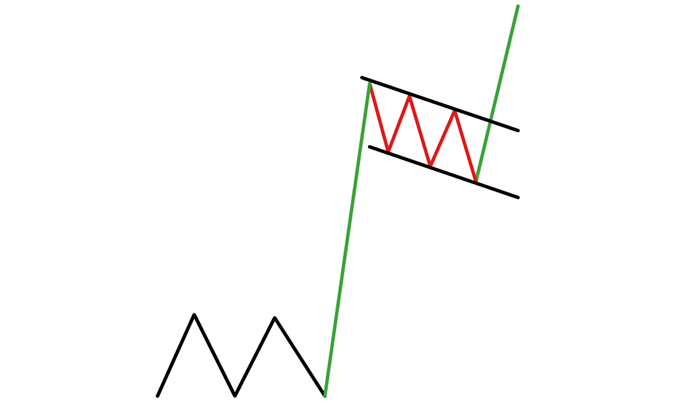
Please add a description for the image.

How to identify a Bullish Flag on Forex Charts

It can be complex identifying a bull flag on a chart because the pattern entails several different components. Traders will need to correctly identify and understand these components to trade this pattern successfully. Key things to look out for when trading the bull flag pattern are:

  1. Preceding uptrend (flag pole)
  2. Identify downward sloping consolidation (bull flag)
  3. If the retracement becomes deeper than 50%, it may not be a flag pattern. Ideally, the retracement ends at less than 38% of the original trend
  4. Enter at bottom of the flag or on the breakout above the high of the upper channel boundary
  5. Look for price to break higher with a length potentially equal to the size of the flag pole

Bull Flag Trading Strategy

The following trading example shows the bull flag on a forex chart.

AUD/CAD bull flag pattern
Please add a description for the image.

As shown by the bull flag chart pattern above, traders have been buying risk through commodities, the stock market, and risk-based currencies. As a result, the AUD performed well against most other currencies in part because it offers a higher rate of return owing to its interest rate. Hence, traders have a fundamental back drop to support the technical picture for additional strength in AUD.

The AUD/CAD is no stranger to the flag pattern. The previous uptrend (flag pole) is noted in black. Prices consolidated in a gently downward sloping channel (blue). To trade the flag, traders can time an entry at the lower end of the price channel or wait for a break above the upper channel (yellow). Traders then look to take profits by projecting the length of the flag pole preceding the flag (black dotted line).

How reliable is the Bull Flag in forex trading?

The reliability of the bull flag pattern depends on the success of the checklist mentioned above. When all components of the bull flag are identified and present within the chart, the bull flag pattern is considered to be a formidable pattern to trade.

The table below identifies the advantages and limitations of the bull flag pattern:

ADVANTAGES LIMITATIONS
Works in all financial markets Can be complex for novice traders
Pattern helps determine entry and limit levels
Good risk-reward ratio

Bull Flag vs Bear Flag

The bull flag and bear flag represent the same chart pattern however, just mirrored.

  • The bear flag appears in a downtrend as opposed to the bull flag which occurs in an uptrend
  • The bear flag pattern will breakout from the consolidation once price breaks the lower channel
  • Both the bear and bull flag chart patterns measure the target price as a projection using the length of the flagpole
Bitcoin (BTC) News Today: ETH Outmuscles BTC Amidst ETH-Spot ETF Market Uncertainty

Bitcoin (BTC) News Today: ETH Outmuscles BTC Amidst ETH-Spot ETF Market Uncertainty

Fed Interest Rate Decision, FOMC Projections, and Fed Chair Powell

On Wednesday, the US Federal Reserve left interest rates at 5.50%. Significantly, the Fed eased fears of a less dovish Fed interest rate trajectory. The FOMC projected a 2024 median Fed Funds Rate of 4.60%, unchanged from December. An upward revision to the 2024 growth forecast was also market-friendly.

BTC reacted to the FOMC economic projections and climbed to a Wednesday session high of $68,243 after the FOMC Press Conference. Fed Chair Powell expected to see Fed rate cuts later in the year, aligning with recent testimony on Capitol Hill.

The Fed Effect
BTCUSD 210324 Hourly Chart

BTC-Spot ETF Market Flow Data Aligns with Fed Policy Outlook

On Wednesday (Mar 20), BTC rallied 9.68%. Reversing an 8.37% tumble from Tuesday, BTC ended the session at $67,996.
BTC-spot ETF market flow data reflected investor angst before the Fed interest rate decision and Fed relief.

On Tuesday (Mar 19), the BTC-spot ETF market saw net outflows of $326.2 million, the highest since launching on Jan 11. Reducing bets on a June Fed rate hike pressured buyer demand for BTC.

Significantly, iShares Bitcoin Trust (IBIT) saw net inflows of $75.2 million, with Fidelity Wise Origin Bitcoin Fund (FBTC) seeing net inflows of $39.6 million. Grayscale Bitcoin Trust (GBTC) continued to record elevated net outflows. On Mar 19, GBTC saw net outflows of $443.5 million, down from $642.5 million on Mar 18. (Source: BitMEX Research).

Post-Fed BTC-Spot ETF Market Flow Data for Mar 20 in the Spotlight

Early BTC-spot ETF market flow data for Wednesday (Mar 20) may signal another choppy BTC session.

According to provisional numbers from Farside Investors, FBTC saw net inflows of $12.9 million. GBTC saw net outflows of $386.6 million. Based on available flow data, IBIT must see net inflows above $313.7 million for the BTC-spot ETF market to avoid a third session of net outflows.

ETH Outmuscles BTC Amidst Falling Odds of an ETH-Spot ETF Market

ETH surged 11.36% on Wednesday. Reversing a 10.27% loss from Tuesday, ETH closed the Wednesday session at $3,518.

Despite the Wednesday rebound, sentiment toward the SEC approving one, some, or all of the ETH-spot ETF applications remained weak.

Bloomberg Intelligence Senior ETF Analyst Eric Balchunas shared a timeline comparison of BTC-spot ETF and ETH-spot ETF comments from the SEC, saying,

“James Seyffart has great note out today explaining our 25% odds, i love this timeline comparison chart. Btc spot comments from SEC came 91 days bf final deadline. We curr 65 days away with eth etf deadline. Tick tock..”

Significantly, the SEC has provided no comments, with 51 – 22 days remaining until the May approval window.

Chances of May approval look slimmer.
BTC v ETH SEC Comments Timelines

Technical Analysis

Bitcoin Analysis

BTC sat well above the 50-day and 200-day EMAs, affirming the bullish price signals.

A BTC break above the $69,000 resistance level would support a move toward the ATH of $73,808. A return to the ATH could give the bulls a run at the $75,000 handle.

On Thursday, BTC-spot ETF flow data for Mar 20 and Mar 21 warrant investor attention.

Conversely, a fall through the $65,000 handle could give the bears a run at the $64,000 support level.

The 14-Daily RSI reading, 56.76, suggests a BTC return to the ATH $73,808 before entering overbought territory.

BTC Daily Chart sends bullish price signals.
BTCUSD 210324 Daily Chart

Ethereum Analysis

ETH remained above the 50-day and 200-day EMAs, sending bullish price signals.

An ETH return to the $3,750 handle would support a move to the $3,835 resistance level. A breakout from the $3,835 resistance level would give the bulls a run at the Mar 11 high of $4,065.

Crypto-spot ETF-related chatter needs consideration.

Conversely, an ETH break below the $3,480 support level could signal a drop to the 50-day EMA and the $3,244 support level. Buying pressure could intensify at the $3,244 support level. The 50-day EMA is confluent with the support level.

The 14-period Daily RSI at 51.00 indicates an ETH return to the $4,000 handle before entering overbought territory.

ETH Daily Chart sends bullish price signals.
ETHUSD 210324 Daily Chart
EUR/USD, GBP/USD, DXY Price Forecast: PMI Data and BoE Monetary Policy In Focus

EUR/USD, GBP/USD, DXY Price Forecast: PMI Data and BoE Monetary Policy In Focus

The recent Federal Funds Rate announcement, maintaining the rate at 5.50%, sets the backdrop for upcoming market movements. This decision underscores the Federal Reserve’s current stance on monetary policy and its implications for the US dollar.

Events Ahead

Today, noteworthy releases include the Eurozone’s Flash Manufacturing and Services PMIs, alongside the ECB Economic Bulletin. Amidst expectations of sluggish figures such as the German Flash Manufacturing PMI at 43.1, markets anticipate insights into the region’s economic health and potential policy directions.

Simultaneously, the UK unveils its Monetary Policy Summary and releases Flash Manufacturing and Services PMIs, revealing trends in the nation’s industrial and service sectors. Of particular interest are the MPC Official Bank Rate Votes, offering glimpses into the Bank of England’s stance on interest rates.

These events, alongside US releases like Unemployment Claims, Philly Fed Manufacturing Index, and Existing Home Sales, provide a comprehensive view of global economic sentiment.

With figures like the Eurozone’s Flash Manufacturing PMI hovering around 47.0 and the UK’s Flash Services PMI at 53.8, market participants await these releases with heightened anticipation, poised for potential market volatility and directional cues.

US Dollar Index (DXY)

Dollar Index
Dollar IndexThe Dollar Index experienced a modest decline of 0.12%, settling at 103.271. Positioned just below its pivot point of 103.330, the index shows signs of bearish pressure yet hovers near a potential turning point.

Resistance levels at 103.625, 103.987, and 104.295 may pose challenges for upward movement, while support at 103.016, 102.682, and 102.365 offers a cushion against further declines.

The 50-Day and 200-Day EMAs, at 103.443 and 103.539 respectively, hint at a near equilibrium in market sentiment. Overall, the Dollar Index’s future direction hinges on its ability to surpass the 103.330 pivot, with a move above potentially signaling a shift towards bullish momentum.

EUR/USD Technical Forecast

EUR/USD Price Chart - Source: Tradingview
EUR/USD Price Chart – Source: Tradingview

GBP/USD Price Chart - Source: Tradingview
GBP/USD Price Chart – Source: TradingviewThe GBP/USD pair edged slightly higher by 0.06%, trading at 1.27930, as it flirted with the pivot point at 1.2796. This level is pivotal for determining the pair’s short-term direction, with immediate resistance mapped at 1.2824, 1.2864, and 1.2894.

These points could challenge further bullish momentum. Support levels at 1.2757, 1.2717, and 1.2668 provide potential safety nets against declines. The technical landscape, underscored by the 50-Day and 200-Day Exponential Moving Averages at 1.27473 and 1.27059 respectively, hints at a cautiously optimistic outlook.

However, the market remains in a precarious balance; a decisive move above 1.2796 may signal a bullish shift, while failure to breach this threshold could sustain bearish pressures.

Bitcoin (BTC) price forecast: $75k Rebound Begins as Whales Flip Bullish

Bitcoin (BTC) price forecast: $75k Rebound Begins as Whales Flip Bullish

Price Insights:

Bitcoin (BTC) price rebounded 9% within the daily timeframe on March 20, peaking at $67,857 after the US Fed announced a third consecutive rate pause. On-chain data trends shows that BTC whales have started buying again after a week look market pullback.

Will the ongoing recovery phase send BTC price above $75,000 before the halving ?

Bitcoin Whales have Started Buying Again

Despite higher-than-expected inflation figures last month, the US Fed announced a third-consecutive rate pause at the last FOMC meeting on March 2024. This has sparked bullish reaction across major risk assets markets including the cryptocurrency sector.

Within 24 hours of the Fed rate decision announced around 2 pm ET on March 20, BTC price races into an instant 9% rebound peaking at $68,000 within the daily timeframe. On-chain data shows that US-base whale investors have played a pivotal part in the ongoing BTC price recovery phase.

Cryptoquant’s Coinbase premium index tracks the level of buying activity among US-based institutional investor trading on Coinbase pro.

Essentially, it compares the current BTC prices on Coinbase pro against the price quoted on Binance. When Bitcoin price is trading at a premium on Coinbase, it signals that intense market demand among whales investors, and viceversa.

Bitcoin (BTC) Coinbase Premium Index vs. Price | Source: CryptoQuant
Bitcoin (BTC) Coinbase Premium Index vs. Price | Source: CryptoQuantThe chart above shows that the Coinbase Premium Index for Bitcoin surged to a 7-day peak of 0.026% on March 20. This signals that the US-based whales swung into action and started buying more BTC following the positive Fed rate announcement.

Strategic investors consider it bullish signal when whales tune up their buying activity. Firstly, it increased market liquidity and their outsized demand also of the drives up prices.

A closer look at the chart also shows that Bitcoin price has often entered a major upswing when the Coinbase premium has swung into positive values after multiple days in recess.

If this rare market trend re-occurs, bull could capitalize on the ongoing rebound phase to drive the rally towards 200%

Bitcoin Price Forecast: Bears could mount roadblock at $69,000

Bitcoin has witnessed increased whale demand since the Fed rate pause announcement, which could potentially drive BTC price toward $75,000 if sustained.

However,  the current Bitcoin liquidation map compiled by Coinglass shows that the bears could mount a significant resistance at the $69,000.

Bitcoin (BTC) price prediction |March 2024 |Source: Coinglass
Bitcoin (BTC) price prediction |March 2024 |Source: CoinglassAs seen above, the bears stand to lose over $1 billion in short liquidations if BTC price breaks above that $69,000. However, the flat lines after that range suggests that Bitcoin face minimal resistance if it advance above $70,000.

In the even of other market downturn, the BTC bull can count on the $65,000 support in the near-term.

Natural Gas and Oil Forecast: Geopolitical Tensions Fuel Demand; Buy Now?

Natural Gas and Oil Forecast: Geopolitical Tensions Fuel Demand; Buy Now?

The oil market experienced a resurgence as U.S. crude and gasoline stock drawdowns bolstered prices, despite the Federal Reserve’s indications of maintaining higher interest rates for an extended period. The latest reports revealed a surprising decline in U.S. crude inventories, dropping by 2 million barrels, contrary to expectations of a slight increase.

This reduction, coupled with a continued decrease in gasoline stockpiles, signals robust fuel demand. However, the Federal Reserve’s decision to hold interest rates steady raises concerns about potential impacts on economic growth and future fuel demand.

Moreover, geopolitical tensions, including Ukrainian attacks on Russian oil refineries, contribute to uncertainties surrounding global petroleum supplies, further influencing oil and natural gas forecasts.

Natural Gas Price Forecast

Natural Gas
Natural GasNatural Gas (NG) marked a notable rise in its March 21 trading session, climbing by 0.77% to $1.8320. This uptrend is anchored above a critical pivot point of $1.8141, suggesting a strengthening bullish momentum. Resistance levels are charted at $1.8757, $1.9118, and $1.9500, delineating the hurdles NG might encounter if it continues its ascent.

Conversely, support levels at $1.7820, $1.7539, and $1.7191 provide a cushion, mitigating potential pullbacks. The 50-Day and 200-Day Exponential Moving Averages, at $1.8294 and $1.9145 respectively, hint at the ongoing positive sentiment.

A downturn below $1.8141, however, could signal a trend reversal, emphasizing the need for cautious optimism among traders.

WTI Oil Price Forecast

WTI Price Chart
WTI Price Chart

The 50-Day and 200-Day Exponential Moving Averages, at $80.71 and $78.40 respectively, further underscore the bullish outlook. Should USOIL dip below $81.43, a shift towards a bearish trend might ensue, calling for close market observation.

Brent Oil Price Forecast

WTI brent Price Chart

Gold, Silver, Copper Daily Forecast: Fed Signals Boost Metals; Correction Ahead?

Gold, Silver, Copper Daily Forecast: Fed Signals Boost Metals; Correction Ahead?

Market Overview

Gold prices soared to unprecedented heights in the Asian market on Thursday, influenced by the U.S. Federal Reserve’s decision to maintain steady interest rates and hint at potential rate reductions within the year. The drop in the dollar post-Fed meeting spurred a significant upswing across the commodity sector, propelling copper towards 11-month peaks and elevating other precious metals.

Market participants now largely anticipate a rate cut by June, with a 73.4% probability. However, the Fed’s improved economic outlook for 2024 suggests a balanced perspective that might temper gold’s safe-haven appeal amidst a recovering U.S. economy.

Silver has also witnessed sharp increases, reflecting the broader momentum in precious metals. Meanwhile, copper’s rally gained momentum, with market focus shifting to upcoming purchasing managers index readings for further demand indicators.

Gold Prices Forecast

Gold - Chart
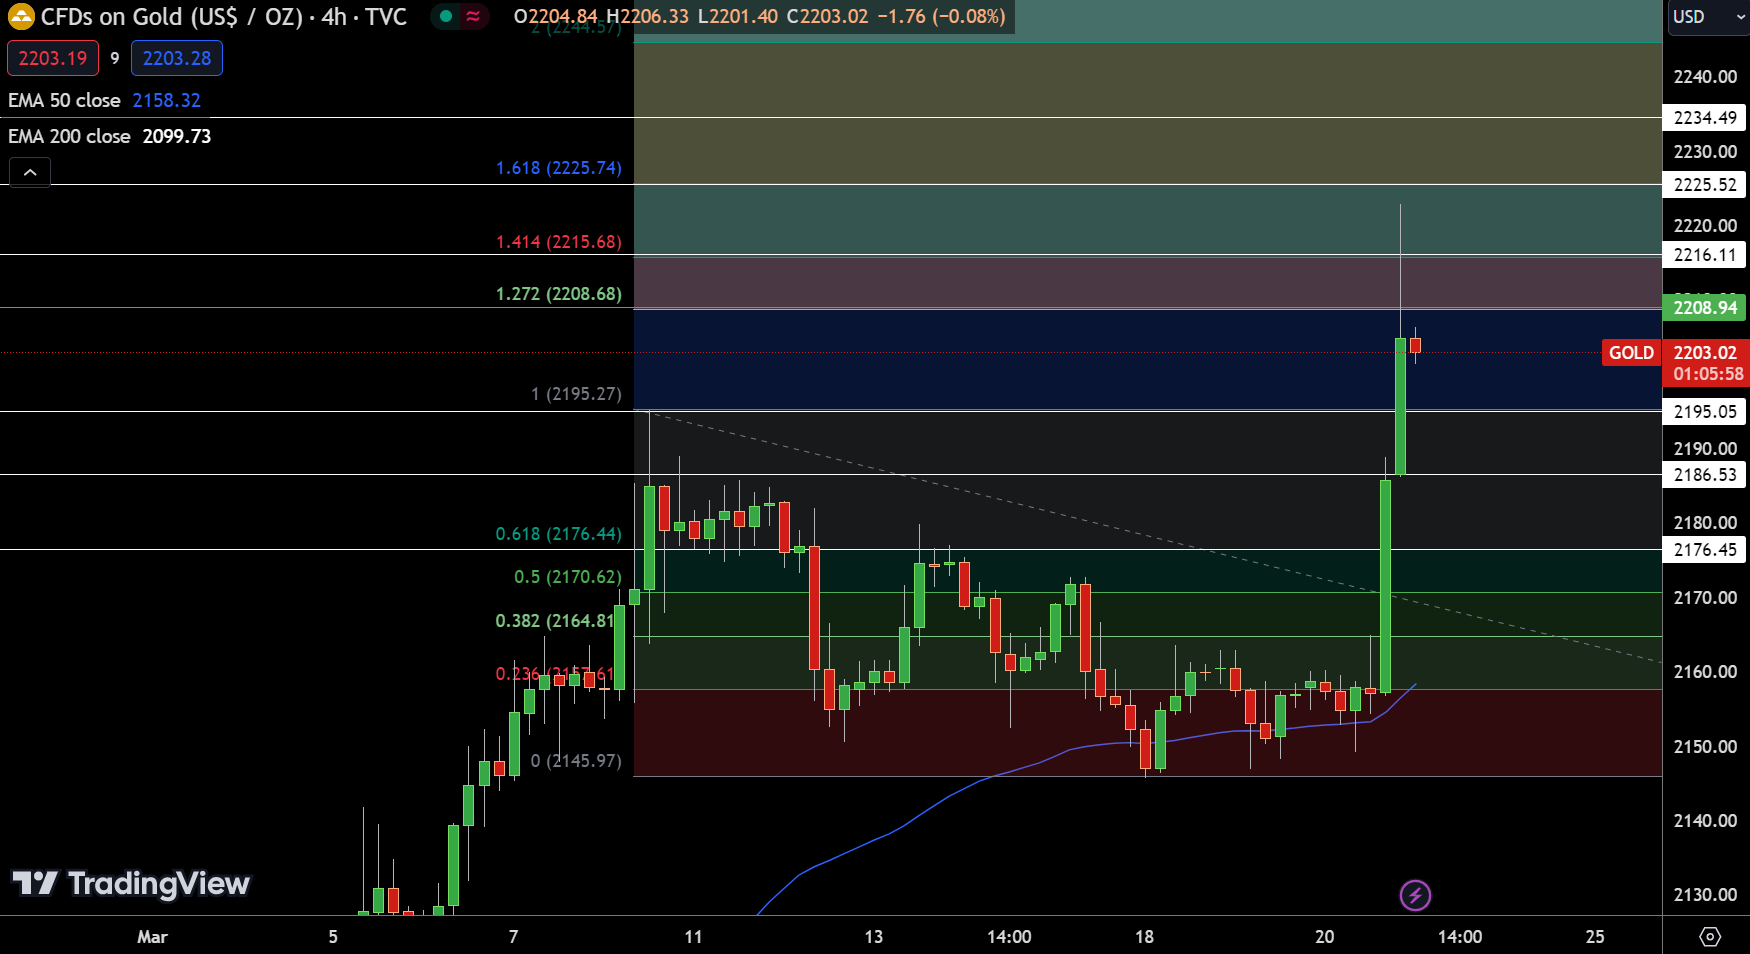
Gold – ChartOn March 21, Gold demonstrated resilience, rising by 0.78% to trade at $2203.02. The pivot point at $2208.94 emerges as a crucial marker for the asset’s trajectory. Resistance levels at $2216.11, $2225.52, and $2234.49 delineate the thresholds for further ascents.

Conversely, support levels at $2195.05, $2186.53, and $2176.45 offer floors for potential pullbacks. Technical indicators, including the Relative Strength Index (RSI) and the 50-Day and 200-Day Exponential Moving Averages at $2158.32 and $2099.73 respectively, hint at a nuanced outlook.

The current stance suggests a bearish trend below $2208.94, yet surpassing this pivot could signal a shift towards bullish momentum.

Silver Prices Forecast

Silver - Chart
Silver – Chart

Silver edged higher, increasing by 0.21% to a price of $25.63, as market participants weighed various economic indicators and market sentiments. The pivot point at $25.45 serves as a pivotal juncture for future price movements, with resistance levels observed at $25.78, $26.15, and $26.44.

These levels could cap further gains should the metal attempt to ascend. Support levels at $25.14, $24.78, and $24.52 provide a safety net against potential declines.

The 50-Day and 200-Day Exponential Moving Averages, at $24.79 and $23.80 respectively, suggest a bullish outlook for Silver as long as it maintains above the $25.45 mark. A move below this pivot point, however, could signal a shift to a bearish trend, necessitating a strategic reassessment for traders and investors.

Copper Prices Forecast

Copper - Chart
Copper – ChartCopper’s price experienced an uptick of 0.42%, reaching $4.11466, reflecting positive momentum in the commodities market. The pivot point at $4.09 represents a critical threshold, with immediate resistance levels at $4.14, $4.17, and $4.21 poised to challenge upward movements.

Conversely, support levels at $4.04, $4.00, and $3.95 provide a foundational base, potentially arresting any declines. The 50-Day and 200-Day Exponential Moving Averages, at $4.04 and $3.92 respectively, underscore a bullish sentiment, as long as the price sustains above the $4.09 mark.

A dip below this pivot could indicate a bearish shift, necessitating caution among traders.

Leading Indicators Defined and Explained

Leading Indicators Defined and Explained

What is a Leading Indicator?

A leading indicator is a technical indicator that uses past price data to forecast future price movements in the forex market. While there is no single indicator that forecasts future prices with 100 percent accuracy, traders will be able to view how price could unfold in the future and then apply further analysis to spot ideal entries into the market.

The opposite of a leading indicator is a lagging indicator and while they both make use of past data – lagging indicators use past data to project future price levels. Lagging indicators use past price data to confirm a recent change in price.

What are some examples of leading indicators?

The main, generally accepted, leading indicators include:

  • Fibonacci Retracements
  • Donchian channel
  • key levels of support and resistance.

These will be presented and briefly discussed below.

Fibonacci Retracements

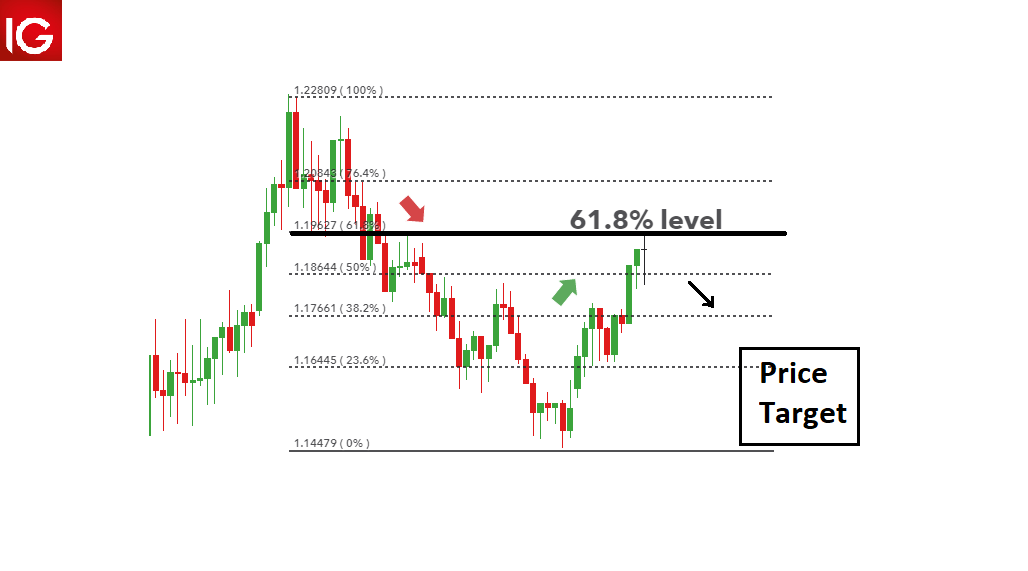
In short, the Fibonacci retracement consists of numbers or ratios that are mathematically significant numbers that occur throughout nature and often in financial markets. The most important number or ratio is the 61.8% or .618 levels. In Forex trading, Fibonacci retracements can identify future possible levels of support and resistance.

The EUR/USD chart below shows maps out the direction that future prices may approach, if the 61.8% level is respected.

Leading indicator Fibonacce retracement forecasting price.

The 61.8% level was respected and the market resumed the broader downtrend and proceeded through the initial price target box to make a series of lower lows.

leading indicator Fibonacci retracement

Donchian Channel

The Donchian channel calculates the highest high and the lowest low for the past X number of periods and presents this as an upper line and lower line. The upper and lower lines get updated as price continues to move.

The Donchian channel indicator is great for breakout or reversal trades in strong trending markets. For example, the USD/JPY chart below, shows how Donchian channels can help traders to trade a breakout

  1. Price starts out making lower lows and touches the lower bound of the channel before moving up.
  2. Price breaches the upper channel after a touch of the lower channel, providing the first bullish signal. A break of the upper channel after a touch on the lower channel is seen as the first signal for a long trade.
  3. The upper channel at point number 2 extends a horizontal line to the right, corresponding with the recent high. This acts as resistance and serves as further confirmation if price breaks above this level – which it does. Even though there is a large retracement, price does not breach the lower channel and eventually moves back up and past point 3.

A long signal is triggered when price rises off the lower channel (1) to breach the upper channel for the first time (2).

Donchian channel as a leading indicator

The upper channel line extends to the right and provides a level of resistance to be tested or respected. With a long bias, traders will be looking for price to break this level, creating higher highs.

Donchian channel leading indicator

Even though there is a large retracement between point (2) and (3), price does not breach the lower channel and eventually moved back up to create a new high at point (3).

In an upward move like the one seen above, traders can utilise the lower channel as a manual trailing stop and adjust it upwards as the market advances.

Key Levels of Support and Resistance

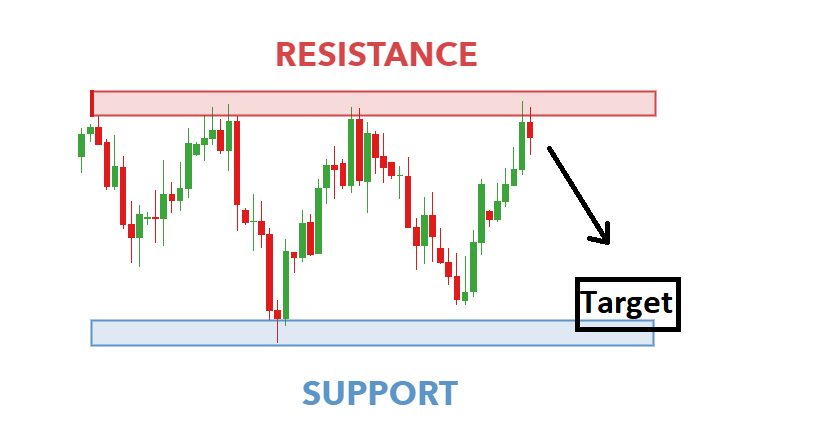
Key levels of support and resistance occur when price approaches a particular level, multiple times, without breaking through it. This often results in price bouncing off two key levels in a range. Knowing where price has been before can assist traders to assess where the target should be placed.

support and resistance as a leading indicator

In this example, price has approached resistance and turned, meaning the target should be placed at or just above support and a stop can be placed above resistance; while maintaining a positive risk to reward ratio. Price continued to move down and subsequently hit the target level.

support and resistance as a leading indicator

 Benefits of leading indicators

Leading indicators are by no means a crystal ball, but they do allow the trader to visualize the various ranges where future price could trade. When having an idea of future price movements, traders are better placed to identify targets and stops with a greater accuracy.

Leading indicators provide the following benefits:

  1. Presents a clear directional bias
  2. Provides traders with a target level
  3. Provides traders with a stop loss level
  4. Leading indicators are not limited to just one indicator
  5. Leading indicators can act as a filter (i.e. trades that do not line up with the indicator can be disregarded)

Leading Indicators: A Summary

Leading indicators provide traders with indications of future price movements and by extension, clear stops and limits. Due to the fact that there is uncertainty when trading the financial markets, traders cannot afford to adopt a laid-back approach to risk management simply because a leading indicator provides a direction and level for future price movements. Remember that prudent risk management should be adopted at all times.

The Bank of England: A Forex Trader’s Guide

The Bank of England: A Forex Trader’s Guide

What is the Bank of England (BOE)?

Established in 1694, the Bank of England is the banker to, and owned by, the British government but is independent when setting monetary policy. Its roles include the setting of monetary policy – which includes targeting interest rates and using other tools to stimulate or contract the economy – producing the UK’s bank notes, supervising some bank payment systems, and ensuring the stability and safety of the financial system.

For traders, the BOE’s setting of monetary policy is a key factor to consider as it can have a big impact on the financial markets. Other factors, like the independence of the central bank are also important but are more prevalent issues in emerging market economies.

Key Economic Mandates of the Bank of England

According to the Bank of England, their two core purposes or mandates are:

1) Monetary stability – which is price stability or inflation

2) Financial stability – which is the stability and health of the economy

Monetary Stability

Monetary policy is extremely important for the entire economy. It prevents runaway inflation and attempts to ground inflation expectations so that the economy can grow at a regular pace. In order to maintain price stability, the Bank of England and their monetary policy committee (MPC) have set an inflation target of 2%.

If inflation goes above the target of 2% the Bank of England may increase interest rates. The increase in interest rates may cause an appreciation in the Pound as investors increase capital flows into the higher yielding currency. It may also have a negative affect on the stock market, as businesses will have to pay higher rates to lend and equity valuations will be discounted at a higher interest rate. Monetary policy data can be found on our economic calendar.

However, it is not always the case that the Bank of England will increase interest rates if inflation is above target. In some cases, like when GDP growth is still low or negative, the Bank of England may keep interest rates low to stimulate the economy. It is important to know the Bank of England will be looking for a balance between healthy inflation and economic growth.

Join our central bank webinar to watch our senior currency strategist discuss and analyze current central bank trends.

Financial Stability

The resilience of the financial system is paramount to the health of the UK economy and therefore necessary for the Bank of England to accommodate. To support Financial Stability mandates, the bank also has a Financial Policy Committee or FPC which was established in June 2011. From an FX point of view, the Monetary Stability is the key driver of spot rates for the GBP.

 How BOE interest rates affect the Pound

Interest rate impact on the Pound

The Bank of England can affect the value of the Pound through changes in interest rate expectations. Traders should understand that currencies appreciate when interest rate expectations increase, not just from increases in the nominal interest rate.

For example, if the Bank of England keeps interest rates unchanged but issues forward guidance (tells the market) that they expect more interest rate hikes in future, the value of the Pound will appreciate. Likewise, decreases in future interest rate hike expectations, or expectations of an interest rate cut can lead to a decrease in the value of the Pound.

This is the general principle for how interest rates affect the Pound and stock market, although they sometimes react differently:

  1. Higher interest rate expectations increase the strength of the Pound (GBP) and negatively affect equity values.
  2. Lower interest rate expectations decrease the strength of the Pound (GBP) and positively affect equity values.

Interest rates aren’t the only monetary policy tool that can affect the currency, tools like quantitative easing can also lead to increases and decreases in the value of a currency. If the Bank of England announces that it plans to start a quantitative easing program (QE), the pound will likely depreciate as a large amount of liquidity enters the market, increasing the supply of money in the market and leading to a decrease in interest rates, or, simply to maintain current rates.

Interest rate impact on the economy

The Bank of England lowers interest rates when it is trying to stimulate the economy (GDP) and increases interest rates when it is trying to contain inflation caused by an economy operating above potential (overheating).

Lower interest rates stimulate an economy in a few ways:

  1. Businesses can borrow money and invest in projects that will receive more than the risk borrowing rate.
  2. When interest rates are lower the stock market is discounted at a lower rate, leading to an appreciation in stock market values which causes a wealth effect.
  3. People invest their money into the economy (stocks and other assets) because they can earn more in these assets than at currently low interest rates.

How to trade BOE interest rate decisions

The table below displays the possible scenarios that come from a change in interest rate expectations. Traders can use this information to forecast if the currency is likely to appreciate or depreciate and how to trade it.

Market expectations Actual Results Resulting FX Impact
Rate Hike Rate Hold Depreciation of currency
Rate Cut Rate Hold Appreciation of currency
Rate Hold Rate Hike Appreciation of currency
Rate Hold Rate Cut Depreciation of currency

Let’s look at the example below on GBP/USD. On August 4, 2016 the Bank of England cut interest rates and announced a stimulus package (quantitative easing program). The market reacted negatively and the Pound depreciated.

Bank of England cuts interest rate to new low

Top Takeaways of the BOE and Forex Trading

  • The Bank of England is fundamental to the value of the Pound
  • The Pound will appreciate or depreciate depending on changes in interest rate expectations, not just on actual changes.
  • Quantitative easing has a similar effect to changes in interest rates. Changes in expectations of quantitative easing will have an effect on the Pound.
  • Rising inflation does not mean the Bank of England will increase interest rates, it depends on the balance between economic growth and inflation.
The Psychology of Speculation in the Forex Market

The Psychology of Speculation in the Forex Market

Forex speculation is the name of the game in trading. Every trader, at some point or another, has to click ‘buy’ or ‘sell’ and commit to a position based on their analysis even though there is no guarantee of success. Unfortunately for traders, the market can have a very different viewpoint of the market and this can bring about a moment of serious introspection.

This article seeks to deal with some of those hard-hitting questions and explores the following:

  • What is speculation in the foreign exchange market?
  • What happens when it all goes wrong?
  • Top 4 tips to speculate like a successful trader

What is speculation in the forex market?

Speculation in the foreign exchange market involves the buying and selling of currencies with the view of making a profit. It is called speculation because of the uncertainty involved as no one can say for sure whether the market will be going up or down. Traders assess the likelihood of either scenario before placing a trade.

What happens when it all goes wrong?

After you’ve developed a trading strategy centered around forex speculation and learned the basics of the market – you have many of the tools that are needed to be successful. And when that success doesn’t come, numerous questions can swirl around inside your head.

“Am I trading the right strategy?”, “Do I really know what I’m doing?”

These questions/doubts are not unique. Most traders have these thoughts at some stage or another and have learned how to overcome them. Let’s address these questions directly:

1) Am I Trading the Right Strategy?

Many traders don’t realize this early on – market conditions change over time. As a currency speculator, you can spend weeks analysing a specific market that suits your strategy at the time, but this is likely to change and when it does it will seem like nothing is working in your favour.

A perfect example of this can be seen when comparing EUR/USD in 2017 to the same currency pair in the first half of 2019.

In 2017, EUR/USD was is a strong uptrend for the majority of the year. Backtesting trend trading strategies would naturally yield attractive results and any reasonable trader would look to implement such a strategy.

currency speculation EUR/USD upward trend 2017

A very different picture can be seen below as EUR/USD trades sideways for the first six months of 2019, making things difficult for new trend traders. The red 200 day moving average helps make this point as it cuts through price many times and fails to provide a clear signal.

Forex speculation in EUR/USD 2019

Traders should dedicate some time to analyze whether or not market conditions have changed. It is very possible that the trading strategy is fine but the market no longer exhibits the characteristics that drew you to it in the first place.

2) Do I Really Know What I’m Doing?

“FAIL: First Attempt in Learning” – Anonymous

This is a difficult question to answer as this will depend on each trader’s knowledge and preparedness. Since this question cannot be answered, the next best thing to do is to look at what others have done wrong, learn from it, and avoid making the same trading mistakes.

At DailyFX we researched over 30 million live IG trades to discover the number one mistake traders make in our Traits of Successful Traders report. Understanding where it all goes wrong and making the necessary adjustments is the first step to trading like the professionals.

 4 Tips to speculate like a successful trader and get back on track

1) Don’t Let Risk Change Your Behaviour

The biggest psychological obstacle for traders is the perception of losses (and the concept of losing). For traders, the pain of closing a trade and realizing a loss outweighs the excitement of realizing a winning trade of equal magnitude.

Top traders apply sound risk management first and foremost. Traders can win two-thirds of all their trades and still land up blowing up the account in the absence of using stops. A natural consequence of this is that traders allow losing positions to run, while taking profit as soon as a position turns positive. The losses outweigh the winners and this should never happen.

One way to manage your emotions is to implement a trailing stop or manually move your existing stop when the market moves in your favor. This way, traders can relax knowing that they are breaking even and any further movement in your favor is purely profit.

Currency speculation using stops

Before placing a trade, know what level of risk you are prepared to take on and ensure that the risk to reward ratio is at least 1:1.

2) Bring a Positive Mindset to the Charts Every Day

Since you will inevitably be taking losses in this game of forex speculation, it’s important to deny those losses from altering your frame of mind.

Traders will often experience the disappointment of being stopped out and this can be very discouraging. As a result of this they take shortcuts on their analysis or question their own approach. This never ends well.

The key to keeping a positive mindset in trading is to look at losses in the same way that a business owner looks at expenses; simply as a cost of doing business. Because once you’ve learned to lose properly, and after you’ve learned to keep those losses in scope of the bigger picture – you’ve addressed biggest aspects of trading psychology.

3) Strike the delicate balance between fear and greed

These two drives can have a large bearing in the way we live our lives; and not just in trading. When trading, both fear and greed can be massively detrimental, as they can cloud your judgment and lead to bad decisions.

Most human beings will be greedy when they have a losing position; willing to hold on if only price can come back to their entry level. And when in a winning position, most human beings will begin to be fearful.

Traders should look to reverse those drives and to be greedy when they’ve been proven right. If fearful, you can use the breakeven stop to help alleviate the concern that your initial risk is still exposed.

4) Don’t let confidence get the best of you

After putting together a string of successes, it’s human nature to build up confidence around your dealings and this can be a good thing.

But once a trader has gone into the territory of being ‘over-confident’, risky habits may sneak into their approach, none more damaging than the willingness to bend their own trading rules simply because they feel it will be successful.

Therefore, traders should always look to strike that delicate balance between being scared or fearful, and over-confident.

Forex Candlesticks: A Complete Guide for Forex Traders

Forex Candlesticks: A Complete Guide for Forex Traders

Forex candlesticks explained

There are three specific points that create a candlestick, the open, the close, and the wicks. The candle will turn green/blue (the color depends on the chart settings) if the close price is above the open. The candle will turn red if the close price is below the open.

If you have the chart on a daily setting each candle represents one day, with the open price being the first price traded for the day and the close price being the last price traded for the day.

  • Open price: The open price depicts the first traded price during the formation of a new candle.
  • High price: The top of the upper wick. If there is no upper wick, then the high price is the open price of a bearish candle or the closing price of a bullish candle.
  • Low price: The bottom of the lower wick. If there is no lower wick, then the low price is the open price of a bullish candle or the closing price of a bearish candle.
  • Close price: The close price is the last price traded during the formation of the candle.

The image below shows a blue candle with a close price above the open and a red candle with the close below the open.

A blue and red candlestick showing open and close wicks

Why forex traders tend to use candlestick charts rather than traditional charts

Candlestick charts are the most popular charts among forex traders because they are more visual. Candlestick charts highlight the open and the close of different time periods more distinctly than other charts, like the bar chart or line chart.

Candlestick charts have certain advantages:

  • Forex price movements are perceived more easily on candlestick charts compared to others.
  • It is easier to recognize price patterns and price action on candlestick charts.
  • Candlestick charts offer more information in terms of price (open, close, high and low) than line charts.

However, there are some disadvantages of candlestick charts:

  • Candles that close green or red may mislead amateur forex traders into thinking that the market will keep moving in the direction of the previous closing candle.
  • Candlestick charts may clutter a page because they are not a simple as line charts or bar charts.

How to trade forex using candlestick charts

Candlestick formations and price patterns are used by traders as entry and exit points in the market. Forex candlesticks individually form candle formations, like the hanging man, hammer, shooting star, and more. Forex candlestick charts also form various price patterns like triangles, wedges, and head and shoulders patterns.

While these patterns and candle formations are prevalent throughout forex charts they also work with other markets, like equities (stocks) and cryptocurrencies.

Trading forex using candle formations:

The hanging man:

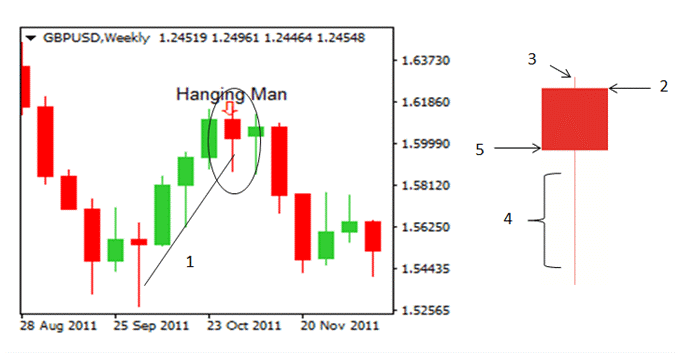
The hanging man candle, is a candlestick formation that reveals a sharp increase in selling pressure at the height of an uptrend. It is characterized by a long lower wick, a short upper wick, a small body and a close below the open.

It is a bearish signal that the market is going to continue in a downward trend. Learning to recognize the hanging man candle and other candle formations is a good way to learn some of the entry and exit signals that are prominent when using candlestick charts.

The chart below shows the GBP/USD on a weekly timeframe. This means that each candle depicts the open price, closing price, high and low of a single week. The hanging man candle below (circled) is a bearish signal. Traders use bearish signals like this to enter short trades, a bet on the GBP depreciating relative to the USD.

If a trader uses the hanging man to execute a short trade, he/she should then place a stop loss and a take profit with a positive risk-reward ratio.

Hanging man chart pattern showing stop

The Shooting Star

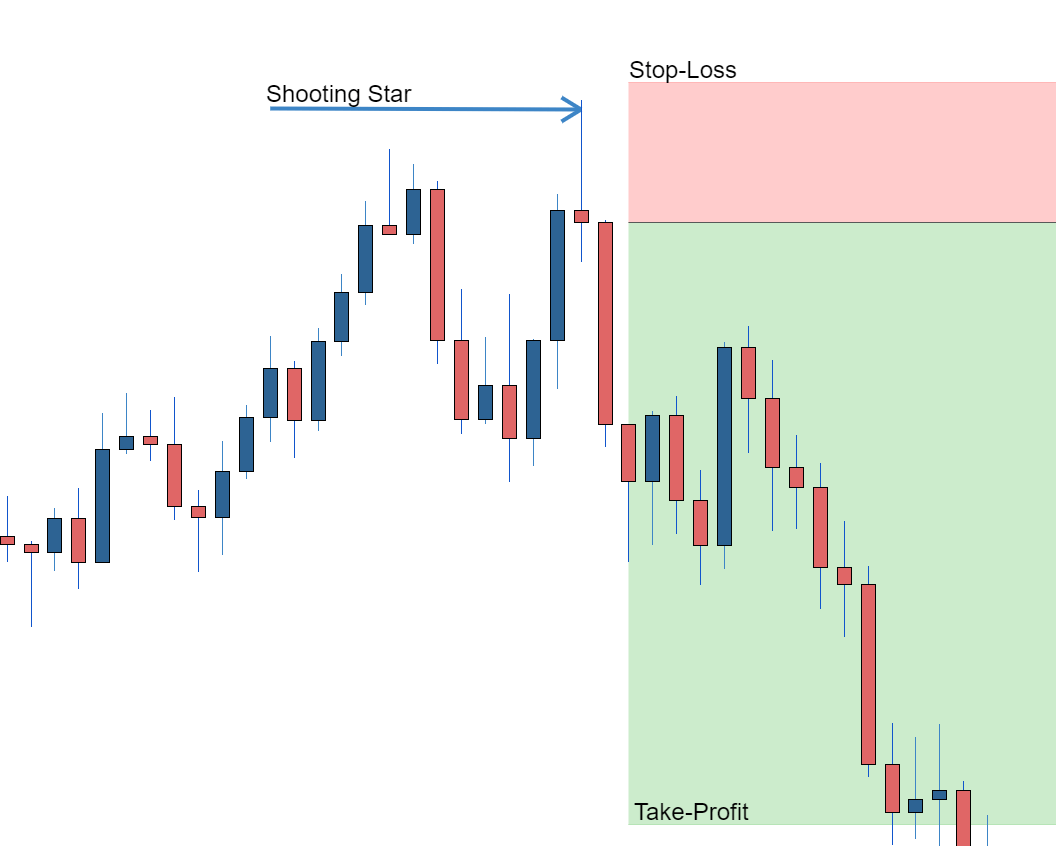
A shooting star candle formation, like the hang man, is a bearish reversal candle that consists of a wick that is at least half of the candle length. The long wick shows that the sellers are outweighing the buyers. A shooting star would be an example of a short entry into the market, or a long exit.

Traders could take advantage of the shooting star candle by executing a short trade after the shooting star candle has closed. Traders could then place a stop loss above the shooting star candle and target a previous support level or a price that ensures a positive risk-reward ratio. A positive risk-reward ratio has been shown to be a trait of successful traders.

Chart showing shooting star candlestick pattern

The Hammer

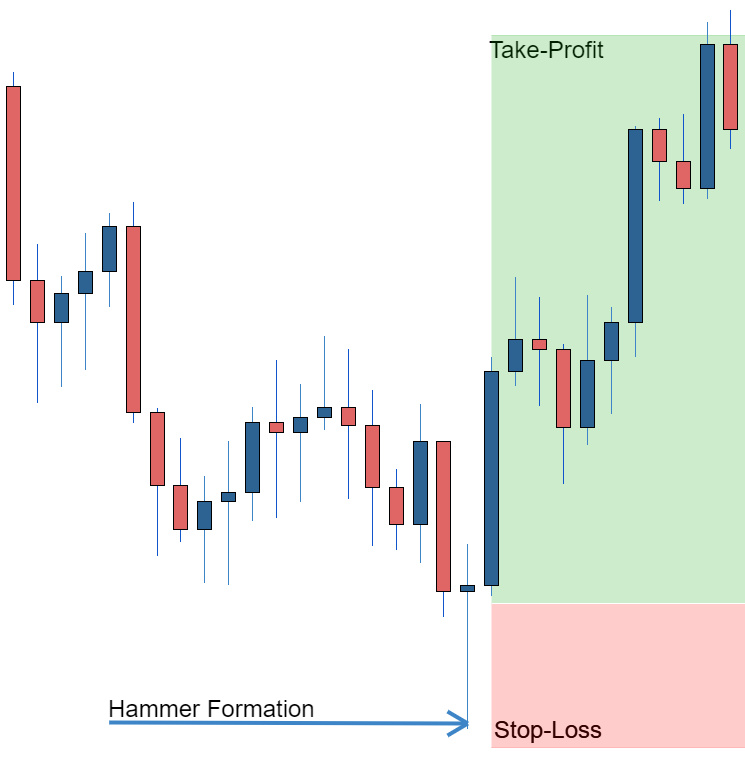
The hammer candle formation is essentially the shootings stars opposite. It is a bullish reversal candle that signals that the bulls are starting to outweigh the bears. It is characterized by its long wick and small body. A hammer would be used by traders as a long entry into the market or a short exit.

The image below is an example of how a forex trader would use the hammer candle formation to enter a long trade, while placing a stop-loss below the hammer candle and a take profit at a high enough level to ensure a positive risk-reward ratio.

Chart showing hammer formation with stop loss

Take your forex trading to the next level

Supplement your understanding of forex candlesticks with one of our free forex trading guides. Our experts have also put together a range of trading forecasts which cover major currencies, oil, gold and even equities.