How to use the PPI in Forex Trading

How to use the PPI in Forex Trading

What is PPI and what does it measure?

PPI stands for Producer Price Index and measures the change in the price of finished goods and services sold by producers. PPI data represents the monthly change in the average price of a basket of goods purchased by manufacturers.

How is PPI calculated?

PPI examines three production areas; commodity-based, industrial-based, and stage-of-processing-based companies. Released by the Bureau of Labor Statistics, PPI is created using data collected from a mailed survey of retailers selected via a process of systematic sampling of all firms listed with the Unemployment Insurance System.

Traders can see changes in PPI expressed as a percentage change from the previous year, or on a month to month basis.

PPI and inflation

A positive change in the PPI index implies that costs are rising and, in the end, price increases get passed down to consumers. If this effect is large enough, there will be an increase in future CPI figures to reflect that the general level of prices has increased.

PPI is a leading indicator of inflation

Inflation and the effect on the economy

An increase in the general price level is good for an economy but only when this is contained. When demand for goods and services increases, businesses must increase capital expenditure and hire more workers in order to increase their output to meet higher demand. The problem arises when prices increase drastically, resulting in a decrease in the purchasing power of a country’s currency. $1 can buy less than it could one year ago, for example.

In the 1950s, gasoline was $0.27, while apartment rent was $42/month and a movie ticket was $0.48. These figures are nowhere near to where they are today, and this reflects how inflation erodes the value of local currency. In an attempt to combat the erosion of purchasing power, central banks effectively reduce inflation by raising the benchmark interest rate.

How does PPI impact currencies?

When it comes to money there is always a trade-off: individuals can save money and earn interest, or they can spend money immediately and forgo any interest payments.

If PPI is on the rise it may cause the interest rates to rise. When interest rates go up, electing to save money looks more attractive as the reward (interest) is greater than before. Spending money becomes costlier because consumers would effectively be losing out on the higher interest rate when they choose to spend money instead of saving. As a result, increased PPI may filter down into increased rates and a stronger currency.

Using the Euro as an example, forex traders know that higher interest rates results in increased financial flows by foreign investors wanting to buy the higher yielding Euro. This effect tends to drive the value of the Euro up as the demand for the Euro has increased.

A popular strategy chasing higher interest rates is the “carry trade” strategy; whereby traders borrow funds in a currency that has a low interest rate and buy a currency with a higher interest rate.

Money follows yield and traders will look to take advantage of this.

Learn more about how interest rates affect forex.

How PPI affects the US dollar

The Producer Price Index tends to have little effect on the US dollar initially. This is because in the real economy there is a time lag between the increase in prices from producers, and the end result of higher inflation resulting from consumers having to fork out more at the tills.

DailyFX economic calendar showing Producer Price Index (PPI)

However, don’t be misled by the “low priority” impact assessment of this data release. Astute traders are able to forecast the knock-on effects PPI is likely to have on CPI and interest rates and trade accordingly. Thus, the most valuable component of the PPI data is the signaling effect it provides to the market.

The Forces of Supply and Demand

The Forces of Supply and Demand

What is supply and demand?

Supply and demand is the relationship between buyers and sellers that is used as a measure for price determination in financial markets. The forces of supply and demand interact to affect an equilibrium price between buyers and sellers whereby the quantity of demand equals the quantity of supply.

What are the laws of supply and demand?

‘Supply’ is purely the amount available, while ‘demand’ is the amount that is desired. The graphs below indicate the visual aspect of supply, demand and equilibrium respectively.

Supply: the relationship between price and quantity

supply grpah

Demand: the relationship between price and quantity

demand graph

Equilibrium: the most efficient price at which quantity demanded equals the quantity supplied:

supply and demand equilibrium graph

Supply and Demand Zones

Supply and demand zones allow traders to gain a perception into the current financial markets, and these are illustrated in the charts below.

It is noticeable that supply and demand zones cover a broader area as opposed to support and resistance levels. These broader zones provide more reliable price regions than a single line/level which can be a better gauge for future price movements.

The supply zone below shows an area clustered by sellers because price tends to ‘bounce’ lower off this demarcated zone. This quick price movement off these zones characterizes the features of supply and demand zones. The demand zone exhibits the same attributes as the supply zone in the opposing direction – demand zone mimics a broad area of support.

supply and demand zone in forex tradingsupply and demand zone in forex trading

Supply and Demand in the Forex Market

Supply and demand within a simple vegetable market is not all too dissimilar from that which takes place every day in the forex market. In some cases, these forces are moving at such high velocity that new traders can have difficulty understanding the granularity of the details.

The forex market is the largest financial market in the world because of the heavy demand behind the traded assets. Currencies are the basis for the world’s economy and whenever one economy wants to trade with another economy (provided different currencies are used) an exchange will be required.

How does supply and demand work?

In a nutshell, supply and demand works by analysing the quantity of buyers and sellers within the forex market.

How do supply and demand influence market price?

Imagine that the South African Reserve Bank (SARB) enacts an interest rate change. An entire chain reaction will be set in motion due to the forces of supply and demand. When rates increase, forex rollover payments also increase.

This means that investors that are holding the trade open at the specified rollover time (varies from country to country) will receive a higher rate of interest than they would have previously – incentive has just increased.

All else being equal, more traders would want to buy; and fewer traders would want to sell as the opportunity cost of selling (the rollover payment) has just gotten more expensive.

Supply and demand forex – USD/ZAR daily chart:

supply and demand forex

As you can see, price aims to find a comfortable point and will increase until there are no more buyers willing to pay that price. At this point, sellers outnumber buyers, and price will respond by moving down.

After price has moved down far enough (red circle) traders will come back into the picture, remembering in the increased interest rate and the additional rollover payment that can be received from holding a long ZAR position, and this lower price presents a ‘perceived value.’

As additional buyers enter the picture, price will move up to reflect this increased demand.

This is the process of price attempting to find its fair value as it takes place on many different time frames in every market in the world.


British Pound Update – GDP Picks Up in January, GBP Unchanged, FTSE Tests Resistance

British Pound Update – GDP Picks Up in January, GBP Unchanged, FTSE Tests Resistance

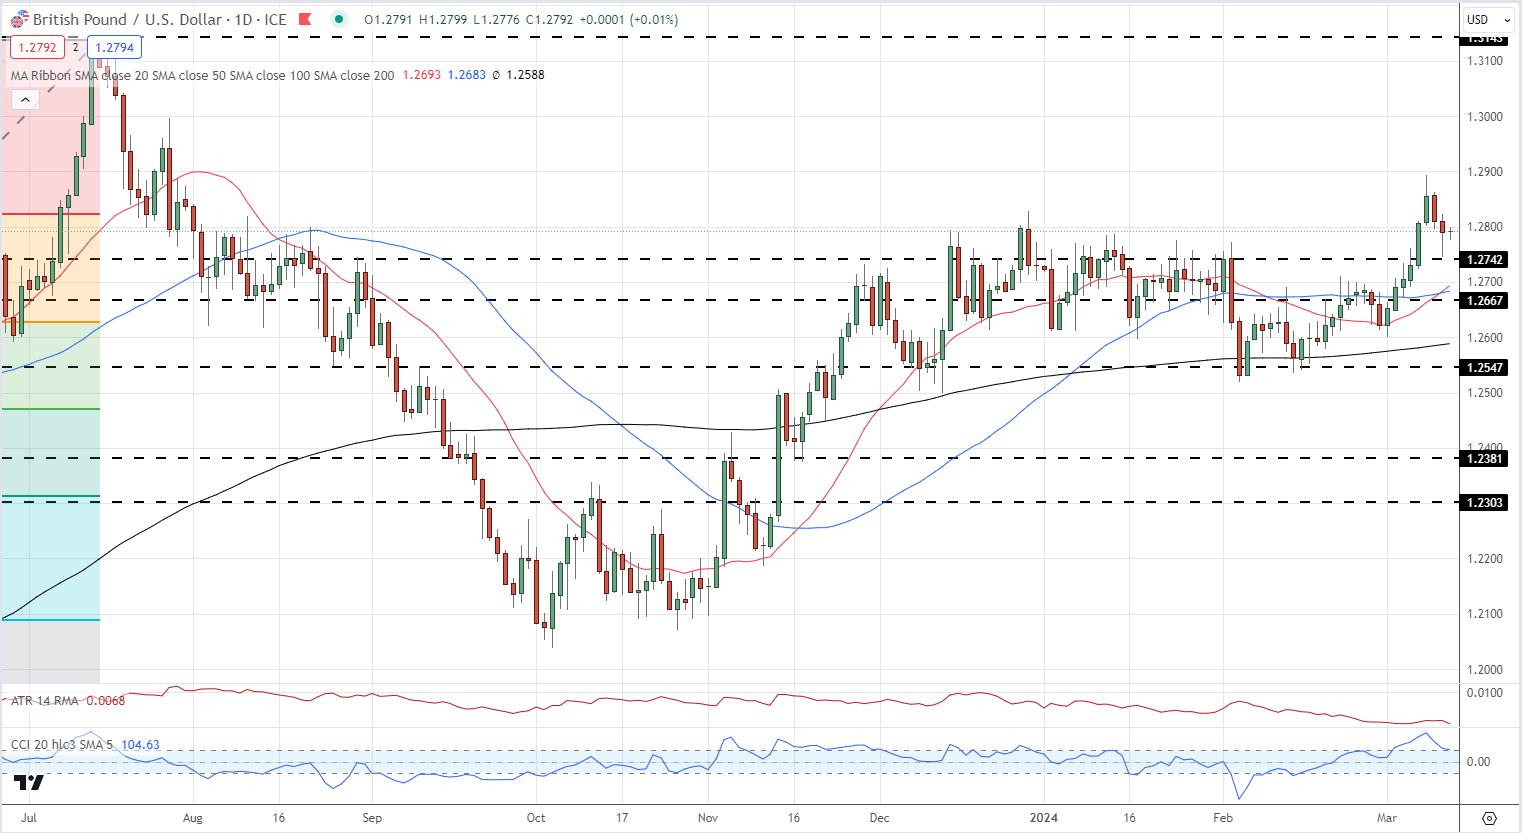
GBP/USD is treading water after two days of losses. Cable hit a multi-month high of 1.2894 last Friday before turning lower this week, but losses remain limited with first support seen around the 1.2742 area. For the pair to push ahead, last Friday’s high will need to be reclaimed but this looks unlikely at the moment with trade expected to remain on either side of 1.2800 in the short-term.

GBP/USD Daily Price Chart

image2.png

IG Retail data shows 41.74% of traders are net-long with the ratio of traders short to long at 1.40 to 1.The number of traders net-long is 6.03% higher than yesterday and 1.30% lower than last week, while the number of traders net-short is 8.33% lower than yesterday and 1.22% lower than last week.

We typically take a contrarian view to crowd sentiment, and the fact traders are net-short suggests GBP/USD prices may continue to rise.t

See How IG Client Sentiment Can Help Your Trading Decisions

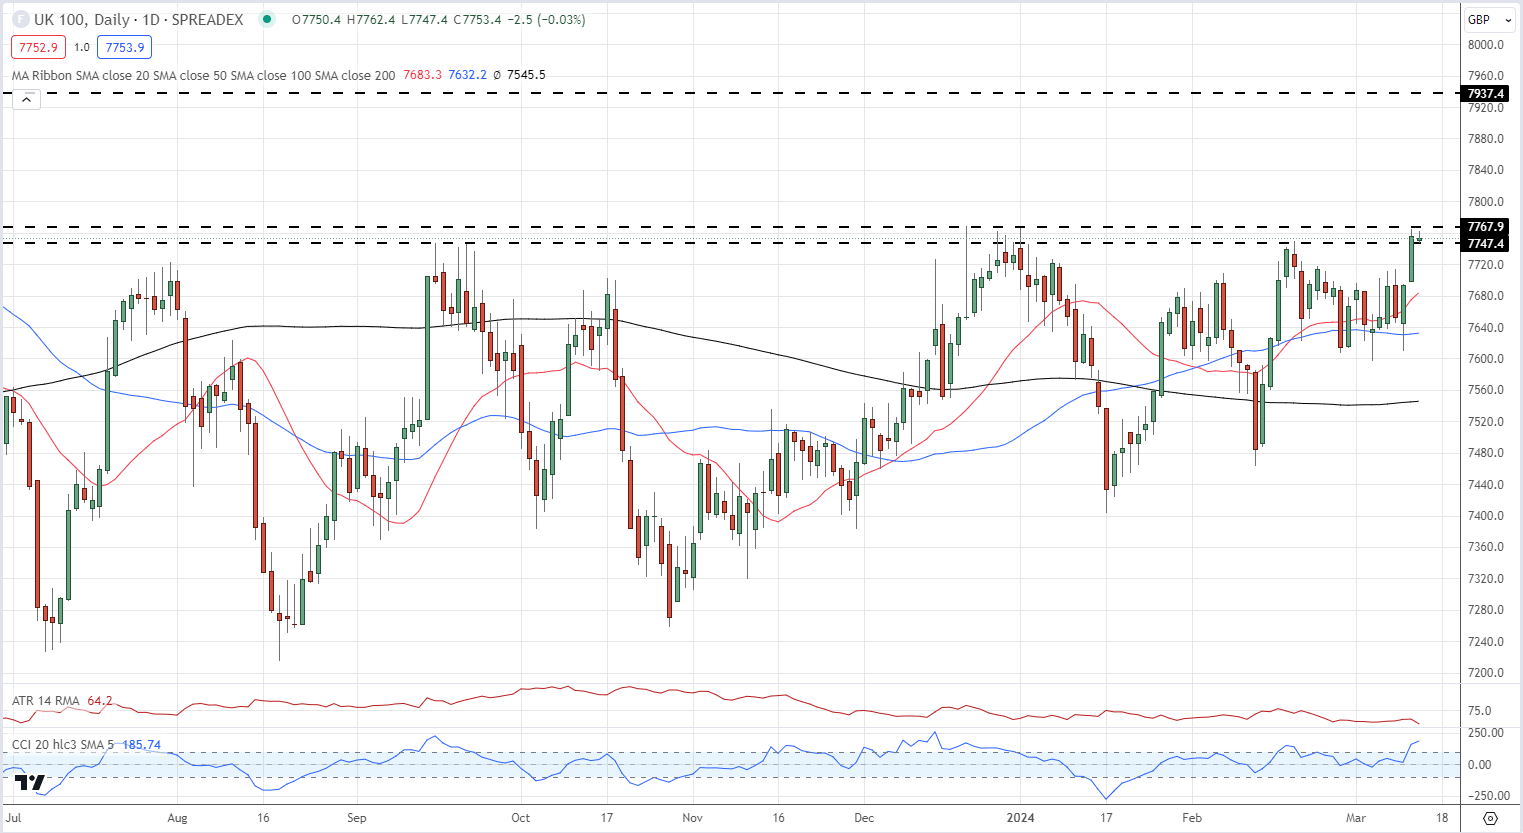
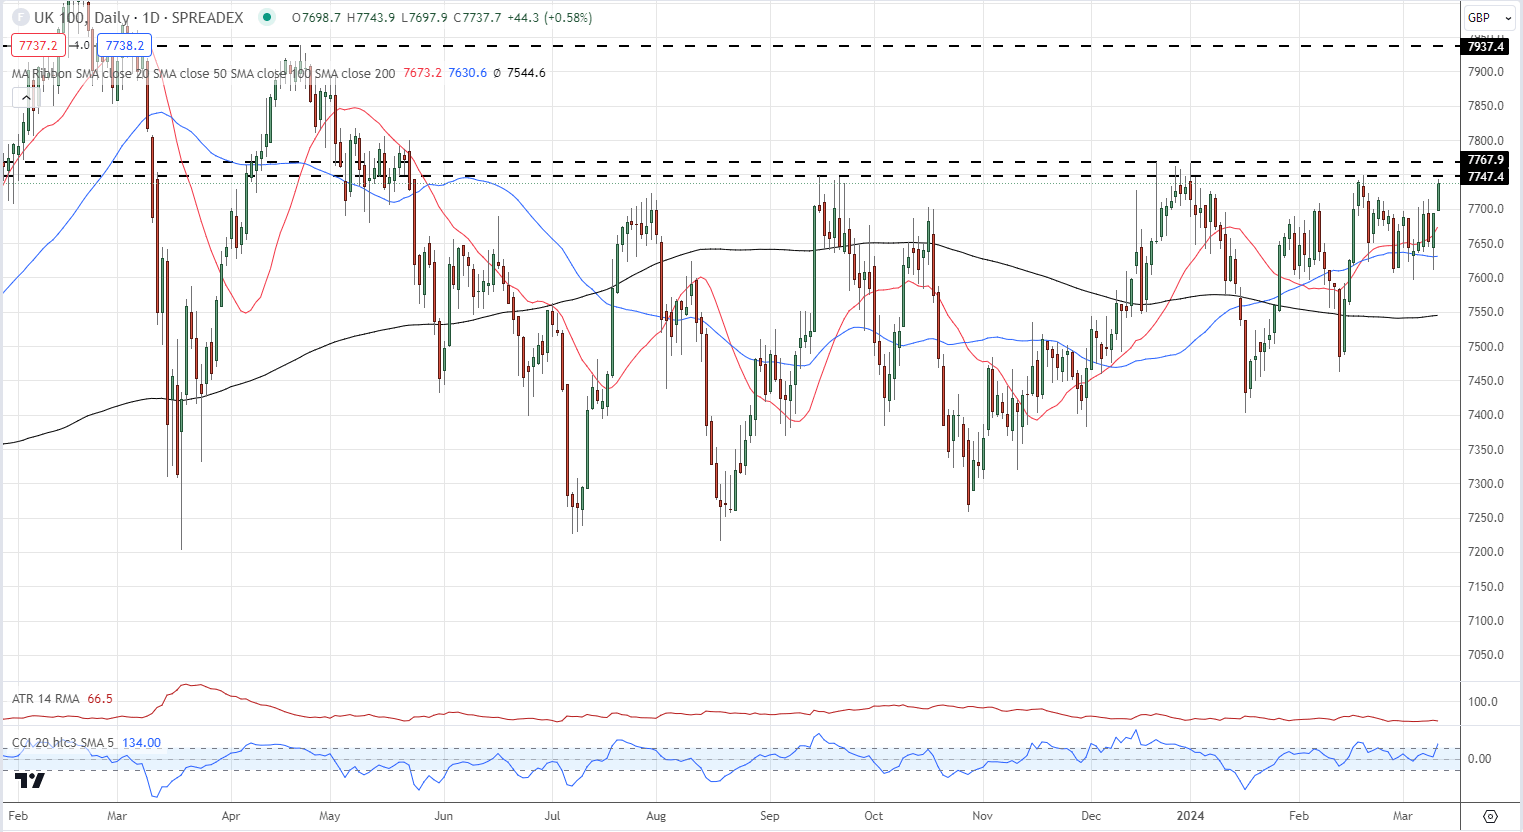
The recent FTSE 100 rally has stalled in early trade today, unable to break through an area of multi-month prior resistance. The CCI indicator shows the market as heavily overbought and this reading will need to be dialled back if the UK big board is to move higher. A confirmed break above resistance around the 7,767 area would bring 7,937 back into play.

FTSE 100 Daily Chart

image3.png

What is the VIX? A Guide to the S&P 500 Volatility Index

What is the VIX? A Guide to the S&P 500 Volatility Index

What is the VIX in the stock market?

The VIX was created by the Chicago Board Options Exchange (CBOE) in 1990 to act as a benchmark for measuring expectations about future stock market volatility. It’s a real-time index which reflects market participants’ expectations of volatility over the next 30 days.

At the most basic level the VIX index is constructed using weekly and traditional SPX index options and their levels of implied volatility. One can think of implied volatility as expected volatility derived from market participants’ activity in the options market. Understanding why the VIX behaves inversely to the S&P 500 is important because the volatility index acts as a measure of market sentiment, hence the reason it is called a “fear barometer”.

What is the relationship between vix and S&P 500 (SPX)?

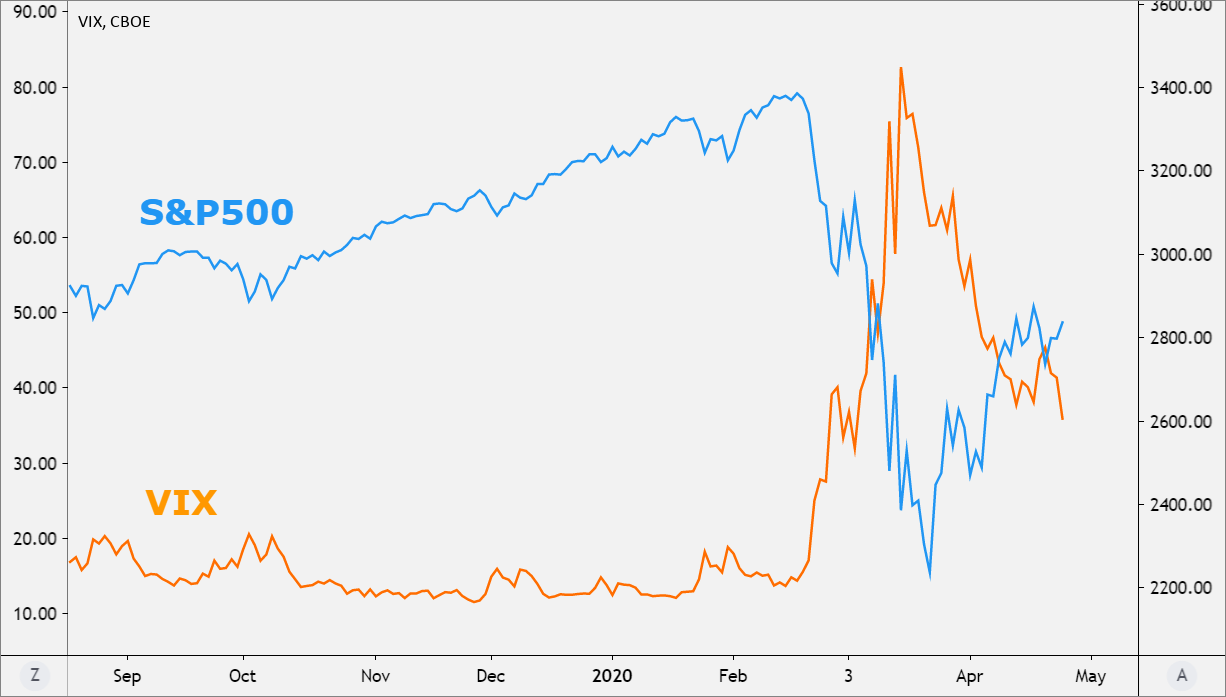
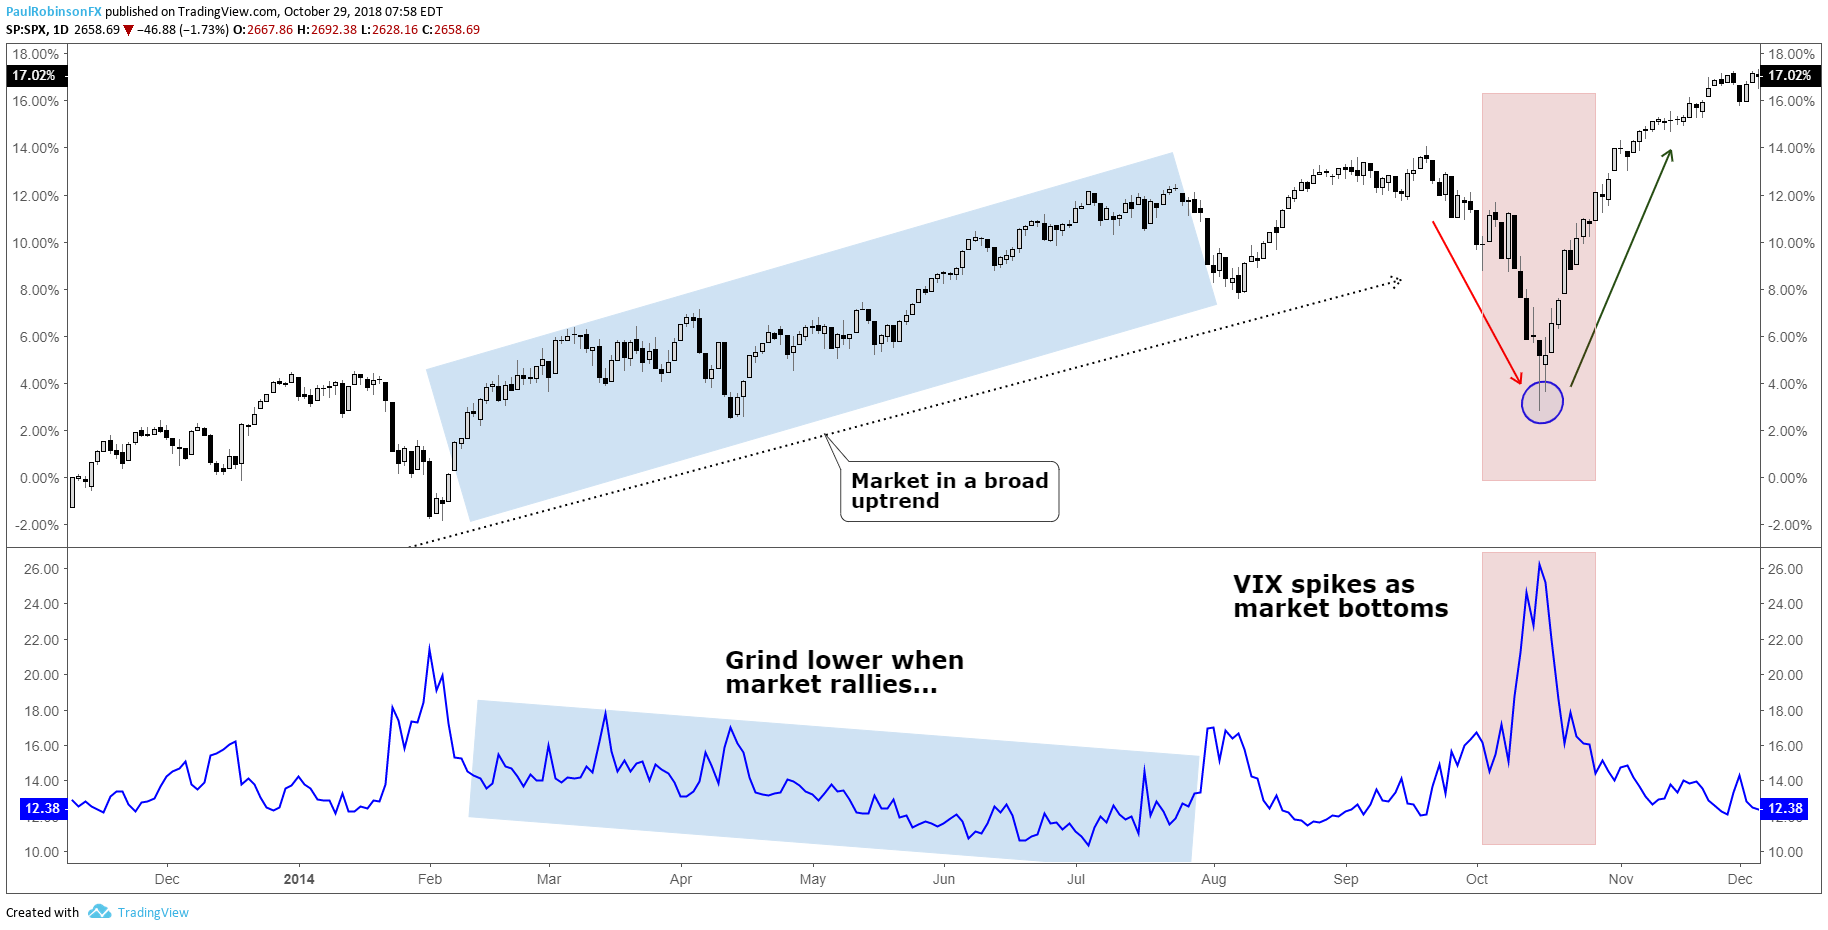
The S&P 500 VIX has a propensity to rise in bearish stock market environments and fall or remain steady during bullish environments. This happens because of the long-term bullish bias of the stock market and the fact that the VIX is calculated using implied volatility.

Implied volatility goes up when there is strong demand for options, and this typically happens during declines in the price of the S&P 500 as market participants (who are collectively bullish) are quick to buy protection (put options) for their portfolios.

When the S&P 500 rallies we see demand for protection dissipate and as a result a decline in the VIX. This process in recent years has become exasperated, in all likelihood, because the VIX has gone from just a market gauge of volatility to a tradable asset class through product offerings on various futures, equities, and options exchanges.

VIX rises when the S&P 500 falls

Created with Tradingview

S&P 500 VIX correlation

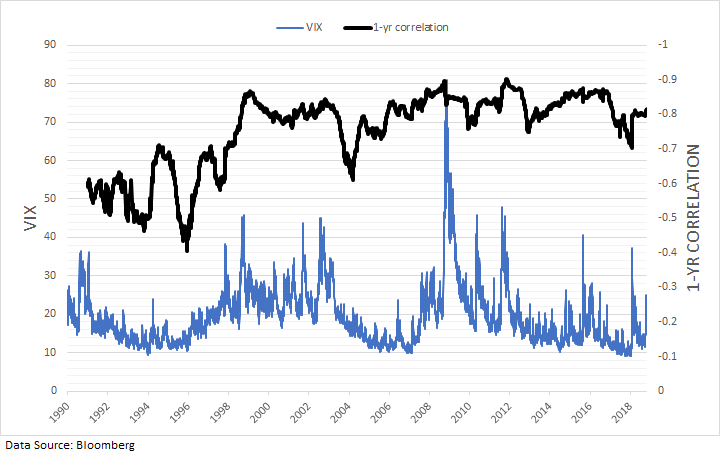
The S&P 500 VIX correlation is simply how the S&P 500 and the VIX move relative to one another. From the chart above it’s easy to see the strongly negative correlation between the stock market and the VIX. Stock market slumps lead to spikes in the index. Dating back the beginning of the VIX in 1990, the correlation between daily changes in the S&P 500 and VIX is -77%. Over the past 10 years the inverse correlation has become even stronger at -81%, while prior to October 2008 it was -74%.

The tighter relationship could very well be attributed to the various products introduced over the past 10-15 years which allow market participants to trade the VIX. As said earlier, this would also make sense as to why we are also seeing larger spikes in the VIX when the market weakens, as trading of the VIX itself is causing exaggerated moves in implied volatility.

The relationship between the S&P 500 and the VIX has largely been consistent and reliable over the years, though. The rolling 1-year correlation between daily changes has on average been around -83% over the past 10 years, staying within a relatively tight range of -70% to -90%.

S&P 500 VIX chart: One-year rolling correlation

VIX has a strong inverse correlation to the S&P 500 over the long-term

Using VIX to predict S&P 500 Volatility

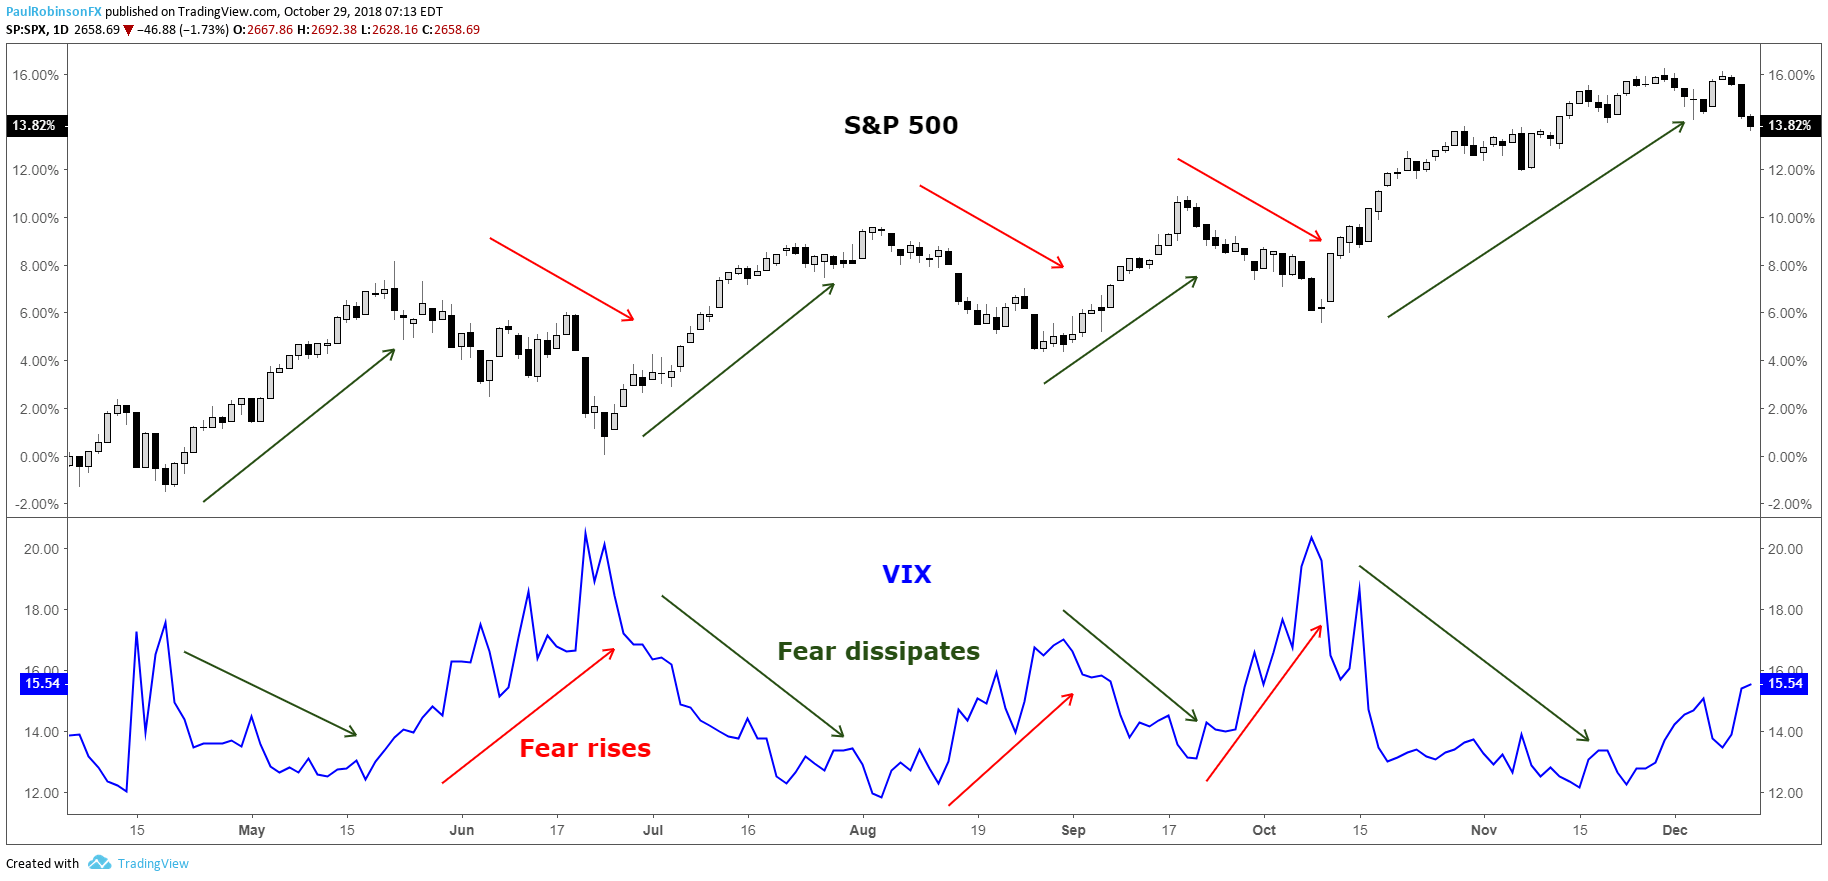
The S&P500 VIX can be used to identify market turns, more specifically bottoms. Because the stock market tends to rise in a gradual fashion the VIX too will decline in a gradual to sideways fashion. This can lead to very low levels which warn of complacency as investors feel no need for protection, but these periods can last long enough that using the VIX as a sell signal can be rendered largely ineffective.

However, because the S&P 500 is long-biased by nature, when there are declines investors buy protection (put options) quickly, driving up the VIX. Often there is an overreaction by market participants when the market declines, hence the reason why the VIX is called a “fear barometer”.

The spike-like behavior which the VIX exhibits during times of market stress can be a timely signal for determining when selling has become overdone and the market is due to bounce or even bottom for a longer-term move higher. This strategy is typically best employed when the VIX ‘signal’ arrives within the context of a generally bullish trend in the S&P 500.

S&P500 VIX chart: Spikes can be used to indicate trading bottoms

VIX moves lower to sideways in bullish markets, spikes during sell-offs

Created with Tradingview

Circling back around to the complacency factor seen when the VIX is at very low levels, there is a nuance to this which can help identify when the stock market may be nearing a turning point to the downside, but they don’t happen frequently. When the VIX and S&P 500 both rise together over a period of time it can indicate growing instability in the trend which sets the market up for a sell-off.

Using S&P 500 volatility for risk management

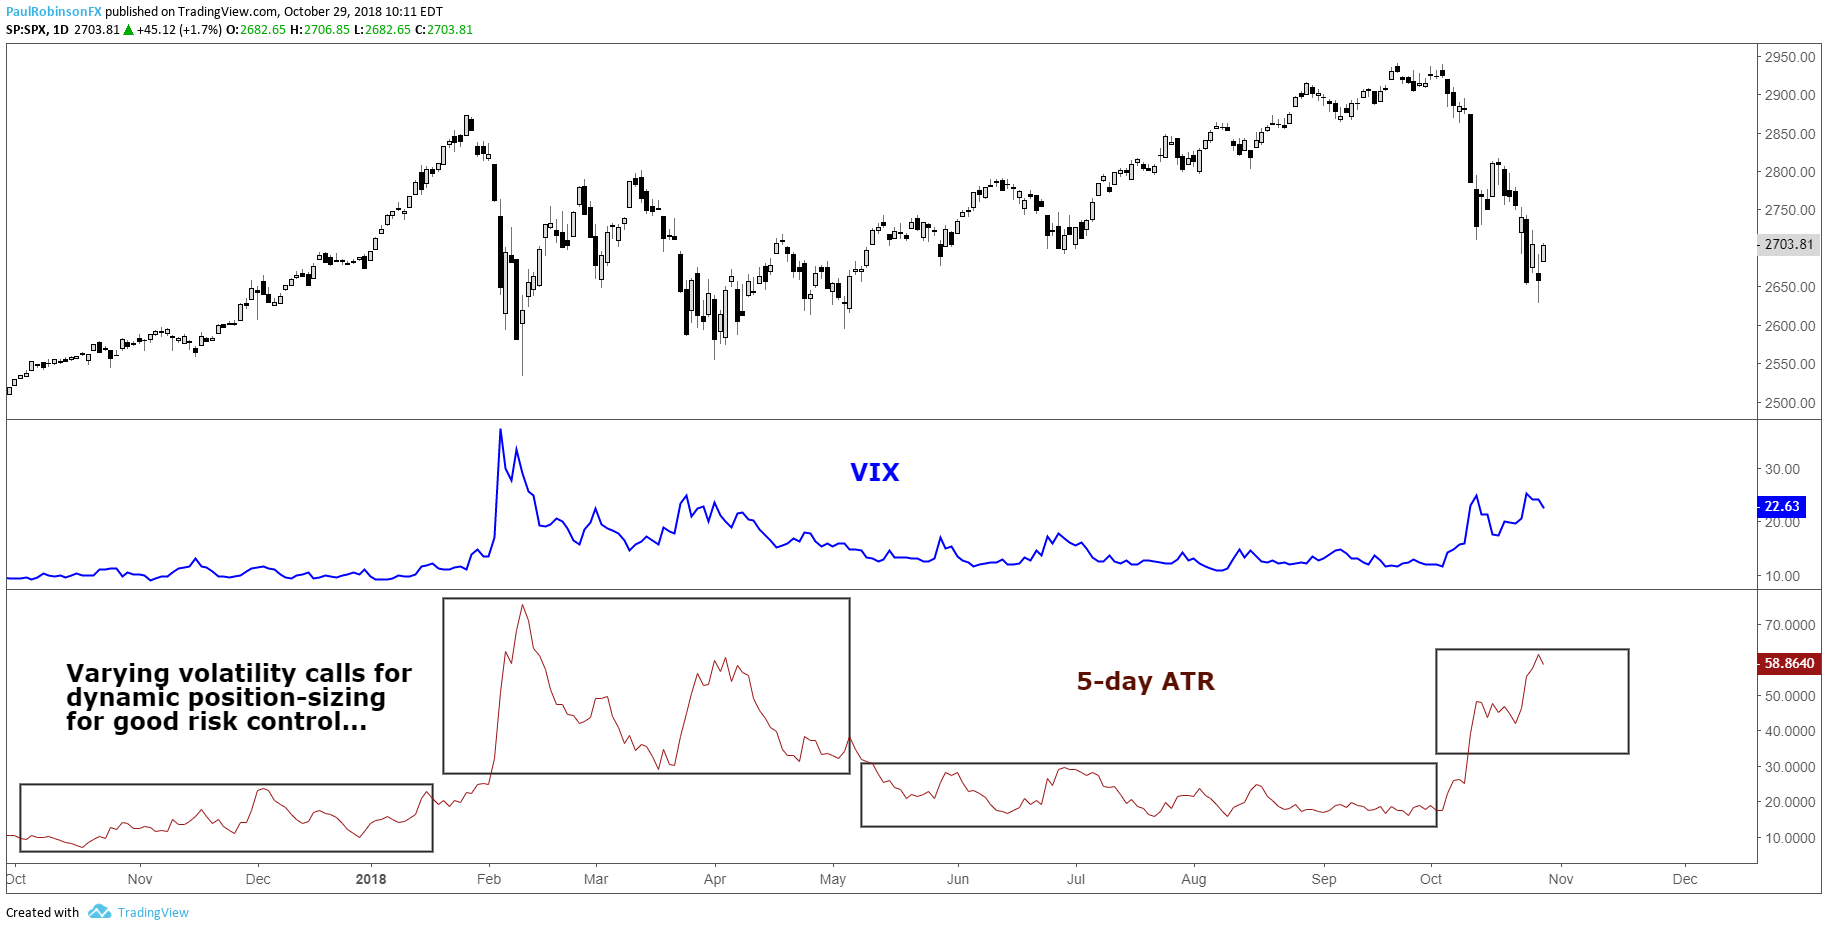
When trading the S&P 500 there should be an inverse relationship between trading size and market volatility, or the VIX. One common mistake traders make is that they will simply trade a fixed lot size regardless of the distance their stop-loss is away from the entry price. This means the at-risk amount of capital will be highly variable (likely due to levels of volatility) and thus lead to inconsistent results. Additionally, a trader is putting themselves at greater risk when they should be doing the opposite.

A prudent approach to risk management is to determine how much of your capital you are willing to risk per trade and then adjust the trading size accordingly. For example, if you are willing to risk 1% on an S&P 500 trade and have a 10-point stop-loss, and have another trade where you are willing to risk 1%, but with a 5-point stop-loss, for both trades to equal 1% in risk the second trade would need to be twice as large as the first trade given the distance to the stop-loss. This provides a dynamic approach to position-sizing when trading the S&P 500 for more consistent results.

Average True Range (ATR) and the VIX

On average, the distance to your stop-loss will largely depend on the level of the VIX. Another way to measure volatility is with ATR (Average True Range). From the chart below, you can see that ATR and VIX look very similar, despite ATR using historical data and the VIX calculation relying on an options pricing model. When the VIX spiked so did the trading ranges of the S&P 500, which means a trader using a dynamic position-sizing strategy would adjust their trading size down to account for the new level of volatility. Simply put, if you are risking specific amounts of capital like in the example above, versus trading fixed lots, then you will be adjusting dynamically with S&P 500 volatility. For more on the topic of risk management, check out this article and video on sound risk management techniques.

S&P 500 VIX & ATR (Changing volatility requires changes to trading size)

As volatility changes (ATR/VIX) so should position sizes

Created with Tradingview

S&P 500 and VIX Key takeaways

To summarize, understanding stock market volatility and the CBOE Volatility Index (VIX) is important for trading equity indices. There are benefits to understanding the nature of volatility from both an analytical and risk management standpoint. Like all things, getting a feel for the relationship between the VIX and the S&P 500 will take a little experience to get a handle on, but well worth the time.

For more information on the S&P 500 Index, read our guide to trading S&P 500. Or for an in-depth review of the major stock indices, we have rounded up the top differences between the Dow, Nasdaq and S&P 500.

What is Stock Market Volatility & How to Trade it

What is Stock Market Volatility & How to Trade it

What is volatility in stocks?

Stock market volatility refers to the range of price movement of a stock over time. A more volatile trade has the potential for significant gains, but also substantial losses. Volatility in stocks can be understood using the following measures:

1) Standard deviation

Standard deviation is the average amount the price of a stock has differed from the mean over a given period. Bollinger bands can be used by chartists to analyze standard deviation.

2) Beta

A stock’s Beta is a measure of its volatility in relation to the wider market. The market has a beta of 1.0, with more volatile stocks having a value greater than this (eg 2.0), and less risky stocks having a value closer to zero.

The chart below shows the price for the ATA Inc. stock (ATAI), listed among the most volatile by TradingView as of April 2019, with both the standard deviation and Beta measures of volatility included on the chart.

Chart showing volatility in ATAI stock using standard deviation and beta

What are the most volatile stocks?

When it comes to volatility and stocks, there is no one set of stocks that are always more volatile than another. Stocks can be classed as ‘currently volatile’, describing those stocks with current high swings, or ‘expected to be volatile’, meaning stocks that may be stable at this moment but have potential for high volatility in the future.

As can be seen in the above example, stocks can have periods of high volatility, for example showing a Beta near zero, then an increasing Beta to 2.0, and then falling back to near zero months later.

Identifying high volatility stocks

When identifying high volatility stocks, traders can use a stock screener, search the derivatives market, and use third party websites.

Stock Screener/Filter

A stock screener or stock filter is an automated program that reveals a list of stocks that fit certain criteria.

For example, using a stock screener to monitor the stocks that had the biggest percentage gains or losses in a prior trading session, making sure each has enough volume per day, can be helpful to ascertain subsequent volatility. Helpful criteria to find volatile stocks may include ‘show stocks where the average day range (50) is above 4%’

Searching the derivatives market

Traders can use parameters in the corresponding derivatives market such as put call ratio, which is a tool to gauge market sentiment, open interest, the number of contracts outstanding on an exchange at any one time, and implied volatility, a market forecast of likely price movement. For these indicators, it is advisable to go to the official exchange website.

Third party websites

TradingView, for example, rounds up the most volatile stocks by percentage price changes.

How to trade stock market volatility

Trading stock market volatility successfully involves effective hedging, knowing when to sell stocks, employing sound risk management, and spotting buying opportunities when renowned stocks see a fall in price.

Hedging

Hedging against spikes in volatility is important to offset losses. This can be done by buying put options, which allow the sale of assets at an agreed price on or before a particular date, and trading inverse exchange-traded funds, which act as the inverse of the index or benchmark it tracks. Traders can also explore aggregated stocks through an index to protect against volatility (see below).

Selling stock/managing risk

If extreme volatility is affecting your mindset, it may be wise to sell off some stock and put your money into less dynamic securities. This leaves you free to trade another day without risking more than you are prepared to lose.

Practising sound risk management is essential when dealing with aggressive price action. Volatile stocks can lose you a lot of money and should not be traded if your mindset isn’t right that day, particularly if day trading.

Spotting buying opportunities

Sometimes a buying opportunity arises when high volatility hits the price of high-quality stocks. For example, in early 2019 the NASDAQ and S&P 500 constituent Apple cut its earnings forecast, leading to its price dropping 10-15% in the following days. However, just three months later, it completely recovered and approached a $1 trillion valuation once more. Identifying opportunities to go long when the market conditions reverse is one way traders look to speculate when coupled with prudent trade management techniques.

Volatile Stocks for Day Trading

Like the most volatile currency pairs, volatile stocks can show significant movement throughout the day, making them potentially an attractive option for day traders. While some stocks may move 0.5% in a single day, others may move as far as 5% in the same period, meaning traders should be constantly alert.

To find a volatile stock for day trading, watch a stock you found with your stock screener for intraday movement. If a stock opens down 10% and starts moving, as opposed to staying static, it is being day traded and may be worth consideration.

Due to the speed of price movement, executing day trades can be a physical endeavour and good reflexes win the day.

JOMO is the New FOMO: Trade with the Joy of Missing Out

JOMO is the New FOMO: Trade with the Joy of Missing Out

Why you Should Say Goodbye to FOMO

The concept of FOMO in trading applies to those who fear missing out. This could be a fear of missing a move on the markets, not knowing the latest financial news, or having a lack of knowledge compared to other traders. As a result, a FOMO trader is usually anxious and dissatisfied.

JOMO has been described as the ‘emotionally intelligent antidote to FOMO.’ JOMO in trading embodies calmness and discipline – traits that serve traders well. A JOMO trader knows their own mind, has a solid trading plan and doesn’t chase the markets, instead waiting for opportunities that fit with their trading strategy. This is in stark contrast to a FOMO trader, who is continually burdened with the fear of missed opportunities.

Are you a JOMO trader?

JOMO traders think differently to those driven by FOMO. Which trader’s logic most closely resembles your own?

FOMO trader JOMO trader
“Everyone else is making that trade – there’s no reason why I shouldn’t.” “GBP/USD seems volatile. It’s too late to enter according to my trading plan, though. I’ll wait this one out.”
“I really want this trade to end in the money. Fingers crossed!” “I don’t want to gamble with my money. I trade on the back of detailed research, not guesswork.”
“I might place that trade… I’ll think about it and come back to it later.” “I’ve carried out all my research and analysis – I know the trades I want to place.”
“Apparently this is a good time to trade crude oil. I saw it on Twitter under #FinTwit.” “I’ve watched webinars and read the latest market news. I know exactly what’s happening.”
“I’m concerned I’ll miss an opportunity. I watch the charts for most of the day.” “I’ve automated some processes. I won’t miss opportunities. If I don’t trade, it’s through choice.”

There are distinct patterns in the behavior of these two traders. These are some of the attributes of a JOMO trader:

Attributes of a JOMO trader

Of course, it’s not always as clear cut as this. In the fast-paced, ever-changing worlds of forex and commodities, traders can experience a rollercoaster of emotions. Fear, greed, anxiety, elation, and many more can all be triggered by a change in the charts or a volatile market. FOMO can affect anyone, and if it does, it’s not something that should cause negativity.

Every trader knows there’s room for improvement, even the professionals. Why not join our trading psychology webinars with analyst Paul Robinson to find out more about trading psychology and becoming a better trader?

If you’re puzzled by trading losses, why not take a step in the right direction? Download our guide, “Traits of Successful Traders,” and gain valuable insights to steer clear of common pitfalls that can lead to costly errors.

What Does JOMO Look Like in Trading?

There is no single way that JOMO in trading occurs, but it is generally discernible in calm, confident traders – those who are happy with their own strategies.

It can still be difficult to pinpoint specific trading habits and understand how they impact success, especially when a trader is considering their own practices. Here are some examples of common trading scenarios, and the actions a trader might take depending on their outlook:

FOMO trader JOMO trader
Scenario 1: The price of gold reaches a six-year peak! How exciting! Jumps on the trend and goes long on gold.

Outcome: Enters the trade too late, just as the market reverses.

Consults charts and fundamentals.

Outcome: Realizes the opportunity has passed. Sits this one out.

Scenario 2: The markets seem slow at the moment… when will there be a good opportunity? Searches for opportunities, fears missing out.

Outcome: Places a trade, panics, exits early, makes a loss.

Doesn’t feel the need to trade 24/7. Happy to miss out.

Outcome: Knows there’ll be more opportunities – relaxes!

Scenario 3: The trade war is making the US Dollar volatile and traders have already profited. Is this a good time to trade again? Buoyed up by previous wins, enters another trade with little thought.

Outcome: The trend reverses and the trader hangs on too long, out of greed, fear and FOMO. They make a significant loss.

Considers the markets alongside their trading plan.

Outcome: Waits for the right opportunity. There will be one that’s a perfect fit for their trading plan.

A JOMO trader doesn’t win every trade, but that’s fine. They feel less pressure to trade and use a sensible strategy – they stand a much better chance of achieving long-term success.

7 Steps to Turn your FOMO into JOMO

Don’t fear missing out – embrace it! Here are seven steps to turn your FOMO into JOMO:

  1. Develop a trading plan. This is a framework that guides traders and keeps them focused. A good plan will ensure a trader knows when to enter trades – and when to leave them well alone.
  2. Keep a trading journal. This is a log of previous trades, allowing for analysis and reflection. It should be used alongside a trading plan to formulate strategies and develop better awareness. Keeping a journal makes traders more accountable to themselves, rather than following the herd for fear of missing out.
  3. Use expert, authoritative resources. When traders keep up with recent news and technical analysis, they have less need to rely on other traders. This helps break the FOMO cycle. Following the crowd through fear and anxiety feels less important; traders learn what to trade and what to ignore.
  4. Set processes. Traders are at their most efficient when they have established their own routines and ways of carrying out analysis. Often, the most efficient traders aren’t those who spend all day in front of a computer screen. They are the ones who have their own strategies and preferred markets, which enables them to focus their analysis and find their ideal trades.
  5. Listen to others – but filter the information. JOMO isn’t about cutting ties with the rest of the trading world. It is about taking information on board and sifting through it to make the right decisions. By all means, use #FinTwit and @DailyFX and have discussions with fellow traders. Just don’t feel pressurized to follow the herd.
  6. Improve your trading psychology. This term refers to the multitude of emotions that can inundate traders and influence decision-making. Improving trading psychology can help turn weaknesses into strengths, and turn FOMO into JOMO
  7. Have a healthy relationship with trading. Even professionals who make a living from trading sometimes need to relax and take a step back. Trading at any level should never impact wellbeing and should be a rewarding activity, with opportunities to improve and develop. As traders develop confidence, they learn to trust their own skills, and place the right trades for them.
The Psychology of Speculation in the Forex Market

The Psychology of Speculation in the Forex Market

What is speculation in the forex market?

Speculation in the foreign exchange market involves the buying and selling of currencies with the view of making a profit. It is called speculation because of the uncertainty involved as no one can say for sure whether the market will be going up or down. Traders assess the likelihood of either scenario before placing a trade.

What happens when it all goes wrong?

After you’ve developed a trading strategy centered around forex speculation and learned the basics of the market – you have many of the tools that are needed to be successful. And when that success doesn’t come, numerous questions can swirl around inside your head.

“Am I trading the right strategy?”, “Do I really know what I’m doing?”

These questions/doubts are not unique. Most traders have these thoughts at some stage or another and have learned how to overcome them. Let’s address these questions directly:

1) Am I Trading the Right Strategy?

Many traders don’t realize this early on – market conditions change over time. As a currency speculator, you can spend weeks analysing a specific market that suits your strategy at the time, but this is likely to change and when it does it will seem like nothing is working in your favour.

A perfect example of this can be seen when comparing EUR/USD in 2017 to the same currency pair in the first half of 2019.

In 2017, EUR/USD was is a strong uptrend for the majority of the year. Backtesting trend trading strategies would naturally yield attractive results and any reasonable trader would look to implement such a strategy.

currency speculation EUR/USD upward trend 2017

A very different picture can be seen below as EUR/USD trades sideways for the first six months of 2019, making things difficult for new trend traders. The red 200 day moving average helps make this point as it cuts through price many times and fails to provide a clear signal.

Forex speculation in EUR/USD 2019

Traders should dedicate some time to analyze whether or not market conditions have changed. It is very possible that the trading strategy is fine but the market no longer exhibits the characteristics that drew you to it in the first place.

2) Do I Really Know What I’m Doing?

“FAIL: First Attempt in Learning” – Anonymous

This is a difficult question to answer as this will depend on each trader’s knowledge and preparedness. Since this question cannot be answered, the next best thing to do is to look at what others have done wrong, learn from it, and avoid making the same trading mistakes.

At DailyFX we researched over 30 million live IG trades to discover the number one mistake traders make in our Traits of Successful Traders report. Understanding where it all goes wrong and making the necessary adjustments is the first step to trading like the professionals.

4 Tips to speculate like a successful trader and get back on track

1) Don’t Let Risk Change Your Behaviour

The biggest psychological obstacle for traders is the perception of losses (and the concept of losing). For traders, the pain of closing a trade and realizing a loss outweighs the excitement of realizing a winning trade of equal magnitude.

Top traders apply sound risk management first and foremost. Traders can win two-thirds of all their trades and still land up blowing up the account in the absence of using stops. A natural consequence of this is that traders allow losing positions to run, while taking profit as soon as a position turns positive. The losses outweigh the winners and this should never happen.

One way to manage your emotions is to implement a trailing stop or manually move your existing stop when the market moves in your favor. This way, traders can relax knowing that they are breaking even and any further movement in your favor is purely profit.

Currency speculation using stops

Before placing a trade, know what level of risk you are prepared to take on and ensure that the risk to reward ratio is at least 1:1.

2) Bring a Positive Mindset to the Charts Every Day

Since you will inevitably be taking losses in this game of forex speculation, it’s important to deny those losses from altering your frame of mind.

Traders will often experience the disappointment of being stopped out and this can be very discouraging. As a result of this they take shortcuts on their analysis or question their own approach. This never ends well.

The key to keeping a positive mindset in trading is to look at losses in the same way that a business owner looks at expenses; simply as a cost of doing business. Because once you’ve learned to lose properly, and after you’ve learned to keep those losses in scope of the bigger picture – you’ve addressed biggest aspects of trading psychology.

3) Strike the delicate balance between fear and greed

These two drives can have a large bearing in the way we live our lives; and not just in trading. When trading, both fear and greed can be massively detrimental, as they can cloud your judgment and lead to bad decisions.

Most human beings will be greedy when they have a losing position; willing to hold on if only price can come back to their entry level. And when in a winning position, most human beings will begin to be fearful.

Traders should look to reverse those drives and to be greedy when they’ve been proven right. If fearful, you can use the breakeven stop to help alleviate the concern that your initial risk is still exposed.

4) Don’t let confidence get the best of you

After putting together a string of successes, it’s human nature to build up confidence around your dealings and this can be a good thing.

But once a trader has gone into the territory of being ‘over-confident’, risky habits may sneak into their approach, none more damaging than the willingness to bend their own trading rules simply because they feel it will be successful.

Therefore, traders should always look to strike that delicate balance between being scared or fearful, and over-confident.

Understanding Inflation and its Global Impact

Understanding Inflation and its Global Impact

What is Inflation?

Inflation is the rise in prices of goods and services in an economy over a period of time, and is often displayed in percentage form. For example, if inflation is 2%, this suggests that prices are (on average) 2% higher than the previous period. Therefore, if a bottle of water cost $1 last year then this year it should be around $1.02. Inflation can result in significant costs to an economy as the purchasing power of individuals fall.

Deflation

Deflation is the opposite of inflation where prices fall. This suggests low demand for goods and services and often leads low interest rates. Deflation is atypical amongst developed countries.

Stagflation vs Hyperinflation

Stagflation occurs when an economy is stagnant (low growth) but inflation is still prevalent. This can occur when external factors impact an economy such as the price of oil.

Hyperinflation is an extremely high rate of inflation within an economy. Hyperinflation can be caused by an increase in money supply which consequently results in increased consumer spending and higher demand for goods and services.

Both deflation and hyperinflation can be detrimental to an economy and can result in higher rates of unemployment and lower growth. This makes the role of central banks critically important to control inflation as a lack of stability may have the potential for destructive penalties.

Measuring Inflation

Consumer Price Index (CPI)

This is one of the more common ways of measuring inflation, calculating inflation is based on a basket of goods and services which are often referred to as a ‘cost-of-living index’. Common cost-of-living indexes are the Consumer Price Index (CPI) and Retail Price Index (RPI). These measures relate to inflation experienced by consumers on a daily basis. Each central bank faces unique headwinds in selecting appropriate items to include within their inflation calculation.

Core CPI vs Headline CPI:

Two common phrases when dealing with inflation is ‘core’ and ‘headline’ CPI. This differentiating factor between the two terms is quite simple. Core CPI refers to the omission of food and energy prices from the Consumer Price Index while headline CPI includes both food and energy prices.

Producer Price Index (PPI)

The Producer Price Index (PPI) focuses on inflation at the early stages of production which can provide essential information for manufacturers and industry. The chart below shows the historical comparison between the different inflation measures (CPI, PPI and GDP Deflator). It is clear that PPI is the most volatile which can be explained in part by producers being unable to pass on relatable costs to the consumer in difficult periods such as the global financial crisis.

GDP Deflator

Another way to measure inflation is via the GDP deflator which takes into account domestic goods only while CPI and/or RPI includes foreign goods, as well. A second key difference is that the GDP deflator method encompasses all goods and services while CPI and/or RPI only measures the price of goods and services bought by consumers. Because the GDP deflator is not restricted by a fixed basket of goods, it has an advantage over the others.

GDP Deflator = (Nominal GDP/Real GDP) x 100

Each measure has bespoke properties that may appeal to different individuals. Therefore, there is no ‘best’ way to calculate inflation but rather each measure has unique aspects that will be suited for different requirements and applications.

PPI vs CPI vs GDP Deflator
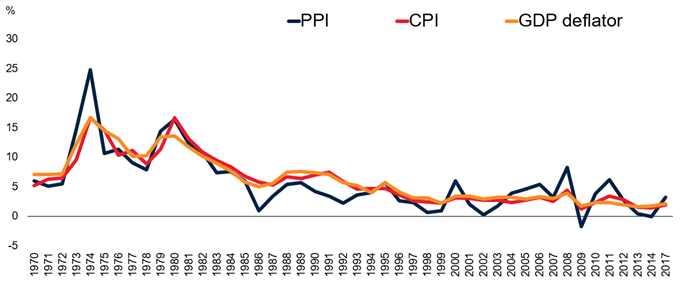
PPI vs CPI vs GDP Deflator

Source: World Bank

Sources of Inflation

Inflation can begin via many avenues in isolation or combination. Below are a few of the primary sources of inflation that can distress any nation across the globe:

Exchange Rates

A weakening local currency means that more local currency is required to purchase imports. This increased cost gets passed on to the end consumer which can contribute to inflation.

Essential Commodity Prices

Most manufacturers require inputs to produce a certain good. These often come in the form of commodities such as iron ore or oil. If these inputs increase in price due, then those costs can be passed on to consumers and the higher costs are a form of inflation.

Interest Rates

Lower interest rates theoretically lead to more spending by consumers, ultimately resulting in greater demand and cost of goods; which should lead to inflation, all factors held equal.

Government Debt

Increases in government debt may infer that there is a greater potential of a government default, which leads to higher yields on treasury securities to compensate potential investors for the higher risk. The effect this has on the public is that more tax revenue will be allocated to the higher interest payments on government debt obligations which reduces living standards. Businesses in turn increase the prices of goods and services to offset the lessened government expenditures, and this can lead to inflation.

The sources listed above generally fall into two broad categories of inflation which are:

  1. Demand-Pull Inflation – This type of inflation comes as a result of an increase in aggregate demand inclusive of households, governments, foreign buyers and businesses.
  2. Cost-Push Inflation – Supply is the driver of inflationary pressure for cost-push inflation. When supply falls due to higher production costs, the outcome is higher final prices for consumers.

Consequences of Inflation

Value of Money

The most obvious penalty of inflation from a consumer point of view is the higher cost of goods and services. This translates to a decrease in the value of money as individuals can now purchase fewer goods and services with the same amount of money prior to an inflationary rise.

Wealth Gaps

The inequitable distribution of inflationary pressure amongst individuals can lead to changes in wealth. For example, individuals with loans during periods of high inflation will benefit as the real value of their debt repayments will fall over time while others may not.

Inflation Volatility

Fluctuating or erratic inflation data complicates business operations as businesses do not know where to set prices, and this can have a negative effect on the economy as both businesses and consumers adjust to the higher rates of inflation. Long-term business deals will also incur higher costs as volatile inflation causes a higher risk premia on hedging costs, which can reduce foreign investor confidence.

Central banks use of Inflation Targeting

Inflation targeting is quite simple in theory as involves a central bank setting a specific inflation goal in percentage terms. This strategy is achieved by manipulating monetary policy. The goal of inflation targeting allows central banks along with the public to have more clarity in terms of future expectations. The reason behind inflation targeting is control with regards to price stability, and price stability can be attained by governing inflation.

Generally an inflation target of 1% – 2% is familiar as it allows governments and central banks some flexibility at this low base. As a rule of thumb, any deviation greater than 1% either side of the targeted figure is cause for concern and has generally lead to policy intervention.

How do Governments Control Inflation?

There are many ways governments go about controlling inflation which can have knock-on effects (positive and negative) to the economy depending on current economic conditions. The most common way is via contractionary monetary policy which is used by central banks to curb inflation by restricting liquidity. This is achieved via 3 main avenues:

1. Decrease Money Supply

Decreasing money supply simply gives consumers less money to spend overall and should help limit inflation. One way this can be realized is by increasing interest on sovereign bond payments which can attract more investors to buy bonds.

2. Reserve Constraints

Restricting the amount of money banks are allowed to keep can influence the amount of money being lent to consumers. That is, if banks are required to keep higher amounts of money as a legal threshold, then naturally banks will have less money to lend. This should decrease consumer spending and thus, inflation.

3. Raising Interest Rates

Higher interest rates which result in fewer individuals willing to borrow and therefore leads to a decrease in spending. There’s also a greater opportunity cost of investing capital into a business given the higher rates of return that could be had through capital markets.

Global Inflation and Key Relationships

Advanced vs Developing Economies
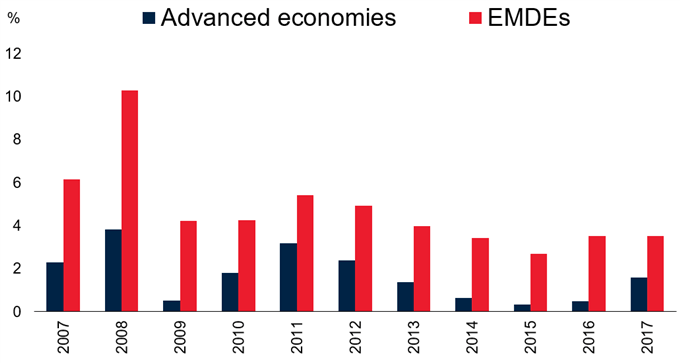
Advanced vs Developing economies

Source: World Bank

The chart above shows a consistent and logical pattern whereby the historical inflation rate in developed countries is generally less than emerging and developing economies (EMDE).There are two primary reasons behind this:

  1. EMDE generally have higher growth rates which can lead to excess demand.
  2. Volatile currencies are present in many EMDE which makes central banks’ management of monetary policy more difficult than those in advanced economies.

The Phillips Curve

The historical relationship between unemployment and inflation has been largely inverse which means that high levels of unemployment correlates with lower inflation and vice versa. The reason why the inverse relationship exists is best explained with basic economics. For example, an increase in aggregate demand which is a consequence of demand-pull inflation, results in higher prices of goods and services and lower unemployment. This lower unemployment means that there is more income available in the economy to spend on goods and services. Both elements have recurrent effects on one another and is best represented by the basic Phillips Curve (see chart below).
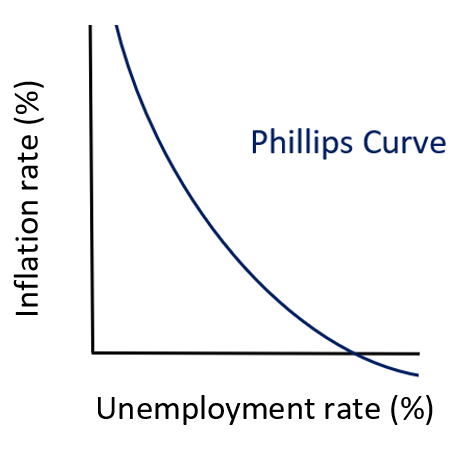
The Phillips Curve

Source: Created by Warren Venketas

Inflation: Conclusion

This article has demonstrated the wide reaching implication of inflation from more concentrated effects to wide-ranging systemic global impacts. Inflation is an important economic tool from a macroeconomic perspective but also can be powerful if understood and implemented within a trading strategy as inflation data can cause changes in price in many financial markets.

The CPI and Forex: How CPI Data Affects Currency Prices

The CPI and Forex: How CPI Data Affects Currency Prices

What is CPI and why does it matter to forex traders?

The Consumer Price Index, better known by the acronym CPI, is an important economic indicator released on a regular basis by major economies to give a timely glimpse into current growth and inflation levels.

Inflation tracked through CPI looks specifically at purchasing power and the rise of prices of goods and services in an economy, which can be used to influence a nation’s monetary policy.

CPI is calculated by averaging price changes for each item in a predetermined basket of consumer goods, including food, energy, and also services such as medical care.

It is a useful indicator for forex traders due to its aforementioned effect on monetary policy and, in turn, interest rates, which have a direct impact on currency strength. The full utility of knowing how to interpret CPI as a forex trader will be explored below.

CPI release dates

CPI release dates usually occur every month, but in some countries, such as New Zealand and Australia, quarterly. Some nations also offer yearly results, such as Germany’s index. The US Bureau of Labor Statistics has reported the CPI monthly since 1913.

The following table shows a selection of major economies and information about their CPI releases.

Country/jurisdiction Compiling body Frequency of releases
Australia Australian Bureau of Statistics Quarterly
Canada Statistics Canada Monthly
China National Bureau of Statistics of China Monthly
Eurozone European Central Bank Twice monthly
Germany Federal Statistical Office of Germany Monthly, yearly
Italy Istat Monthly
India Ministry for Statistics and Programme Implementation Monthly
Japan Statistics Japan Monthly
UK Monetary Policy Committee Monthly
US US Bureau of Labor Statistics Monthly

Why forex traders should follow CPI data

Understanding CPI data is important to forex traders because it is a strong measure of inflation, which in turn has a significant influence on central bank monetary policy.

So how does CPI affect the economy? Often, higher inflation will translate to higher benchmark interest rates being set by policymakers, to help dampen the economy and subdue the inflationary trend. In turn, the higher a country’s interest rate, the more likely its currency will strengthen. Conversely, countries with lower interest rates often mean weaker currencies.

The release and revision of CPI figures can produce swings in a currency’s value against other currencies, meaning potentially favorable volatility from which skilled traders can benefit.

Also, CPI data is often recognized as a useful gauge of the effectiveness of the economic policy of governments in response to the condition of their domestic economy, a factor that forex traders can consider when assessing the likelihood of currency movements.

The CPI can also be used in conjunction with other indicators, such as the Producer Price Index, for forex traders to get a clearer picture of inflationary pressures.
What to consider when trading forex against CPI data

When using CPI data to influence forex trading decisions, traders should consider the market expectations for inflation and what is likely to happen to the currency if these expectations are met, or if they are missed.
Similar to any major release, it may be beneficial to avoid having an open position immediately before. Traders might consider waiting for several minutes after the release before looking for possible trades, since forex spreads could widen significantly right before and after the report.

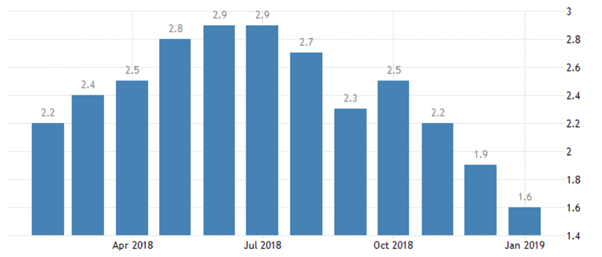
Below is a chart displaying the monthly inflation rates for the US. For the latest month, expectations are set at 1.6% inflation compared to last year’s data. If CPI is released higher or lower than expectations this news event does have the ability to influence the market.

Chart to show US inflation levels in 2018/19. Source: TradingEconomics.com. US Bureau of Labor Statistics

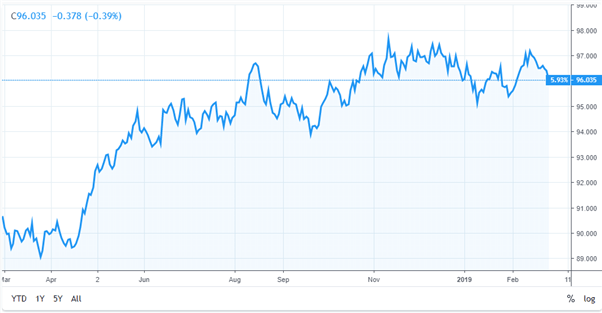
One way the effects of CPI data can be interpreted is by monitoring the US Dollar Index, a 2018/19 example chart for which is below. If CPI is released away from expectations, it is reasonable to believe this may be the catalyst to drive the Index to fresh highs, or to rebound from resistance.

Since the Index is comprised of EUR/USD, USD/JPY, and GBP/USD, by watching the US Dollar we can get a full interpretation of the events outcome.

Chart to show movement in the US Dollar Index. Source: TradingView.com

As can be observed in the example above, as inflation rose during the first half of 2018, the US Dollar Index went up accordingly. But with US inflation drifting lower in the following months and with a missed target of 2%, this pushed US interest rate hikes off the agenda. As a result, the dollar struggled and weakened against a basket of other currencies.

Not every fundamental news release works out through price as expected.

Once the CPI data has been released and analyzed, traders should then look to see if the market price is moving through or rebounding off any areas of technical importance. This will help traders understand the short-term strength of the move and/or the strength of technical support or resistance levels, and help them make more informed trading decisions.

British Pound Latest – UK Labor Market Cools, GBP Steadies, FTSE 100 Probes Higher

British Pound Latest – UK Labor Market Cools, GBP Steadies, FTSE 100 Probes Higher

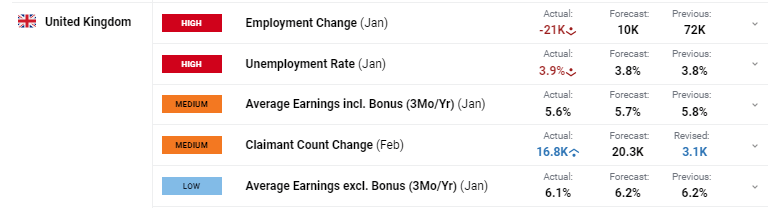
The latest Office for National Statistics jobs and wages data shows the UK labor market starting to cool with wages slipping and the unemployment rate nudging higher. Both moves were marginal and while today’s report will have buoyed the Bank of England, UK rate cut expectations are little moved and still point to the August MPC for the first Bank Rate cut.

image1.png

Later today -12:30 UK – the latest US inflation report will be released and this is set to be the main driver of price action in today’s session.

image2.png

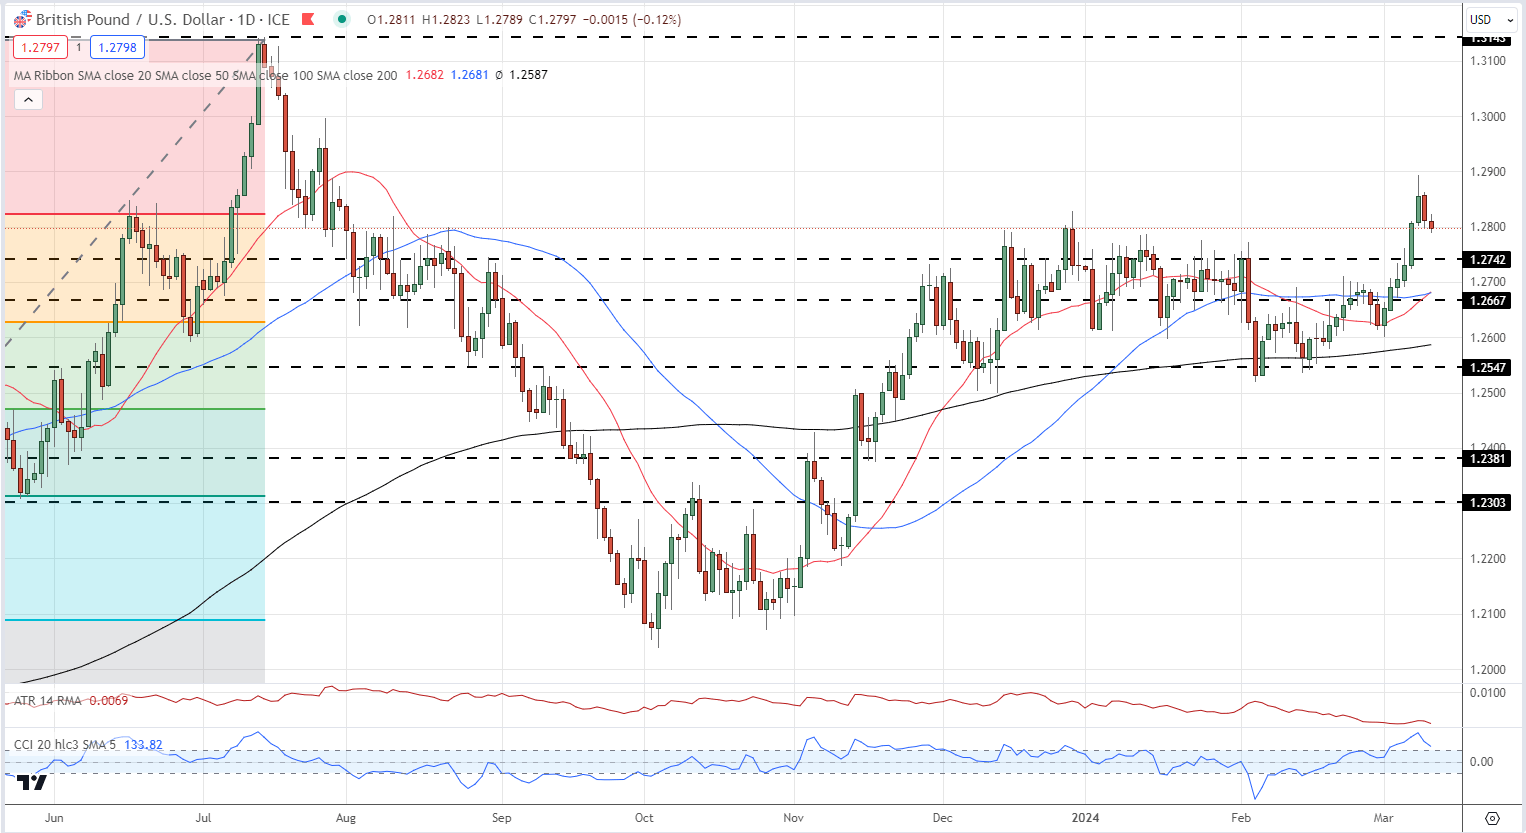
GBP/USD hit a seven-month high of 1.2894 last Friday and has eased lower since. Cable currently trades around 1.2800, just above a zone of support between 1.2740 and 1.2780. A move higher brings last Friday’s high back into play before a gap to 1.3000.

GBP/USD Daily Price Chart

image3.png

IG Retail data shows 38.25% of traders are net-long with the ratio of traders short to long at 1.61 to 1.The number of traders net-long is 18.49% higher than yesterday and 6.35% lower than last week, while the number of traders net-short is 5.54% lower than yesterday and 9.01% higher than last week.

We typically take a contrarian view to crowd sentiment, and the fact traders are net-short suggests GBP/USD prices may continue to rise.

The FTSE 100 is pushing higher again today and is nearing a cluster of prior highs around the 7,750 area. Above this zone, there is little in the way of strong resistance until the April 2023 high at 7937. Tomorrow’s UK GDP data – 07:00 UK – may make or break a move higher.

FTSE 100 Daily Chart

image4.png