German Factory Orders Plunge 11.3% in January Despite Auto Sector Boost

German Factory Orders Plunge 11.3% in January Despite Auto Sector Boost

On Thursday, the German economy was under the spotlight again after better-than-expected trade data on Wednesday. German factory orders garnered investor interest early in the European session.

German Factory Orders

Factory orders tumbled 11.3% in January after surging 12.0% in December. Economists forecast German factory orders to decline by 6.0%.

German Economic Indicators Sent Mixed Signals

Factory orders reversed course in January, suggesting a slump in demand at the start of Q1 2024. The numbers contrasted with trade data for January. Imports and exports increased by 3.6% and 6.3%, suggesting an improving demand environment. The outlook for the German and Eurozone economies will hinge on the February numbers, which could influence the ECB rate path.

EUR/USD Reaction to the Economic Indicators from Germany

Before the German factory order numbers, the EUR/USD fell to a low of $1.08932 before rising to a high of $1.09073.

In response to the numbers, the EUR/USD fell to a low of $1.08998 before rising to a high of $1.09043.

On Thursday, the EUR/USD was up 0.03% to $1.09023.

EUR/USD has a mixed reaction to German factory orders.
070324 EURUSD 3 Minute Chart

Next Up

On Thursday, the ECB monetary policy decision and press conference are the main event for the EUR/USD. Economists expect the ECB to leave interest rates at 4.5%, placing the ECB press conference under the spotlight.

ECB staff projections and views on the timeline for interest rate cuts need consideration.

From the US economic calendar, US jobless claims and the Fed will draw investor interest. Fed Chair Powell will deliver a second day of testimony, with FOMC member Loretta Mester also on the calendar to speak.

Euro’s Outlook Hinges on ECB Guidance; Trade Setups on EUR/USD, EUR/GBP, EUR/JPY

Euro’s Outlook Hinges on ECB Guidance; Trade Setups on EUR/USD, EUR/GBP, EUR/JPY

The European Central Bank’s Thursday meeting is likely to be a subdued affair, with markets widely expecting interest rates to remain unchanged for the fourth consecutive gathering. For this reason, investors should closely monitor President Lagarde’s press conference – her statements may provide valuable insights into the monetary policy outlook.

Lagarde is likely to embrace a neutral stance, refraining from sending signals that could inadvertently create unrealistic expectations in either direction. Although disappointing growth data over the past couple of months may argue for a more dovish position, policymakers may opt for caution in the face of stalled progress on disinflation.

To provide some context, January’s CPI in the Eurozone topped estimates, reinforcing the argument that consumer prices are not yet on a sustained downward trend, with rapid wage growth keeping service sector inflation stickier than anticipated. Against this backdrop, the ECB will avoid any commitment to a pre-set course that could raise premature market hopes, stressing that decisions will be data-dependent.

In terms of potential scenarios for the euro, any indication that the ECB’s easing measures are not imminent and could be delayed to the latter half of the year could spark a hawkish repricing of interest rate expectations. This would be bullish for the common currency. Conversely, any hint of potential early rate cuts could elicit an opposite response, weighing on the euro.

Want to know where the euro is headed over a longer-term horizon? Explore key insights in our quarterly forecast. Request your complimentary guide today!

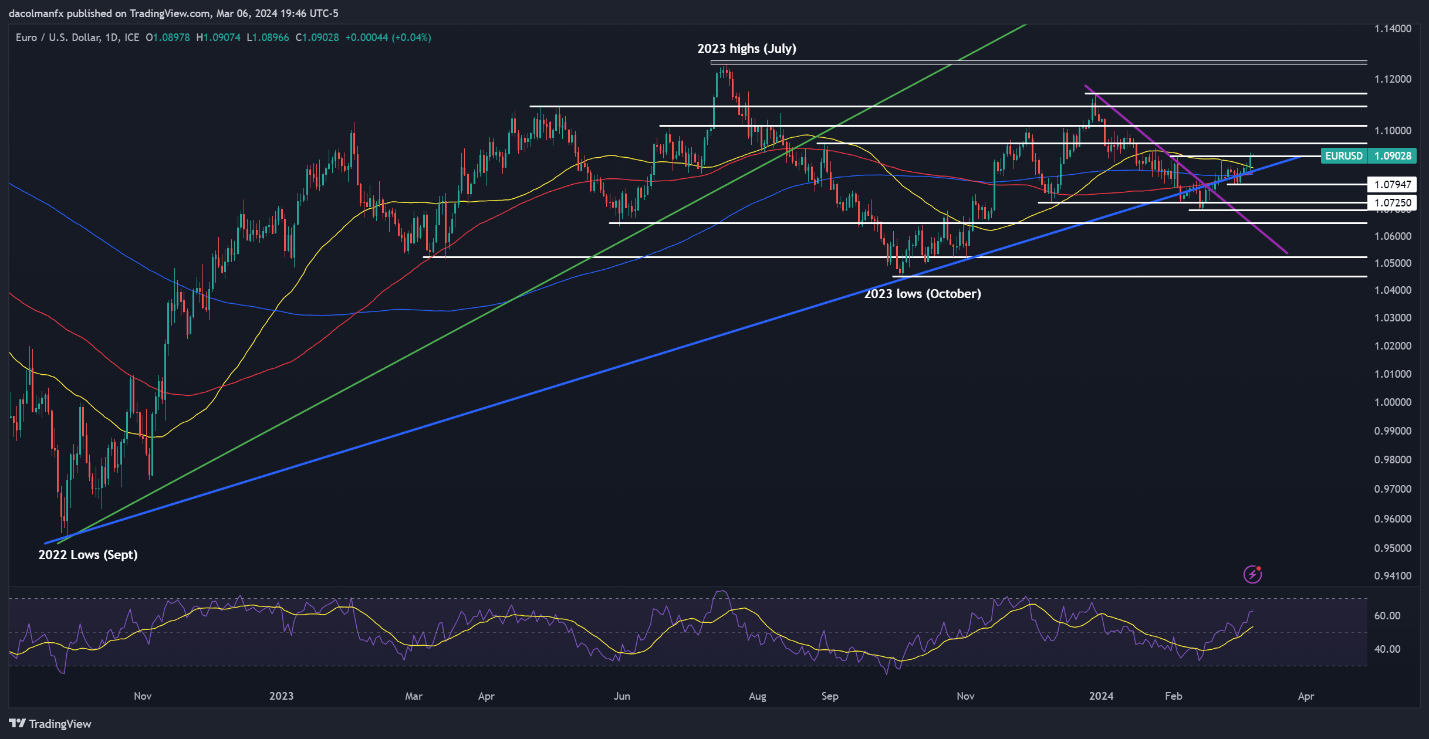
EUR/USD FORECAST – TECHNICAL ANALYSIS

EUR/USD rallied on Wednesday, breaking above its 50-day simple moving average, and reclaiming the 1.0900 handle. If this bullish move is sustained in the coming days, buyers may gain confidence to launch an attack on 1.0950, with a potential focus on 1.1020 thereafter.

On the flip side, if the pair loses vigor and retreats back below the 1.0900 mark, attention is likely to shift to confluence support at 1.0850. Bulls need to vigorously defend this floor; failure to do so might precipitate a pullback towards 1.0790. On further weakness, all eyes will be on 1.0725.

EUR/USD PRICE ACTION CHART

A screenshot of a computer screen  Description automatically generated

Eager to discover how retail positioning can influence EUR/GBP’s short-term trajectory? Our sentiment guide has valuable insights about this topic. Grab a free copy now!

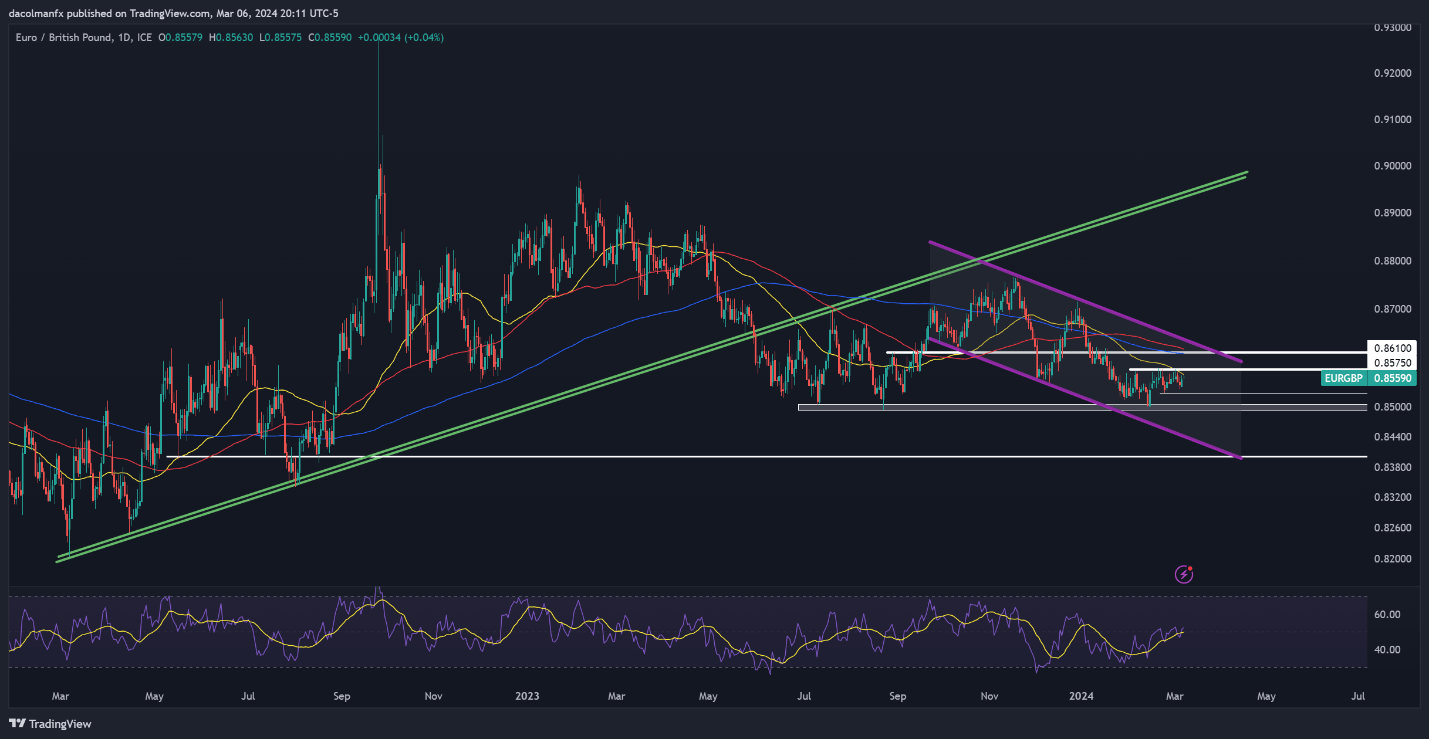
EUR/GBP FORECAST – TECHNICAL ANALYSIS

EUR/GBP has been in a downtrend since November, but the intensity of the selloff has eased, with prices perking up and approaching resistance near 0.8575. To enhance sentiment towards the euro, bulls need to convincingly breach this barrier – achieving this could trigger a rally towards 0.8610, followed by 0.8640.

Conversely, if EUR/GBP is rejected at current levels and begins to reverse, support thresholds will come into play at 0.8530 and subsequently at 0.8500. Prices are expected to stabilize around this area during a downturn before a potential reversal, but a breakdown could lead to a decline toward 0.8450.

EUR/GBP PRICE ACTION CHART

A screenshot of a computer screen  Description automatically generated

Disappointed by trading losses? Equip yourself with knowledge to improve your strategy with our “Traits of Successful Traders” guide. Unlock crucial insights to avoid common pitfalls & costly errors.

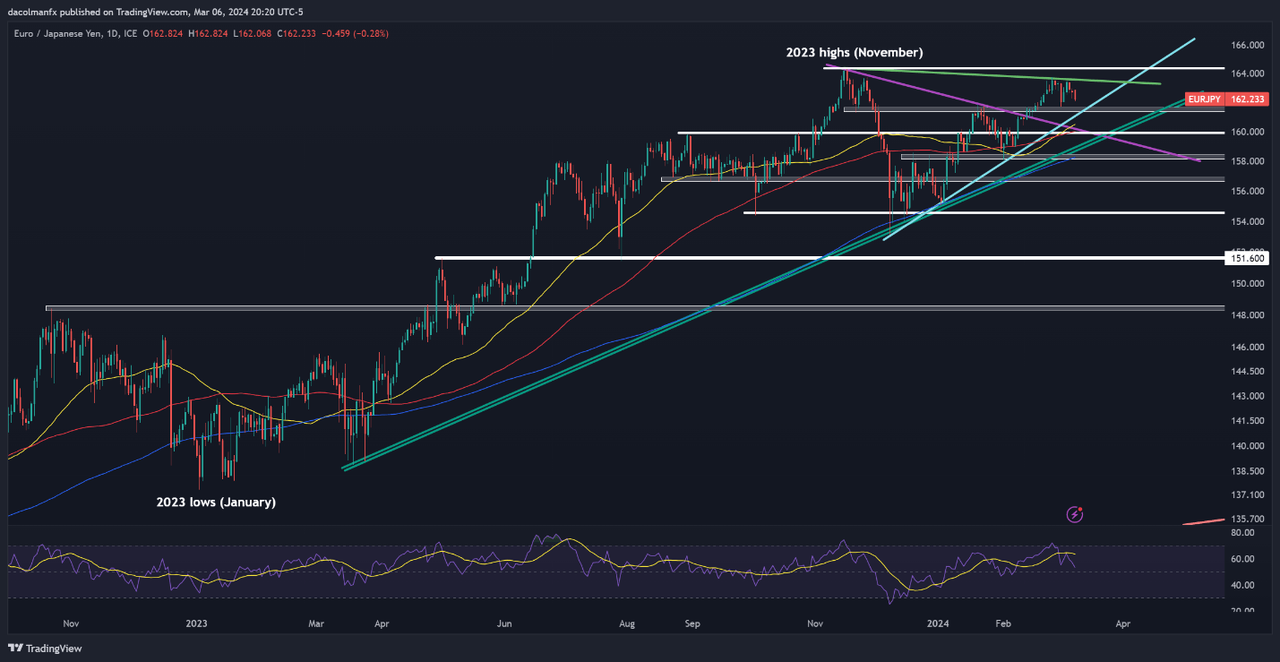
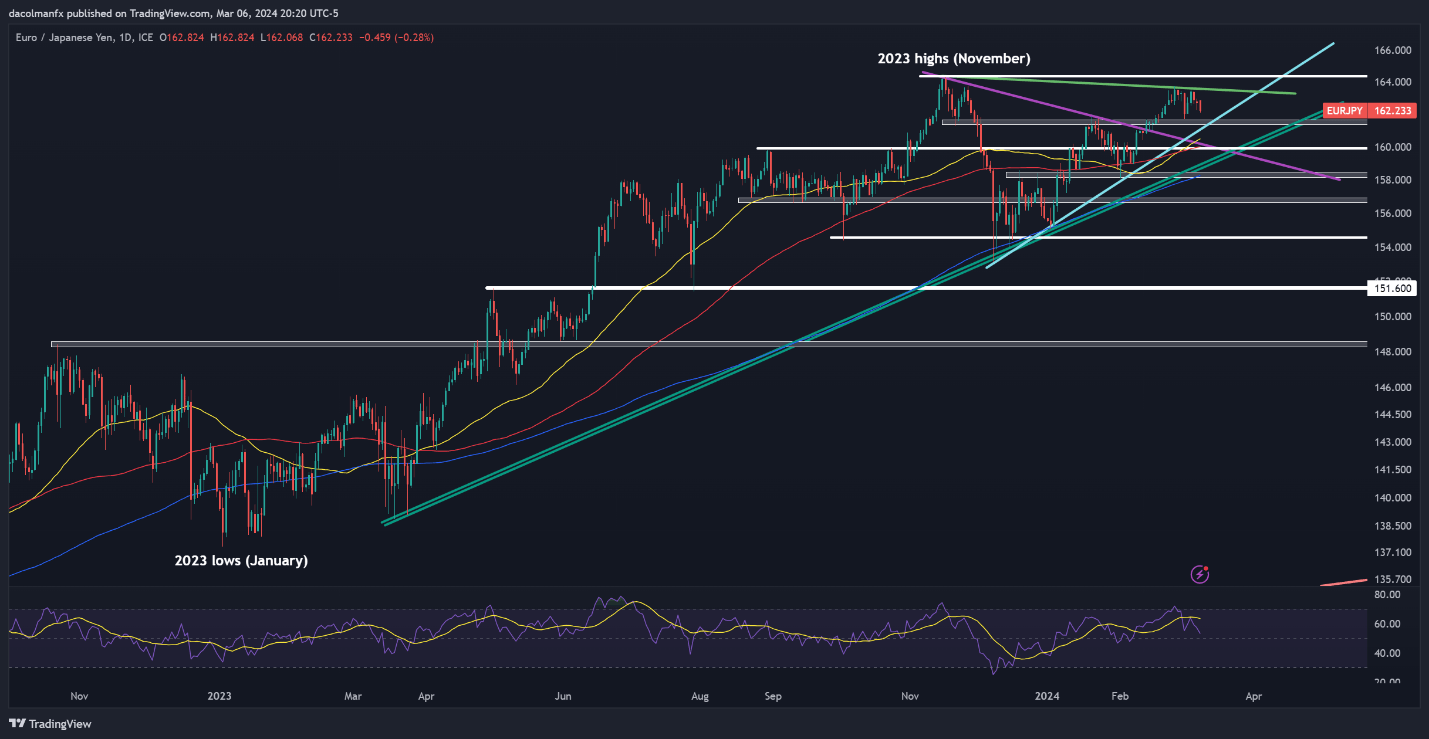
EUR/JPY FORECAST – TECHNICAL ANALYSIS

EUR/JPY has lost ground in recent days after failing to clear trendline resistance at 163.50 earlier in the week. If losses accelerate in the coming trading sessions, confluence support emerges around 161.50. Should this technical floor fail, the spotlight will be on the 160.40-160.00 range, followed by 159.00.

Alternatively, if buyers regain control and trigger a meaningful rebound, primary resistance can be identified at 163.50, as previously noted. It’s too early to determine if bulls will gather the strength to take out this barrier, but if they do, a potential move towards last year’s peak near 164.30 could be in the cards.

EUR/JPY PRICE ACTION CHART

A screen shot of a graph  Description automatically generated


Trend Trading

Trend Trading

How to Define Trend – Time Frames

This is a key sticking point for new traders but if you observe a trend on a five minute chart, it may be completely divorced from what’s going on with the hourly or daily chart. And further, even for intermediate traders that are tracking a trend on a daily chart, well that may be different than the trend on the weekly chart which is often used for swing strategies.

So first things first, traders should assure that they’re evaluating markets and setups on an apples-to-apples basis, and one way of moving towards this end is affixing the time frames that are being used in the strategy.

This can be particularly important for trend trading strategies as the trader is often looking to ‘buy low, sell high’ by evaluating a trend and then looking at a shorter-term chart in order to trigger the entry.

For purposes of this article, we’re going to default to the ‘swing trader’ approach which often looks to daily charts for trends and four hour charts for more specific strategy information that can be used for entry.

How to Define Trend – Methodology

Once the charting time frames have been decided on, we can move on to methodology. There are numerous ways that traders can look to define trend but in this article we’re going to focus on some of the more common.

Moving Averages

This is probably one of the more common ways of going about grading trends and there’s even a few popular moving averages that traders will use. The 200 day moving average is of course one of the more common and this is a popular indicator that many traders will keep on their charts, both for experienced and new traders.

The downside of the 200 day moving average is that it may not be very actionable given the proximity of price. If a strong trend develops, price can continue to climb above that moving average for a very long time. And when the trend does finally calm and price has pulled far away from that indicator, there could be an extended period of time before price re-crosses the moving average. So, while this can be a strong trend filter and is very popular with a number of technicians, it also may not be as usable as what many traders are looking for in terms of trend diagnostics.

This has motivated traders to utilize shorter-term moving averages, such as 20, 50 or 100 periods; allowing for greater gradience in trend trading. In the below graphic, I’ve added moving averages at 20, 100 and 200 periods, and you can see how the faster indicators (with lower input values) respond more quickly to near-term price movements. While the 200 day moving average in blue is relatively slow to respond.

EUR/USD with Moving Averages Applied

Moving Average Crossovers

Extended that logic, traders can then plot multiple moving averages in the aim of grading momentum. If, for instance, the trader is using a 50 period moving average, that indicator should react much more quickly to a new price move than a longer moving average, such as 200 periods. The very act of the 50 period moving average crossing the 200 period moving average can be seen as a trend tool, pointing to the possibility of continuation once that crossover takes place.

These are incredibly popular and you’ve likely seen then referenced on television or in the media. The 50 period moving average crossing up and over the 200 period moving average is called the ‘golden cross,’ while the opposite move of the 50 period moving average crossing down and under the 200 period moving average is called the ‘death cross.’

Similarly, these indications can be used as trend filters with the ‘golden cross’ functioning as a bullish indicator while the death cross functions as a bearish indicator which traders can then use to help determine entries and exits.

On the below chart of GBP/USD, I’ve added red circles around ‘death crosses’ and blue circles around ‘golden crosses.’ Notice that when markets continue to trend, the signals from that moving average crossover can work out well. But, on the other side, when markets are somewhat choppy, as they were in the left side of the below graphic, those signals can work out badly.

GBP/USD Daily Chart: Golden and Death Crosses Identified

Chart prepared by James Stanley

Price Action

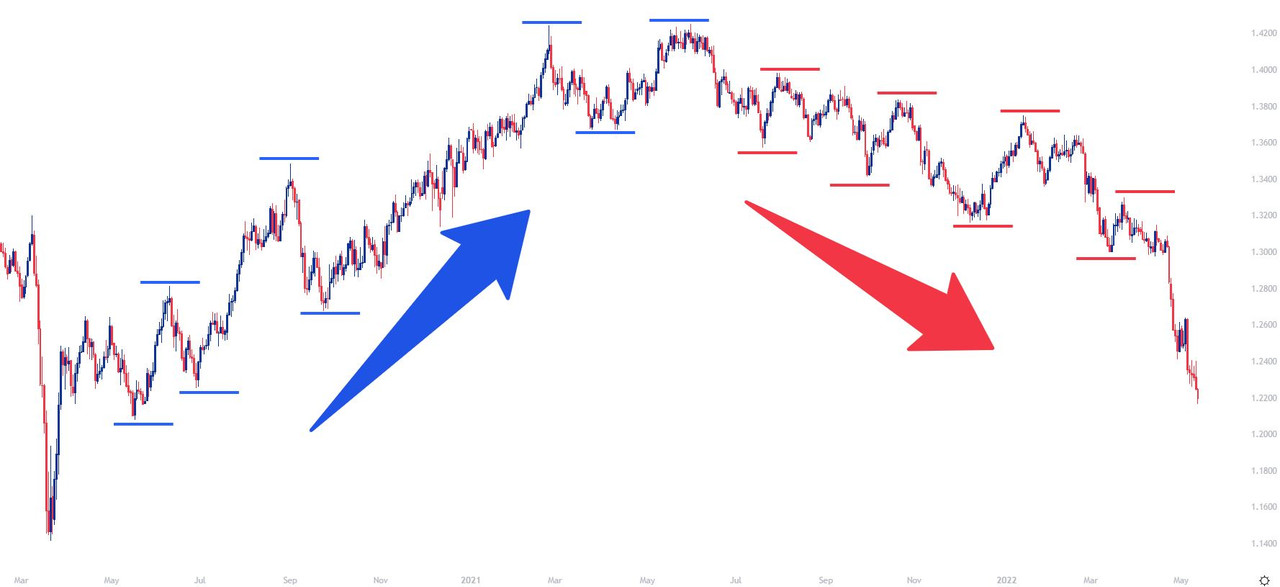
Price action is a bit more subjective than moving averages but, similarly, this is a common method of trend diagnoses. Uptrends will show a series of higher-highs and higher-lows. While downtrends will often display the opposite, lower-lows and lower-highs.

We look at this in greater depth in our price action trends article, which can be found in our price action sub-module.

GBP/USD Daily Price Chart


The European Central Bank: A Forex Trader’s Guide

The European Central Bank: A Forex Trader’s Guide

What is the ECB

The European Central Bank acts as the central bank for the 19 countries that belong to the eurozone. The European Central Bank is overseen by a governing council that consists of six executive board members, with one serving as the president. The executive board members are appointed by the European Council.

The European Central Bank’s primary objective is to maintain price stability. They use monetary policy to support the economy and job creation.

Key Economic Mandates of the ECB

The European Central Bank’s primary mandate or objective is price stability. Price stability is the control of inflation, Harmonised Index of Consumer Prices (HICP) and the exchange rate of the EUR.

1) Price Stability – which is price stability or inflation

2) Financial stability – Through the control of price stability and sometimes other mechanisms.

Price Stability

To maintain price stability, the European Central Bank influences the short-term interest rate for the eurozone. The European Central Bank has a target interest rate (like most central banks) of below, or close to, 2%. Although they target inflation mostly, GDP and unemployment data have a big effect on the decisions the policy makers make.

If inflation goes above 2%, the European Central Bank may signal a hiking of the interest rate to the public to tighten the eurozone’s economic expansion and bring down inflation. If unemployment numbers are increasing and the economy is slowing down, the bank may have to make the decision to decrease interest rates, to stimulate the economy and job growth. A period of rising inflation and increasing unemployment will require the policy makers to weigh the pros and cons of tightening the economy to reign-in inflation or stimulate the economy to produce jobs.

Financial Stability

The European Central Bank also plays a large role in keeping the eurozone’s financial system stable. In times of a crisis they can do this by adding liquidity to the system, either by buying bonds on the open market or decreasing the interest rate to extremely low levels to help distressed debt holders pay back their obligations.

If the European Central Bank does not add liquidity in times of a crisis, the entire financial system could collapse.

How ECB interest rates affect the Euro

Interest rate impact on the Euro

The European Central Bank can affect the value of the Euro through changes in interest rate expectations. Traders should understand that currencies tend to appreciate when interest rate expectations increase, not just from increases in the nominal interest rate.

For example, if the European Central Bank keeps interest rates unchanged but issues forward guidance (tells the market) that they expect more interest rate hikes in future, the value of the Euro tends to appreciate.

A quantitative easing program (QE) has a similar effect to interest rates on the Euro. Quantitative easing is the buying of securities on the open market by a Central Bank in order to stimulate the economy and add liquidity to the financial system. Historically it has only been done in times of a financial crisis. Increased quantitative easing reduces the value of the Euro because it increases the amount of money in supply.

Interest rate impact on the economy

The European Central Bank lowers interest rates when it is trying to stimulate the economy (GDP) and increases interest rates when it is trying to contain inflation caused by an economy operating above potential (overheating).

Lower interest rates stimulate an economy in a few ways:

  1. Businesses can borrow money and invest in projects that will receive more than the risk borrowing rate.
  2. When interest rates are lower the stock market is discounted at a lower rate, leading to an appreciation in stock market values which causes a wealth effect.
  3. People invest their money into the economy (stocks and other assets) because they can earn more in these assets than at currently low interest rates.

How to trade ECB interest rate decisions

The table below displays the possible scenarios that come from a change in interest rate expectations. Traders can use this information to forecast if the currency is likely to appreciate or depreciate and how to trade it.

Market expectations Actual Results Resulting FX Impact
Rate Hike Rate Hold Depreciation of currency
Rate Cut Rate Hold Appreciation of currency
Rate Hold Rate Hike Appreciation of currency
Rate Hold Rate Cut Depreciation of currency

Let’s look at an example, EUR/USD, where the European Central Bank ended its long-time program of quantitative easing. Ending the quantitative easing program means that the central bank would no longer be adding more money to the system. On December 13, 2018 the European Central Bank announced an end to its quantitative easing program, which led to an appreciation in the Euro because it signalled that less money than expected would be in the economy.

European central bank ends quantitative easing program

Top Takeaways of the ECB and Forex Trading

  • The European Central Bank is fundamental to the value of the Euro.
  • The Euro tends to appreciate or depreciate depending on changes in interest rate expectations, not just on actual changes.
  • Quantitative easing has a similar effect to changes in interest rates. Changes in expectations of quantitative easing will have an effect on the Euro.
  • Rising inflation does not mean the European Central Bank will increase interest rates, it depends on the balance between economic growth and inflation. The ECB will raise rates if inflation is close to, at, or above target – the ECB’s primary mandate is to maintain price stability (inflation).
How Central Banks Impact the Forex Market

How Central Banks Impact the Forex Market

The role of central banks in the forex market

Central banks are mainly responsible for maintaining inflation in the interest of sustainable economic growth while contributing to the overall stability of the financial system. When central banks deem it necessary they will intervene in financial markets in line with the defined “Monetary Policy Framework”. The implementation of such policy is highly monitored and anticipated by forex traders seeking to take advantage of resulting currency movements.

This article focuses on the roles of the major central banks and how their policies affect the global forex market.

What is a central bank?

Central Banks are independent institutions utilized by nations around the world to assist in managing their commercial banking industry, set central bank interest rates and promote financial stability throughout the country.

Central banks intervene in the financial market by making use of the following:

  • Open market operations: Open market operations (OMO) describes the process whereby governments buy and sell government securities (bonds) in the open market, with the aim of expanding or contracting the amount of money in the banking system.
  • The central bank rate: The central bank rate, often referred to as the discount, or federal funds rate, is set by the monetary policy committee with the intention of increasing or decreasing economic activity. This may seem counter-intuitive, but an overheating economy leads to inflation and this is what central banks aim to maintain at a moderate level.

Central banks also act as a lender of last resort. If a government has a modest debt to GDP ratio and fails to raise money through a bond auction, the central bank can lend money to the government to meet its temporary liquidity shortage.

Having a central bank as the lender of last resort increases investor confidence. Investors are more at ease that governments will meet their debt obligations and this helps to lower government borrowing costs.

Major central banks

Federal Reserve Bank (United States)

American flag representing the US central bank

The Federal Reserve Bank or “The Fed” presides over the most widely traded currency in the world according to the Triennial Central Bank Survey, 2016. Actions of The Fed have implications not only for the US dollar but for other currencies as well, which is why actions of the bank are observed with great interest. The Fed targets stable prices, maximum sustainable employment and moderate long-term interest rates.

European Central Bank (European Union)

European unio flag representing the European Central Bank

The European central bank (ECB) is like no other in that it serves as the central bank for all member states in the European Union. The ECB prioritizes safeguarding the value of the Euro and maintaining price stability. The Euro is the second most circulated currency in the world and therefore, generates close attention by forex traders.

Bank of England

English flag representing the Bank of England

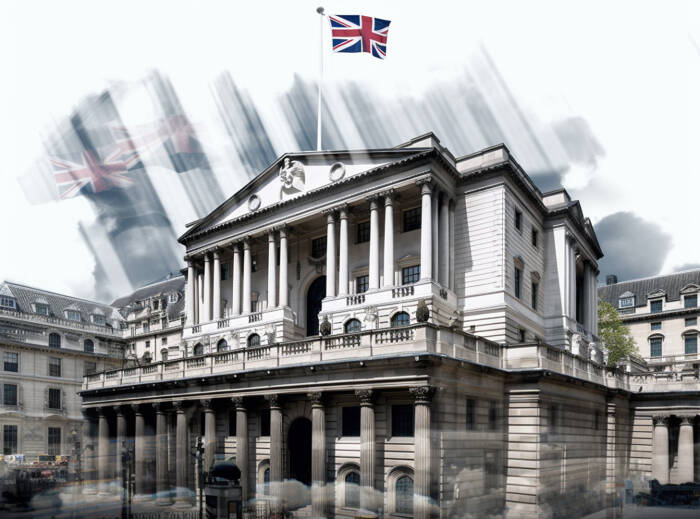
The Bank of England operates as the UK’s central bank and has two objectives: monetary stability and financial stability. The UK operates using a Twin Peaks model when regulating the financial industry with the one “peak” being the Financial Conduct Authority (FCA) and the other the Prudential Regulating Authority (PRA). The Bank of England prudentially regulates financial services by requiring such firms to hold sufficient capital and have adequate risk controls in place.

Bank of Japan

Japanese flag representing the Bank of Japan

The Bank of Japan has prioritized price stability and stable operations of payment and settlement systems. The Bank of Japan has held interest rates below zero (negative interest rates) in a drastic attempt to revitalize the economy. Negative interest rates allow individuals to get paid to borrow money, but investors are disincentivised to deposit funds as this will incur a charge.

Central bank responsibilities

Central banks have been established to fulfil a mandate in order to serve the public interest. While responsibilities may differ between countries, the main responsibilities include the following:

1) Achieve and maintain price stability: Central banks are tasked with protecting the value of their currency. This is done by maintaining a modest level of inflation in the economy.

2) Promoting financial system stability: Central banks subject commercial banks to a series of stress testing to reduce systemic risk in the financial sector.

3) Fostering balanced and sustainable growth in an economy: In general, there are two main avenues in which a country can stimulate its economy. These are through Fiscal policy (government spending) or monetary policy (central bank intervention). When governments have exhausted their budgets, central banks are still able to initiate monetary policy in an attempt to stimulate the economy.

4) Supervising and regulating financial institutions: Central banks are tasked with the duty of regulating and supervising commercial banks in the public interest.

5) Minimize unemployment: Apart from price stability and sustainable growth, central banks may have an interest in minimising unemployment. This is one of the goals from the Federal Reserve.

Central Banks and interest rates

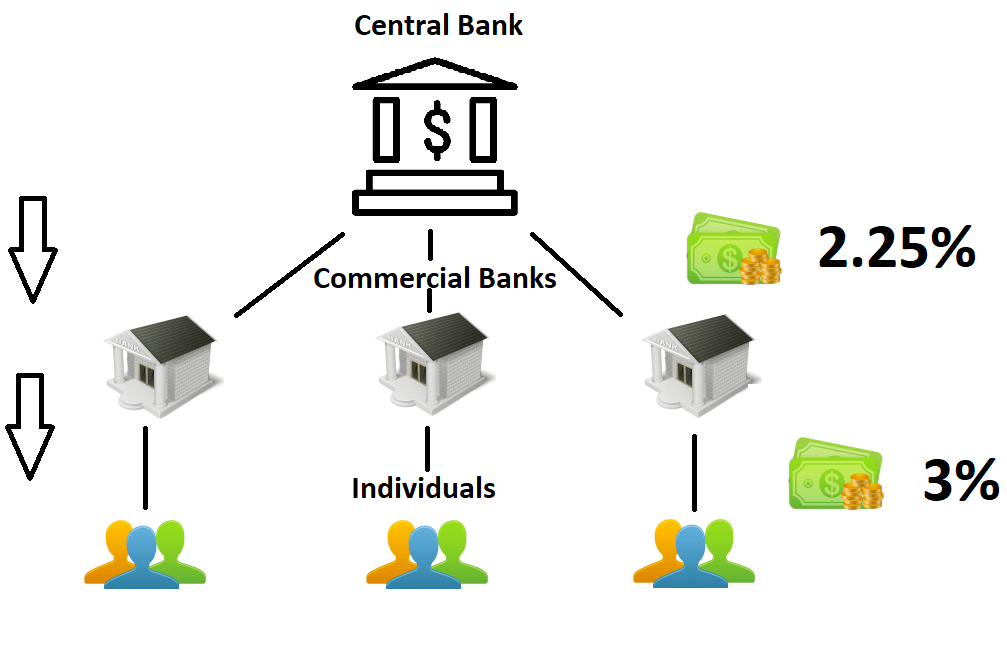
Central banks set the central bank interest rate, and all other interest rates that individuals experience on personal loans, home loans, credit cards etc, emanate from this base rate. The central bank interest rate is the interest rate that is charged to commercial banks looking to borrow money from the central bank on an overnight basis.

This effect of central bank interest rates is depicted below with the commercial banks charging a higher rate to individuals than the rate they can secure with the central bank.
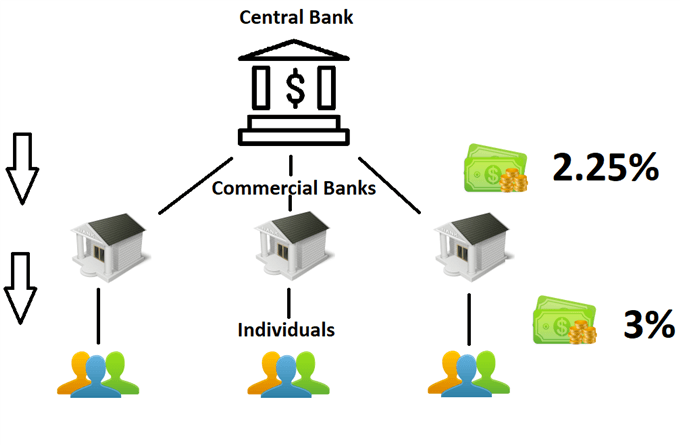
Central bank FX rates filtering down the system

Commercial banks need to borrow funds from the central bank in order to comply with a modern form of banking called Fractional Reserve Banking. Banks accept deposits and make loans meaning they need to ensure that there is sufficient cash to service daily withdrawals, while lending the rest of depositors’ money to businesses and other investors that require cash. The bank generates revenue through this process by charging a higher interest rate on loans while paying lower rates to depositors.

Central banks will define the specific percentage of all depositors’ funds (reserve) that banks are required to set aside, and should the bank fall short of this, it can borrow from the central bank at the overnight rate, which is based on the annual central bank interest rate.

FX traders monitor central bank rates closely as they can have a significant impact on the forex market. Institutions and investors tend to follow yields (interest rates) and therefore, changes in these rates will result in traders channelling investment towards countries with higher interest rates.

How central banks impact the forex market

Forex traders often assess the language used by the chairman of the central bank to look for clues on whether the central bank is likely to increase or decrease interest rates. Language that is interpreted to suggest an increase/decrease in rates is referred to as Hawkish/Dovish. These subtle clues are referred to as “forward guidance” and have the potential to move the forex market.

Traders that believe the central bank is about to embark on an interest rate hiking cycle will place a long trade in favour of that currency, while traders anticipating a dovish stance from the central bank will look to short the currency.


10 Trading Mistakes to Avoid in Forex Trading

10 Trading Mistakes to Avoid in Forex Trading

Mistake 1: No trading plan

Traders without a trading plan tend to be haphazard in their approach because there is no consistency in strategy. Trading strategies have predefined guidelines and approaches to every trade. This prevents traders from making irrational decisions due to adverse movements. Devoting to a trading strategy is key because veering away may lead to traders plunging themselves into unchartered territory with regards to trading style. This eventually results in trading mistakes due to unfamiliarity. Trading strategies should be tested on a demo account . Once traders are comfortable and understand the strategy, this can be translated to a live account.

Mistake 2: Over-leveraging

Margin/leverage refers to the use of loaned money to open forex positions. While this feature requires less personal capital per trade, the possibility of enhanced loss is real. The use of leverage magnifies gains and losses, so managing the amount of leverage is key. Learn more on what is leverage in the forex market.

Brokers play an important role in protecting their customers. Many brokers offer unnecessarily large leverage levels such as 1000:1 which puts novice and experienced traders at significant risk. Regulated brokers will cap leverage to appropriate levels guided by respected financial authorities. This should be taken into consideration when selecting a fitting broker.

Mistake 3: Lack of time horizon

Time investment works hand in hand with the trading strategy being implemented. Each trading approach aligns itself to varying time horizons, therefore understanding the strategy will lead to gauging the estimated time frame used per trade. For example, a scalper will target shorter time frames whilst positions traders favour the longer time frames. Explore the forex strategies for varying time horizons.

Mistake 4: Minimal research

Forex traders are required to invest in proper research to employ and execute a specific trading strategy. Studying the market as it should be, will bring light to market trends, timing of entry/exit points and fundamental influences as well. The more time dedicated to the market, the greater the understanding of the product itself. Within the forex market, there are subtle nuances between the different pairs and how they work. These differences need thorough examination to succeed in the market of choice.

Reacting to media and baseless advice should be avoided without verification from the employed strategy and analysis. This is a common occurrence with traders. This does not mean these tips and media releases should not be considered, but rather investigated systematically prior to acting on the information.

Mistake 5: Poor risk-to-reward ratios

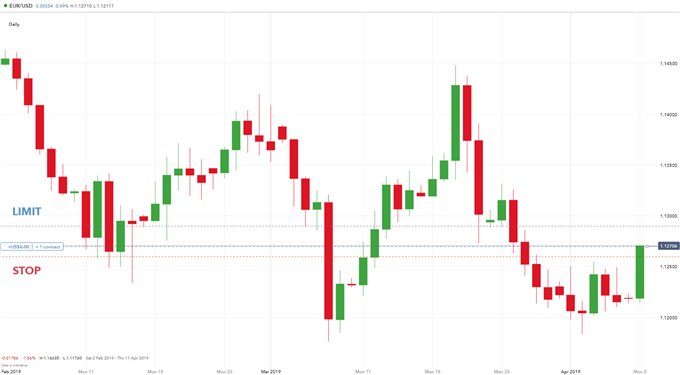
Positive risk-to-reward ratios are often overlooked by traders which can result in poor risk management. A positive risk-to-reward ratio such as 1:2 refers to potential profit being double the potential loss on the trade. The chart below shows a long EUR/USD trade with a 1:2 risk-to-reward ratio. The trade was opened at a level of 1.12698 with a stop at 1.12598 (10 pips) and a limit of 1.12898 (20 pips). An effective indicator to help identify stop and limit levels in forex is the Average True Range (ATR) which uses market volatility to base entry and exit points.

Having a ratio in mind helps to manage expectations of traders, this is important because after much research by DailyFX, improper risk management has proven to be the number one mistake made by traders.

EUR/USD 1:2 risk-to-reward ratio:

EUR/USD risk-t-reward ratio

Mistake 6: Emotion based trading

Emotional trading often leads to irrational and unsuccessful trading. Traders frequently open additional positions after losing trades to compensate for the previous loss. These trades usually have no educational backing either technically or fundamentally. Trading plans are there to avoid this type of trading therefore, it is imperative that the plan is followed closely.

Mistake 7: Inconsistent trading size

Trading size is crucial to every trading strategy. Many traders trade unsuitable sizes in relation to their account size. Risk then increases and could potentially erase account balances. DailyFX recommends risking a maximum of 2% of the total account size. For example, if the account contains $10,000 then a maximum of $200 of risk is suggested per trade. If traders observe this general rule, the pressure of overexposing the account will be removed. The inherent risk of overexposing the account on a particular market is extremely dangerous.

Mistake 8: Trading on numerous markets

Trading on a few markets lets traders gain the necessary experience to become proficient at these markets without scratching the surface of a few markets. Many novice forex traders look to trade on multiple markets without success due to lack of understanding. This is something that should be done on a demo account if need be. Noise trading (irrational trading) often leads traders to place trades without the proper fundamental/technical justification on varying markets. For example, the Bitcoin craze of 2018 sucked in a lot of noise traders at the wrong time. Unfortunately, many traders entered at the ‘FOMO or Euphoria’ stage of the market cycle which resulted in significant losses.

Mistake 9: Not reviewing trades

Frequent use of a trading journal will allow traders to identify possible strategic flaws along with successful facets. This will enhance the traders overall understanding of the market and strategy for future. Reviewing trades not only highlight errors, but beneficial aspects as well which must be reinforced on a constant basis.

Mistake 10: Selecting an unsuitable broker

There are numerous CFD brokers globally, so choosing the right one can be difficult. Financial stability and proper regulation are essential before opening an account with a broker. This information should be readily available on the brokers website. Many brokers are regulated in countries where guidelines are weak, to circumvent regulations in stricter jurisdictions such as the US (Commodity Exchange Act) and the UK (FCA).

Safety is the primary focus; however, a comfortable platform and ease of execution is also central to choosing a broker. Becoming accustomed with the platform and costing should be given ample time prior to trading with live funds.

Forex Trading Mistakes: A Summary

Having the correct foundational base to trade forex is important before undertaking any form of live trading. Taking the time to understand the do’s and don’ts of forex trading will benefit traders in future. All traders will eventually make mistakes but minimizing them as well as eliminating repeat offenses must be practiced and become expected behaviour. The primary focus of this article is to adhere to a trading plan with proper risk management, and a suitable reviewing system.

Gold Price Latest: All-Time High Remains Within Touching Distance

Gold Price Latest: All-Time High Remains Within Touching Distance

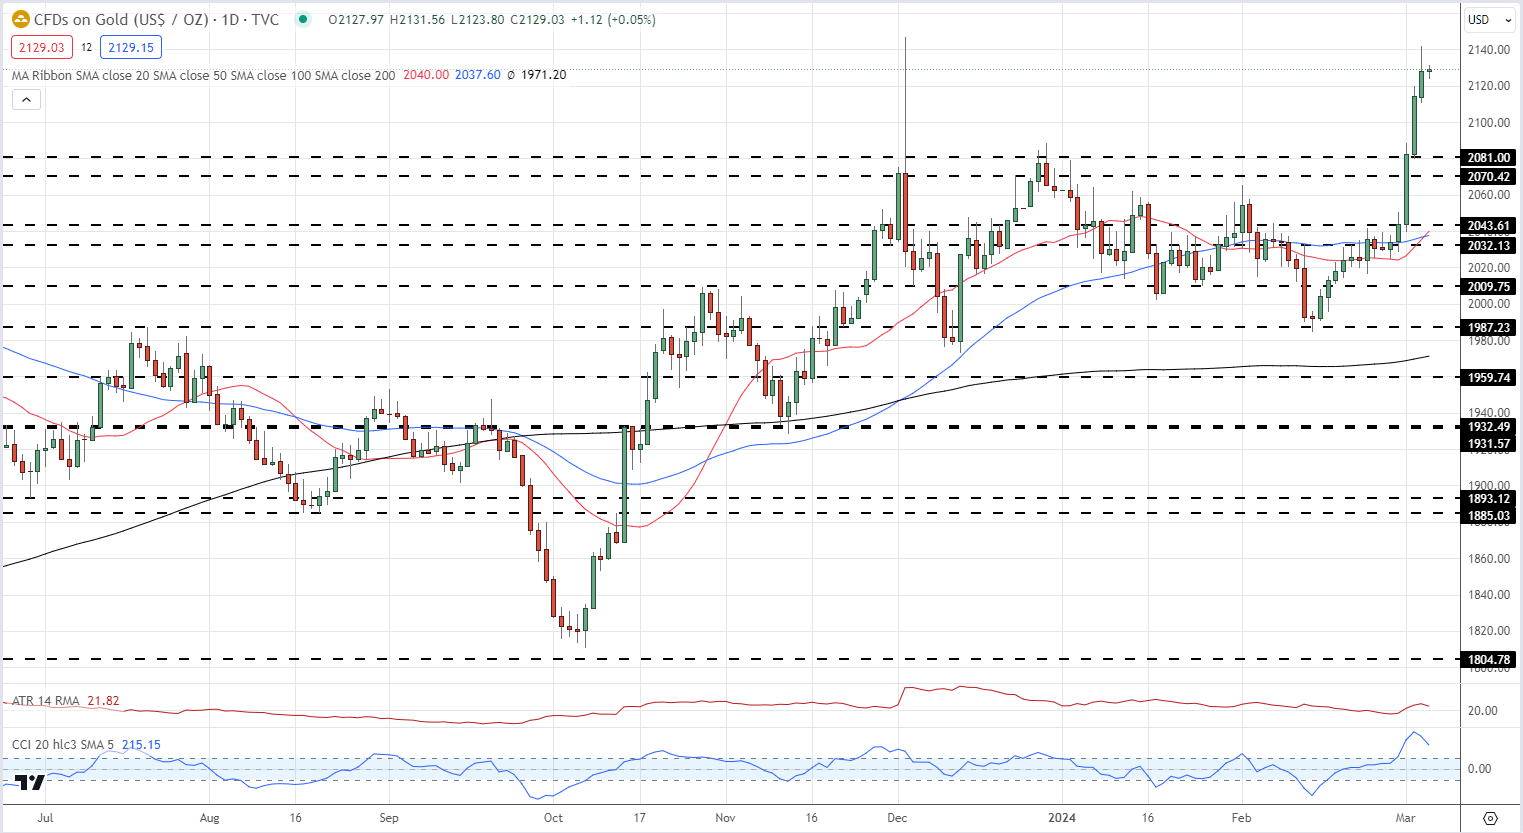
Gold’s recent rally accelerated last Friday, driven higher by weak US economic data, and the rally back towards a new all-time high has continued this week with the precious metal posting a $2,141.8/oz. peak yesterday. This left gold just $3 short of printing a new ATH. The technical outlook for gold remains positive and suggests that the precious metal will continue to move higher.

The drivers for the latest move higher in gold remain the same, the upcoming series of US interest rate cuts – three 25 basis point moves seen this year, starting at the June FOMC meeting – ongoing haven buying on geopolitical fears in Ukraine and the Middle East, and heavy central bank buying as bankers diversify away from the US dollar.

Later today, Fed Chair Jerome Powell will testify to the House Financial Services Committee (15:00 UK). Mr. Powell is not expected to lay out any timetable for interest rate cuts just yet, although any discussions about inflation, or the US labor market, will be keenly followed. The next FOMC meeting is on March 20th and this may be a more appropriate setting for official rate cut discussions.

Learn how to trade economic data and events with our complimentary guide

The daily gold chart remains positive with a prior level of resistance at $2,081/oz. now turning into support. Before that, the $2,114/oz level may act as a buffer after closing there on Monday and opening there on Tuesday. The CCI indicator at the bottom of the chart does show gold to be extremely overbought although this reading is starting to move lower. There may be a short period of consolidation ahead but overall the path of least resistance for gold is higher.

Gold Daily Price Chart

image1.png

Retail trader data show 44.00% of traders are net-long with the ratio of traders short to long at 1.27 to 1.The number of traders net-long is 3.42% higher than yesterday and 18.14% lower than last week, while the number of traders net-short is 5.01% higher than yesterday and 65.42% higher than last week.

We typically take a contrarian view to crowd sentiment, and the fact traders are net-short suggests Gold prices may continue to rise.

Japanese Yen (USD/JPY) on Edge as Signs of Wage Pressures Appear

Japanese Yen (USD/JPY) on Edge as Signs of Wage Pressures Appear

In an interview with Reuters earlier today, Japan’s Deputy Chief Cabinet Secretary Hideki Murai said that early signs of rising inflation and wages were becoming evident in the economy, boosting market hopes that an end to Japan’s multi-decade era of ultra-loose monetary policy may soon be coming to an end.

“We need to revitalise the economy by shifting away from one that prioritizes cost cuts to one where a positive cycle of higher growth and wages kicks in,” Murai said. “We’re gradually seeing such a positive cycle fall into place.”

This positive outlook follows on from recent commentary by Bank of Japan board member Hajime Takata who said that the central bank’s goal of sustainable 2% inflation is ‘finally in sight’.

Japanese Yen Grabs a Bid, Emboldened by Bank of Japan Talk

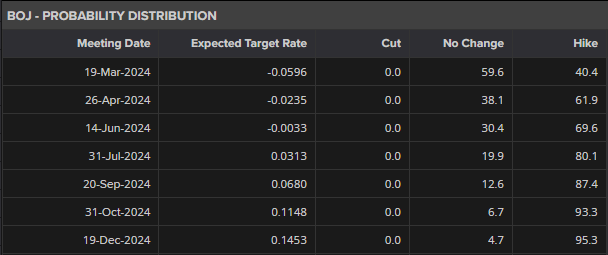
Today’s commentary shifted interest rate hike hikes marginally but not enough to noticeably strengthen the Japanese Yen. According to market probabilities, there is now a 40% chance that the BoJ will hike rates at this month’s meeting, although June remains the most likely meeting for the central bank to take interest rates out of negative territory.

image1.png

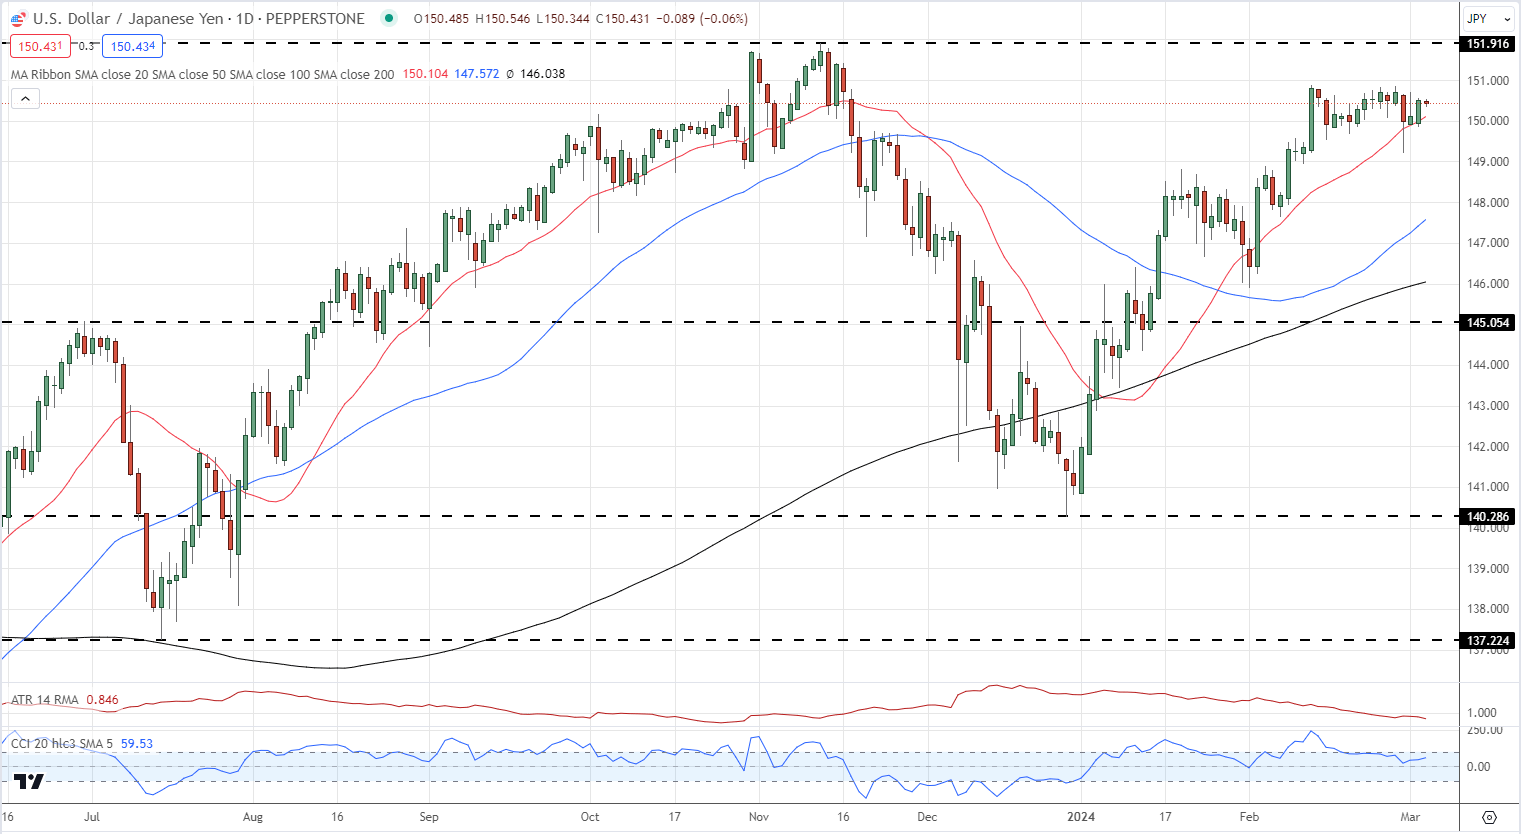
USD/JPY continues to trade just above the 150 level although the pair are finding it difficult to move higher. Further upside is limited with the 151.90 multi-decade high a formidable level of resistance to take out, especially after the recent official commentary. The downside looks the path of least resistance with a few levels of support of prior swing lows and all three simple moving averages before the 145 area comes into view.

USD/JPY Daily Price Chart

image2.png

Retail trader data 21.93% of traders are net-long with the ratio of traders short to long at 3.56 to 1.The number of traders net-long is 3.12% higher than yesterday and 13.50% lower than last week, while the number of traders net-short is 6.83% higher than yesterday and 6.43% higher than last week.

We typically take a contrarian view to crowd sentiment, and the fact traders are net-short suggests USD/JPY prices may continue to rise.

Dax and Dow Fall Back Further, while Hang Seng’s Latest Leg Lower Gathers Pace

Dax and Dow Fall Back Further, while Hang Seng’s Latest Leg Lower Gathers Pace

DAX 40, Dow Jones 30, Hang Seng Analysis, Prices, and Charts

​​​Dax retreats from previous peak

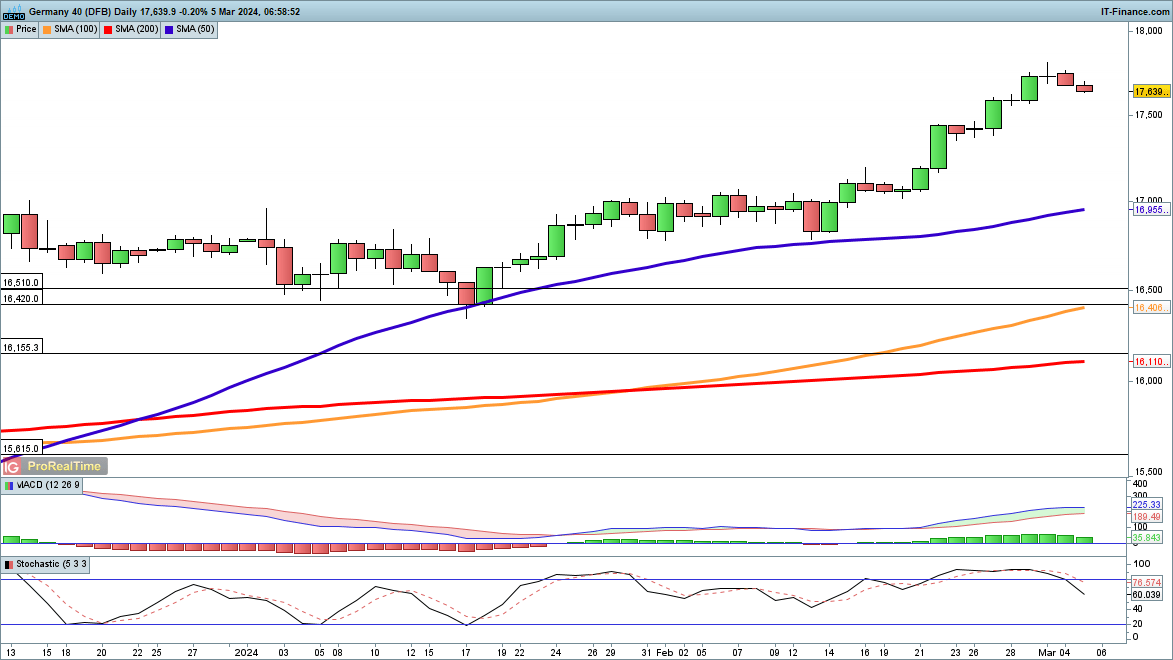
​The index recorded a fresh record high last week surging briefly to 17,816 before falling back.​It has continued to move lower in the short term, though this barely puts a dent in the gains made throughout February. A steady drift lower, coupled with a bearish MACD crossover, could precipitate a pullback over time to the rising 50-day simple moving average (SMA), as happened over December.

​This would leave the uptrend intact, and create a higher low.

DAX 40 Daily Chart

​Dow Jones edges down

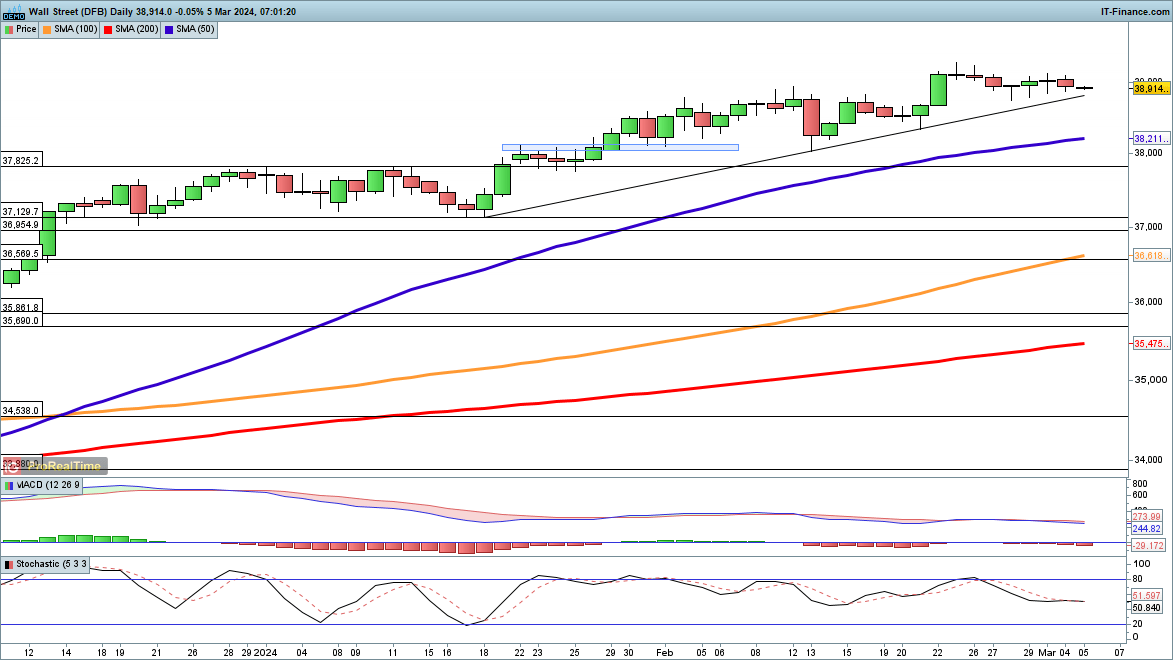
​A slow move lower continues here, as the price drops back from the highs of late February and nears rising trendline support from the late January low. ​Should support be broken then the 50-day SMA becomes the next destination to watch for support, along with the 13 February low at 38,037.

A recovery back above 39,000 could signal that a bounce off trendline support has initiated a move back to record highs and potentially beyond.

Dow Jones Daily Chart

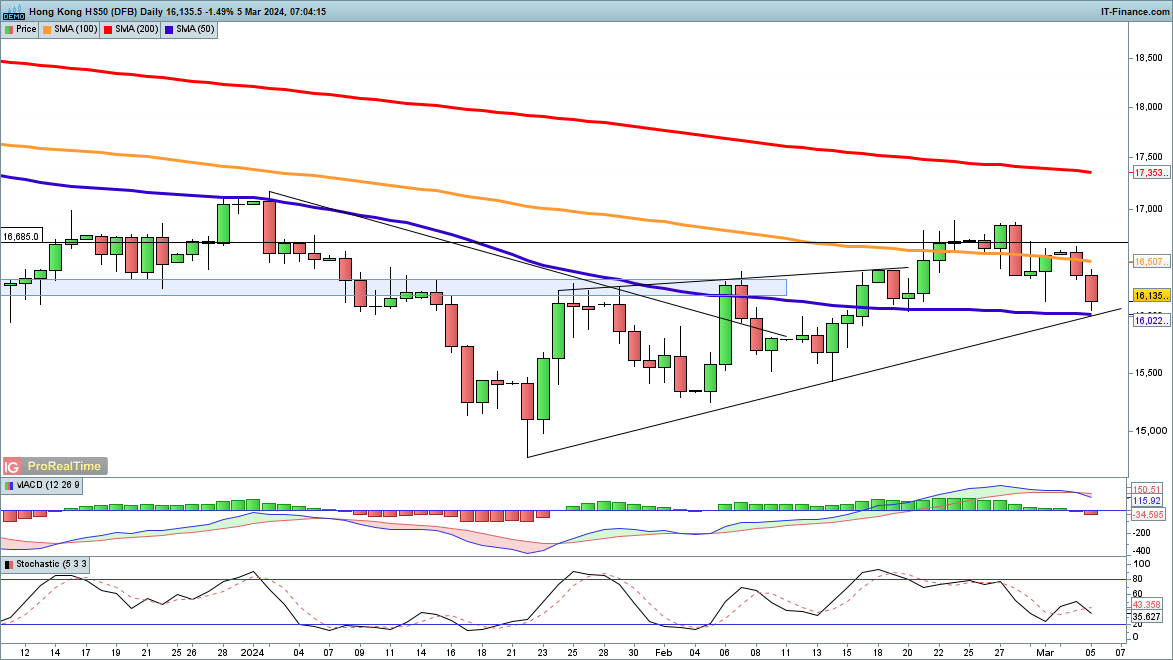
​Hang Seng heads lower​After recording a lower high at the end of February, the index has dropped back below the 100-day SMA. ​It is now heading towards the 50-day SMA, as well as rising trendline support from the January low. A close below both these lines, coupled with the developing bearish MACD crossover, could mark the beginning of a new leg lower.

​This might then target the lows of January at 17,745. A bounce-off trendline support might yet see the price move back towards the late February highs.

Hang Seng Daily Chart

Crypto News Today: SHIB Joins DOGE in the Top Ten as BTC Nears ATH

Crypto News Today: SHIB Joins DOGE in the Top Ten as BTC Nears ATH

BTC Marches Toward the 2021 All-Time High

On Monday, BTC surged 8.02%. Following a 1.80% gain from Sunday, BTC ended the session at $68,201.

BTC-Spot ETF Market Flows Send BTC to a 2024 High

On Tuesday, BTC struck a new 2024 high of $68,735. Investors reacted positively to BTC-spot ETF market data for Monday, March 4.

According to available data, Grayscale Bitcoin Fund (GBTC) saw net outflows fall from $492.4 million to $368.0 million on Monday, March 4. The pullback in net outflows aligned with investor expectations that GBTC net outflows have peaked. Net outflows surged after the  February court approval for Genesis Global Holdco LLC to liquidate GBTC shares worth approximately $1.3 billion.

The BTC-spot ETF market will see net inflows on March 4 despite GBTC outflows.

According to Farside Investors, Fidelity Wise Origin Bitcoin Fund (FBTC) saw net inflows jump from $49.3 million (March 1) to $404.6 million (March 4). The BTC-spot ETF market saw total net inflows of $164.6 million, excluding flow data from iShares Bitcoin Trust (IBIT), Invesco Galaxy Bitcoin ETF (BTCO), and Valkyrie Bitcoin Fund (BRRR).

BTC-spot ETF market sees net inflows
Memecoins Outmuscle BTC and the Broader Crypto MarketDogecoin (DOGE) dwarfed BTC and the broader market on Monday, surging 17.85% to end the session at $0.1816. On Tuesday, DOGE continued its extended rally since February 26, striking a session high of $0.2069. DOGE last visited the $0.20 handle in January 2022.

DOGE returns to $0.20
DOGE Daily Chart 050324However, shiba inu (SHIB) led DOGE by percentage gains on Monday, rocketing 59.67% to end the session at $0.00003599. SHIB was up 20.23% to $0.00004327 on Tuesday. Significantly, SHIB struck an early Tuesday high of $0.00004575 before easing back. SHIB last visited the $0.000045 handle in December 2021.

SHIB revisits $0.000045.
SHIB Daily Chart 050324The breakout trends have sent DOGE to the number 8 spot by market cap and SHIB into the top ten, according to CoinMarketCap.

Technical Analysis

Bitcoin Analysis

BTC remained well above the 50-day and 200-day EMAs, affirming bullish price signals.

A BTC break above the Tuesday high of $68,735 would support a break above the all-time high of $69,276.

BTC-spot ETF market flows remain the focal point.

However, a break below the $67,500 handle would support a fall to the $65,000 handle.

The 14-Daily RSI reading, 85.55, shows BTC in overbought territory. Selling pressure could intensify at the Tuesday high of $68,735.

BTC Daily Chart sends bullish price signals.
BTCUSD 050324 Daily Chart

Ethereum Analysis

ETH sat well above the 50-day and 200-day EMAs, sending bullish price signals.

An ETH break above the $3,683 resistance level would support a move toward the $3,750 handle.

ETH-spot ETF-related updates also need consideration.

However, an ETH drop below the $3,500 handle would bring the $3,412 support level into view.

The 14-period Daily RSI, at 85.19, shows ETH in overbought territory. Selling pressure could intensify at the $3,683 resistance level.

ETH Daily Chart sends bullish price signals.
ETHUSD 050324 Daily Chart