Euro Lifted Slightly by US Downgrade, but Will it Last? EUR/USD, EUR/AUD, EUR/NZD Price Action

Euro Lifted Slightly by US Downgrade, but Will it Last? EUR/USD, EUR/AUD, EUR/NZD Price Action

The euro appears to be slightly supported after Fitch Ratings downgraded the United States’ long-term foreign currency issuer default rating to AA+ from AAA. Still, monetary policy and growth differentials suggest the single currency is unlikely to benefit much from Wednesday’s early lift, at least in the near term.

Both central banks, the US Federal Reserve, and the European Central Bank are in wait-and-watch mode with regard to further tightening, leaving very little monetary policy advantage from a relative perspective. From an absolute perspective, higher US rates clearly stand out. However, growth differentials appear to be in favour of the US, arguing for a softer EUR/USD. The US Economic Surprise Index is at its highest level since 2021, while the Euro area Economic Surprise Index is at its lowest level since 2020.

EUR/USD Weekly Chart

image1.png

Chart Created by Manish Jaradi Using TradingView

EUR/USD: Consolidation could continue

EUR/USD’s recent softness could extend a bit further given the stiff hurdle on the 200-week moving average. As highlighted in the previous update, the near-term bias appears to be of consolidation within a broadly constructive outlook. Only a fall below 1.0500-1.0600, including the early-2023 lows, would pose a threat to the broader uptrend. See “US Dollar Slips After Fed Rate Hike: What Has Changed for EUR/USD, GBP/USD, USD/JPY?”, published July 27.

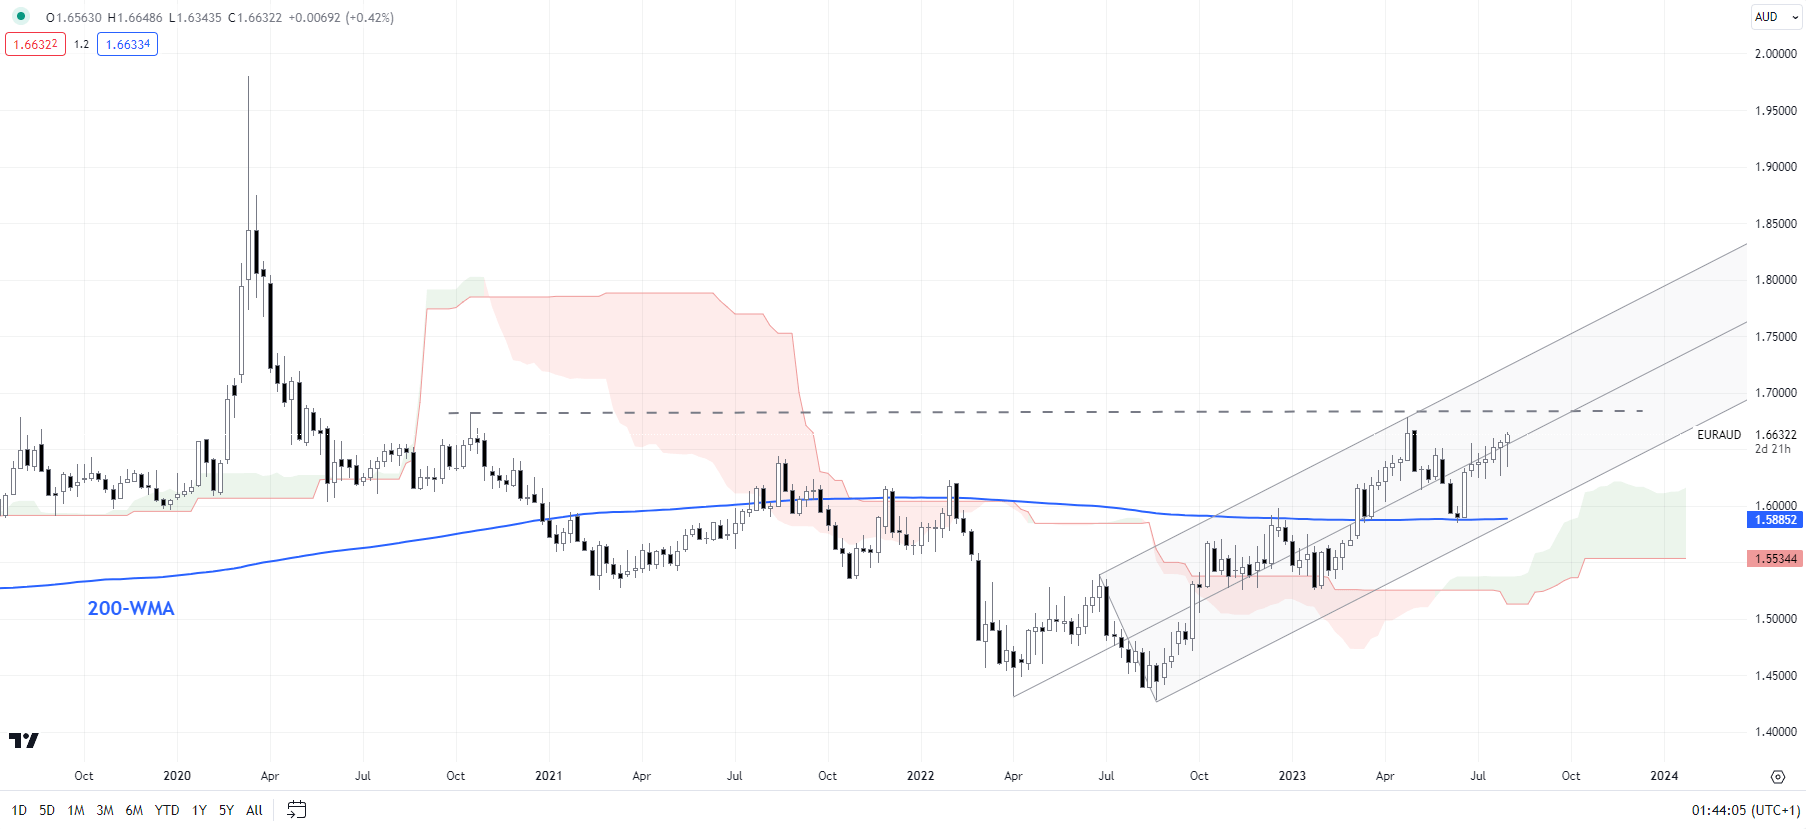
EUR/AUD Weekly Chart

image2.png

Chart Created by Manish Jaradi Using TradingView

EUR/AUD: Broader bullish trend reaffirmed

EUR/AUD has turned higher from near quite strong support at the mid-July low of 1.6230. From a short-term perspective, the trend is at best sideways. However, from a medium-term perspective, the trend is up given the higher-top-higher-bottom sequence since late 2022. The top end of the range is the April high of 1.6800, while the immediate support is at 1.6230.

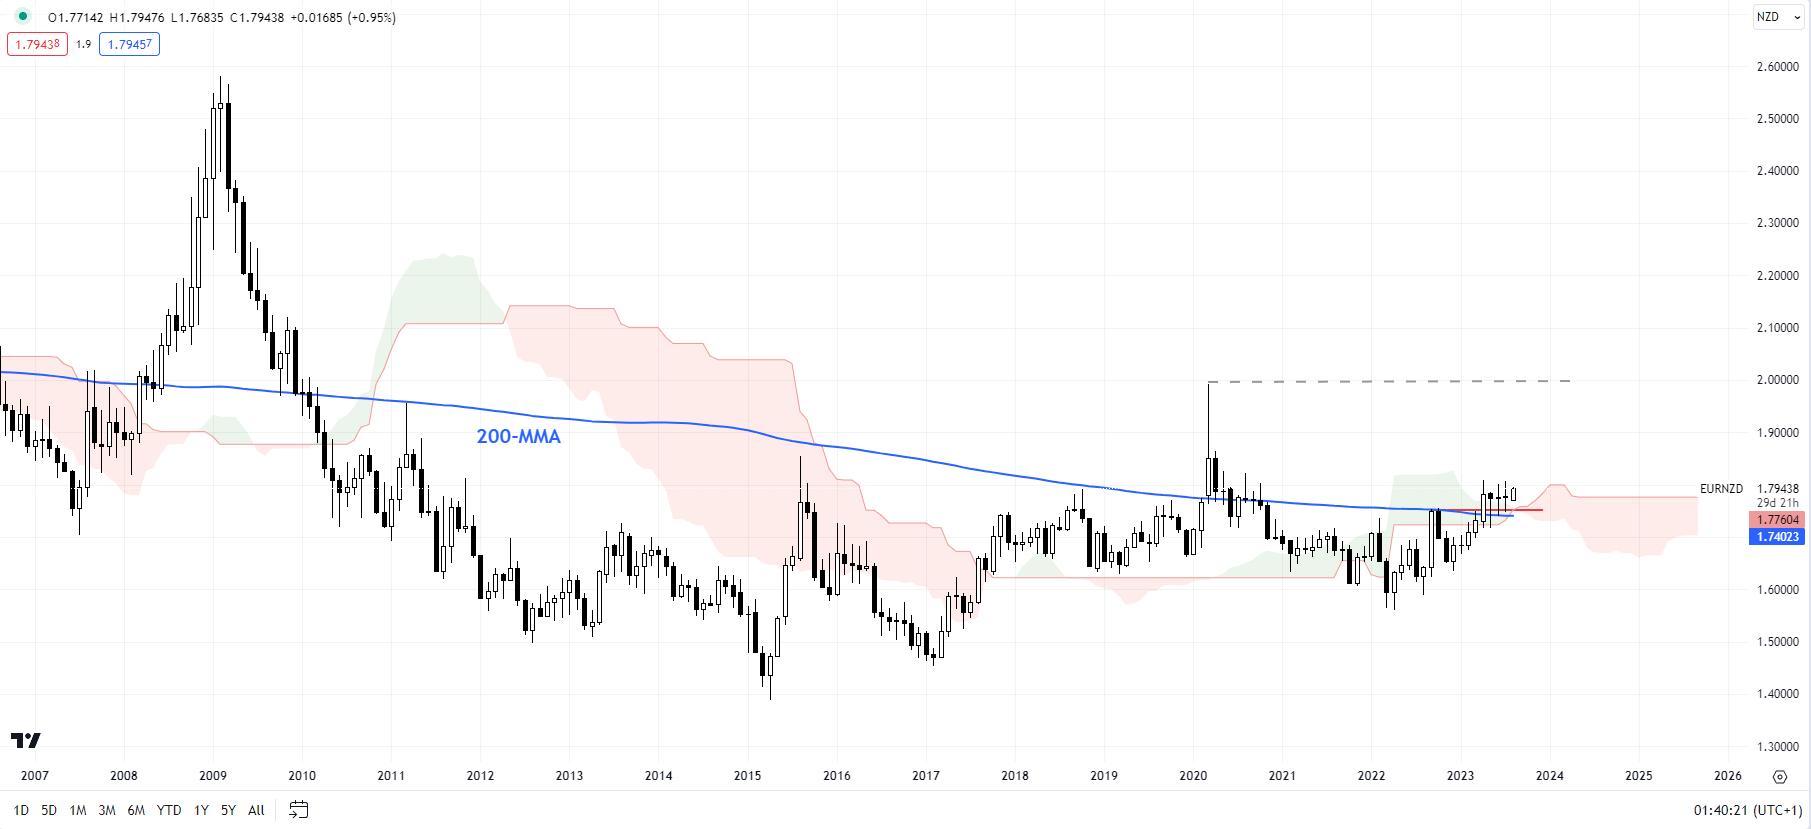
EUR/NZD Monthly Chart

image3.png

Chart Created by Manish Jaradi Using TradingView

EUR/NZD: Boxed in a range

The price action in recent weeks gives very little sense of direction, being boxed in a 1.7200-1.8100 range. Still, within the choppy range, EUR/NZD continues to hold above the crucial floor on the 89-day moving average. Zooming out, though, on the monthly charts, the break this year above the 2022 high of 1.7500 keeps the broader bullish bias intact.

NFP and Forex: What is NFP and How to Trade It?

NFP and Forex: What is NFP and How to Trade It?

What is the NFP?

The non-farm payroll (NFP) figure is a key economic indicator for the United States economy. It represents the number of jobs added, excluding farm employees, government employees, private household employees and employees of nonprofit organizations.

US Non Farm Payroll historical results

NFP releases generally cause large movements in the forex market. The NFP data is normally released on the first Friday of every month at 8:30 AM ET. This article will explain the role NFPs play in economics and how to apply NFP release data to a forex trading strategy.

How does the NFP affect forex?

NFP data is important because it is released monthly, making it a very good indicator of the current state of the economy. The data is released by the Bureau of Labor Statistics and the next release can be found on an economic calendar.

Employment is a very important indicator to the Federal Reserve Bank. When unemployment is high, policy makers tend to have an expansionary monetary policy (stimulatory, with low interest rates). The goal of an expansionary monetary policy is to increase economic output and increase employment.

So, if the unemployment rate is higher than usual, the economy is thought to be running below its potential and policy makers will try to stimulate it. A stimulatory monetary policy entails lower interest rates and reduces demand for the Dollar (money flows out of a low yielding currency). To learn exactly how this works, see our article on how interest rates effect forex.

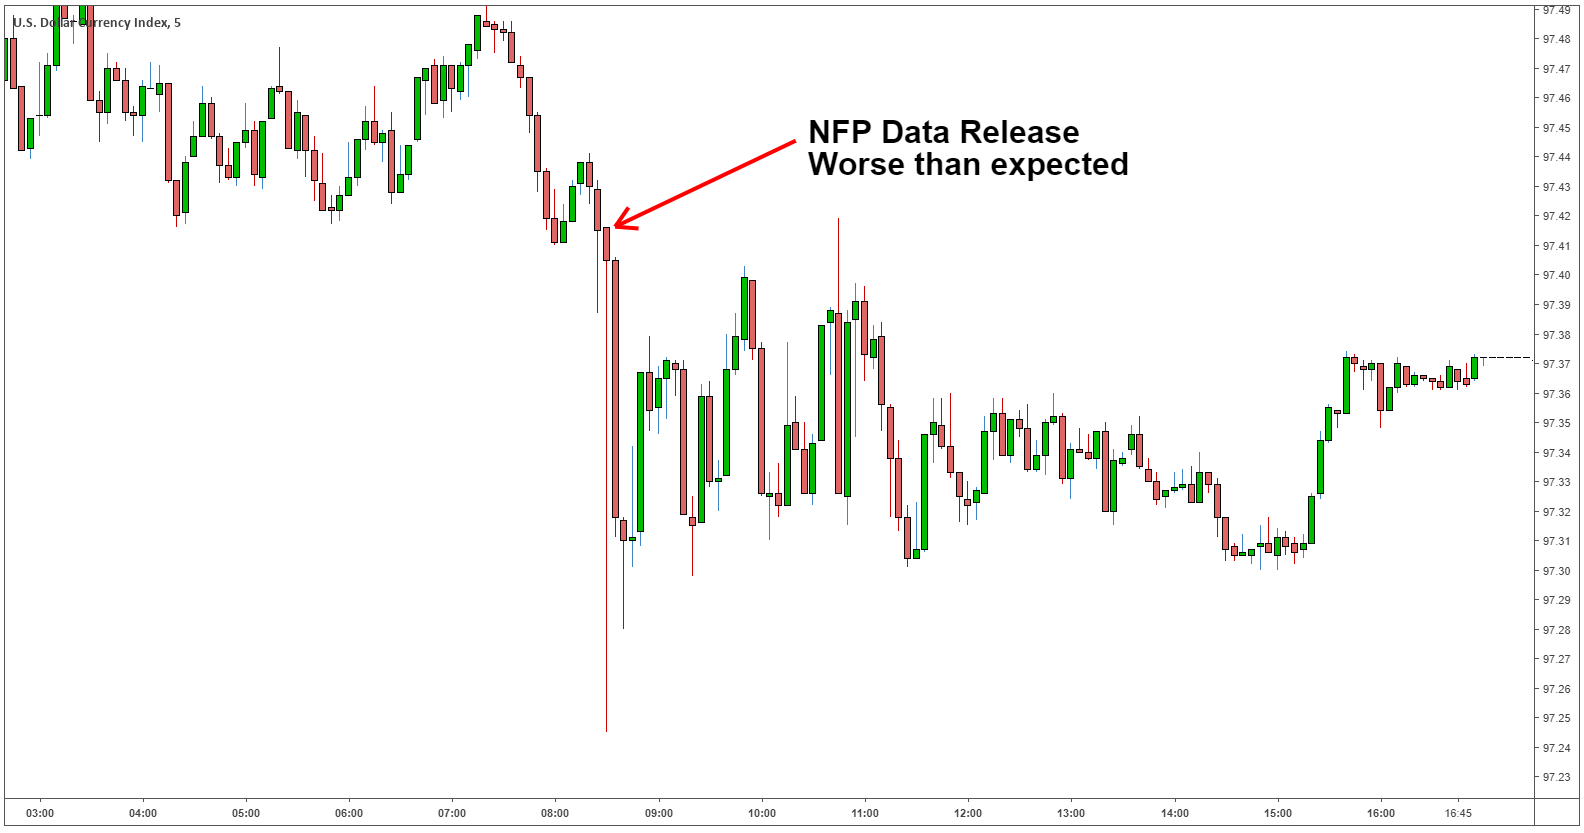
The chart below shows how volatile forex can be after an NFP release. The expected NFP results for March 8, 2019 were 180k (job additions), the actual result disappointed with only 20k jobs being added. As a result, the Dollar Index (DXY) depreciated in value and volatility increased.

NFP forex reaction

Forex traders must be wary of data releases like the NFP. Traders could get stopped-out due to the sudden increase in volatility. When volatility increases, spreads do too, and increased spreads can lead to margin calls.

Which currency pairs are most affected by NFP

The NFP data is an indicator of American employment, so your currency pairs that include the US Dollar (EUR/USD, USD/JPY, GBP/USD, AUD/USD, USD/CHF and others) are most affected by the data release.

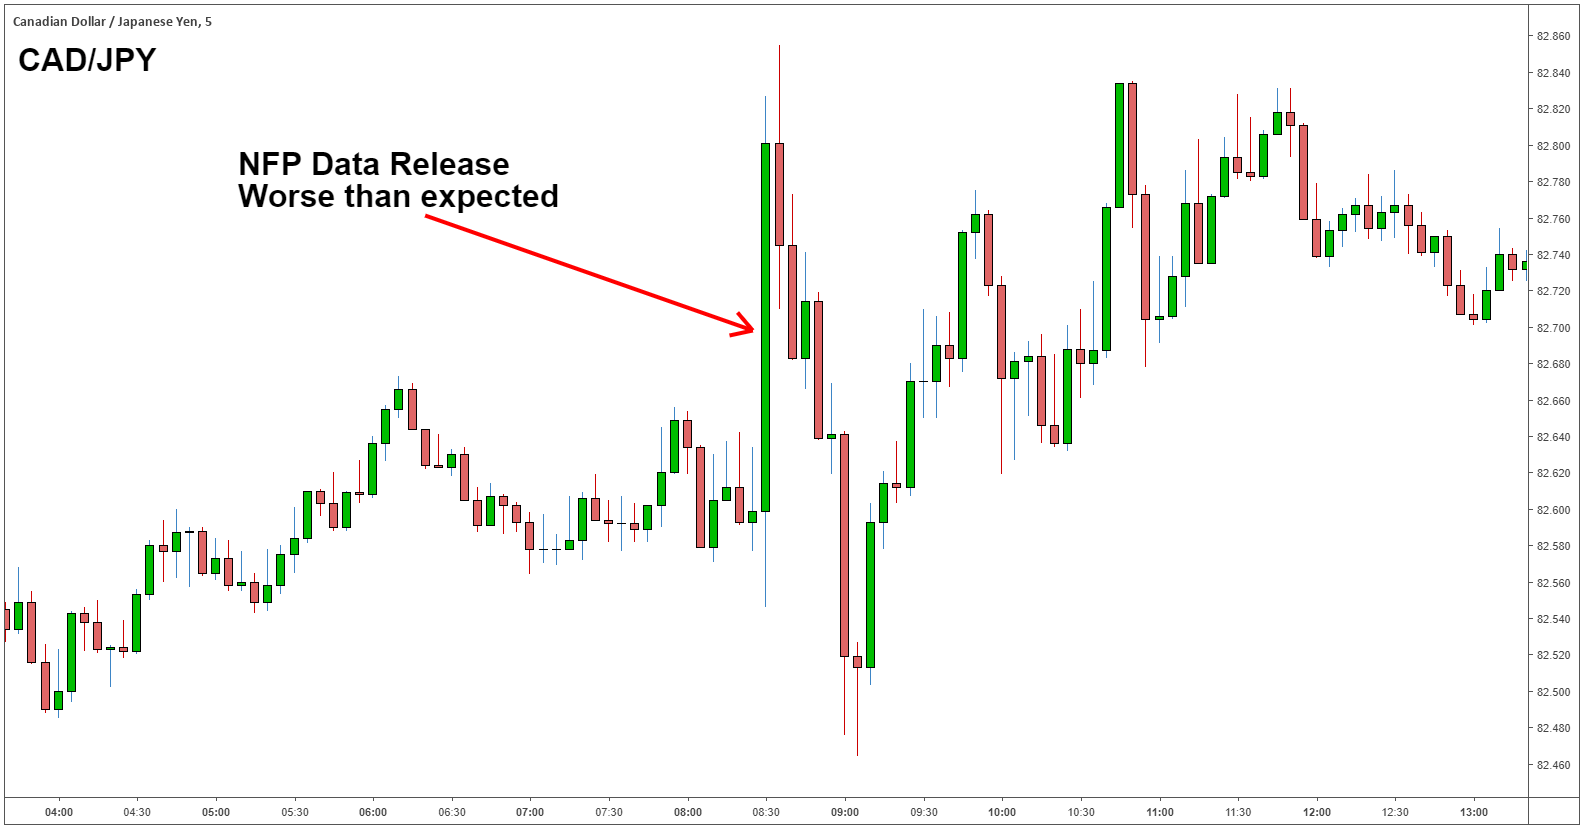
Other currency pairs also display an increase in volatility when the NFP releases, and traders must be aware of this as well, because they may get stopped out. The chart below shows the CAD/JPY during the NFP data release. As you can see, the increase in volatility could stop a trader out of their position even though they are not trading a currency pair linked to the US Dollar.

CAD/JPY NFP reaction

Non-farm payroll release dates

The Bureau of Labor statistics normally releases the NFP data on the first Friday of each month at 8:30 AM ET. The release dates can be found on the Bureau of Labor Statistic’s website.

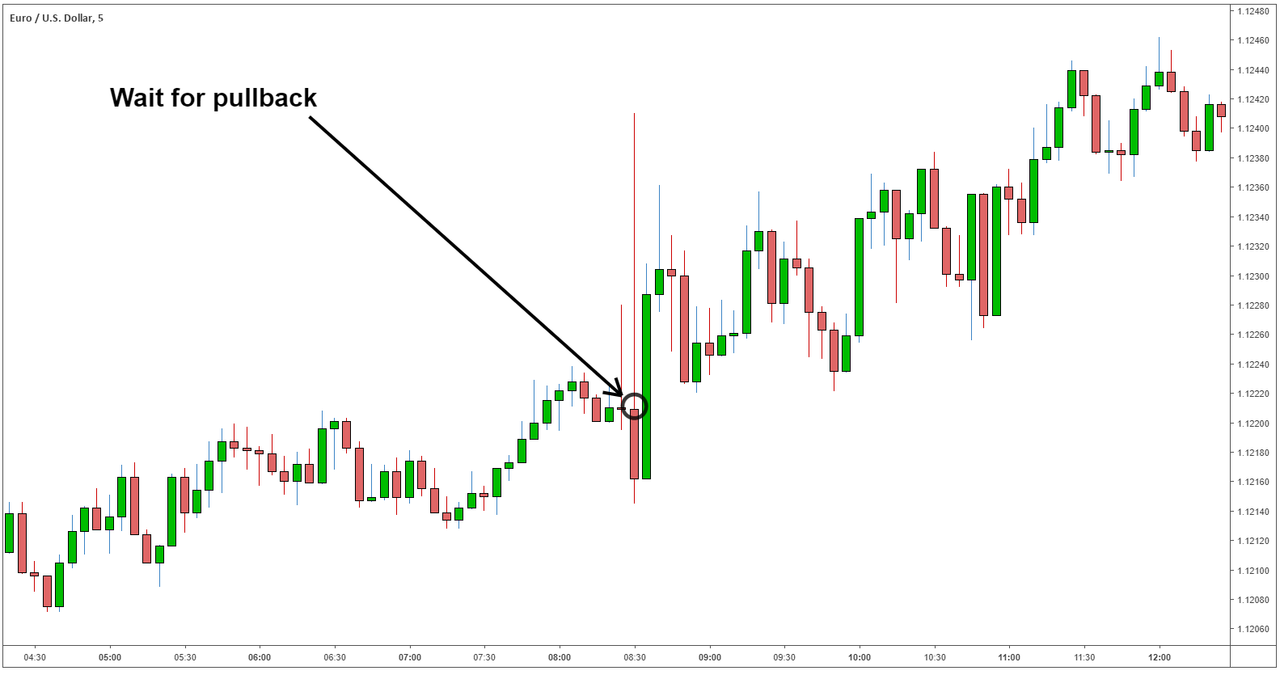
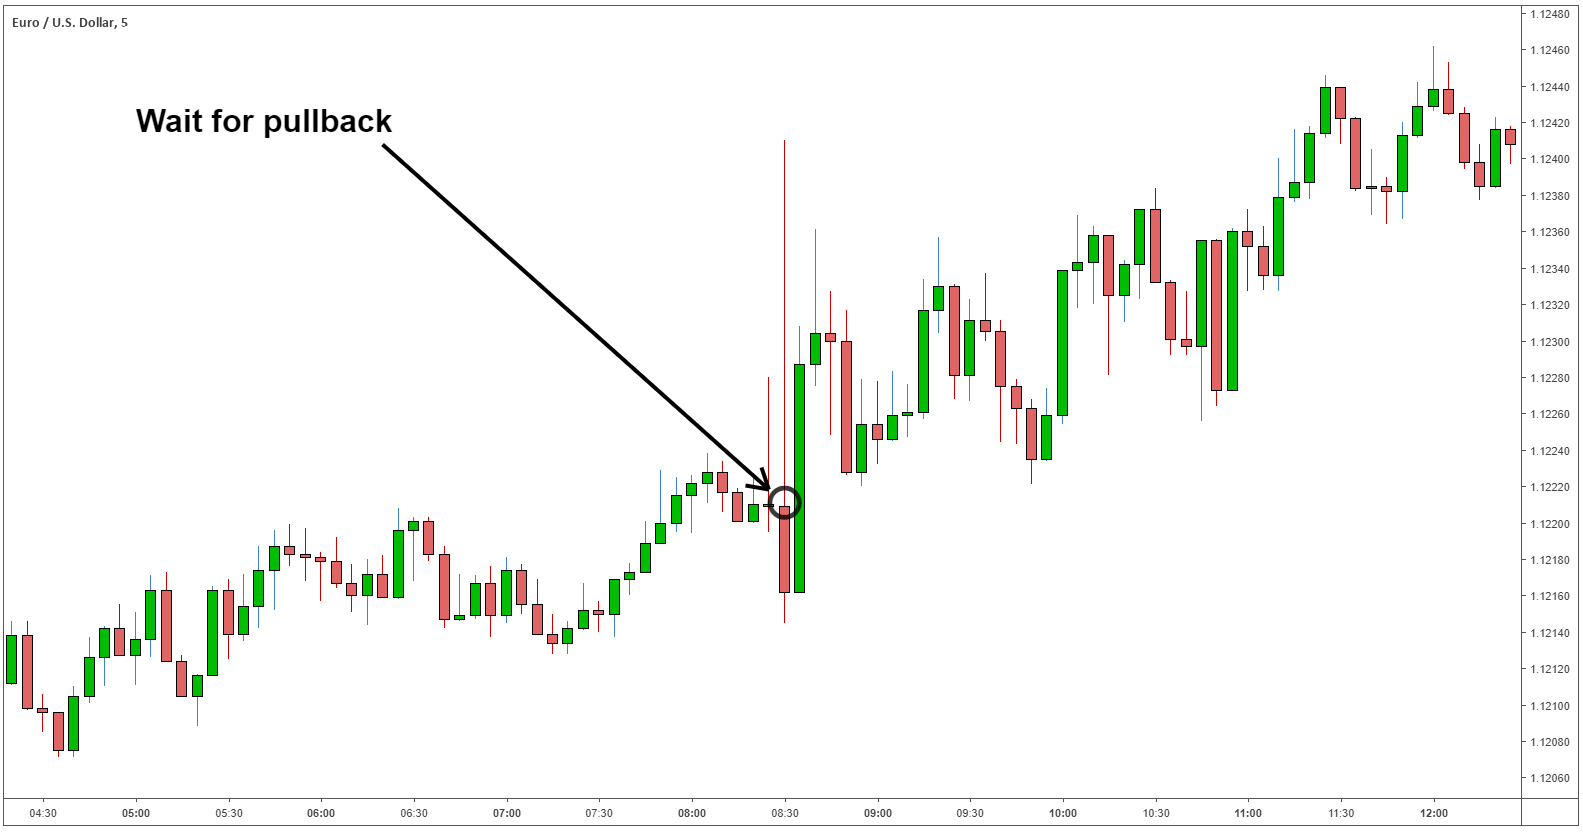
Due to the volatile nature of the NFP release, we recommend using a pull-back strategy rather than a breakout strategy. Using a pullback strategy, traders should wait for the currency pair to retrace before entering a trade.

Using the same example as above (NFP results 20k vs 180k expected) we expect the US Dollar to depreciate. In the example below, we use the EUR/USD. Because the NFP data came out worse than expected, we forecast the EUR/USD to appreciate.

EUR/USD NFP data pullback strategy

Trading Forex News: The Strategy

Trading Forex News: The Strategy
Recommended by David Bradfield
Crude Oil Eyes New Highs Despite Risk Aversion Elsewhere on Fitch Decision

Crude Oil Eyes New Highs Despite Risk Aversion Elsewhere on Fitch Decision

The crude oil price has managed to hold the high ground even though other growth-aligned assets took a hit on Wednesday.

The WTI futures contract is a touch above US$ 82 bbl while the Brent contract has overcome US$ 85.50 bbl.

The American Petroleum Institute (API) inventory report probably helped to underpin black gold after the latest data showed a drop of 15.4 million barrels in the week ended July 28th.

The market awaits today’s US Energy Information Agency (EIA) weekly petroleum status report for further evidence of a squeeze on supply or otherwise..

One of the dominant credit rating agencies, Fitch, downgraded its US sovereign debt credit rating to AA+ from AAA after the North American close. This is the first time that the agency has done so in almost 30 years.

US Treasury Secretary Janet Yellen referred to the decision as ‘arbitrary’ and ‘outdated’

Somewhat strangely, Treasuries rallied in the aftermarket with yields briefly dipping before recovering. The market seems to be heading toward perceived safe havens, even though this asset is at the centre of the storm.

Going against the grain, gold has struggled today, with the spot price sliding under US$ 1,950.

Equity markets have been less fortunate with a sea of red across the APAC region today. Futures prices are pointing toward a soft start to the European and Wall Street opens.

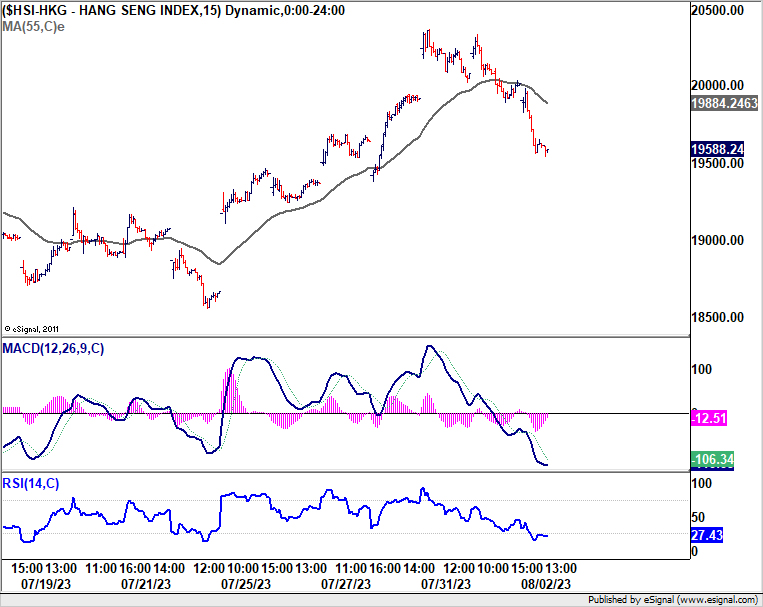
Hong Kong’s Hang Seng (HSI) and Japan’s Nikkei 225 equity indices have led the way lower, sinking over 2%.

Currency markets have reflected the risk-off tone with the growth-linked Aussie and Kiwi Dollars seeing the largest losses today.

Looking ahead, the US will see MBA mortgage applications and ADP employment change data.

WTI CRUDE OIL TECHNICAL ANALYSIS

The WTI futures contract has made a 3-month high today, continuing on from a stellar run-up through July.

The ascending trend has been somewhat orderly as highlighted by the price remaining within the 21-day simple moving average (SMA) based Bollinger Band.

Just above the price, the 82.50 83.50 might be a resistance zone with several previous peak peaks and breakpoints.

On the downside, support could be at the 260-day SMA of 79.62, the breakpoint of 77.33, or the prior low of 83.82 which also coincides with the 100-day SMA.

image1.png


AUD Price Forecast: US Ratings Downgrade Burns Pro-Growth Aussie

AUD Price Forecast: US Ratings Downgrade Burns Pro-Growth Aussie

AUSTRALIAN DOLLAR FUNDAMENTAL BACKDROP

The Australian dollar’s pain has been increasing against the US dollar after ratings agency Fitch downgraded US debt to AA+ from a AAA rating. This follows on from the Standard and Poor’s downgrade previously. Unusually, markets demand for US Treasuries intensified despite the downgrade while the safe haven attribute of the greenback sustained USD upside.

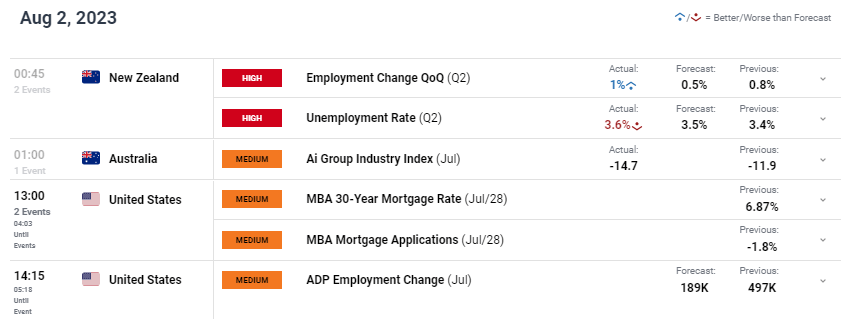
Earlier this morning, New Zealand labor data (see economic calendar below) showed some signs of easing which should keep the Reserve Bank of New Zealand (RBNZ) steady on their cycle. Unemployment pushed higher alongside lower wage growth, potentially lowering core inflation pressures that have been quite sticky. AUD/NZD rallied on this data despite the Reserve Bank of Australia (RBA)’s decision to hold rates yesterday. Money market pricing still shows the possibility of another RBA hike but recent repricing has significantly reduced this probability. Incoming data will determine the future rate trajectory.

Later today, US ADP employment change for July will dominate headlines with estimates significantly lower than the prior print. Should actual numbers come in line with forecasts, there may be a drop off in the USD but the data should not be relied upon as a gauge for Non-Farm Payroll (NFP) data on Friday. The lack of congruency recently will leave markets hesitant ahead of Friday’s release but yesterday miss on US ISM Manufacturing Employment could hint at a lower NFP read.

AUD/USD ECONOMIC CALENDAR (GMT +02:00)

image1.png

TECHNICAL ANALYSIS

AUD/USD DAILY CHART

image2.png

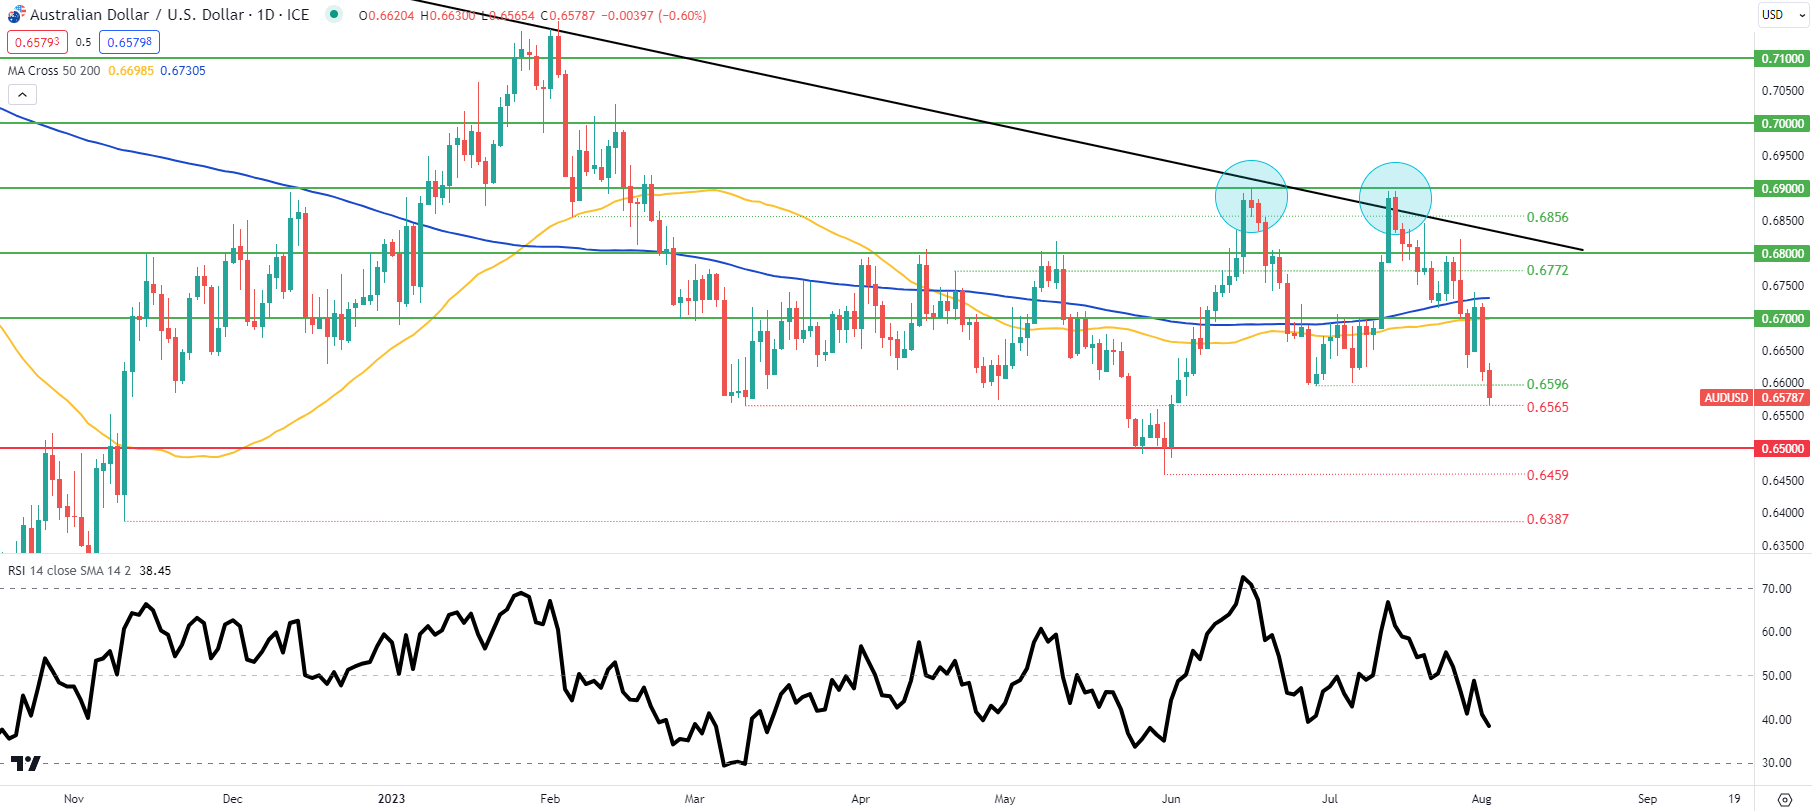
Daily AUD/USD price action has now broken below the double top (blue) neckline around the 0.6596 swing low/0.6600 psychological region. This could open up the 0.6500 support handle once more, pushing the Relative Strength Index (RSI) closer to oversold territory.

supports my prior analysis of a 0.6700 retest which has since played out dipping below both the 50-day (yellow) and 200-day (blue) moving averages respectively. Bears now look to set their sights on the coinciding with the.

Key resistance levels:

  • 0.6772
  • 200-day MA
  • 0.6700/50-day MA
  • 0.6596

Key support levels:

  • 0.6565
  • 0.6500

IG CLIENT SENTIMENT DATA: BEARISH (AUD/USD)

IGCS shows retail traders are currently net LONG on AUD/USD, with 76% of traders currently holding long positions. At DailyFX we typically take a contrarian view to crowd sentiment resulting in a short-term downside disposition.

AUD/NZD DAILY CHART

image3.png

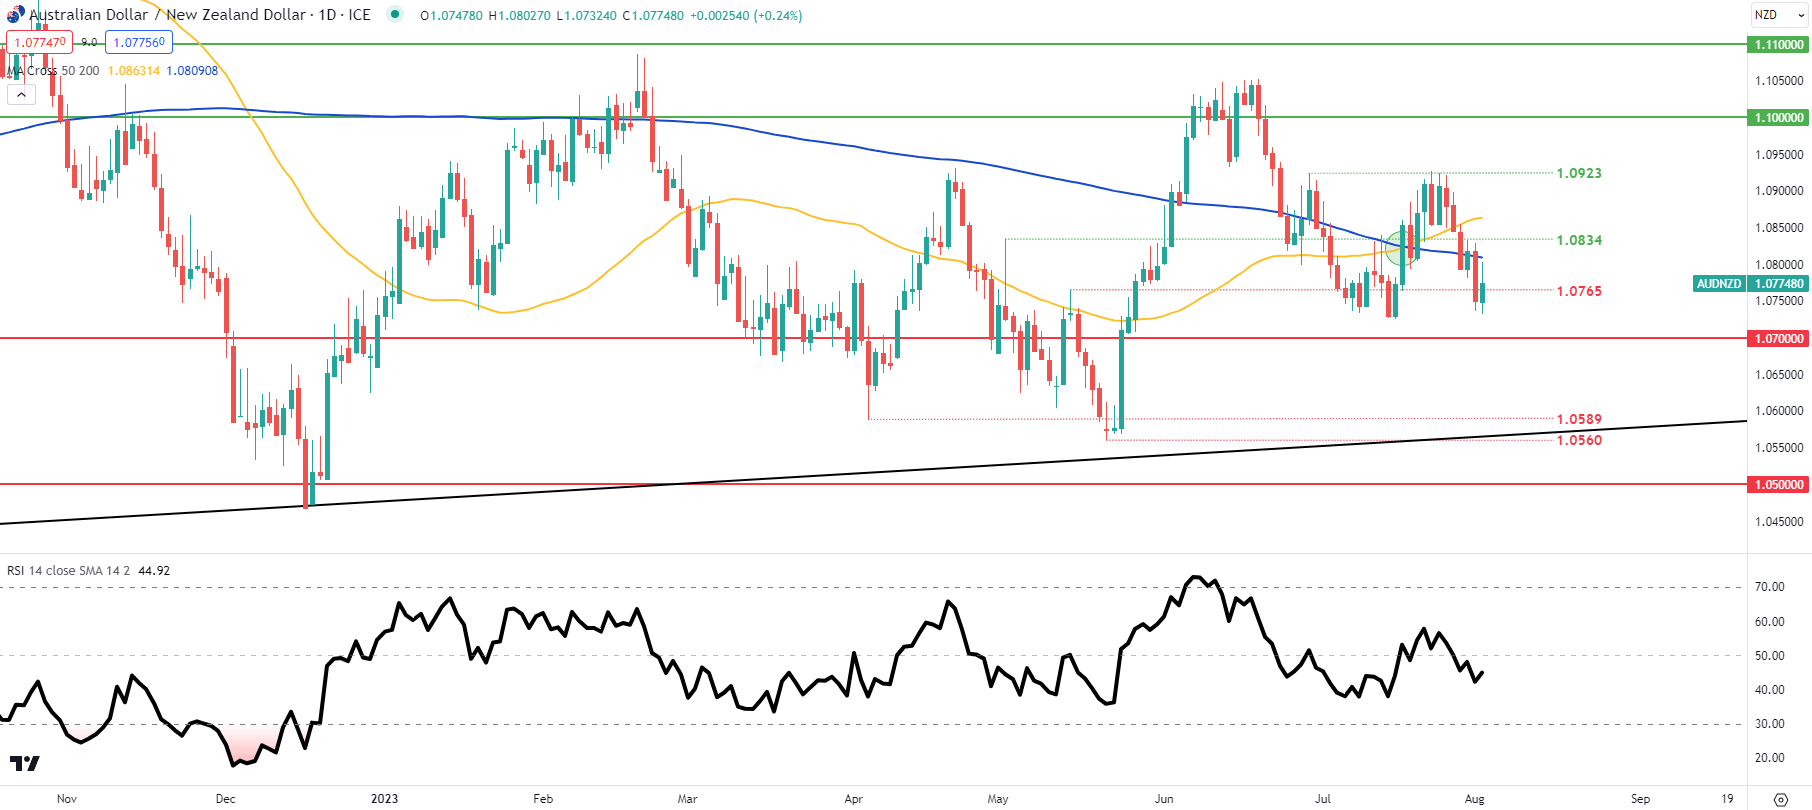
AUD/NZD has pushed higher on the back of the recent New Zealand jobs figures but the trading bias remains towards the downside with the RSI below the midpoint level as well as prices trading below the 50-day (yellow) and 200-day (blue) moving averages respectively.

Key resistance levels:

  • 1.0923
  • 200-day MA
  • 1.0834
  • 50-day MA

Key support levels:

  • 1.0765
  • 1.0700
British Pound Might be in Trouble as Retail Traders Turn Net-Long GBP/USD

British Pound Might be in Trouble as Retail Traders Turn Net-Long GBP/USD

The British Pound has been under pressure from the US Dollar since the middle of July, with Sterling now around its lowest in a month. In response retail traders have been increasing GBP/USD net-long exposure. This can be seen by looking at IG Client Sentiment (IGCS). IGCS tends to function as a contrarian indicator. With that in mind, could further losses be ins tore for the British Pound?

GBP/USD Sentiment Outlook – Bearish

The IGCS gauge shows that about 54% of retail traders are net-long. In fact, this is the most since early June. Since the majority are now biased higher, this suggests that prices may fall down the road. This is as upside exposure increased by 9.82% and 2.05% compared to yesterday and last week, respectively. With that in mind, the combination of current sentiment and recent changes produces a stronger bearish contrarian trading bias.

GBP/USD Sentiment Outlook – Bearish

British Pound Daily Chart

On the daily chart, GBP/USD is testing a breakout under a key long-term rising trendline from the end of September. Further downside from here could mark a major turning point for Sterling. Immediately below is the June 29th low of 1.2592, which is key support. Meanwhile, the 100-day Moving Average (MA) is also hovering around that price.

As such, this combination could prove to be tricky to break through. But, if that is the case, the technical bias may shift to a stronger bearish standpoint. Otherwise, a turn higher from here places the focus on immediate resistance at 1.2848. This is an inflection point from early June. Extending gains beyond that then places the focus on the July high of 1.3141.

British Pound Daily Chart

Fitch cuts US sovereign rating on steady deterioration in standards of governance

Fitch cuts US sovereign rating on steady deterioration in standards of governance

Asian stock markets took a significant plunge following Fitch Ratings’ surprise decision to downgrade US sovereign rating from AAA to AA+. This move mirrors S&P Global Ratings’ decision made over a decade ago, causing considerable unrest among investors.

Fitch’s statement highlighted, “In Fitch’s view, there has been a steady deterioration in standards of governance over the last 20 years, including on fiscal and debt matters, notwithstanding the June bipartisan agreement to suspend the debt limit until January 2025.”

US Treasury Secretary Janet Yellen fiercely contested the downgrade, calling it “arbitrary and based on outdated data.” The White House has also voiced opposition to Fitch’s assessment, with press secretary Karine Jean-Pierre declaring, “It defies reality to downgrade the United States at a moment when President Biden has delivered the strongest recovery of any major economy in the world.”

Both Nikkei and HSI are down more than -2% at the time of writing.

Silver Price Forecast: XAG Supported by US Credit Downgrade, Rate Hike Headwinds Limit Gains

Silver Price Forecast: XAG Supported by US Credit Downgrade, Rate Hike Headwinds Limit Gains

Silver (XAG) prices are edging higher in response to Fitch’s unexpected decision to downgrade the United States’ triple-A credit rating to AA+. This move has raised concerns over the country’s fiscal deterioration and rising government debt burden over the next three years. As confidence in the economy waned, investors turned to the safety of silver and gold, driving demand higher.

Fitch Downgrade: Governance Erosion, Rising Deficits

Fitch’s downgrade reflects an erosion of governance standards over the last two decades, manifested in repeated debt limit standoffs and last-minute resolutions. The lack of a medium-term fiscal framework and complex budgeting process have contributed to successive debt increases. Additionally, rising deficits are expected, with the general government deficit projected to reach 6.6% of GDP in 2024 and further widen to 6.9% in 2025.

Trading Derivatives carries a high level of risk to your capital and you should only trade with money you can afford to lose. Trading Derivatives may not be suitable for all investors, so please ensure that you fully understand the risks involved, and seek independent advice if necessary. A Product Disclosure Statement (PDS) can be obtained either from this website or on request from our offices and should be considered before entering into a transaction with us. Raw Spread accounts offer spreads from 0.0 pips with a commission charge of USD $3.50 per 100k traded. Standard account offer spreads from 1 pips with no additional commission charges. Spreads on CFD indices start at 0.4 points. The information on this site is not directed at residents in any country or jurisdiction where such distribution or use would be contrary to local law or regulation.

The rising general government debt is a cause for concern, with the debt-to-GDP ratio projected to reach 118.4% by 2025. The U.S. fiscal position becomes more vulnerable to future economic shocks due to these projections.

Despite several structural strengths supporting the U.S. economy, Fitch predicts a mild recession in the fourth quarter of 2023 and the first quarter of 2024, with annual real GDP growth slowing to 1.2% this year. The Federal Reserve’s tightening measures and the goal to bring inflation towards its 2% target are complicating the situation.

Silver Resilient Amid Uncertainty

As markets stay watchful, silver remains a preferred safe-haven investment in times of economic uncertainty and stress, though the recent strengthening of the U.S. dollar caused a temporary setback.

All eyes are now on the upcoming non-farm payrolls report, which will be a crucial indicator of the U.S. economy’s health. Expectations are set for job numbers to rise in July, following a solid increase in June.

Higher interest rates pose a challenge for silver investors, as it increases the cost of holding the precious metal with no yield and additional expenses for storage and insurance.

Short-Term Forecast:  Weak on Rate Hike Concerns with Fitch Downgrade a Wildcard

In conclusion, the downgrade of the United States’ credit rating has drawn significant attention, prompting investors to seek safety in precious metals like silver. The evolving economic situation and impending non-farm payrolls report will play a crucial role in shaping market sentiment in the near term. However, uncertainties remain as the U.S. navigates through fiscal challenges and adjusts to the impact of the rating downgrade.

Technical Analysis

4-Hour XAGUSDSilver (XAG) is displaying mixed sentiment as its 4-hour price of 24.30 remains above the 200-4H moving average at 23.74, indicating potential bullish tendencies. However, it is still below the 50-4H moving average at 24.53, signaling some bearish pressure. The 14-4H RSI at 43.94 reflects weaker momentum below the neutral level of 50.

The commodity currently holds above the main support area of 24.04 to 24.20, offering short-term stability. The main resistance area is at 25.00 to 25.27. Traders should monitor price action near these levels for possible trend changes.

The market for Silver (XAG) is presently showing mixed signals, but this can quickly shift to bearish if the support area fails to hold.

XRP Set for a Bearish Session on Terraform Labs Case News

XRP Set for a Bearish Session on Terraform Labs Case News

On Tuesday, XRP gained 1.20%. Reversing a 0.91% loss from Monday, XRP ended the day at $0.7067. XRP ended a five-day losing streak.

Weekly Chart sends bullish price signals.

XRP Price Action

daily Chart

The Daily Chart showed XRP/USD remained below the $0.7870 – $0.7737 resistance band, despite ending the five-day losing streak. However, XRP sat well above the 50-day ($0.6229) and 200-day ($0.5102) EMAs, sending bullish near and longer-term price signals.

Trading Derivatives carries a high level of risk to your capital and you should only trade with money you can afford to lose. Trading Derivatives may not be suitable for all investors, so please ensure that you fully understand the risks involved, and seek independent advice if necessary. A Product Disclosure Statement (PDS) can be obtained either from this website or on request from our offices and should be considered before entering into a transaction with us. Raw Spread accounts offer spreads from 0.0 pips with a commission charge of USD $3.50 per 100k traded. Standard account offer spreads from 1 pips with no additional commission charges. Spreads on CFD indices start at 0.4 points. The information on this site is not directed at residents in any country or jurisdiction where such distribution or use would be contrary to local law or regulation.

Notably, the 50-day EMA pulled further away from the 200-day EMA, affirming a bullish near-term trend. While the EMAs send bullish signals, the five-day losing streak left XRP within reach of the $0.6530 – $0.6417 support band.

Looking at the 14-Daily RSI, the 56.19 reading sends bullish XRP price signals, aligning with the EMAs. The RSI supports a run at $0.75 to bring the $0.7870 – $0.7737 resistance band into play.

XRP Daily Chart sends bullish price signals.
4-Hourly ChartLooking at the 4-Hourly Chart, the XRP/USD faces strong resistance at the 50-day EMA ($0.7089). Despite the bullish Tuesday session, XRP/USD remains below the $0.7870 – $0.7737 resistance band.

XRP also sits below the 50-day EMA ($0.7089) while holding above the 200-day EMA ($0.6520), sending bearish near-term but bullish longer-term price signals. The 50-day EMA narrowed on the 200-day EMA, signaling a fall toward $0.65.

The 14-4H RSI reading of 49.14 signals moderately bearish sentiment, with selling pressure outweighing buying pressure. Significantly, the RSI aligns with the 50-day EMA, signaling the near-term bullish trend reversal and a run at the $0.6530 – $0.6417 support band and the 200-day EMA ($0.6520).

XRP 4-Hourly Chart sends bearish near-term price signals.
XRPUSD 020823 4 Hourly Chart

MicroStrategy Delivers Support Despite Terraform Labs News

It was another busy session on Tuesday, with earnings and SEC v Ripple-related news moving the dial.

This week, MicroStrategy (MSTR) filed a request to sell up to $750 million in stock to acquire BTC. According to the quarterly report for the quarter ending June 30, 2023, MicroStrategy held 152,333 BTC. The anticipated increase in BTC holdings supported the BTC return to $30,000.

However, news of Tron (TRX) founder Justin Sun acquiring CRV also provided market support.

Despite the bullish moves, XRP trailed the broader market as investors digested Terra Labs Court case-related news.

Terraform Labs presiding Judge Jed Rakoff, caused a stir by saying that Judge Torres made a mistake in the SEC v Ripple Court ruling when declaring that XRP was not a security when sold on exchanges. Rakoff believed that there is no difference between stocks or institutional sales in terms of being a security.

Gold Price Forecast: XAU Safe-Haven Buying Tied to Fitch’s US Credit Downgrade

Gold Price Forecast: XAU Safe-Haven Buying Tied to Fitch’s US Credit Downgrade

Fitch Downgrade Spurs Gold Surge

The catalyst behind this surge was Fitch’s unexpected decision to downgrade the United States’ highly coveted triple-A credit rating to AA+. The move by Fitch cited concerns over the country’s fiscal deterioration and rising government debt burden in the next three years. As confidence in the economy waned, investors flocked to the safety of gold, driving its demand higher.

Trading Derivatives carries a high level of risk to your capital and you should only trade with money you can afford to lose. Trading Derivatives may not be suitable for all investors, so please ensure that you fully understand the risks involved, and seek independent advice if necessary. A Product Disclosure Statement (PDS) can be obtained either from this website or on request from our offices and should be considered before entering into a transaction with us. Raw Spread accounts offer spreads from 0.0 pips with a commission charge of USD $3.50 per 100k traded. Standard account offer spreads from 1 pips with no additional commission charges. Spreads on CFD indices start at 0.4 points. The information on this site is not directed at residents in any country or jurisdiction where such distribution or use would be contrary to local law or regulation.

In the past, a credit rating downgrade had sent markets into a frenzy. However, this time, the initial reaction seemed calmer. Nonetheless, experts are keeping a close eye on the unfolding situation, recognizing the potential impact on the markets going forward.

Gold, denominated in U.S. dollars, has long been favored as a safe-haven investment during times of economic uncertainty and stress.

Traders Eyeing Non-Farm Payrolls Data

As the greenback strengthened following solid data on U.S. manufacturing and construction in June, gold experienced a 1% drop and hit a three-week low. Despite this temporary setback, all eyes are now fixated on the non-farm payrolls report set to release on Friday, which will be a crucial indicator of the U.S. economy’s health. Expectations are that job numbers will rise by 200,000 in July, following a solid increase of 209,000 in June.

Global Central Bankers Aim to Manage Inflation

U.S. central bankers, while expressing hope in managing inflation without harming job opportunities, have acknowledged that higher interest rates will be necessary for some time. The rise in interest rates poses a challenge for gold investors, as it increases the cost of holding the precious metal, which bears no yield and requires money for storage and insurance.

WGC Predicts Drop in India’s Gold Demand

In addition to the U.S. economic situation, the World Gold Council (WGC) brings focus to India’s gold market. The WGC predicts that India’s gold demand for 2023 may experience a 10% decline from the previous year, reaching the lowest levels in three years. The country’s retail purchases are being dampened by record-high gold prices. The reduced gold imports may have broader implications, as it could narrow India’s trade deficit and provide support for the Indian rupee.

Short-Term Outlook:  Bearish, but Fitch Downgrade is New Bullish Wildcard

As investors navigate uncertain economic waters, the gold market remains a key focal point. With global events and economic indicators at play, traders must stay vigilant for potential bullish or bearish outcomes in the precious metal market.

Technical Analysis

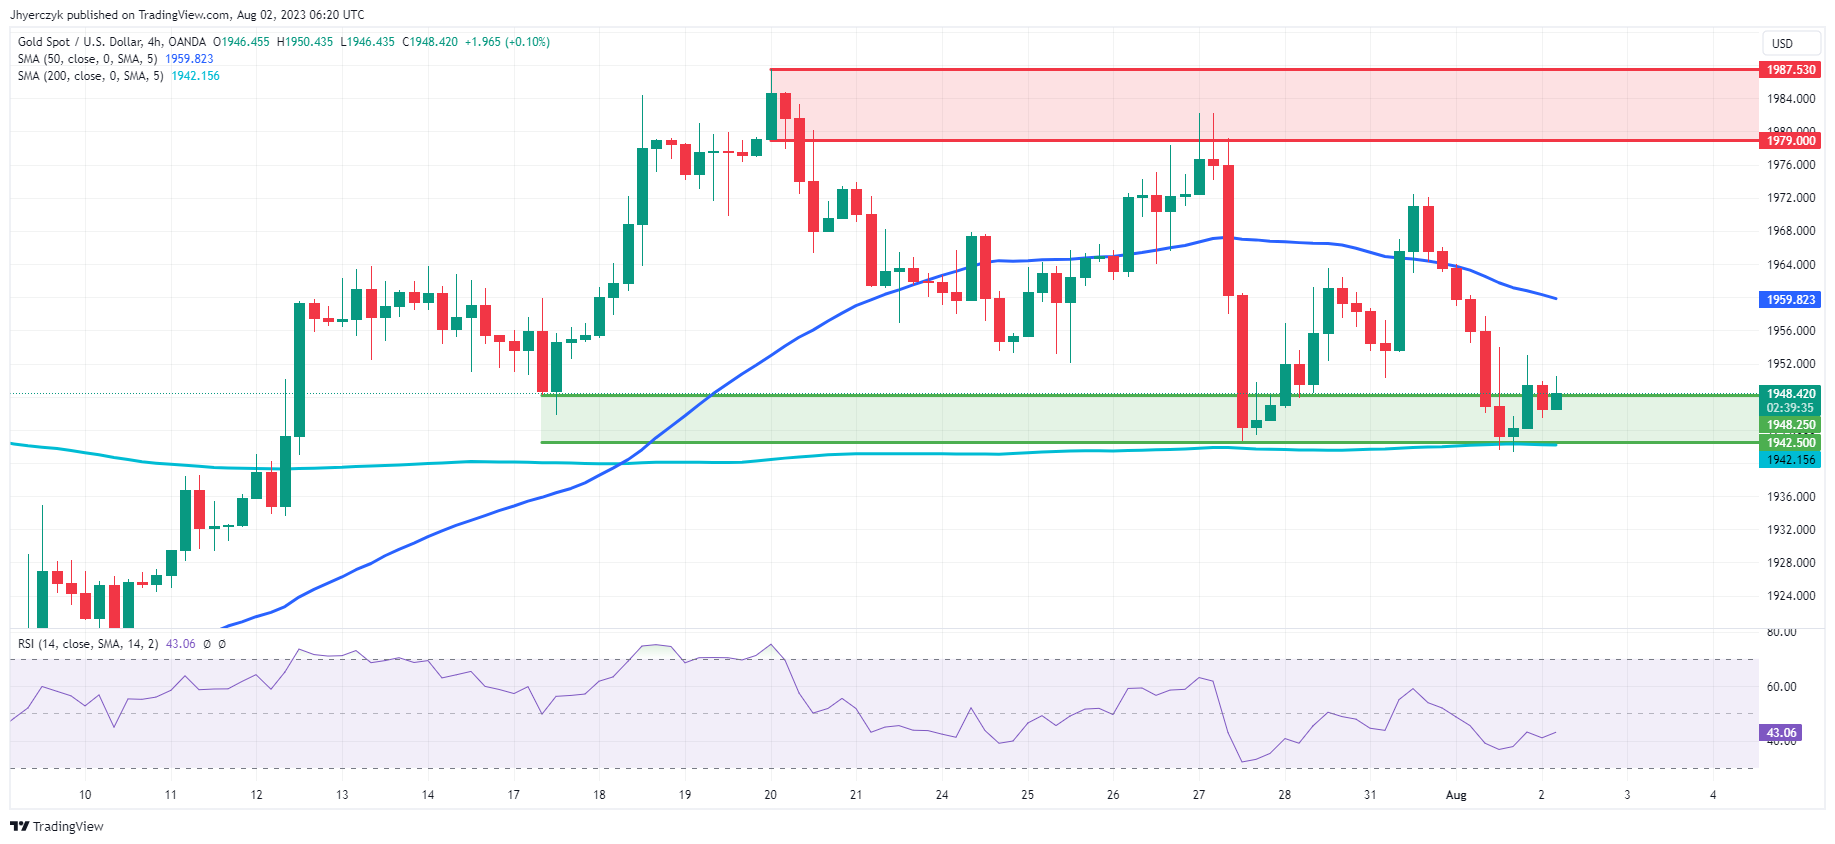
4-Hour Gold (XAU)Gold (XAU) is showing a mixed market sentiment on the 4-hour chart. The current price stands at 1948.60, higher than the previous close of 1946.55, suggesting a short-term bullish sentiment.

However, the price is below the 50-4H moving average (1959.82), indicating some bearish pressure. The 200-4H moving average (1942.15) serves as strong support. The 14-4H RSI reading of 43.06 suggests weaker momentum.

The main support area lies between 1942.50 and 1948.25, while the main resistance area extends from 1979.00 to 1987.53. Traders should closely monitor these levels for potential trading opportunities.

Asian Markets Skittish Following Fitch’s US Rating Downgrade; Commodity Currencies Bear the Brunt

Asian Markets Skittish Following Fitch’s US Rating Downgrade; Commodity Currencies Bear the Brunt

Market sentiment in Asia today leans heavily toward risk aversion, following the unexpected move by Fitch Ratings to downgrade US sovereign rating. Consequently, commodity currencies are grappling with strong sell-offs. New Zealand Dollar is leading the downward spiral, despite strong wage growth reflected Q2’s employment data. Australian Dollar, still reeling from the aftereffects of yesterday’s RBA decision, is also on a downward trajectory, breaking through key short-term support levels against both Dollar and Euro. Canadian Dollar is faring slightly better, although it’s also notably weak.

Amid this atmosphere of risk aversion, Yen is attempting a recovery, albeit with limited momentum so far. Dollar remains robust but is battling to break free from its current range against Euro. Market attention now turns to today’s ADP employment report, with traders likely holding off on significant bets until Friday’s non-farm payroll figures. Meanwhile, Euro leads the pack among European majors, but they’re actually just range bound against each other.

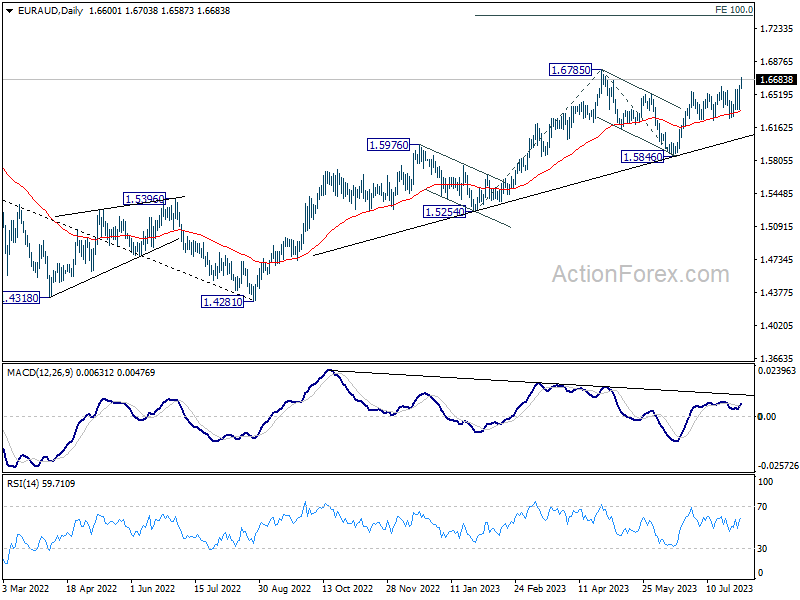
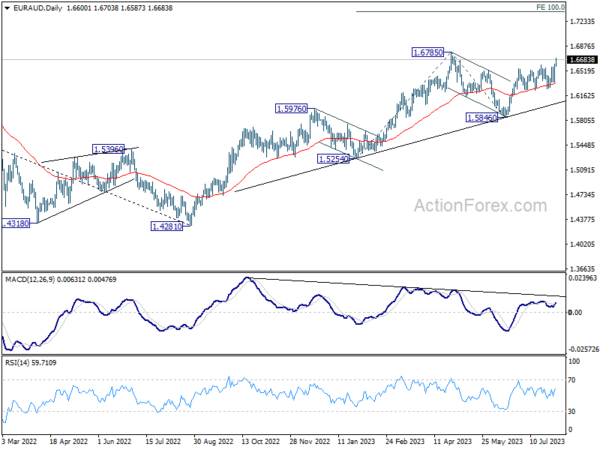
Technically, EUR/AUD finally looks ready to resume medium term up trend with today’s strong rally. Immediate focus for the next few days is 1.6785 high. Decisive break there will set the stage for 100% projection of 1.5254 to 1.6785 from 1.5846 at 1.7377. Judging from current sluggishness in EUR/USD, extended rally in EUR/AUD would more likely be accompanied by deeper fall in AUD/USD, probably through 0.6457 support if EUR/AUD breaks 0.6785 decisively.
At the time of writing, Nikkei is down -2.31%. Hong Kong HSI is down -2.17%. China Shanghai is down -0.99%. Singapore Strait Times is down -1.32%. Japan 10-year JGB yield is up 0.034 at 0.628. Overnight, DOW rose 0.20%. S&P 500 dropped -0.27%. NASDAQ dropped -0.43%. 10-year yield rose 0.092 to 4.051.

Fitch cuts US sovereign rating on steady deterioration in standards of governance

Asian stock markets took a significant plunge following Fitch Ratings’ surprise decision to downgrade US sovereign rating from AAA to AA+. This move mirrors S&P Global Ratings’ decision made over a decade ago, causing considerable unrest among investors.

Fitch’s statement highlighted, “In Fitch’s view, there has been a steady deterioration in standards of governance over the last 20 years, including on fiscal and debt matters, notwithstanding the June bipartisan agreement to suspend the debt limit until January 2025.”

US Treasury Secretary Janet Yellen fiercely contested the downgrade, calling it “arbitrary and based on outdated data.” The White House has also voiced opposition to Fitch’s assessment, with press secretary Karine Jean-Pierre declaring, “It defies reality to downgrade the United States at a moment when President Biden has delivered the strongest recovery of any major economy in the world.”

Fed Goolsbee: Every meeting is live around transition point

Chicago Fed President Austan Goolsbee has refrained from pre-committing to Fed’s actions in September, insisting that every meeting is crucial when navigating the transition point. “When you’re around the transition point, every meeting is a live meeting and you’re trying to figure out trends, not just reflect one month’s data,” Goolsbee said yesterday.

Goolsbee is “guardedly optimistic” about Fed’s ability to stick to what he terms the “golden path,” bringing down prices without inducing a recession. He emphasized the importance of watching how core goods and housing inflation evolve in the coming months to remain on this path.

“Those are the two components that over the next three to six months, let’s call it, if we are to succeed to stay on the golden path, we’ve got to see progress on those two parts of inflation,” he said. He added that progress on services inflation isn’t currently necessary.

He also shared his perspective on the link between wages and inflation, suggesting that wages are more of a lagging indicator rather than a predictor of inflation. According to Goolsbee, if Fed officials focus too much on wages when shaping their policy, they could risk overshooting interest rates.

Fed Bostic warns of overtightening risks, advocates for cautious approach

Yesterday, Atlanta Fed President Raphael Bostic expressed guarded optimism and highlighted the “significant progress” in controlling inflation. He observed, “Inflation is well off its highs that we saw in the last year. And recent numbers have come in promising in ways that suggest that we might be seeing continued declines.”

Bostic pointed to the ongoing economic evolution as in line with an “orderly slowdown,” which he views as “quite promising”. As such, he advocated to be cautious, patient and resolute” in policy-making.

He also voiced concerns about the risk of overtightening monetary policy. “I think we are in a phase now where there is some risk of us overtightening. And so we’ve just got to have that in mind,” he said. By exercising appropriate caution, Bostic believes that the damage to employment can be minimized.

Looking forward, Bostic said, “My baseline outlook doesn’t contemplate any cuts until the second half of next year at the earliest.” He insists on being “resolute to make sure that we don’t move our policy posture in a different direction until we’re absolutely, absolutely certain that inflation is going to get to our target.”

BoJ Uchida: Monetary easing to continue to nurture firms’ changing pricing strategies

BoJ Deputy Governor Shinichi Uchida highlighted in a speech today an emerging trend in firms’ pricing strategies, noting that “firms are developing more forward-looking strategies for setting prices.” According to Uchida, these changes “might be the chance to finally change Japan’s economy.” Hence, he emphasized BoJ will “patiently continue with monetary easing to carefully nurture these signs.”

Uchida was explicit in outlining the Bank’s monetary policy stances. Firstly, he ruled out near-term adjustments to short-term interest rate, currently at -0.10%, stating “there is still a long way to go before such decisions are made.”

Secondly, BoJ will “maintain the current framework” until sustainable and stable achievement of 2% inflation target “come in sight”.

Thirdly, Uchida affirmed the ongoing yield curve control under the present policy framework, aiming to balance its benefits and drawbacks, especially in relation to financial intermediation and the market.

Despite the high economic and price outlook uncertainty, Uchida stated the recent yield curve control modification, allowing the 10-year JGB yield to rise to up to 1%, is aimed at sustaining the ultra-loose policy. “Needless to say, we do not have an exit from monetary easing in mind,” he emphasized.

New Zealand employment up 1% in Q2, wage inflation unchanged at 4.3% yoy

New Zealand reported a better-than-expected employment growth of 1.0% in the second quarter of 2023, surpassing market expectations of a 0.6% rise. On the other hand, unemployment rate slightly increased from 3.4% to 3.6%, marginally above the anticipated 3.5%.

The data released showed that employment rate rose from 69.6% to 69.8%, and the participation rate increased from 72.0% to 72.4%. These are the highest rates recorded since the series began in 1986.

In terms of wage growth, all sector wage inflation climbed by 1.1% on a quarterly basis, resulting in an annual increase of 4.3%. “Annual wage costs continued to increase at historically high rates this quarter, equal to the 4.3 percent annual increase last quarter,” said Bryan Downes, business prices delivery manager.

Downes noted that the most significant contribution to the Labour Cost Index for the June 2023 quarter came from retail trade and accommodation industry. This sector witnessed 1.5% increase in wages on a quarterly basis, following 0.7% rise in the previous quarter. The wage growth in this industry was primarily driven by rise in minimum wage, thereby pushing up overall wage growth during the quarter.

Looking ahead

Swiss SECO consumer climate and PMI manufacturing are the main features in European session. US will release ADP private employment later in the day.

AUD/USD Daily Report

Daily Pivots: (S1) 0.6569; (P) 0.6647; (R1) 0.6692; More…

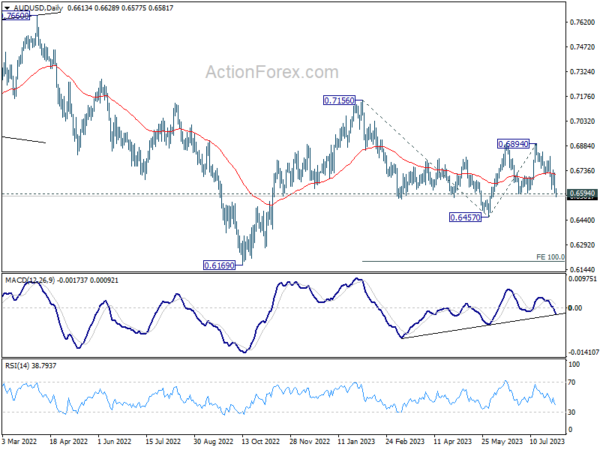
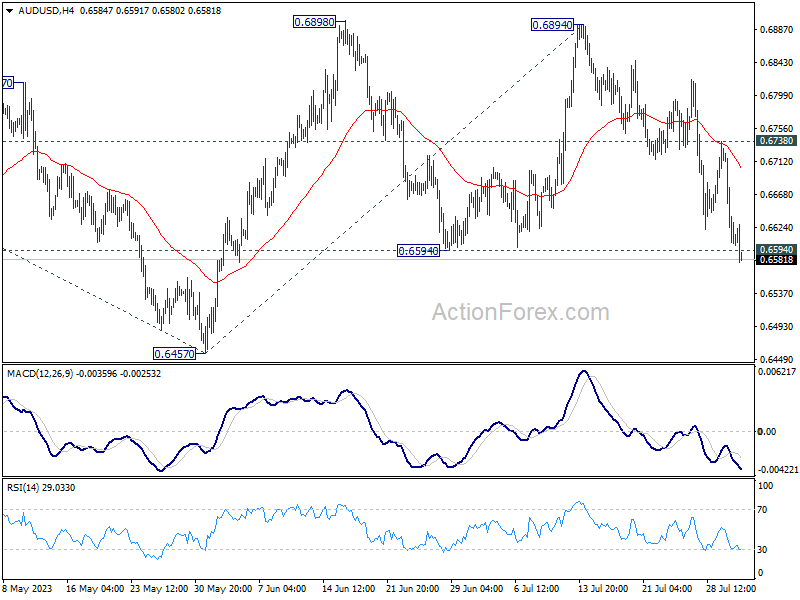
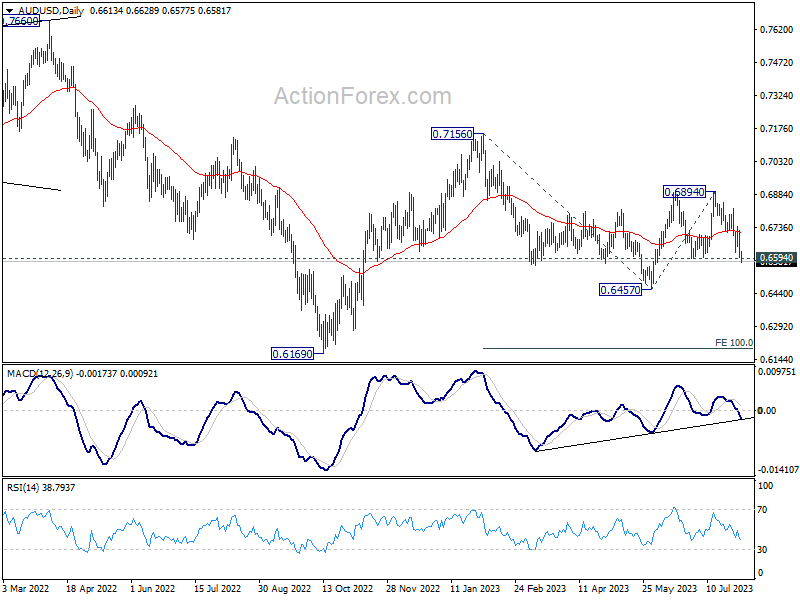
AUD/USD’s break of 0.6594 support argues that rebound from 0.6457 has completed at 0.6894 already. Intraday bias is back on the downside for 0.6457. Break there will resume the fall from 0.7156 to 100% projection of 0.7156 to 0.6457 from 0.6894 at 0.6195. For now, risk will stay mildly on the downside as long as 0.6738 resistance holds, in case of recovery.
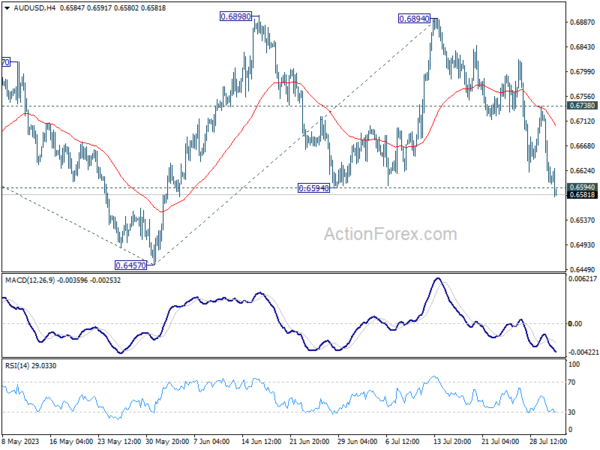
In the bigger picture, outlook is mixed for now as AUD/USD failed to sustain above both 55 D EMA (now at 0.6713) and 55 W EMA (now at 0.6784). On the upside, break of 0.65898 resistance will solidify the case that down trend from 0.8006 (2021 high) has already completed, and target 0.7156 resistance for confirmation. However, break of 0.6457 will likely resume the down trend through 0.6169 (2022 low).