US Indices Rally Beginning to Crack? S&P 500, Nasdaq Price Setups

US Indices Rally Beginning to Crack? S&P 500, Nasdaq Price Setups

Relatively bigger down days than up days since late July on the daily charts of the Nasdaq 100 index and the S&P 500 index’s fall below support for the first time since April suggests the rally in US indices could finally be due for a breather.

Fitch’s downgrade of US credit rating and higher-for-longer rates following strong US private payroll data appear to be the catalysts for the setback in risk appetite. However, conditions have been getting ripe for at least some consolidation, as highlighted in recent updates. See “S&P 500, Nasdaq 100 Forecast: Overly Optimistic Sentiment Poses a Minor Setback Risk,” published July 23, and “US Equity Indices Post FOMC: Nasdaq, S&P 500, Dow Price Setups,” published July 27.

Despite upbeat US quarterly earnings so far and resilient economic growth, US indices have struggled recently. Extreme optimism, overbought conditions, overcrowded positioning, and poor Q3 seasonality appear to be gradually casting a shadow over the rally.Having said that, it wouldn’t necessarily imply a reversal of the broader uptrend – the rally could well continue. However, from a risk:reward perspective, the bar for sustained gains seems to be rising.

Nasdaq 100 Daily Chart
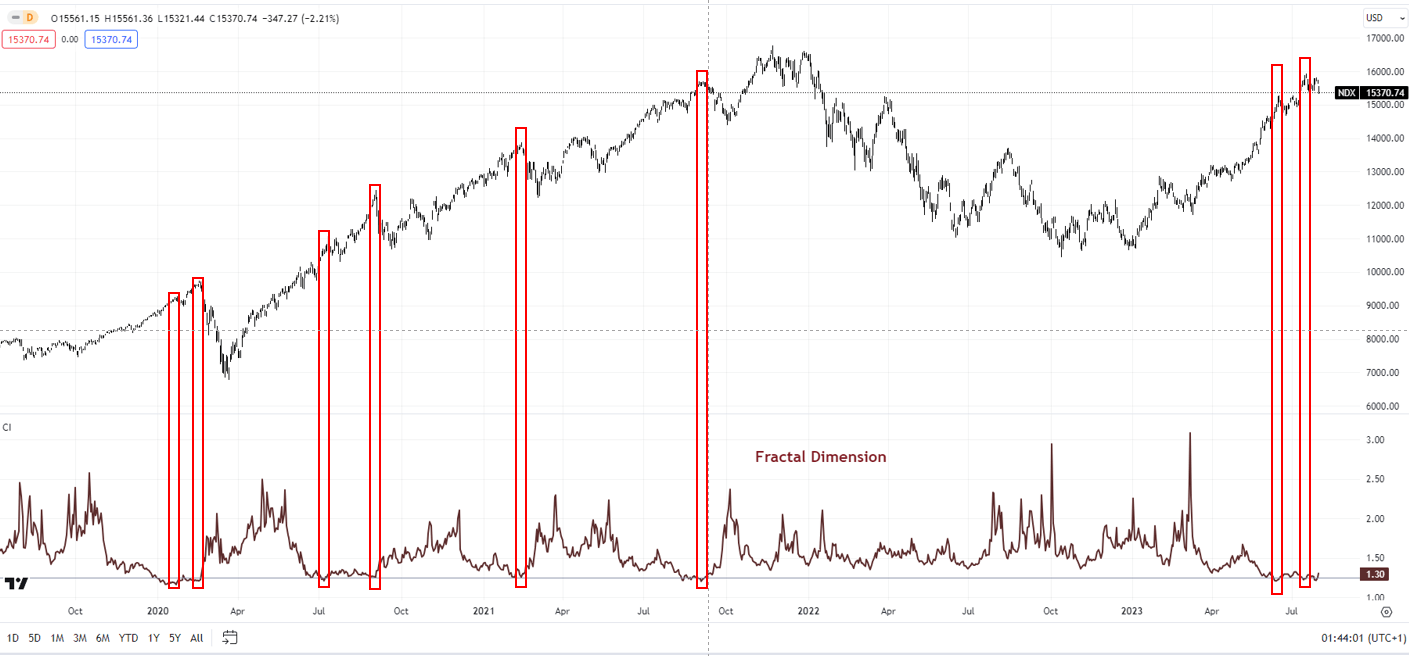
image1.png

Market diversity as measured by fractal dimensions appears to be low – first highlighted in “Dow, S&P 500, Nasdaq Technical Outlook: No Sign of a Reversal,” published July 9. Fractal dimensions measure the distribution of diversity. When the measure hits the lower bound, typically 1.25-1.30 depending on the market, it indicates extremely low diversity as market participants bet in the same direction, raising the odds of at least a pause/reversal. For the Nasdaq 100 index, the 65-day fractal dimension fell below the threshold of 1.25, flashing a red flag.

Nasdaq 100 240-Minute Chart
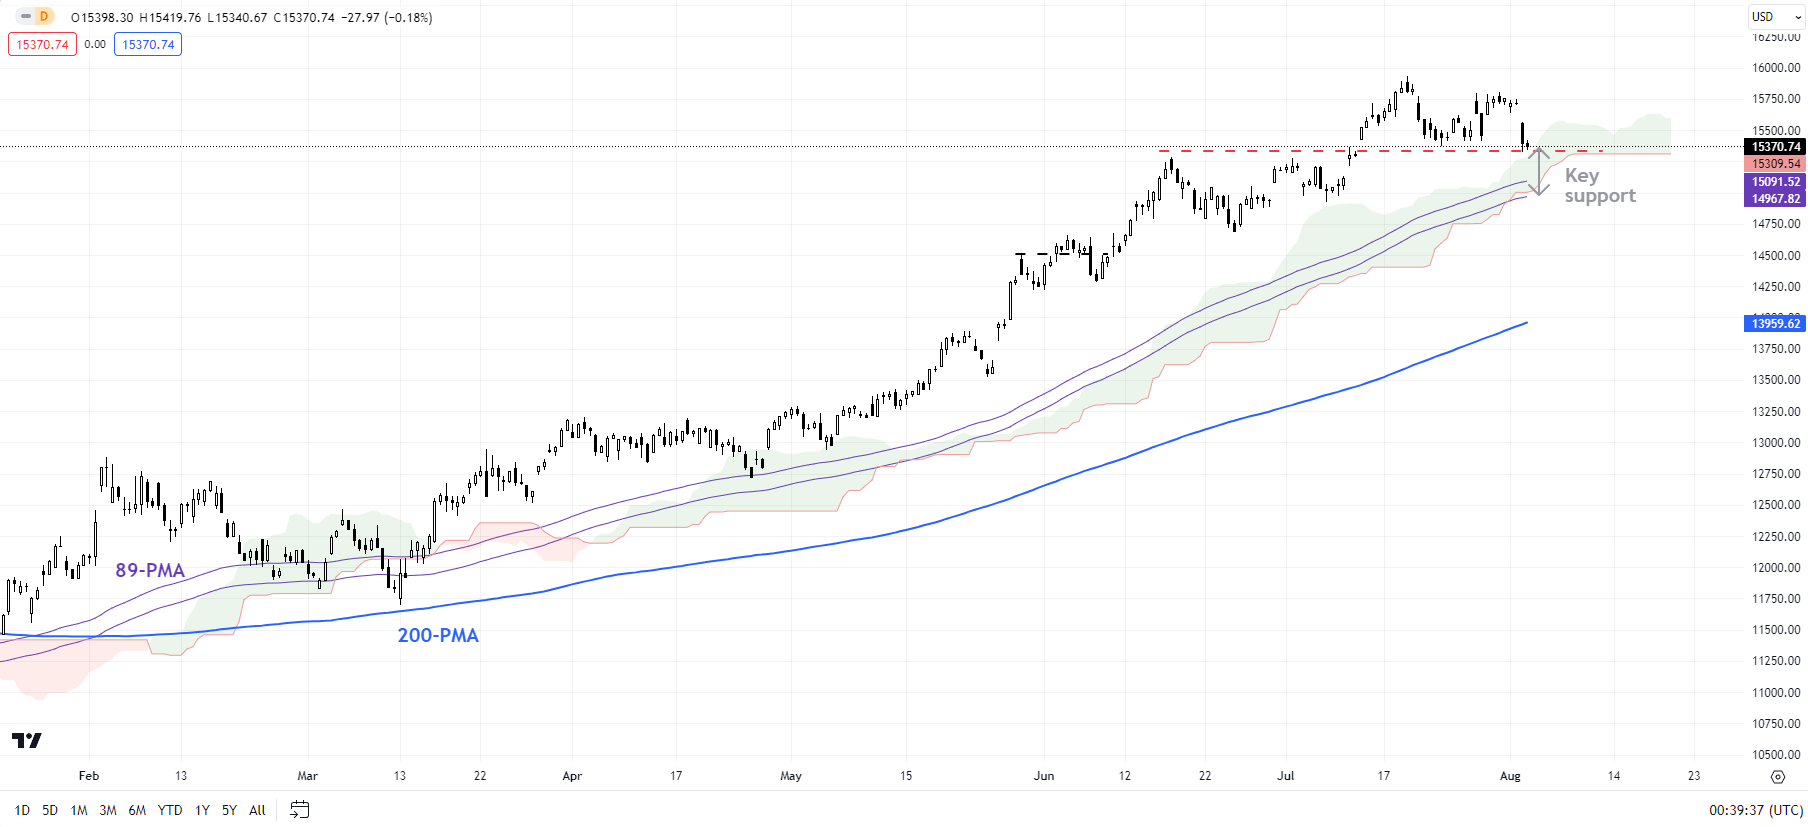
image2.png

Nasdaq 100: Risks minor retreat

On technical charts, the Nasdaq 100 index’s rally appears to be losing steam as it tests an immediate cushion at the 15285-15385. Also, as noted in arecent update, monthly charts have been feeble compared with the 50% rally since October (see the monthly chart). The strength in upward momentum on the daily and weekly charts perhaps masks the anemic conditions on the monthly charts.

Nasdaq 100 Monthly Chart
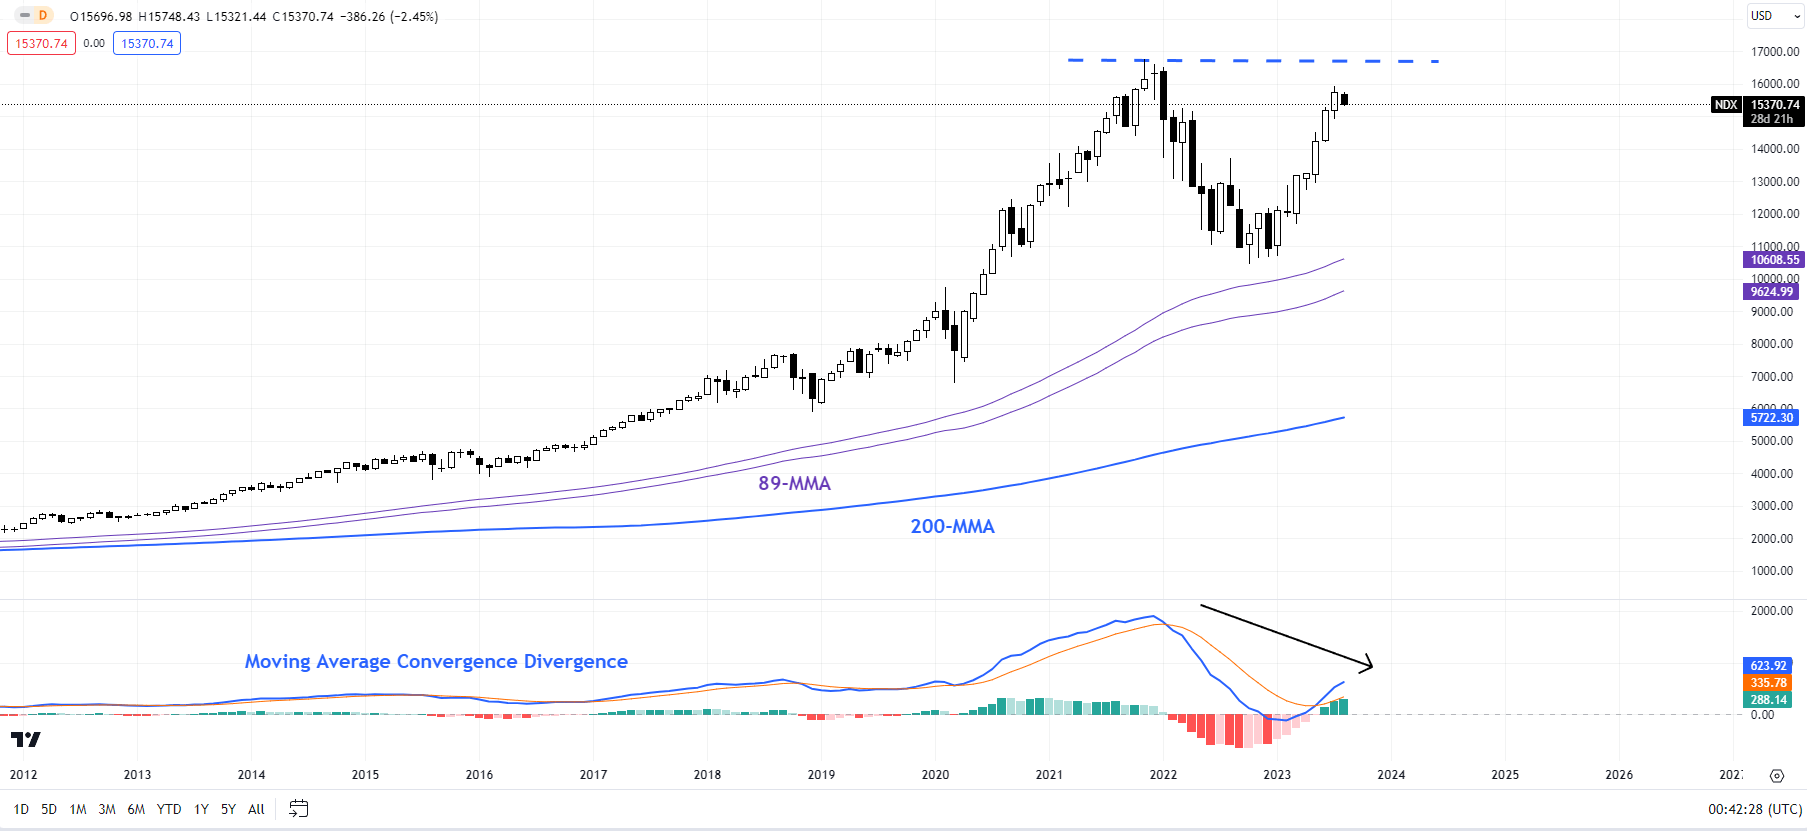
image3.png

Granted, price action is still unfolding — and there is no reversal of the broader uptrend yet. However, a failure of momentum to rise on higher timeframe charts would be a sign that the rally since last year was corrective (as part of the broader correction that started in 2022), and not the resumption of the long-term bull market. Any break below 15285-15385 could expose downside risks toward 14500.

S&P 500 240-Minute Chart
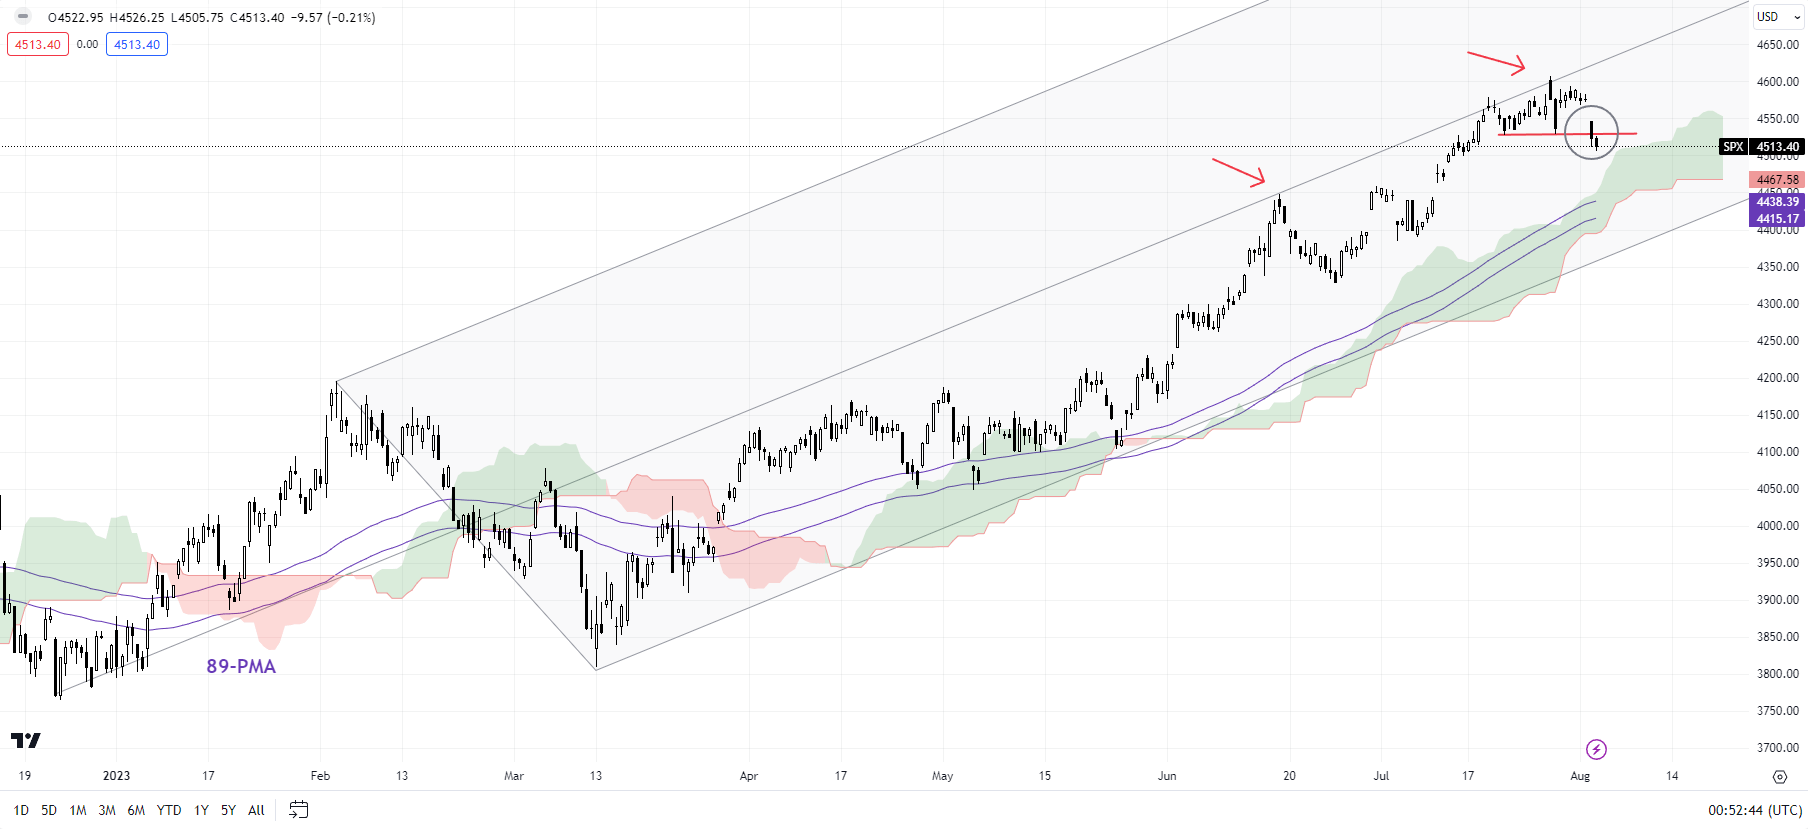
image4.png

S&P 500: Breaks below minor support

S&P 500 index’s fall below minor support at the late-July low of 4550 raises the odds of at least some consolidation/minor retreat in the short term – a riskhighlighted in late July. This follows a failure to rise past converged resistance on the upper edge of a rising pitchfork channel from the end of 2022 and the April 2022 high of 4637.

S&P 500 Monthly Chart
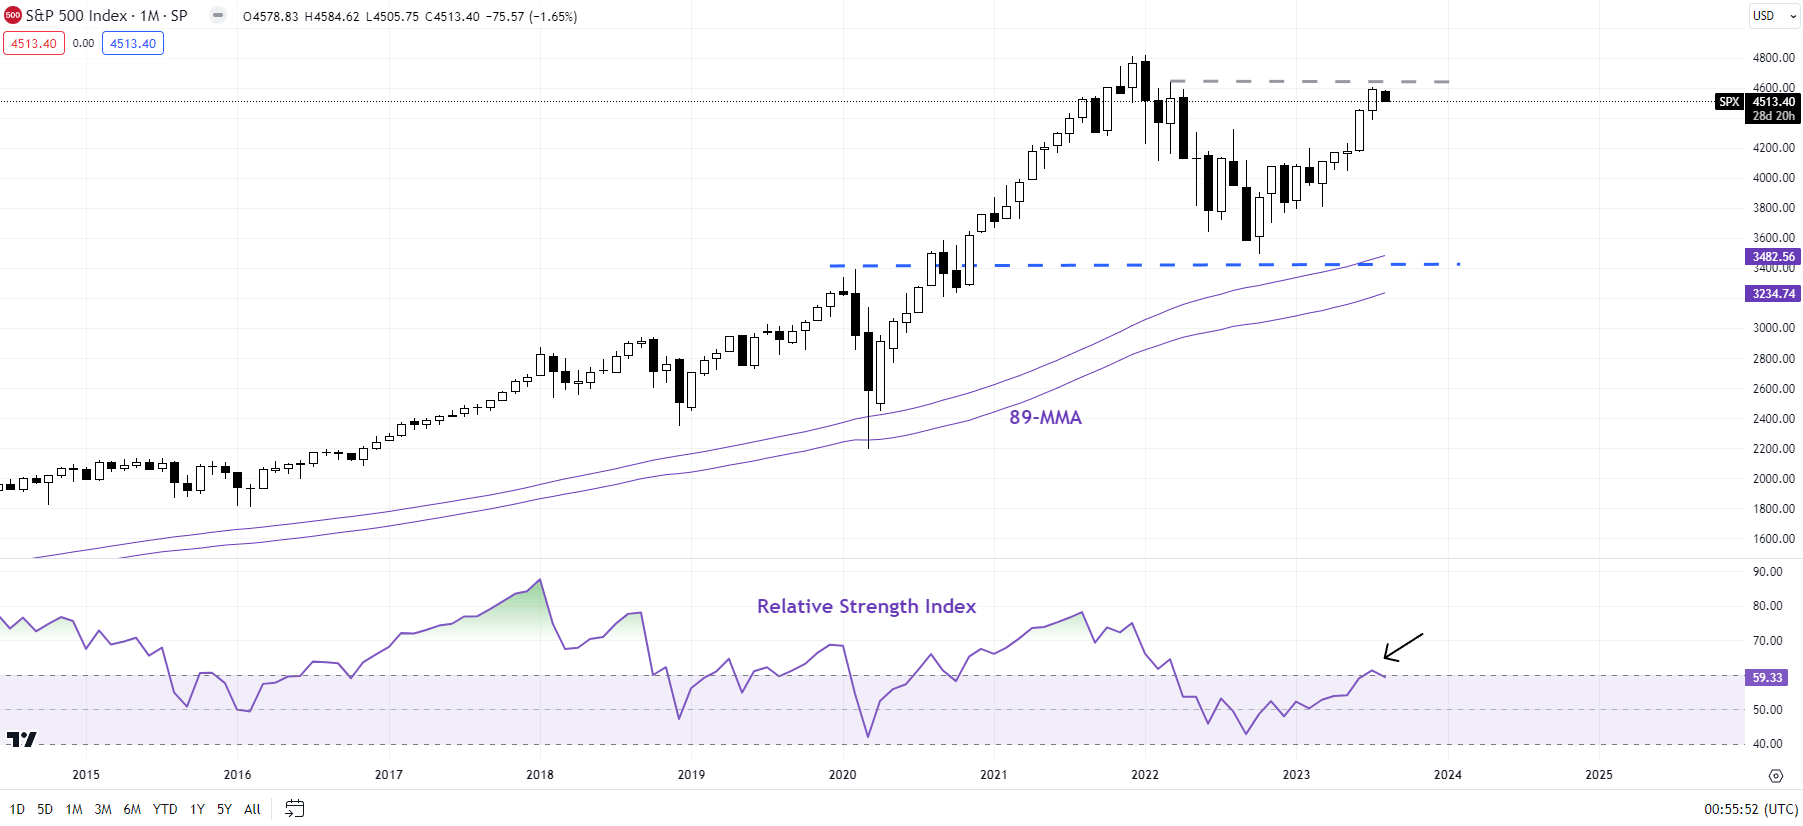
image5.png

The index could fall toward 4400-4415, including the 89-period moving average and the lower edge of the Ichimoku cloud on the 240-minute charts. That could restrict the downside for now given the still-strong momentum on the weekly charts. From a trend perspective, as highlighted in recent updates, the trend in the Nasdaq 100 index and the S&P 500 index’s trend remains up. However, the indices may need to consolidate before the next leg higher.

Japanese Yen and Nikkei 225 Tank as US Dollar Re-Asserts Itself. New USD/JPY Highs?

Japanese Yen and Nikkei 225 Tank as US Dollar Re-Asserts Itself. New USD/JPY Highs?

The Japanese Yen sunk to a 4-week low against the US Dollar today as the market continue to take stock of the tilt triggered by the US debt downgrade.

Fitch, the credit rating agency, downgraded the US to AA+ from AAA on Tuesday for the first time since 1994.

Then on Wednesday, the US Department of Treasury announced that they will seek to issue US$ 103 billion next week, up from the US$ 96 billion last time. Treasury yields are a few basis points higher across the curve, but more so at the backend.

Risk assets in general have been on the back foot ever since and APAC equities followed today with Japan leading the way lower. The Nikkei 225 index is down over 1% along with the TOPIX and JPX-Nikkei 400 indices.

USD/JPY pushed above 143.50 today but it has been the growth-linked Aussie and Kiwi Dollars that have depreciated the most in this latest risk-off rout.

To compound matters today, the Bank of Japan announced an unscheduled bond-buying program today, following Monday’s unscheduled action. The 10-year Japanese Government Bond (JGB) is still trading near 0.65%, the highest level since 2014.

Nonetheless, the spread between 10-year Treasuries and JGBs continue to move in favour of the US Dollar as illustrated in the chart below.

In other central bank news, the Bank OF England rate decision is ahead today, and a Bloomberg survey of economists is forecasting a 25 basis point lift in its target rate.

The overnight index swap (OIS) market is looking at 75 basis points of tightening in total by the end of the second quarter of next year. In any case, GBP/USD is languishing near 1.2700.

Crude oil has struggled so far through Wednesday after collapsing yesterday. The WTI futures contract is near US$ 79.50 bbl while the Brent contract is trading at over US$ 83 bbl at the time of going to print.

Spot gold is resting near 3 weeks lows just above US$ 1,930. Live prices can be found here.

Looking ahead, Wall Street futures are pointing toward a steady start to its cash session.

The full economic calendar can be viewed here.

USD/JPY Against 10-Year Treasury/JGB Yield Spread

image1.png


Australian Dollar Hurt by Dampened Risk Appetite; AUD/USD, AUD/CAD, AUD/SGD Price Setups

Australian Dollar Hurt by Dampened Risk Appetite; AUD/USD, AUD/CAD, AUD/SGD Price Setups

A scaling back in risk appetite and an unexpected pause by the Reserve Bank of Australia (RBA) earlier in the week is weighing on the Australian dollar.

Fitch’s downgrade of US credit rating and higher-for-longer rates following strong US private payroll data appears to be the recent catalysts for the setback in risk appetite. RBA delivered its second rate pause, contrary to expectations of a 25 basis-points hike, boosting the perception that Australia’s interest rates may have peaked, or at least moving to a data-dependent approach with regards to further tightening.

Meanwhile, markets are awaiting fresh stimulus from China targeted toward the ailing property sector. Beijing has announced a series of measures to cushion some of the downside risks to the economy, including cuts in key lending benchmarks, targeted measures toward new-energy vehicles, the property sector aimed at the supply side, and the booming generative artificial intelligence sector, and signaled the end of the years-long crackdown on the technology sector.For more discussion, see “Australian Dollar Surges on China Stimulus Pledge; AUD/USD, EUR/AUD, GBP/AUD Price Action,” published July 25.

Additional measures for the struggling property sector addressing the demand side and infrastructure could provide a floor to the deteriorating growth outlook. China is Australia’s largest two-way trading partner in goods and services. Any improvement in China’sgrowthoutlook bodes well for AUD prospects.

AUD/USD Daily Chart

image1.png

AUD/USD: Looking vulnerable

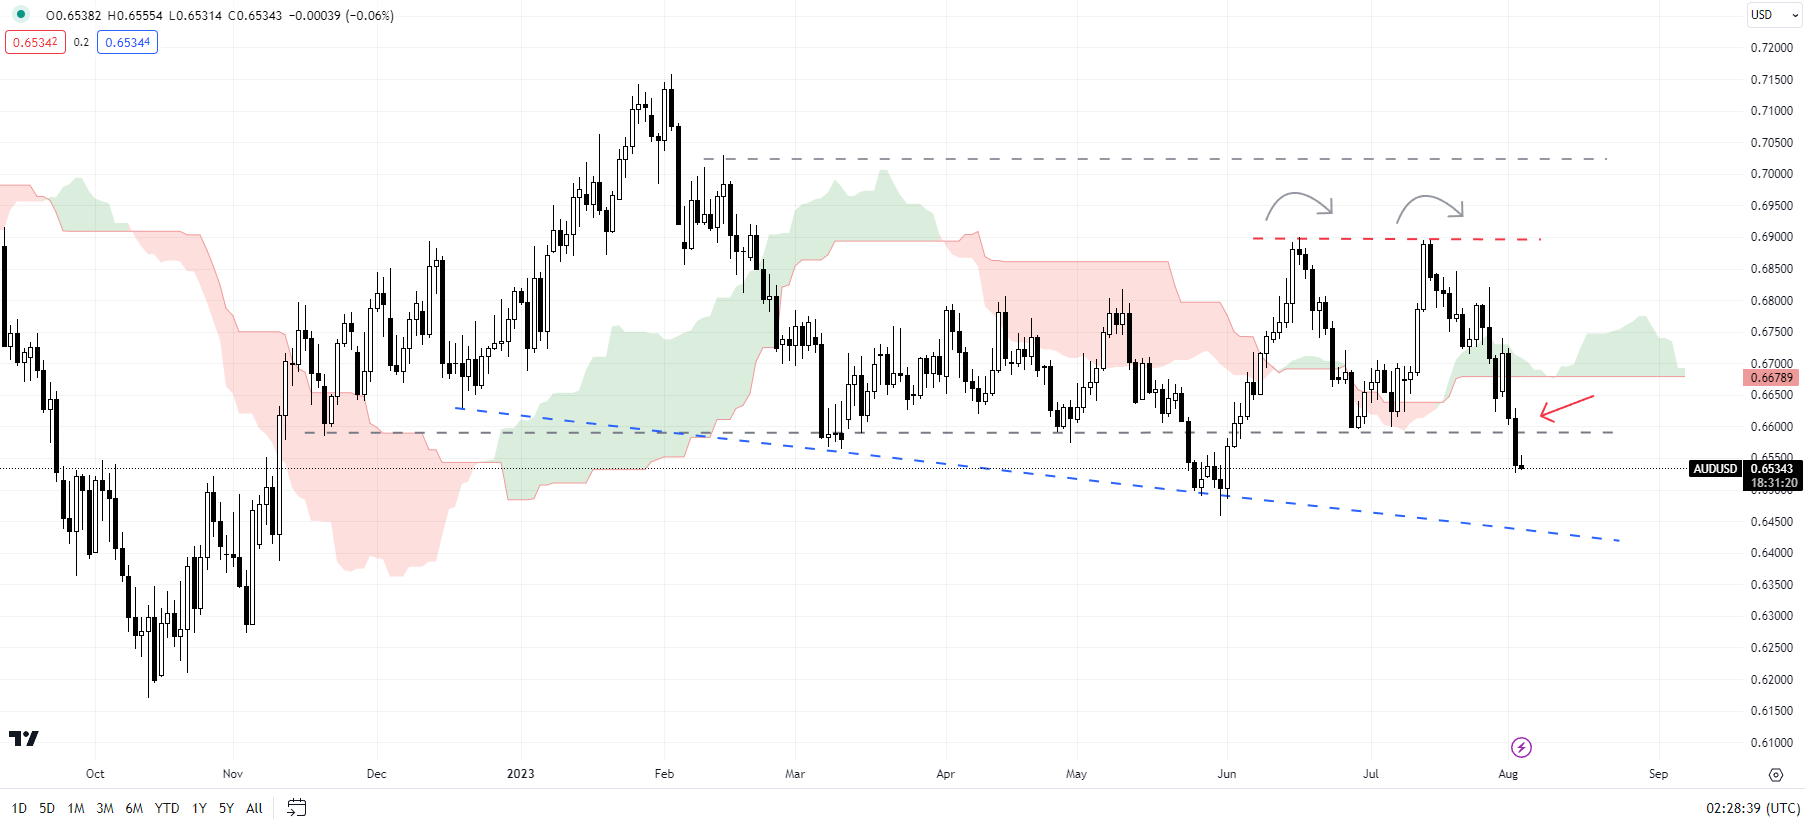
On technical charts, AUD/USD is attempting to break below a vital floor at the end-June low of 0.6600, triggering a double top (the June and the July highs), potentially exposing the downside toward 0.6300. However, there is interim support on the lower edge of a declining trendline (at about 0.6375). A double top as a reversal pattern tends to be reliable, especially after a well-defined prior trend. However, in the current episode, the choppy/directionless price action since Q2-2023 raises the risk of undershooting the price objective of the pattern.

Any break below 0.6375-0.6450, roughly coinciding with the May low of 0.6450, could open the door toward the end-2022 low of 0.6170.

AUD/SGD Weekly Chart

image2.png

AUD/SGD: Testing the line in the sand

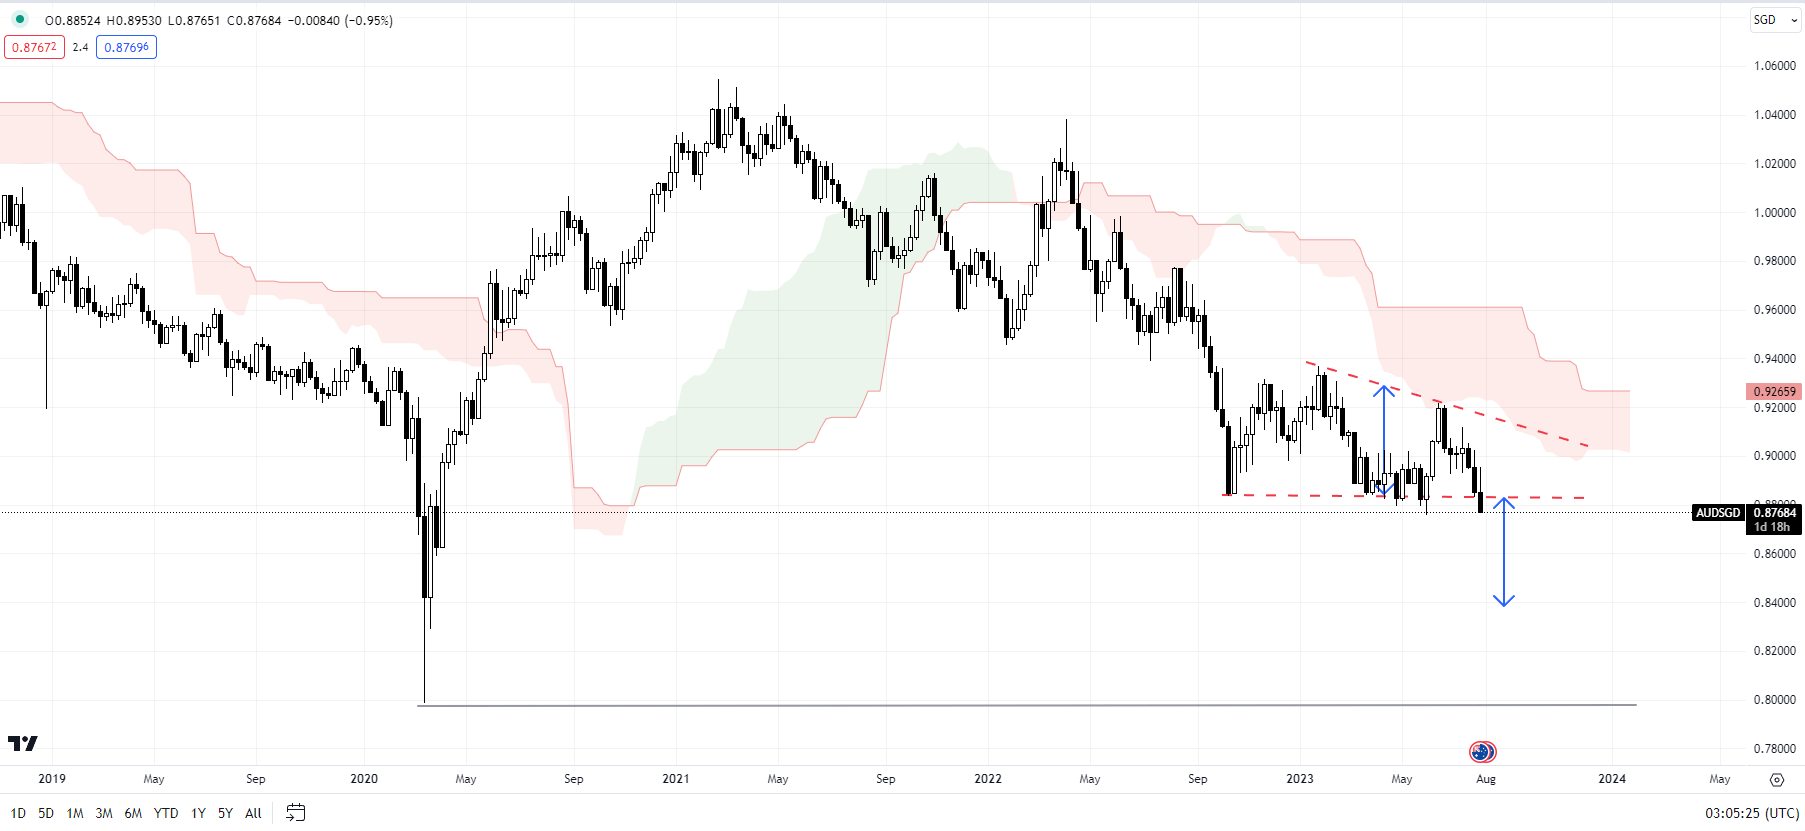
Any break below a horizontal trendline from October, that comes in at about 0.8800, would trigger a breakout from a descending triangle. The upper edge of the triangle is a downtrend line from January. A breakout from the pattern could trigger a move of about 400 pips, based on the width of the pattern. Major support comes in at the 2020 low of 0.7980.

AUD/CAD Daily Chart

image3.png

AUD/CAD: Drifting lower

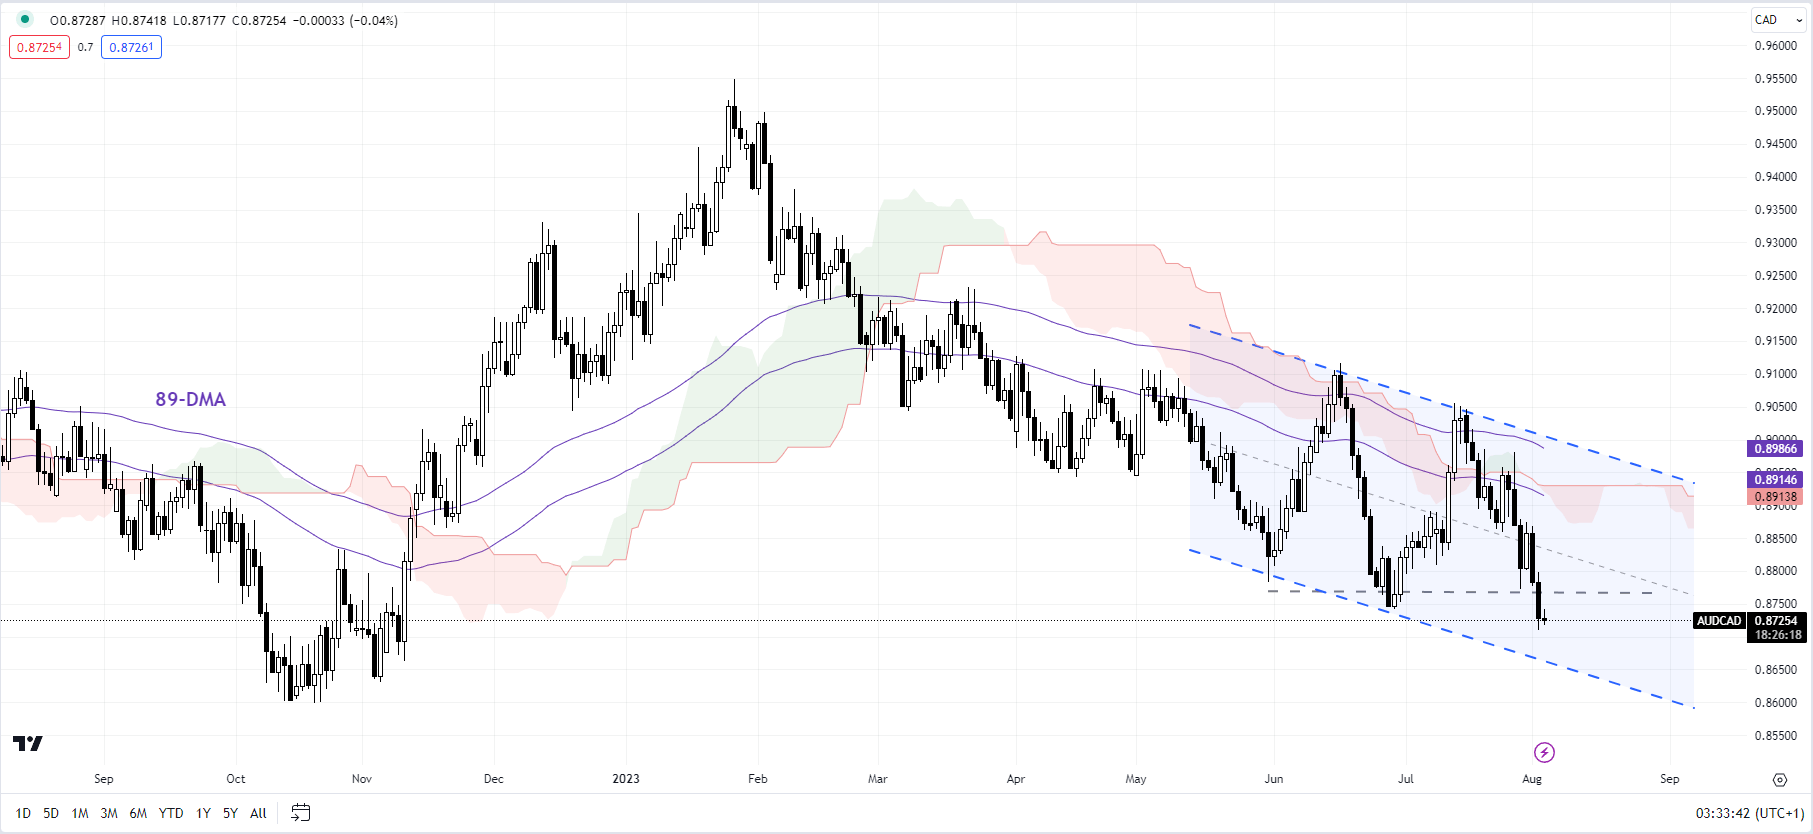
AUD/CAD appears to be well guided within a downward-sloping channel from June, with initial support on the lower edge, now at about 0.8675. The lower-lows-lower-highs pattern since the start of 2023 raises the scope of a retest of the end-2023 low of 0.8600.

US Dollar Price Forecast: Investors Retreat to USD Sanctuary

US Dollar Price Forecast: Investors Retreat to USD Sanctuary

USD FUNDAMENTAL BACKDROP

The Dollar Index (DXY) has maintained its elevated levels today after the Fitch ratings agency downgrade as the safe-haven aspect of the greenback comes into play – investors have been moving out of riskier asset classes including equities and seeking low risk options that include the USD from an FX point of view. Yesterday’s ADP employment change beat added to the bullish bias short-term as markets prepare for the upcoming Non-Farm Payroll (NFP) report on Friday.

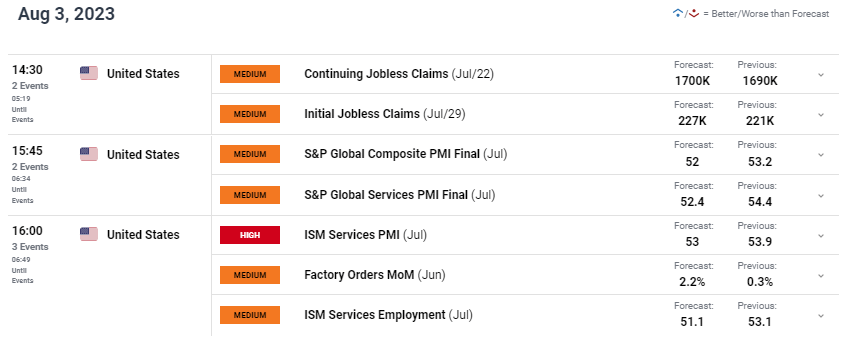
Today’s focus (see economic calendar below) will be on initial jobless claims and US ISM services PMI’s, both of which are expected to show a moderation in the US economy. Unless actual figures on jobless claims exceed estimates and services significantly miss, the USD is likely to remain buoyant at current levels. As mentioned above, the NFP report will dominate the weeks economic data considering ADP numbers have not been a reliable gauge for the NFP print of recent, markets are adopting a cautious approach until NFP’s are released.

US ECONOMIC CALENDAR (GMT +02:00)

image1.png

TECHNICAL ANALYSIS

U.S. DOLLAR INDEX DAILY CHART

image2.png

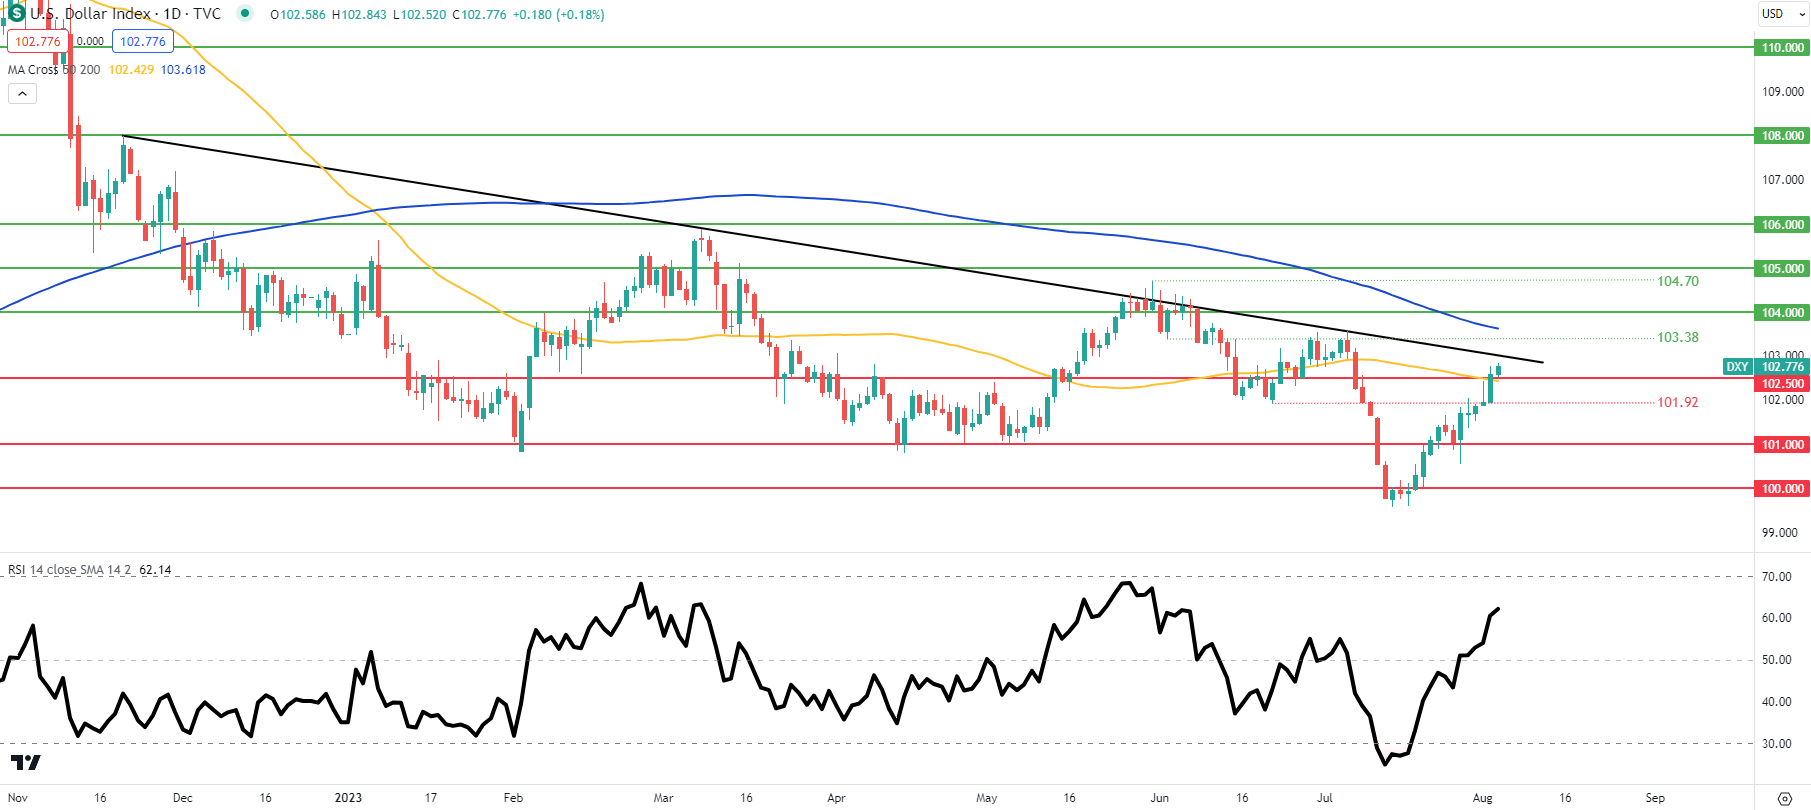
Daily DXY price action has pushed above the 102.50 psychological handle coinciding with the 50-day moving average (yellow). Bulls will now eye the medium-term trendline resistance (black) that has not been breached since early November 2022. A move towards this resistance zone could see the Relative Strength Index (RSI) move into overbought territory; suggestive of upside fatigue.

Oil Price Forecast: Volatile Trade as Tight Supply Offsets Credit Downgrade

Oil Price Forecast: Volatile Trade as Tight Supply Offsets Credit Downgrade

Overview

US benchmark West Texas Intermediate (WTI) crude oil prices saw little change on Thursday following a steep decline the previous session, partly due to the U.S. government’s credit downgrade impacting sentiment. Fitch, the ratings agency, downgraded the long-term foreign currency ratings of the U.S., citing concerns about fiscal deterioration, political polarization, and the international status of the U.S. dollar – the world’s biggest oil consumer.

Oil Supported Amid Tightening Supply

Amidst this bearish sentiment, the oil prices are finding some support from the anticipation of tightening supply. Major producers’ output cuts, likely to remain in place following a meeting on Friday, are contributing to these concerns. Despite a 2% drop after the ratings downgrade, WTI prices had a remarkable 16% surge in July, propelled by supply constraints.

Trading Derivatives carries a high level of risk to your capital and you should only trade with money you can afford to lose. Trading Derivatives may not be suitable for all investors, so please ensure that you fully understand the risks involved, and seek independent advice if necessary. A Product Disclosure Statement (PDS) can be obtained either from this website or on request from our offices and should be considered before entering into a transaction with us. Raw Spread accounts offer spreads from 0.0 pips with a commission charge of USD $3.50 per 100k traded. Standard account offer spreads from 1 pips with no additional commission charges. Spreads on CFD indices start at 0.4 points. The information on this site is not directed at residents in any country or jurisdiction where such distribution or use would be contrary to local law or regulation.

The recent pullback in oil prices was anticipated given the steady rise over the past month. However, it’s expected that the oil market will continue to be tight in the short-term, potentially making prices susceptible to a further decline.

Record Crude Stockpile Drop Signals Demand Surge

The significance of supply constraints was evident as U.S. crude stockpiles saw a record 17 million barrel drop last week, exceeding analysts’ expectations. This points to a scenario where global demand is outpacing supply, mainly due to the deep cuts made by major producers.

OPEC+ Meeting: Limited Output Changes

Looking ahead, the next OPEC+ market monitoring committee meeting, scheduled for Aug. 4, is unlikely to make significant changes to the current oil output policy. Saudi Arabia is expected to extend its voluntary 1 million bpd cut for another month, up until September.

China’s Policies Boosting Crude Market

Additionally, supportive government policies aimed at boosting China’s economy – the world’s second-largest oil consumer – are also contributing to price support and fuel demand. On a positive note, China’s services sector expanded at a quicker pace in June, offsetting disappointing manufacturing data earlier in the week.

Considering China’s further stimulus policy and the sharp drawdown in U.S. inventory data, the fundamentals appear to be strong reasons for a rebounding crude market.

Short-Term Outlook:  Heightened Volatility Expected

In conclusion, while the U.S. credit downgrade has impacted sentiment, the tight supply situation and supportive policies in China are holding up the oil prices for now. The oil market may experience short-term volatility, but the overall outlook remains promising with strong underlying factors supporting a potential rebound.

Technical Analysis

4-Hour Crude OilBased on the provided 4-hour chart data for Crude Oil, the current price of 79.54 is above the 200-4H moving average of 74.27 but below the 50-4H moving average of 79.89, indicating mixed market sentiment. The 14-4H RSI reading of 40.73 suggests a bearish bias.

The main support area lies between 73.81 and 74.62, while the main resistance area is between 81.73 and 83.63. As the market exhibits mixed signals, with the price positioned between key moving averages and RSI signaling a bearish tone, traders should exercise caution and monitor price action around support and resistance levels for potential trend shifts.

Given its proximity to the 50-4H moving average, trader reaction to this level at 79.90 is likely to set the tone on Thursday.

DAX Set for Another Wild Ride with Service PMIs in Focus

DAX Set for Another Wild Ride with Service PMIs in Focus

It was a bearish Wednesday for the DAX, which fell by 1.36%. After sliding by 1.26% Tuesday, the DAX ended the day at 16,020. Significantly, the DAX visited sub-16,000 for the first time since July 17.

News of Fitch Ratings downgrading the US sovereign rating from AAA to AA+ weighed on riskier assets. The disappointing manufacturing PMIs from China, Europe, and the US continued to resonate mid-week, fueling recessionary jitters.

Trading Derivatives carries a high level of risk to your capital and you should only trade with money you can afford to lose. Trading Derivatives may not be suitable for all investors, so please ensure that you fully understand the risks involved, and seek independent advice if necessary. A Product Disclosure Statement (PDS) can be obtained either from this website or on request from our offices and should be considered before entering into a transaction with us. Raw Spread accounts offer spreads from 0.0 pips with a commission charge of USD $3.50 per 100k traded. Standard account offer spreads from 1 pips with no additional commission charges. Spreads on CFD indices start at 0.4 points. The information on this site is not directed at residents in any country or jurisdiction where such distribution or use would be contrary to local law or regulation.

Later in the European session, US labor market numbers provided brief support, with the latest round of US labor market stats easing fears of softer labor market conditions. However, it was a bearish US session, with the markets responding to the Fitch Ratings news.

The Dow fell by 0.98%. On Wednesday, the NASDAQ Composite Index and the S&P 500 saw losses of 2.17% and 1.38%, respectively.

Daily Chart sends bullish price signals.
DAX 030823 Daily Chart

Economic Indicators Sent Bearish Signals

It was a quieter day on the European economic calendar, with unemployment figures from Spain in focus. The numbers failed to distract investors from the Tuesday manufacturing PMI numbers and the bearish Asian session.

Unemployment fell by 11.0k in July versus a 50.3k slide in June. Economists forecast a 38.2k decline.

However, US labor market numbers provided brief support later in the day. According to the ADP, nonfarm employment increased by 324k in July versus a 455k surge in June. Economists forecast a more modest 189k increase.

The Market Movers

It was another mixed session for the auto sector. Porsche slid by 1.27%, with Continental AG and Volkswagen seeing losses of 0.98% and 0.78%, respectively. BMW and Mercedes-Benz Group bucked the trend, rising by 0.36% and 0.18%, respectively.

However, it was a bearish session for the banks. Commerzbank and Deutsche Bank fell by 1.71% and 2.30%, respectively.

Siemens Healthineers led the way down, sliding by 5.55% on disappointing results from the Varian radiation oncology business. The loss came despite the firm reporting a pickup in net profit in the third quarter.

The Day Ahead for the DAX

This morning, service sector PMI numbers from China set the tone. The Caixin Services PMI rose from 53.9 to 54.1 in July. Economists forecast a PMI of 52.5.

After bearish manufacturing sector PMIs from Tuesday, the European private sector will be in focus for a second time this week. Service sector PMIs from Spain and Italy and finalized numbers for France, Germany, and the Eurozone will move the dial.

Weaker service sector activity across Italy and Spain and a downward revision to the Eurozone services PMI would fuel recessionary jitters. According to the flash survey, the Eurozone services PMI fell from 52.0 to 51.1 in July.

German trade data is also on the calendar but will likely play second fiddle to the services PMI.

ECB Executive Board Member Fabio Panetta is on the calendar to speak today. However, investors should monitor the news wires for chatter with the media.

Eying the US economic calendar, US initial jobless claims and the all-important ISM Non-Manufacturing PMI are in focus. Economists forecast the ISM Non-Manufacturing PMI to fall from 53.9 to 53.0. However, investors must consider the sub-components. These include employment, new business, and prices.

Other stats include finalized Markit survey-based service PMI, nonfarm productivity, unit labor costs, and factory orders. However, these stats should play second fiddle to the initial jobless claims and ISM survey-based numbers.

DAX Technical Indicators

Looking at the EMAs and the 4-hourly chart, the EMAs sent mixed signals. The DAX sat below the 50-day EMA (16,173) while holding above the 200-day EMA (15,966), sending bearish near-term but bullish longer-term price signals.

Significantly, the 50-day EMA narrowed to the 200-day EMA, sending bearish price signals and supporting a fall through the lower level of the 16,080 – 16,000 support band to bring the 200-day EMA (15,966) into play.

A DAX move through the upper level of the 16,080 – 16,000 support band would give the bulls a run at the 50-day EMA (16,173).

The 14-4H RSI sits at 34.26, signaling bearish sentiment, with selling pressure overweighing buying pressure. Significantly, the RSI suggests a fall through the lower level of the 16,080 – 16,000 support band to target the 200-day EMA (15,966).

4-Hourly Chart sends bearish near-term price signals.
DAX 030823 4-Hourly Chart
EUR/USD Bears Eye Sub-$1.09 on Euro Area Recessionary Jitters

EUR/USD Bears Eye Sub-$1.09 on Euro Area Recessionary Jitters

On Wednesday, the EUR/USD declined by 0.42% to wrap up the day at $1.09378. Risk aversion weighed on the EUR/USD, with increasing fears of a global economic recession and the US sovereign rating downgrade weighing.

After bearish manufacturing sector PMIs from Tuesday, the European private sector will be in focus for a second time this week. Service sector PMIs from Spain and Italy and finalized numbers for France, Germany, and the Eurozone will move the dial.

Trading Derivatives carries a high level of risk to your capital and you should only trade with money you can afford to lose. Trading Derivatives may not be suitable for all investors, so please ensure that you fully understand the risks involved, and seek independent advice if necessary. A Product Disclosure Statement (PDS) can be obtained either from this website or on request from our offices and should be considered before entering into a transaction with us. Raw Spread accounts offer spreads from 0.0 pips with a commission charge of USD $3.50 per 100k traded. Standard account offer spreads from 1 pips with no additional commission charges. Spreads on CFD indices start at 0.4 points. The information on this site is not directed at residents in any country or jurisdiction where such distribution or use would be contrary to local law or regulation.

Weaker service sector activity across Italy and Spain and a downward revision to the Eurozone services PMI would fuel recessionary jitters. According to the flash survey, the Eurozone services PMI fell from 52.0 to 51.1 in July.

The PMI numbers are survey-based but give the ECB and the markets a snapshot of conditions across the private sector. While the manufacturing sector traditionally has more weighting, service sector activity has had more influence post-COVID-19, with trade terms yet to return to normal. Waning service sector activity would raise the prospects of a Eurozone economic recession.

German trade data is also on the calendar but will likely play second fiddle to the services PMI.

ECB Executive Board Member Fabio Panetta is on the calendar to speak today. However, investors should monitor the news wires for chatter with the media.

This morning, service sector PMI numbers from China set the tone. The Caixin Services PMI rose from 53.9 to 54.1 in July. Economists forecast a PMI of 52.5.

The US Session

It is a busy US session, with US initial jobless claims and the all-important ISM Non-Manufacturing PMI in focus. Economists forecast the ISM Non-Manufacturing PMI to fall from 53.9 to 53.0. However, investors must consider the sub-components. These include employment, new business, and prices.

The US services sector accounts for more than 70% of the US economy, making the ISM Non-Manufacturing PMI a leading indicator. Weakening service sector activity would fuel recessionary jitters. The early signs of waning service sector activity include lower staffing levels, declining new orders, and weaker output prices. Increased competition for new work leads to falling output prices.

Other stats include finalized Markit survey-based service PMI, nonfarm productivity, unit labor costs, and factory orders. However, these stats should play second fiddle to the initial jobless claims and ISM survey-based numbers.

EUR/USD Price Action

Daily Chart

The Daily Chart showed the EUR/USD hover above the upper level of the $1.0900 – $1.0850 support band. However, after the bearish Wednesday session, the EUR/USD fell through the 50-day ($1.09709) while holding above the 200-day ($1.07873) EMAs, sending bearish near-term but bullish longer-term price signals.

A EUR/USD move through the 50-day EMA would support a run at the $1.1015 – $1.1060 resistance band. However, failure to move through the 50-day EMA ($1.09709) would leave the $1.0900 – 1.0850 support band in play.

Looking at the 14-Daily RSI, the 41.82 reading sends bearish price signals. The RSI suggests a fall through the upper level of the $1.0900 – 1.0850 support band.

EUR/USD Daily Chart sends bearish near-term price signals.
EURUSD 030823 Daily Chart

4-Hourly Chart

Looking at the 4-Hourly Chart, the EUR/USD sits below the $1.1060 – $1.1015 resistance band. After the bearish Wednesday session, the EUR/USD remained below the 200-day ($1.10059) and 50-day ($1.10204) EMAs, sending bearish near and longer-term price signals.

The 50-day EMA narrowed on the 200-day EMA, signaling a run at the $1.0900 – 1.0850 support band. However, a EUR/USD move through the 200-day EMA ($1.10059) and the lower level of the $1.1015 – $1.1060 support band would give the bulls a run at the 50-day EMA ($1.10204).

The 14-4H RSI at 33.42 sends bearish EUR/USD price signals, with selling pressure outweighing buying pressure. Significantly, the RSI aligns with the 50-day EMA, signaling a fall to the $1.0900 – 1.0850 support band.

Price action today will hinge on the euro area and US services PMIs.

4-Hourly Chart affirms near-term bearish trend.
EURUSD 030823 4 Hourly Chart
XRP Bears to Retarget $0.65 as Crypto Investor Sentiment Deteriorates

XRP Bears to Retarget $0.65 as Crypto Investor Sentiment Deteriorates

On Wednesday, XRP slid by 3.08%. Reversing a 1.20% gain from Tuesday, XRP ended the day at $0.6849. XRP ended the day at sub-$0.70 for the second time since the SEC v Ripple Court ruling.

XRP Price Action

Weekly Chart sends bullish price signals.
XRPUSD 030823 Weekly Chart

Daily Chart

The Daily Chart showed XRP/USD sat below the $0.7870 – $0.7737 support band. However, XRP sat well above the 50-day ($0.6246) and 200-day ($0.5118) EMAs, sending bullish near and longer-term price signals.

Trading Derivatives carries a high level of risk to your capital and you should only trade with money you can afford to lose. Trading Derivatives may not be suitable for all investors, so please ensure that you fully understand the risks involved, and seek independent advice if necessary. A Product Disclosure Statement (PDS) can be obtained either from this website or on request from our offices and should be considered before entering into a transaction with us. Raw Spread accounts offer spreads from 0.0 pips with a commission charge of USD $3.50 per 100k traded. Standard account offer spreads from 1 pips with no additional commission charges. Spreads on CFD indices start at 0.4 points. The information on this site is not directed at residents in any country or jurisdiction where such distribution or use would be contrary to local law or regulation.

Notably, the 50-day EMA pulled further away from the 200-day EMA, affirming a bullish near-term trend. While the EMAs send bullish signals, the Wednesday sell-off left XRP within reach of the $0.6530 – $0.6417 support band.

Looking at the 14-Daily RSI, the 52.25 reading sends bullish XRP price signals, aligning with the EMAs. The RSI supports a run at $0.75 to bring the $0.7870 – $0.7737 resistance band into play.

XRP Daily Chart sends bullish price signals.
XRPUSD 030823 Daily Chart

4-Hourly Chart

Looking at the 4-Hourly Chart, the XRP/USD faces strong resistance at the 50-day EMA ($0.7045). The bearish Wednesday session left XRP/USD below the $0.7870 – $0.7737 resistance band.

XRP also sits below the 50-day EMA ($0.7045) while holding above the 200-day EMA ($0.6541), sending bearish near-term but bullish longer-term price signals. The 50-day EMA narrowed on the 200-day EMA, signaling a fall toward $0.65.

The 14-4H RSI reading of 38.73 signals bearish sentiment, with selling pressure outweighing buying pressure. Significantly, the RSI aligns with the 50-day EMA, signaling a run at the $0.6530 – $0.6417 support band and the 200-day EMA ($0.6541).

XRP 4-Hourly Chart sends bearish near-term price signals.
XRPUSD 030823 4 Hourly Chart

US Justice Department Considers Charging Binance for Fraud

It was another busy session on Wednesday, with the US sovereign rating downgrade and the crypto news wires moving the dial.

The news hit the wires on Wednesday of the US Justice Department considering fraud charges against Binance. Concerns over the impact of charges on Binance leave the DoJ torn between filing charges or imposing a fine or a non-prosecution agreement. Fears of a run and the cost to customers raise the chances of alternative punitive measures.

While the news left XRP in the red, the SEC v Terraform Labs remained an area of interest. Ripple Chief Legal Officer Stuart Alderoty considered the recent comments from the Court, saying,

On closer read, 1/ the Terra Judge actually agrees that orange groves alone are not securities without promises to cultivate the groves and share the profits. 2/ There needs to be an agreement between contracting parties for there to be an investment contract.”

Alderoty went on to say,

“3/ Tokens alone that are not intermingled with other rights and promises are not themselves securities. 4/ The comment about the Ripple ruling is unnecessary, confusing, and non-binding.”

The comments will provide brief relief as SEC plans to appeal the Judge Torres ruling remains a headwind.

The Day Ahead

SEC v Ripple Court ruling-related chatter will remain the focal point. However, investors should continue to monitor the crypto news wires. SEC activity and US lawmaker chatter will move the dial.

Terra Labs v SEC, ETF, Binance, and Coinbase-related news also need consideration

Bitcoin’s Continued Slide Down

Bitcoin’s Continued Slide Down

Crypto Market Cap Dips, Bitcoin Struggles Amidst Market Uncertainty

The crypto market cap fell 1.6% in 24 hours to $1.166 trillion. Risk assets in traditional markets came under pressure as the accumulated overheating in equities (especially in techs) accompanied a trigger – Fitch’s cut of the US rating.

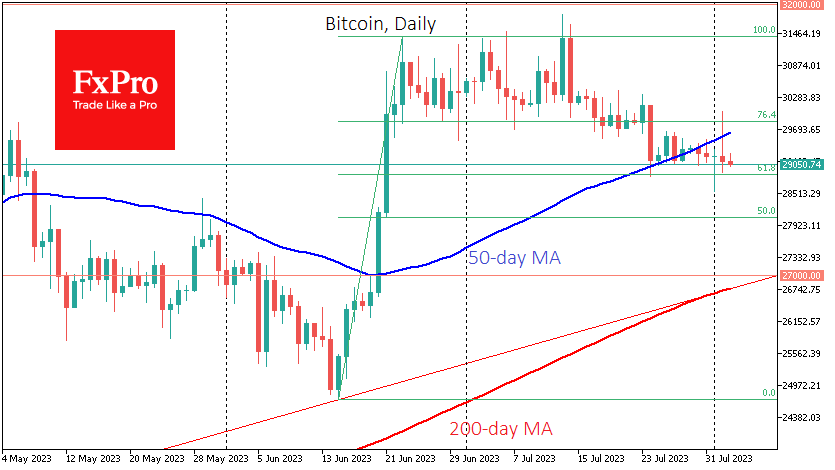
Bitcoin daily chartThe initial flight of speculators into Bitcoin proved to be short-lived. Bitcoin closed Wednesday down 0.5%, losing over 3.1% from its peak at the start of the day, and failed to get back above the 50-day average. This is another bearish signal in addition to the sequence of downward daily candles. So far, Bitcoin has managed to avoid accelerating the sell-off, but it looks like it’s only a matter of time before it does.

Trading Derivatives carries a high level of risk to your capital and you should only trade with money you can afford to lose. Trading Derivatives may not be suitable for all investors, so please ensure that you fully understand the risks involved, and seek independent advice if necessary. A Product Disclosure Statement (PDS) can be obtained either from this website or on request from our offices and should be considered before entering into a transaction with us. Raw Spread accounts offer spreads from 0.0 pips with a commission charge of USD $3.50 per 100k traded. Standard account offer spreads from 1 pips with no additional commission charges. Spreads on CFD indices start at 0.4 points. The information on this site is not directed at residents in any country or jurisdiction where such distribution or use would be contrary to local law or regulation.

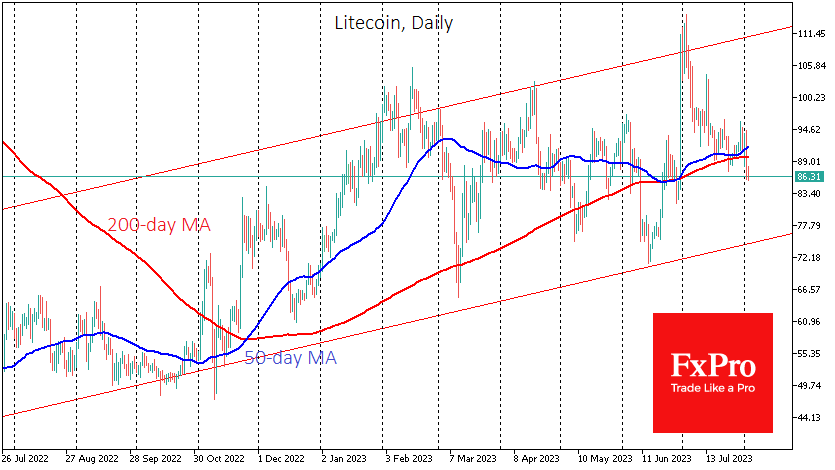
Litecoin daily chartOn Wednesday, the Litecoin (LTC) network saw its third halving. The reward per block was reduced to 6.25 LTC. So far, 87.5% of the total LTC supply has been mined. The altcoin reacted with a decline and hit new month lows at around $86. This drop sent the coin below the 50 and 200-day averages, raising the question of a long-term trend change and opening the way down to $77-80.

Crypto News

Trading activity in the Bitcoin spot market has weakened to its lowest since November 2020, Santiment noted. Major players have so far refrained from entering exchanges, and this trend may continue in August.

MicroStrategy founder Michael Saylor said the company had bought an additional 467 BTC worth $14.4 million in July. As of 31 July, MicroStrategy owns 152,800 BTC worth approximately $4.53 billion at $29,672.

BlackRock’s filing to launch a bitcoin ETF is part of an “adoption cycle” that will allow the first cryptocurrency to hit record highs, Galaxy Digital CEO Mike Novogratz said. The head of BlackRock believed in Bitcoin, he said, and that’s the most important thing that has happened in the crypto market this year.

The chances of the US Securities and Exchange Commission (SEC) approving a bitcoin-ETF application have risen to 65 per cent, Bloomberg analyst James Seyffarth said. Two weeks earlier, he estimated this probability at 50%; a few months ago – at 1%.

Germany’s Trade Surplus Widens to €18.7 billion on Imports Slide

Germany’s Trade Surplus Widens to €18.7 billion on Imports Slide

It is a busy Thursday on the European economic calendar, with service PMIs for Italy and Spain and finalized PMIs for France, Germany, and the Eurozone in focus.

However, German trade data drew interest going into the European session. With the German economy facing a weak global demand environment, today’s numbers would give the markets a better sense of how the economy is performing.

In June, the German trade surplus widened from €14.4 billion to €18.7 billion. Economists forecast a trade surplus of €15.0 billion.

  • Exports increased by 0.1% in June to €131.3 billion.
  • Imports slid by 3.4% in June to €112.6 billion.

Trade with EU countries

  • German exports to EU countries increased by 1.3%, while imports from EU countries fell by 3.1%.
  • The value of goods exported to euro area countries increased by 1.8%, while imports slid by 4.1%.

Trade with non-EU countries

  • Exports of goods to third countries declined by 1.1%, with imports down 3.7%.
  • Exports to the US fell by 0.2%, while exports to China slumped by 5.9%.
  • In contrast, imports from China surged by 5.3%, while imports from the US declined by 1.2%.

While the trade surplus widened, the modest rise in total exports and slide in total imports painted a grim demand picture.

EUR/USD Reaction to German Trade Figures

Before the German trade data, the EUR/USD rose to a pre-stat high of $1.09494 before falling to a low of $1.09193.

However, in response to the trade data, the EUR/USD fell to a post-stat low of $1.09346 before rising to a high of $1.09434.

This morning, the EUR/USD was up 0.02% to $1.09416.

EUR/USD shows muted response to German trade data.

Next Up

After bearish manufacturing sector PMIs from Tuesday, the European private sector will be in focus for a second time this week. Service sector PMIs from Spain and Italy and finalized numbers for France, Germany, and the Eurozone will move the dial.

Weaker service sector activity across Italy and Spain and a downward revision to the Eurozone services PMI would fuel recessionary jitters. According to the flash survey, the Eurozone services PMI fell from 52.0 to 51.1 in July.

ECB Executive Board Member Fabio Panetta is on the calendar to speak today. However, investors should monitor the news wires for chatter with the media.

The US Session

US initial jobless claims and the all-important ISM Non-Manufacturing PMI will be in focus. Economists forecast the ISM Non-Manufacturing PMI to fall from 53.9 to 53.0. However, investors must consider the sub-components. These include employment, new business, and prices.

Other stats include finalized Markit survey-based service PMI, nonfarm productivity, unit labor costs, and factory orders. However, these stats should play second fiddle to the initial jobless claims and ISM survey-based numbers.