Consensus July employment growth at 200K, June GDPNow rises 0.5% m/m, and GDPNow at 3.9% q/q AR. chart Figure 1: Nonfarm payroll employment, NFP (dark blue), civilian employment (orange), industrial production (red), personal income excluding transfers in Ch.2012$ (green), manufacturing and trade sales in Ch.2012$ (black), consumption in Ch.2012$ (light blue), and monthly GDP in Ch.2012$ (pink), GDP (blue bars), 2023Q2 is GDPNow of 8/1, all log normalized to 2021M11=0. Source: BLS, Federal Reserve, BEA 2023Q2 advance release via FRED, S&P Global/IHS Markit (nee Macroeconomic Advisers, IHS Markit) (8/1/2023
Gold Price Ponders Direction as the US Dollar and Treasury Yields Eye Higher Levels
The gold price appears poised at a crossroads going into the weekend with the US Dollar firming as Treasury yields tick higher.
An eventful week for markets may still have more to play out with non-farm payrolls data due out later today.
The Fitch downgrade of US sovereign debt credit rating to AA+ from AAA got the ball rolling on Tuesday with a risk-off rout permeating through markets.
The reaction unfolded despite Treasury Secretary Janet Yellen lambasting the move, referring to it as ‘arbitrary’ and ‘outdated’.
Adding to concerns for US debt, on Wednesday, the US Department of Treasury announced that they will seek to issue US$ 103 billion next week, up from the US$ 96 billion last time.
The increasing cost of Treasury borrowing has been most acute in the back end of the yield curve as investors demand more reward for term risk against a deteriorating US government balance sheet over time.
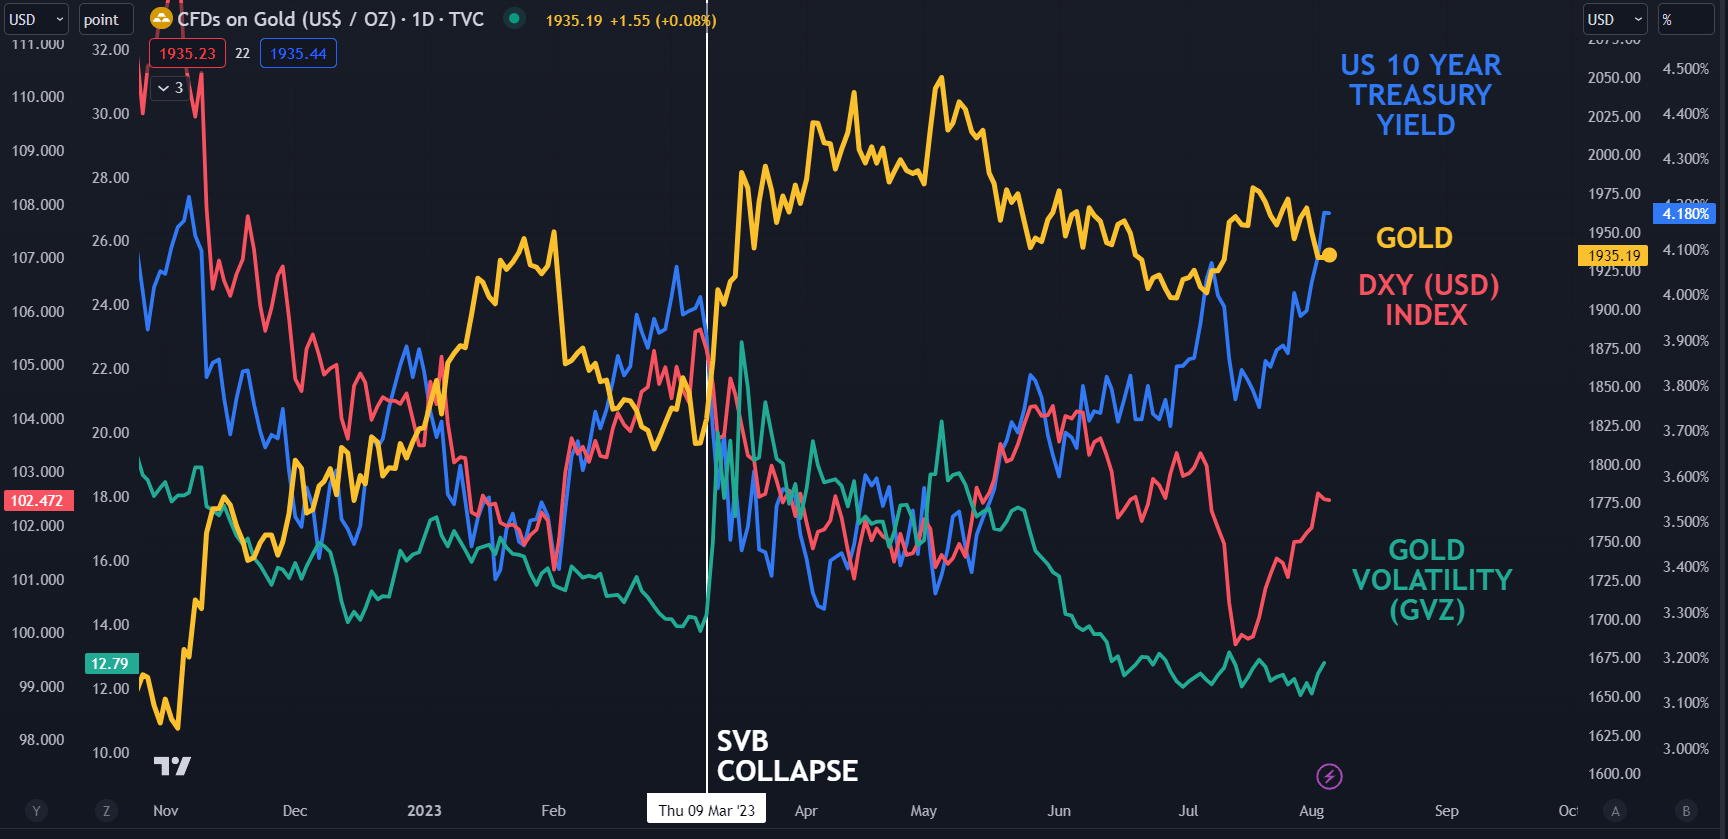
The benchmark 10-year note is surging toward 4.20% for the first time since November last year after dipping to 4.73% a fortnight ago.
In contrast, the short end of the Treasury curve seems more firmly anchored with the market now viewing the Federal Reserve as near the end of its tightening cycle. For 2 weeks the 2-year bond has been trading in a range of 4.85% and 4.95%.
The US Dollar has benefitted throughout this run of risk aversion and the DXY (USD) index has continued to climb off the low seen in the middle of July.
The GVZ index is a measure of implied volatility for gold that is calculated in a similar way to the VIX index’s interpretation of volatility for the S&P 500.
Forward-looking gold volatility has been languishing of late, but it has inched up in the last few trading sessions. This may hint toward some uncertainty within the market and a significant move in price might be in the offing.
Keeping all of this in mind, the yellow metal has held up reasonably well so far, but if these headwinds persist it could be undermined at some point.
{{GUIDE|HOW_TO_TRADE_}}
SPOT GOLD AGAINST US 10-YEAR TREASURY YIELD, DXY (USD) INDEX AND GVZ INDEX
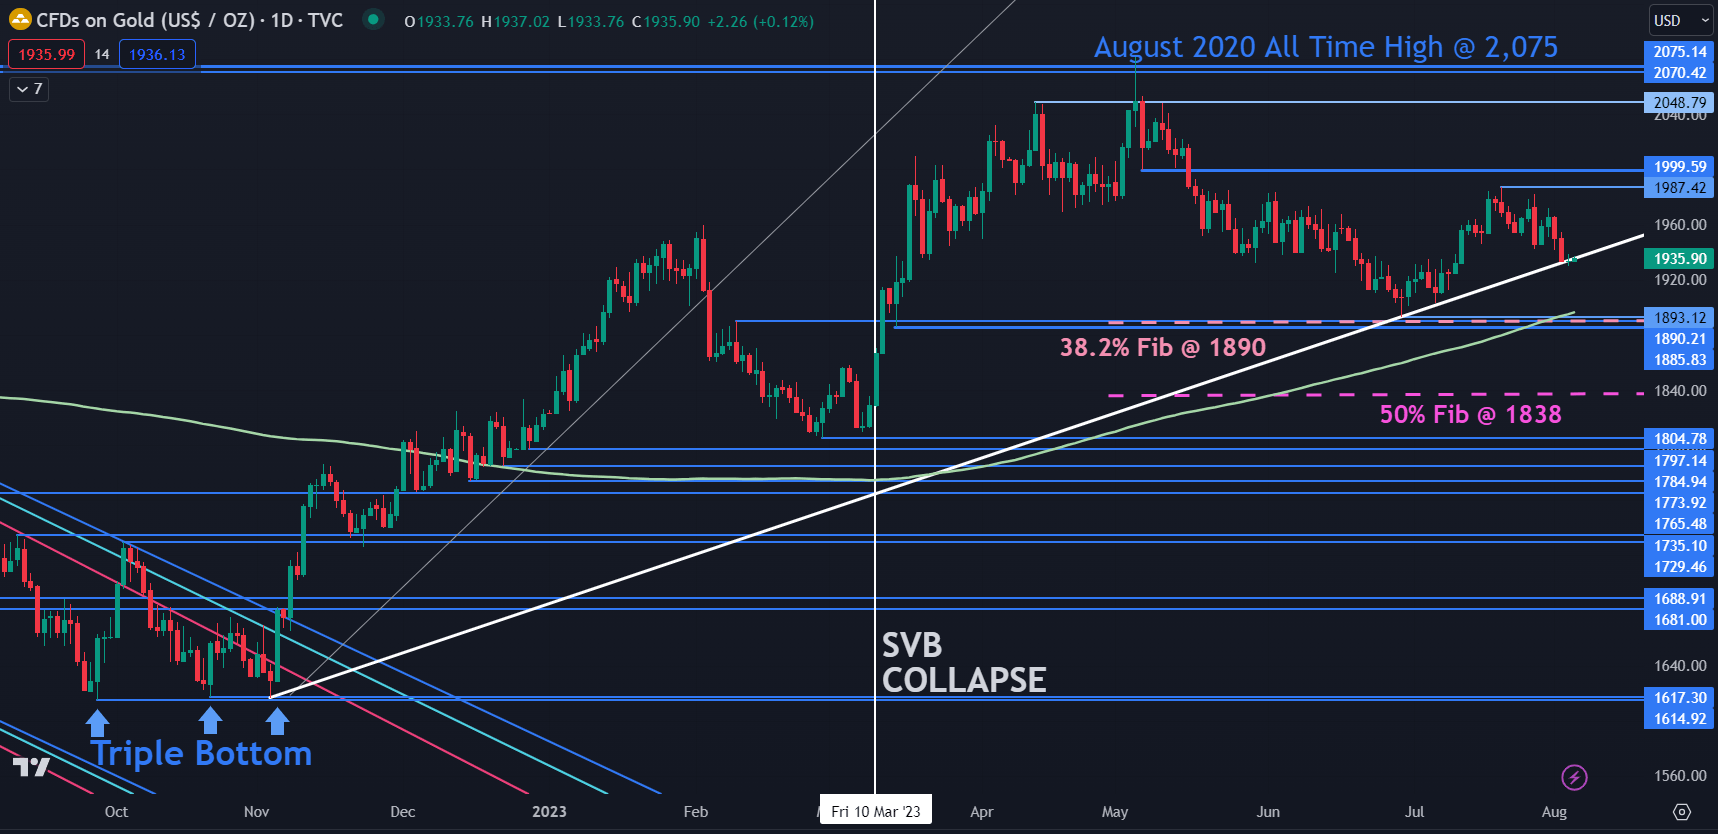
GOLD TECHNICAL ANALYSIS SNAPSHOT
The gold price is currently testing trend line support. Should it break lower, support might lie in the 1885 – 1895 area.
In that zone, there are a series of prior lows, a breakpoint, the 200-day simple moving average (SMA) and the 38.2% Fibonacci Retracement level of the move from 1614 up to 2062.
Further down the 50% Fibonacci Retracement at 1838 might lend support. To learn more about Fibonacci trading, click on the banner below.
On the topside, resistance might be at the recent peak of 1897 or the breakpoint near 2000.
After-market relief in Wall Street, with look-ahead to US job report: US dollar, Straits Times Index, Copper
Market Recap
Major US indices ended the day slightly underwater (DJIA -0.19%; S&P 500 -0.25%; Nasdaq -0.10%), as the US 10-year Treasury yields continue to head to its highest level in almost nine months, following through with the recent announcement that the US Treasury would boost its issuance of long-term debt this quarter.
The release of the US ISM services purchasing managers index (PMI) (52.7 versus 53 forecast) has been mixed as well, particularly with the renewed pull-ahead in services’ prices (56.8 vs 52.1 forecast) which suggests that inflation progress could potentially be harder to come by ahead. Overall, that has kept the lid on the recent equities’ rally, which are already seeing some near-term signs of exhaustion, before attention was shifted to Apple and Amazon’s earnings release.
Better-than-expected growth in Apple’s services division (8% growth YoY vs previous 5.5% in previous quarter) and resilient iPhone sales in China have been the bright spot in Apple’s latest results, but market participants found some discomfort with the continued weakness in its hardware products, which was guided to last into the current quarter. Its share price is lower by 2% after-market.
The positive surprise came from Amazon, with its previous cost-cutting measures translating to an almost two-fold beat in earnings per share. Revenue growth has also returned to the double-digit territory as well (11% year-on-year), with management’s guidance for the strength to continue. The outperformance on all fronts (including Amazon Web Services and advertising) suggests that market expectations have previously underestimated Amazon’s resilience, which prompts a 9% jump in its share price after-market.
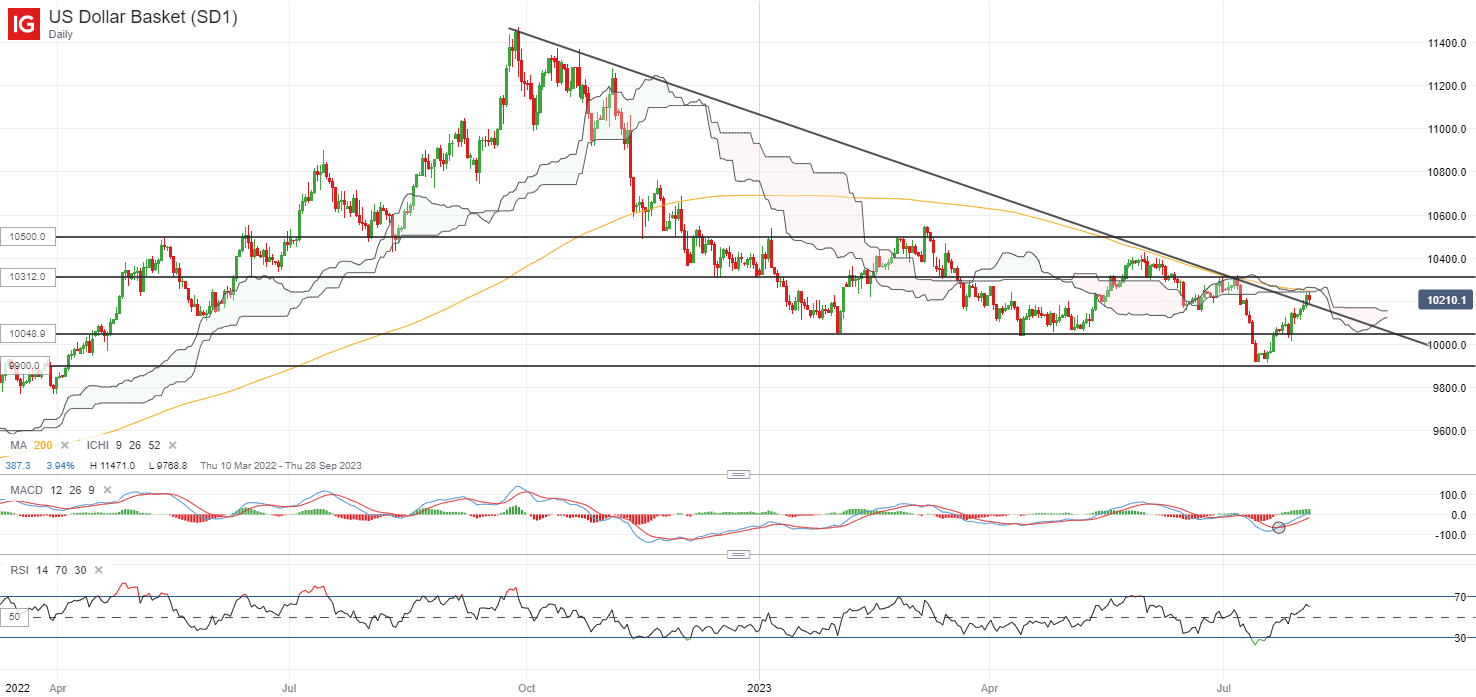
Ahead, the US non-farm payroll data will be the key focus, where a more lukewarm figure may likely make the case for the Fed to transit into a prolonged rate pause while supporting soft landing hopes. Current expectations are for 184,000 job additions in July, compared to the previous month’s 209,000. Unemployment rate is expected to be held steady at 3.6%. The US dollar will be in focus, seemingly attempting for a break above a key downward trendline resistance, but given the lower highs and lower lows formation still in place, much still awaits. The 103.12 level will be a key resistance to overcome ahead, which marked its previous post-Fed sell-off. On the downside, the 100.50 level will stand as immediate support to watch.
Asia Open
Asian stocks look set for a subdued open, with Nikkei +0.29%, ASX -0.01% and KOSPI -0.16% at the time of writing. Pockets of resilience were found in US-listed Chinese equities overnight, with the Nasdaq Golden Dragon China Index up 3.5%.
Following DBS earnings release yesterday, OCBC’s results today will mark the last of local banks’ earnings. The bank posted a 34% rise in 2Q net profit which slightly missed estimates, while economic headwinds into 2024 has been guided, which puts a less optimistic growth outlook in place compared to the other two banks. Dividends were raised to S$0.40 per share, up 43% from a year ago but given that share price has reacted with a strong rally to UOB’s results, much may have been priced.
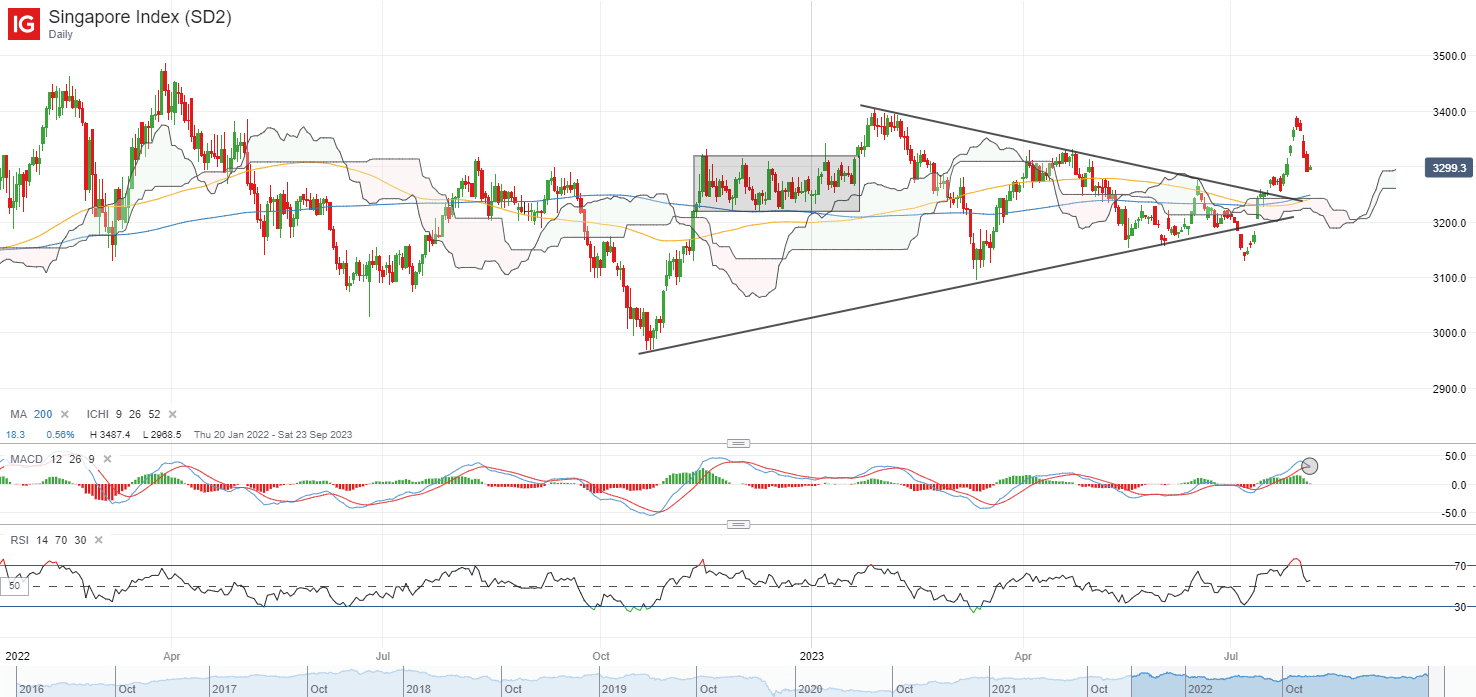
Following an 8% rally in the Straits Times Index since early-July this year, some “sell-the-news” seem to be playing out, with the near-term unwinding leading to the formation of a bearish MACD crossover. Perhaps the key support to put on the radar ahead will be the 3,240 level, where a confluence of its 100-day and 200-day MA stands. The level also marked a previous break of its downward trendline resistance. For now, it could still be a near-term retracement compared to a reversal, with recent sell-off marking the 38.2% Fibonacci retracement level, while its RSI still hangs above its key 50 level.
On the watchlist: Copper prices attempting to form higher low off trendline support
Downbeat economic data out of China and a firmer US dollar have led copper prices to retrace by around 4% this week, but the near-term upward trend remains intact for now with an attempt to form a higher low on the daily chart yesterday. This follows after a retest of a support confluence (upward trendline support, 50-day moving average) at the US$8,460/tonne level was met with some dip-buying, with buyers defending the key 50 level on its daily relative strength index (RSI) thus far.
The US$8,700/tonne level may stand as immediate resistance to overcome. Reclaiming this level may pave the way to retest the US$9,000/tonne level next, with any formation of a new higher high on watch to reinforce the prevailing upward trend.
AUD/USD, GBP/AUD Analyzed as AUD Eyes a Recovery Post RBA Statement
AUD FUNDAMENTAL BACKDROP
The Australian Dollar continued its recovery overnight with modest gains against both the Greenback and the GBP. The week thus far has proven to be another challenging one for the AUD following a continuation of the pause in rate hiking cycle by the RBA on Tuesday which weighed on the currency.
Yesterday saw the AUD regain some strength and arrest its recent slump finishing the day up 0.2% against the US Dollar. The move in part came down to a slightly weaker US Dollar as well as a wee bit of Australian Dollar strength which saw GBPAUD retreat from the fresh YTD high around the 1.9480 mark. Looking at the currency strength chart below we can see AUD is leading the charge this morning with the US Dollar in particular struggling as we do have NFP and Jobs data ahead later in the day.
Currency Strength Chart: Strongest – AUD, Weakest – JPY.
The RBA Monetary Policy Statement this morning revealed the Central Bank contemplated a rate hike at this week’s meeting but felt that consumers and households were already experiencing a “painful squeeze” further cementing the case for a pause. The RBA stressed that this would also provide more time to assess how the how the economy and risks to inflation and employment were evolving. Inflation remains the Central Banks key focus moving forward with positive signs in the offing. Markets are still pricing in a 50-50 chance of one more rate hike in Q4 as services inflation remains elevated and productivity growth lags.
Economic growth forecasts have been downgraded with the Central Bank now expecting growth of just 0.9% in 2023 compared with the previous estimate of 1.2%. Other notable forecasts from the RBA included headline inflation at 4.1% by the end of this year, down from the previous forecast of 4.5%. The RBA does expect inflation to remain sticky in 2024 before easing back to 2.8% by end of 2025 which could mean higher rates are here for a sustained period of time, something which has been echoed by other Central Banks as well. Key uncertainties cited include Australia’s biggest export market China, household consumption, inflation getting more persistent than expected and goods prices declining significantly.
CHINA LIFTS TARIFFS ON AUSTRALIAN BARLEY
In positive new China have decided to drop anti-dumping tariffs on its barley imports with the Australian Government using the opportunity to call for an end to remaining trade restrictions. This could be a big win for the Australian Government as annual trade was once as high as A$1.5 billion ($986.25 million) and follows on from the resumption of trade in products like coal and timber as the trading partners continue their attempts to normalize commercial ties.
EVENT RISK
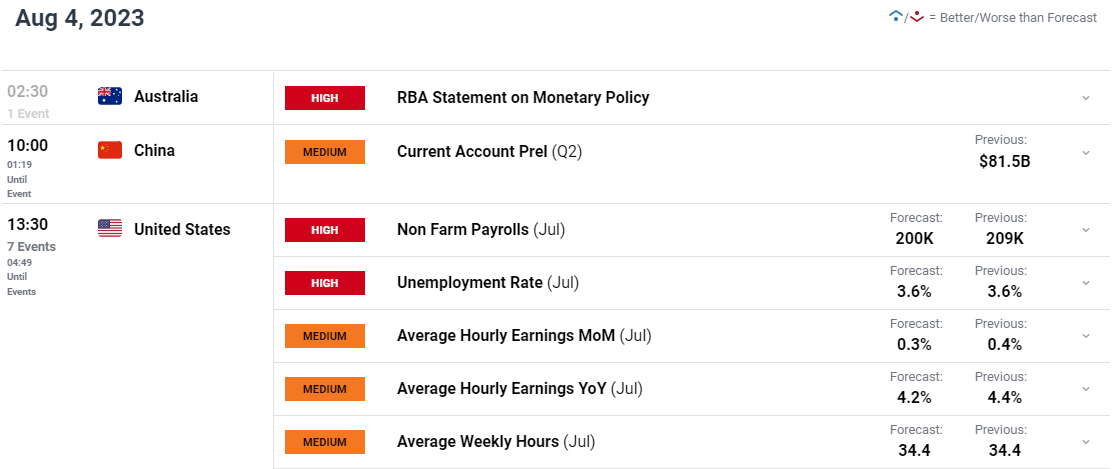
Later in the day US NFP and Jobs date could have an impact on AUDUSD as another positive and forecast beating NFP print could see the Dollar Index (DXY) continue its advance. The NFP print may be overshadowed by average hourly earnings however, as wage growth has proven a key component of inflationary pressure around the developed world in 2023. A positive and forecast beating print could in theory scupper any attempts of a recovery in AUDUSD.
TECHNICAL OUTLOOK AND FINAL THOUGHTS
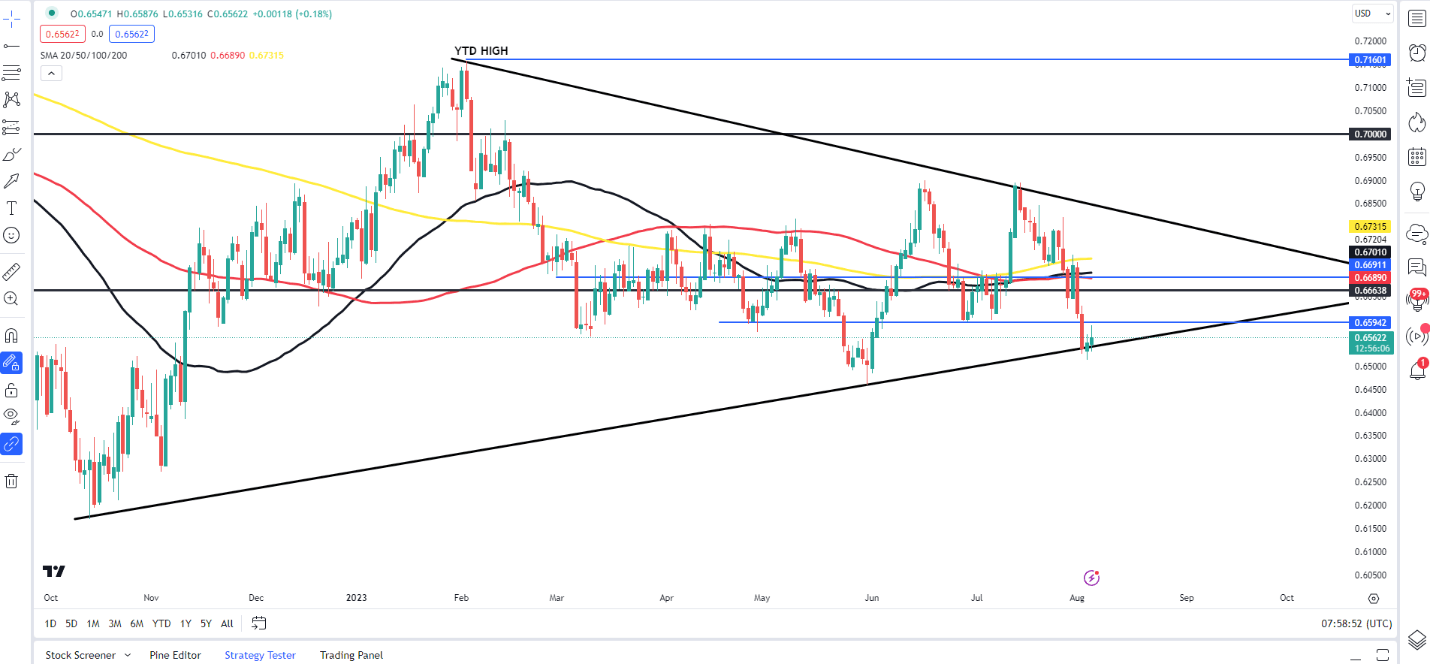
The technical outlook on AUDUSD testing the lower end of the symmetrical triangle pattern in play with a bounce from here needing to clear immediate resistance around 0.6600. A break above could bring a retest of the MAs with the 50, 100 and 200-day MAs all resting around the 0.6700 and could make a sustained recovery difficult.
Looking at IGCS IGCS shows retail traders are currently LONG on AUD/USD, with 83% of traders currently holding LONG positions. At DailyFX we typically take a contrarian view to crowd sentiment, and the fact that traders are long suggests that AUD/USD may enjoy a short bounce before continuing lower toward the support area around 0.6450 (May Swing Low).
AUD/USD Daily Chart – August 4, 2023
British Pound Could Stage a Rebound: GBP/USD, EUR/GBP, GBP/JPY Price Setups After BOE
The British pound looks set to recoup some of its recent losses after the Bank of England (BOE) raised interest rates by 25 basis points to 5.25% and didn’t rule out further tightening.
The BOE stopped short of signaling that UK interest rates are peaking. “I don’t think it is time to declare it’s all over,” Governor Andrew Bailey said. The central bank Deputy Governor Ben Broadbent said keeping relatively high rates over an extended period was key for cutting inflation. Meanwhile, financial markets continue to expect BOE terminal rate at 5.75% given price pressures are moderating less than elsewhere.
With the central bank meeting out of the way, buy-the-rumor-sell-the-fact could push up GBP, which has declined in recent days – a possibility pointed out in the previous update. See “British Pound Toppish Ahead of BOE: GBP/USD, GBP/AUD, GBP/NZD Price Setups,” published August 1.
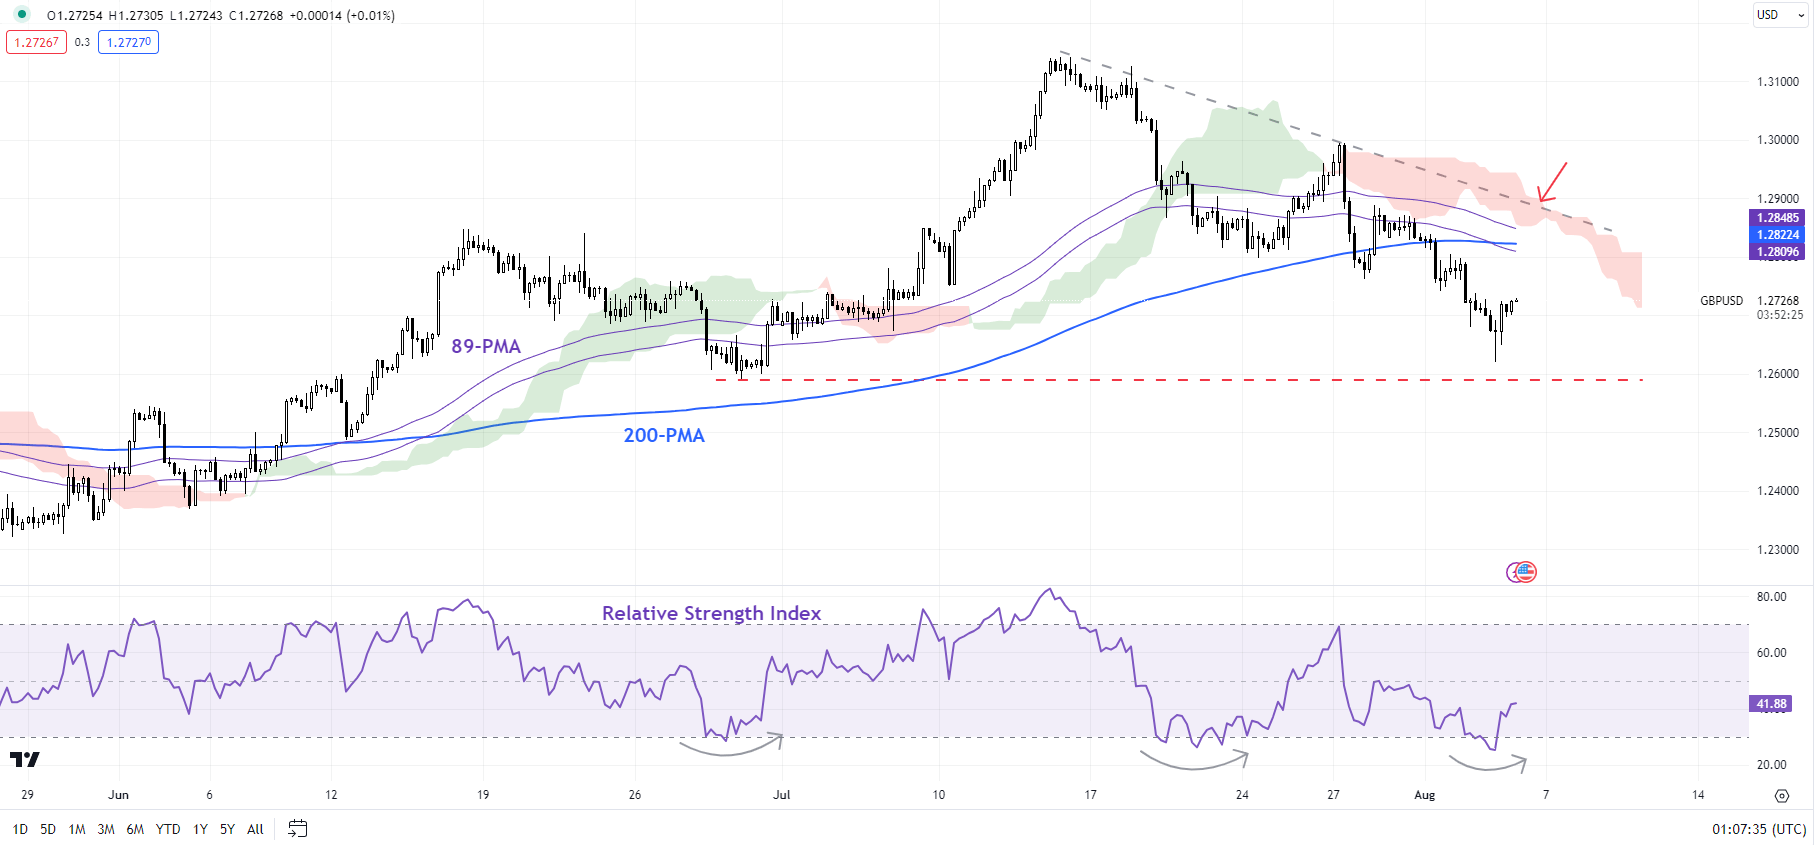
GBP/USD 240-minute Chart
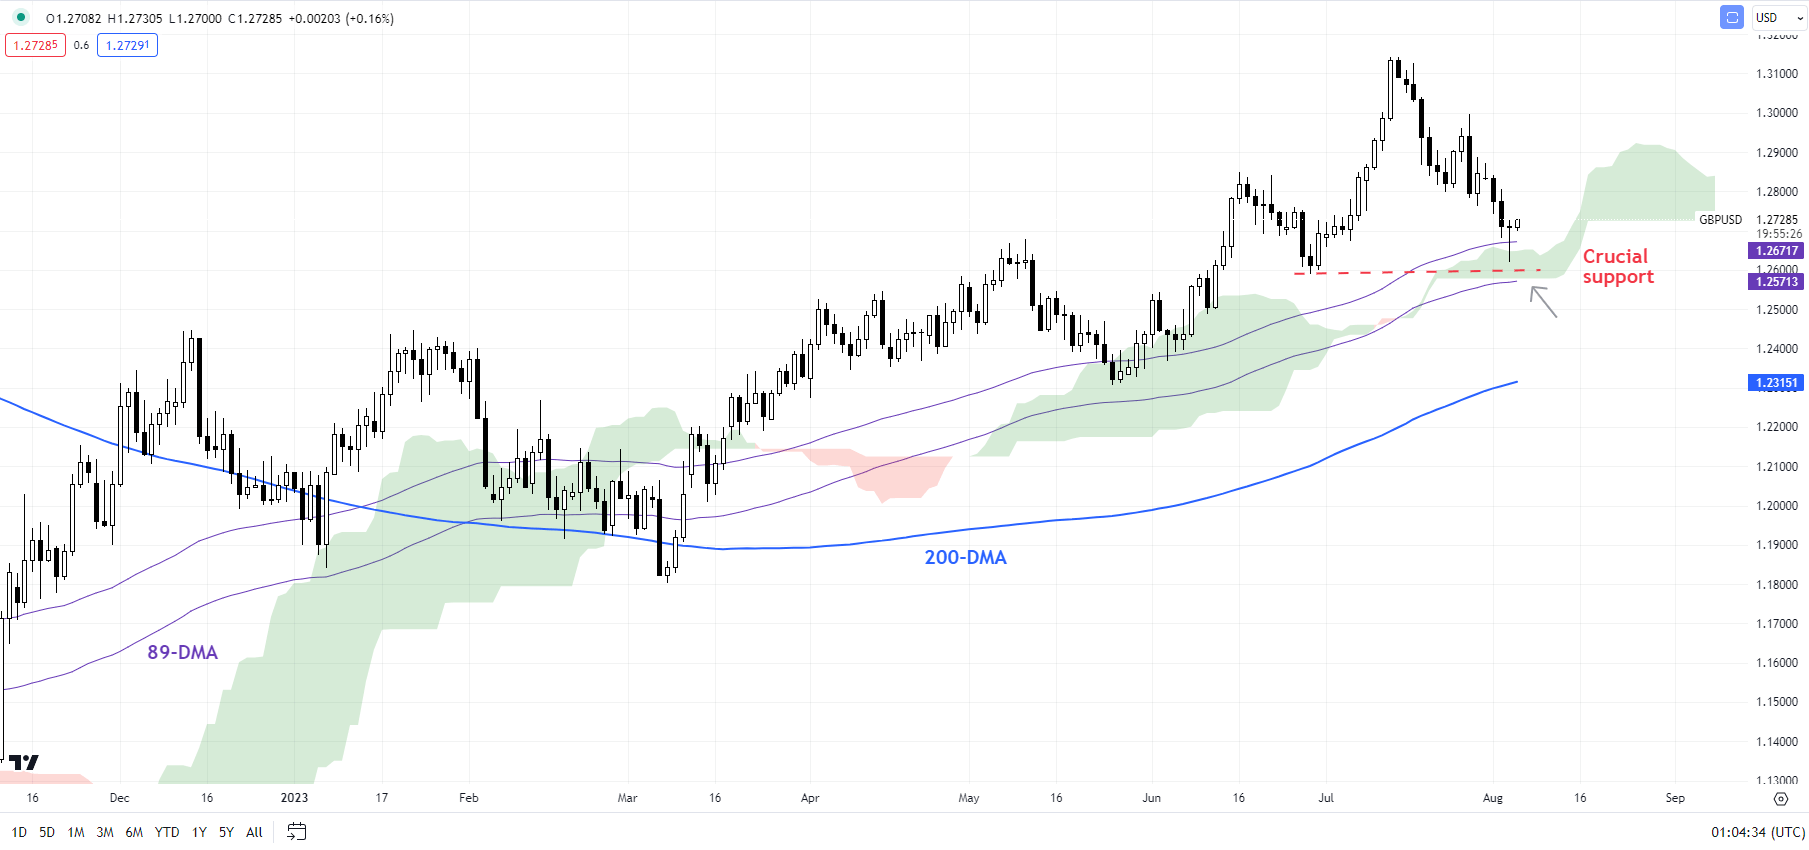
GBP/USD: Support could hold for now
GBP/USD is testing fairly strong support at the end-June low of 1.2600. The 14-period Relative Strength Index on the 4-hourly chart is around 30 – levels that have previously led to a rebound (see chart). The support also coincides with the 89-day moving average and the lower edge of the Ichimoku cloud on the daily charts.
GBP/USD Daily Chart
Any rebound could push cable toward a stiff resistance area around 1.2800-1.2900, including the 200-period moving average, and the 89-period moving average, roughly coinciding with a downtrend line from mid-July. For the immediate downward pressure to fade, GBP/USD needs to break above the crucial resistance area. In the absence of a break, the path of least resistance remains sideways to slightly down.
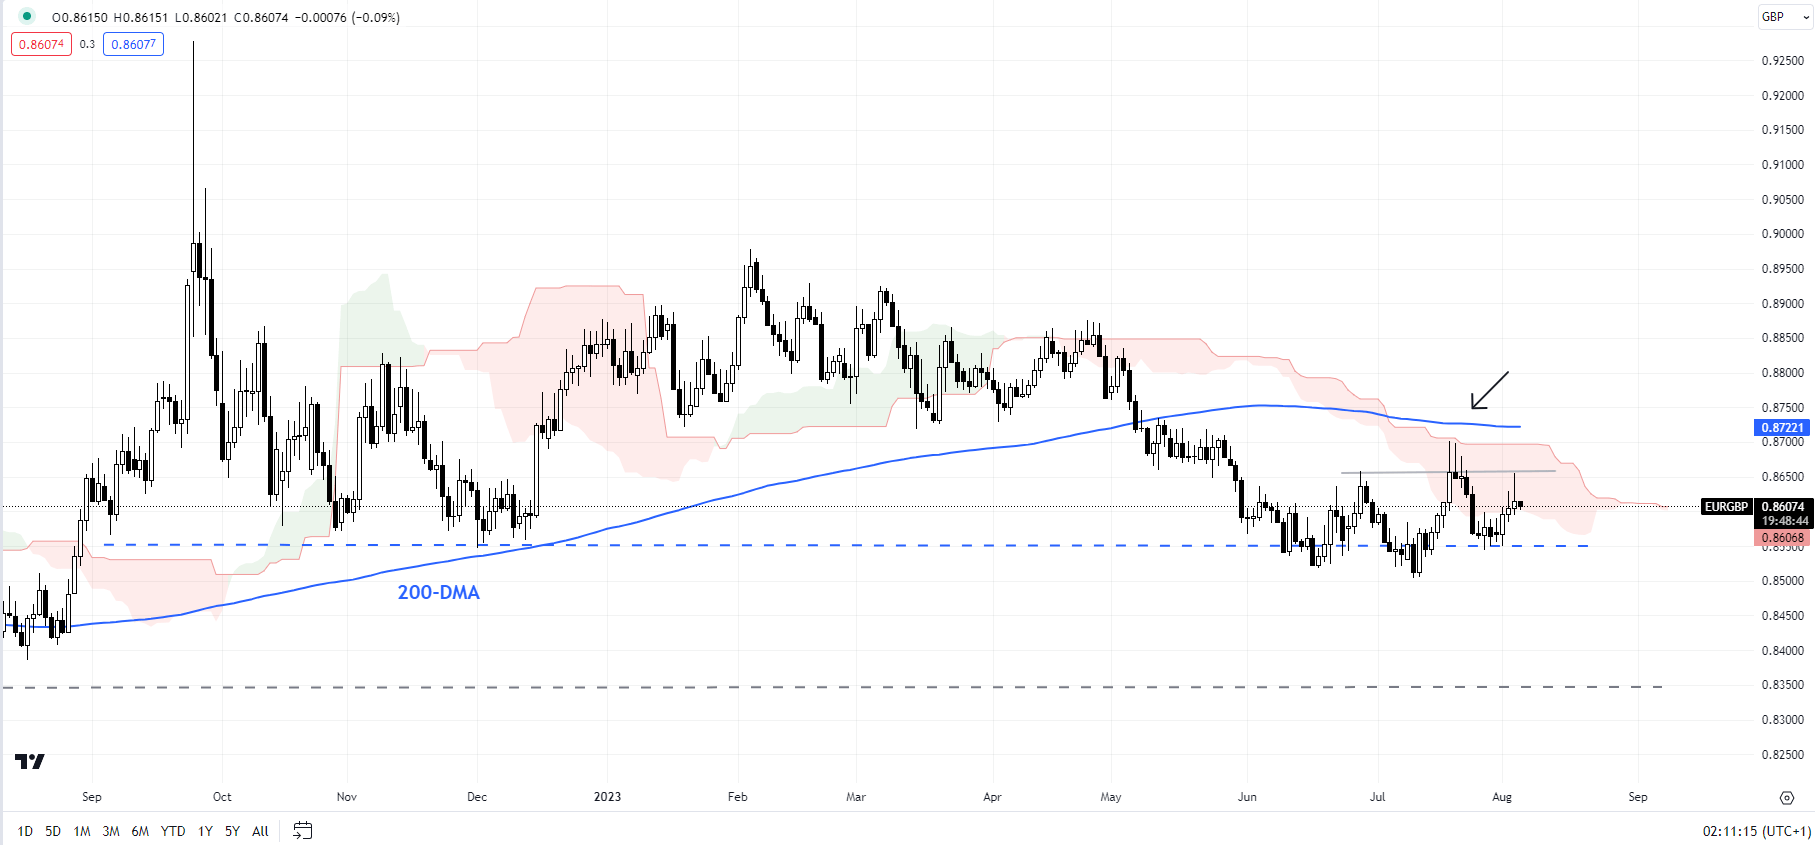
EUR/GBP Daily Chart
EUR/GBP: Rebound is running out of steam
The failure of EUR/GBP in recent days to clear past a tough ceiling around 0.8700-0.8725 raises the risk that the consolidation/minor rebound could be nearing an end. The resistance area includes the upper edge of the Ichimoku channel on the daily chart and the 200-day moving average. Any break below immediate support at the July low of 0.8500 could open the door toward 0.8350.
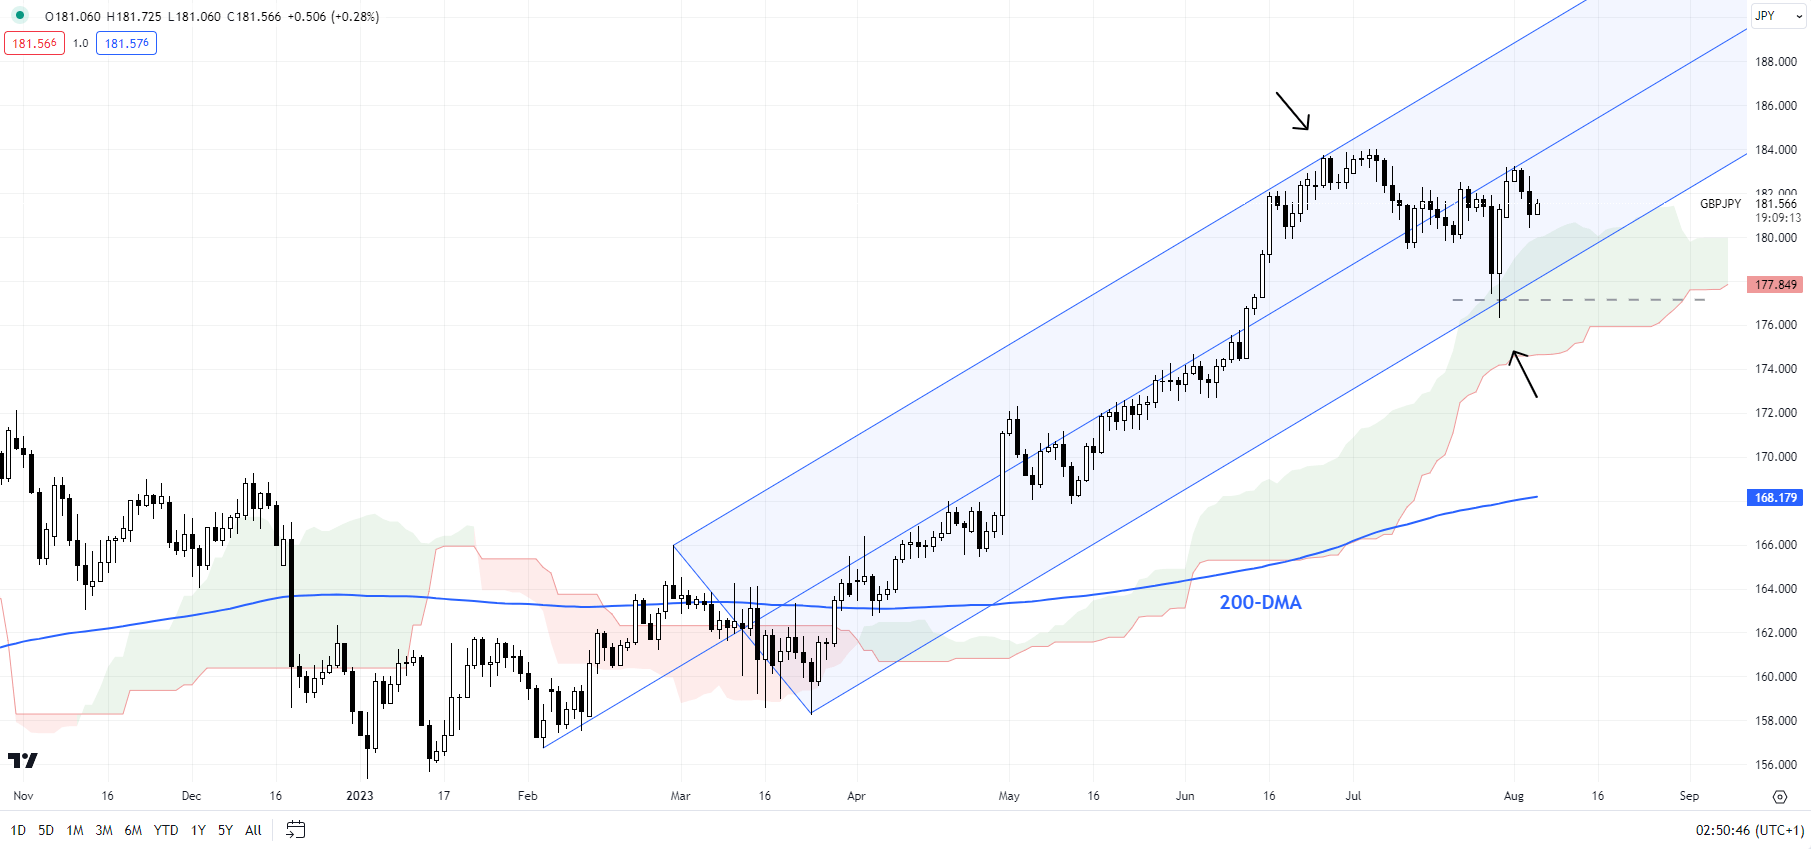
GBP/JPY Daily Chart
GBP/JPY: Well guided by the rising channel
GBP/JPY’s slide truncated around vital support on the lower edge of a rising pitchfork channel from early 2023, near the lower edge of the Ichimoku cloud on the daily charts. Still, the cross needs to break above the immediate barrier at the July high of 184.00 for the broader uptrend to resume. In the absence of such a break, the cross could settle in a range in the short term.
US Dollar Smile Theory: How Does Economic Resilience or Recession Drive USD?
A “floating” currency – or one that is influenced by the natural forces of the market – tends to have a positive relationship with its economy. In other words, if growth is expected to outperform and bolster inflation, causing the central bank to raise interest rates, that tends to boost the currency and vice versa. There are always exceptions, however, such as the US Dollar.
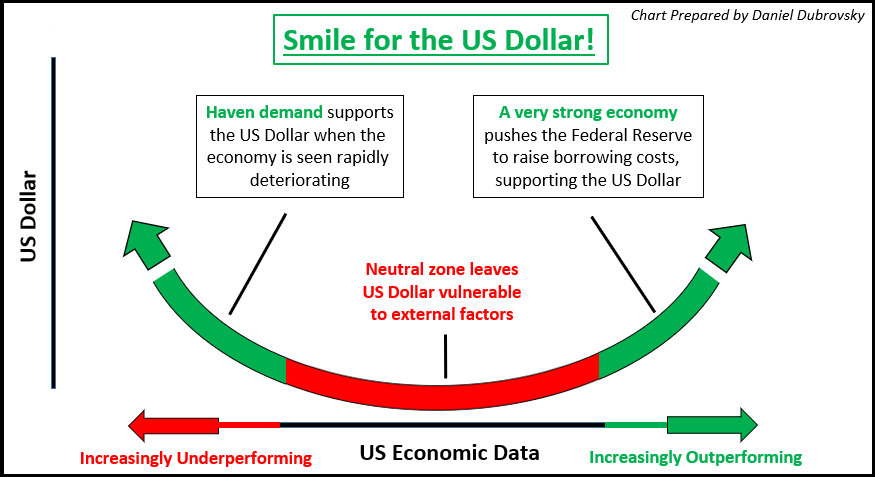
Have you ever heard of the “Dollar Smile Theory”? This is a concept that helps explain why the US Dollar tends to rise when the economy is not only strongly outperforming, but also when it is experiencing trouble, such as a recession. Everything in between these two extremes is where the currency often finds itself under pressure.
To understand why this relationship exists, you need to have a basic understanding of the US Dollar’s unique role in global financial markets. It is the global reserve currency. According to the Bank for International Settlements, in 2019 the USD was used in about 90% of global FX transactions. This means it is the world’s most liquid trading instrument.
The saying goes when the US sneezes, the world catches a cold. During times of economic stress, flight to safety means traders often need to liquidate market positions. Their go-to choice is often US Dollars, making it a haven-linked trading instrument. This influx of demand helps explain why the currency tends to rise during recessionary periods. Compared to a handful of assets, the US Dollar tends to do the best during the onset of recessions in the United States.
The chart below visualizes the “Dollar Smile Theory”. But, how can you use this information to your advantage? Well, the purpose of this article is to quantify the concept and show you how this relationship works in the real world. I will be looking at the dollar’s interaction with the following economic data: gross domestic product (GDP), the unemployment rate, ISM manufacturing PMI, and vehicle sales. By the end of the article, hopefully, you can walk away with a better understanding of USD.
US Dollar Smile Theory
Setting Some Ground Rules
Before diving into economic data, let us set some ground rules. The first is that all the data is quarterly since 1976 expressed in year-over-year terms. The second is that for each economic indicator, I have removed extreme outliers (beyond +- 3 standard deviations from the average). What is left behind is underlying data matching an underlying US Dollar.
This helps increase the statistical significance and reduce variability. Also, for the most part, each economic indicator will have outliers removed from different quarters. Finally, I will be using the Bloomberg Correlation-Weighted US Dollar Index (BCWI). This is because I want to capture the general movement in the currency as opposed to a given exchange rate.
Testing Gross Domestic Product (GDP)
Can you spot the “U-shaped” relationship between GDP (or economic growth) and the US Dollar below? That is the smile theory put into action with real economic data. The curve can be broken down into two green zones on the left and right (where USD is expected to be positive for given values of GDP), and a red zone (where the currency is anticipated to weaken). Somewhere between 1.5% – 4.0% GDP (Y/Y) is the “damage” zone for USD, or when the currency is seen falling compared to a year ago. Values of growth outside of this range show USD rising on average.
It should be noted that there is a plethora of factors that can impact how the USD performs in a quarter compared to a year ago. That is why sometimes you will see the dollar doing well around the “red zone” of GDP and poorly in the “green zone”. The purpose of this study is to focus on just the economic indicator alone, highlighting a non-linear relationship with the US Dollar.
GDP YoY Quarterly Since 1976 (Outliers Removed)
Testing the Unemployment Rate
What about the unemployment rate? Like GDP, there is also a “U-shape” relationship with the US Dollar. The tricky thing here is that you need to think about unemployment in reverse terms compared to GDP. When the unemployment rate is rising, that is not good for an economy and vice versa.
In this data, it seems the “danger” zone for the US Dollar is when the unemployment rate is seen performing somewhere between -5% and +25% (Y/Y). When this economic indicator clocks in outside of this range, the US Dollar has historically tended to rise against its major counterparts.
Unemployment Rate YoY Quarterly Since 1976 (Outliers Removed)
Testing ISM Manufacturing PMI
Now let us look at ISM Manufacturing PMI to gauge the impact of activity in the industrial sector on the currency. Here too you can find a “U-shaped” relationship. It seems that the “danger” zone for the US Dollar is when this indicator performs -5% to +30% (Y/Y). Outcomes outside of this range seem to open the door for the US Dollar to outperform.
ISM Manufacturing PMI YoY Quarterly Since 1976 (Outliers Removed)
Testing Vehicle Sales
Finally, I will wrap this up with the total number of new vehicle sales, expressed in year-over-year terms. Just like GDP, the unemployment rate and ISM manufacturing PMI, you can also see a “U-shaped” relationship with the US Dollar. The “danger” zone for the currency seems to occur when vehicle sales report between -7.5% and +7.5%. Meanwhile, the US Dollar on average tends to appreciate when outcomes are outside of this zone.
Vehicle Sales YoY Quarterly Since 1976 (Outliers Removed)
Conclusion
With that in mind, hopefully, you have a better idea of what the US Dollar Smile Theory is and how it works in real life. The key takeaway is that the currency tends to appreciate handsomely when economic data greatly outperforms and significantly underperforms, such as during recessions. Somewhere in-between these extreme outcomes are where the currency tends to weaken, and I tried to quantify that for you. If you have enjoyed this special report, feel free to follow me on Twitter for ongoing updates!

How to Trade Forex News: An Introduction
Major economic data has the potential to drastically move the forex market. It is this very movement, or volatility, that most newer traders seek when learning how to trade forex news. This article covers the major news releases, when they occur, and presents the various ways traders can trade the news.
Why Trade the News on Forex?
Traders are drawn to forex news trading for different reasons but the biggest reason is volatility. Simply put, forex traders are drawn to news releases for their ability to move forex markets. ‘News’ refers to economic data releases such as GDP and inflation, and forex traders tend to monitor such releases considered to be of ‘high importance’.
The largest moves tend to follow a ‘surprise’ in the data – where the actual data contrasts what was expected by the market – the good news here is that you don’t have to hold a PhD in Economics because our economic calendar already provides economist expectations.
Furthermore, news releases are set at pre-determined dates and times allowing traders enough time to prepare a solid strategy.
Traders that can effectively manage the risks of volatility, at the predetermined time of the news release, are well on their way to becoming consistent traders.
The Impact of Major News Releases on the Forex market
Just before a major news release, it is common to witness lower trading volumes, lower liquidity and higher spreads, often resulting in big jumps in price. This is because large liquidity providers, much like retail traders, do not know the outcome of news events prior to their release and look to offset some of this risk by widening spreads.
While large price movements can make trading major news releases exciting, it can also be risky. Due to the lack of liquidity, traders could experience erratic pricing. Such erratic pricing has the potential to cause a huge spike in price that shoots through a stop loss in the blink of an eye, resulting in slippage.
Additionally, the wider spread could place traders on margin call if there isn’t enough free margin to accommodate this. These realities surrounding major news releases could result in a short trading career if not managed properly through prudent money management such as incorporating stop losses or guaranteed stop losses (where available).
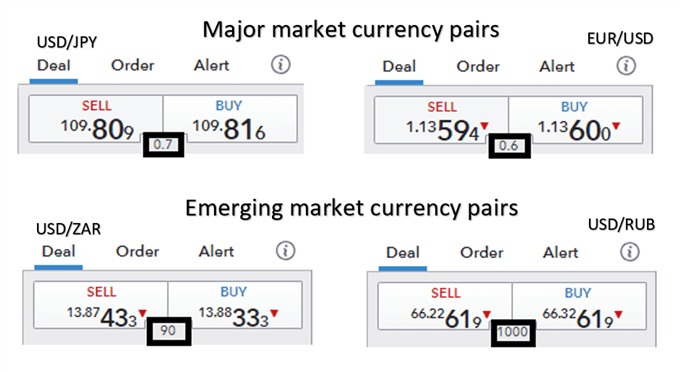
In general, major currency pairs will have lower spreads than the less traded emerging market currencies and minor currency pairs. Therefore, traders may look to trade the majors EUR/USD, USD/JPY, GBP/USD, AUD/USD and USD/CAD to mention a few.
Traders need to be well prepared ahead of time – with a clear idea of what events they want to trade and when they occur. It’s also important to have a solid trading plan in place.
“Don’t think about what the market’s going to do; you have absolutely no control over that. Think about what you’re going to do if it gets there. In particular, you should spend no time at all thinking about those rosy scenarios in which the market goes your way, since in those situations, there’s nothing more for you to do. Focus instead on those things you want least to happen and on what your response will be.” – William Eckhardt
Which Major Forex News Releases to Trade?
When learning how to trade news, traders must be aware of the major news events that affect the forex market, that can be monitored closely using an economic calendar.
US economic data is so influential within global currency markets that it is generally seen as the most important news. It is important to note that not all news releases lead to increased volatility. Rather, there are a limited number of major news releases that have previously produced the greatest potential to move the market.
The table below summarizes the major US economic releases alongside some of the most important non-US data releases from around the world.
BTC at Risk of Sub-$28,000 as Spot ETF Chatter Goes Silent
On Thursday, bitcoin (BTC) rose by 0.19%. Partially reversing a 1.80% slide from Wednesday, BTC ended the day at $29,315.
Bitcoin (BTC) Price Action
This morning, BTC was down 0.20% to $29,255. A range-bound start to the day saw BTC rise to an early high of $29,362 before falling to a low of $29,255.
Trading Derivatives carries a high level of risk to your capital and you should only trade with money you can afford to lose. Trading Derivatives may not be suitable for all investors, so please ensure that you fully understand the risks involved, and seek independent advice if necessary. A Product Disclosure Statement (PDS) can be obtained either from this website or on request from our offices and should be considered before entering into a transaction with us. Raw Spread accounts offer spreads from 0.0 pips with a commission charge of USD $3.50 per 100k traded. Standard account offer spreads from 1 pips with no additional commission charges. Spreads on CFD indices start at 0.4 points. The information on this site is not directed at residents in any country or jurisdiction where such distribution or use would be contrary to local law or regulation.
Daily Chart
The Daily Chart showed BTC/USD sitting below the $30,750 – $31,250 resistance band. BTC also sat below the 50-day EMA ($29,439) while holding above the 200-day EMA ($27,120), sending bearish near-term but bullish longer-term price signals. Notably, the 50-day EMA narrowed to the 200-day EMA, signaling further losses.
Looking at the 14-Daily RSI, the 43.79 reading reflects bearish sentiment. The RSI aligns with the 50-day EMA, supporting a return to sub-$28,500. However, a move through the 50-day EMA ($29,439) would give the bulls a run at the $30,750 – $31,250 resistance band.

4-Hourly Chart
Looking at the 4-Hourly Chart, BTC remains below the $30,750 – $31,250 resistance band. BTC sits below the 50-day ($29,409) and 200-day ($29,624) EMAs, sending bearish near and longer-term price signals.
Significantly, the 50-day EMA pulled back from the 200-day EMA, supporting further losses. However, a BTC move through the 50-day ($29,409) and 200-day ($29,624) EMAs would give the bulls a run at the $30,750 – $31,250 resistance band.
The 14-4H RSI reading of 47.18 indicates a bearish stance, with selling pressure outweighing buying pressure. Significantly, the RSI aligns with the EMAs, signaling a return to sub-$28,500.

Government Bond Yields Send BTC to Sub-$29,000 Before Finding Support
It was a quiet Thursday session on the crypto news wires. The lack of a crypto event left rising government bond yields to test buyer appetite. The downgrade of the US sovereign rating to AA+ continued to resonate.
However, US corporate earnings and economic indicators provided modest support. After the US closing bell, Amazon.com (AMZN) and Apple (AAPL) beat earnings forecasts. US Nonfarm productivity and factory orders were also market-friendly. However, a weaker-than-expected ISM Non-Manufacturing PMI and uncertainty over the SEC and the future of the spot BTC ETF market capped the upside.
The Day Ahead
This afternoon, the US Jobs Report will move the dial. The markets are betting on a US soft landing and the Federal Reserve ending its monetary policy tightening cycle. A pickup in wage growth and a steady unemployment rate of 3.6% could fuel the expectation of a September Fed rate hike and raise the chances of a hard landing.
However, beyond the economic calendar, investors should continue to monitor the crypto news wires. SEC v Ripple and SEC v Terraform Lab chatter, ETF updates, and Binance and Coinbase (COIN)-related news will move the dial.
DAX Set for Another Testy Session with the US Jobs Report in Focus
It was a bearish Thursday for the DAX, which fell by 0.72%. Following a 1.36% fall on Wednesday, the DAX ended the day at 15,893. Significantly, the DAX ended the day at sub-16,000 for the first time since July 11.
Economic indicators from the euro area continued to weigh on investor sentiment. After the disappointing manufacturing PMI numbers, service sector PMIs added to the bearish mood. Trade data from Germany was also bearish despite a widening trade surplus.
Trading Derivatives carries a high level of risk to your capital and you should only trade with money you can afford to lose. Trading Derivatives may not be suitable for all investors, so please ensure that you fully understand the risks involved, and seek independent advice if necessary. A Product Disclosure Statement (PDS) can be obtained either from this website or on request from our offices and should be considered before entering into a transaction with us. Raw Spread accounts offer spreads from 0.0 pips with a commission charge of USD $3.50 per 100k traded. Standard account offer spreads from 1 pips with no additional commission charges. Spreads on CFD indices start at 0.4 points. The information on this site is not directed at residents in any country or jurisdiction where such distribution or use would be contrary to local law or regulation.
Later in the European session, US service sector activity slowed, raising more red flags.
The NASDAQ Composite Index slipped by 0.10%, with the Dow and the S&P 500 seeing losses of 0.19% and 0.25%, respectively. After the US closing bell, Amazon.com (AMZN) and Apple (AAPL) beat earnings forecasts.

Economic Indicators Sent Bearish Signals
It was a busy day on the European economic calendar, with German trade data and euro area services PMIs in focus. The numbers disappointed, with services PMIs taking a dip in July.
Going into the European session, trade data from Germany disappointed. While the trade surplus widened from 14.4 billion to €18.7 billion, a slide in imports and a modest rise in exports reflected the weak demand environment.
Service sector PMI numbers from the euro area added to the bearish sentiment. The German Services PMI fell from 54.1 to 52.3 in July, with the Eurozone Services PMI down from 52.0 to 50.9.
The numbers from the US also weighed, with the all-important ISM Non-Manufacturing PMI falling from 53.9 to 52.7 in July versus a forecasted 53.0. The sub-components drew interest. A fall in employment and an upswing in the price sub-components sent bearish signals. Significantly, the ISM Non-Manufacturing Prices sub-Index rose from 54.1 to 56.8.
The Market Movers
It was another mixed session for the auto sector. Both BMW and Continental AG saw losses of 2.17%. Porsche and Volkswagen fell by 0.76% and 0.18%, respectively, while Mercedes-Benz Group bucked the trend, rising by 0.15%.
However, it was a bullish session for the banks. Commerzbank and Deutsche Bank ended the day up 2.86% and 2.09%, respectively.
The Day Ahead for the DAX
This morning, German factory orders will set the tone. After dire manufacturing sector PMI numbers, a slide in factory orders would raise the bets on a euro area economic recession. Economists forecast factory orders to fall by 1.5% in June.
Eurozone retail sales figures will also draw interest in the early part of the European session. However, the US Jobs Report will have the final say. Economists are betting on a soft landing and the Federal Reserve ending its monetary policy tightening cycle. The Jobs Report will test the theory.
A pickup in wage growth and a steady unemployment rate of 3.6% could put the Fed hawks back in the driving seat.
DAX Technical Indicators
Looking at the EMAs and the 4-hourly chart, the EMAs sent bearish signals. The DAX sat below the 50-day (16,140) and 200-day (15,963) EMAs, sending bearish near and longer-term price signals.
Significantly, the 50-day EMA narrowed to the 200-day EMA, sending bearish price signals and supporting a DAX return to sub-15,750 to bring the 15,600 – 15,525 support band into play.
However, a DAX move through the 200-day EMA (15,963) and the lower level of the 16,000 – 16,080 resistance band would give the bulls a run at the 50-day EMA (16,140).
The 14-4H RSI sits at 31.46, signaling bearish sentiment, with selling pressure overweighing buying pressure. Significantly, the RSI aligns with the EMAs, supporting a return to sub-15,750 to bring the 15,600 – 15,525 support band into play.

USD to CAD Price Forecast: Steady Ahead of US, Canada Job Reports
Overview
As the world’s financial markets hold their breath, the USD to CAD pair trades almost flat. Investors and traders worldwide are eagerly awaiting the US Non-Farm Payrolls report, Canada’s Employment Change, and Unemployment Rate reports. A rollercoaster week for Treasury yields, which have touched their highest level since November 2022, has driven the USD/CAD pair’s bullish performance.
Treasury Yields Stir USD/CAD Fluctuations
Treasury yields have had a significant impact on the Forex pair’s fluctuations. The 10-year Treasury jumped 11 basis points to 4.185% while the yield on the 2-year Treasury climbed marginally higher at 4.881%. The shifts in Treasury yields come in response to traders digesting new economic data and contemplating Fitch’s recent U.S. downgrade.
Trading Derivatives carries a high level of risk to your capital and you should only trade with money you can afford to lose. Trading Derivatives may not be suitable for all investors, so please ensure that you fully understand the risks involved, and seek independent advice if necessary. A Product Disclosure Statement (PDS) can be obtained either from this website or on request from our offices and should be considered before entering into a transaction with us. Raw Spread accounts offer spreads from 0.0 pips with a commission charge of USD $3.50 per 100k traded. Standard account offer spreads from 1 pips with no additional commission charges. Spreads on CFD indices start at 0.4 points. The information on this site is not directed at residents in any country or jurisdiction where such distribution or use would be contrary to local law or regulation.
Fitch Downgrade Shakes USD/CAD Market
The downgrade, which saw the U.S. long-term foreign currency issuer default rating drop from AAA to AA+, was caused by “fiscal deterioration,” shaky governance standards, and mounting general debt. This news from Fitch Ratings shocked the markets earlier in the week and has since been a critical player in influencing investor sentiment.
Jobs Report Eyed Amidst Slowdown
Concurrently, traders are keenly observing the recent key economic data which portrays the labor market and economic health. The hope is that a slowdown in hourly earnings growth might convince the Federal Reserve that past interest rate hikes have achieved their goal. With economists predicting the addition of 200,000 nonfarm payrolls in July and a steady unemployment rate of 3.6%, all eyes are firmly fixed on the forthcoming jobs report.
BOC Hike Bolsters Loonie Forecasts
In contrast, the Bank of Canada (BOC) has adopted an aggressive approach towards inflation by raising its benchmark interest rate to a 22-year high of 5% last month. They also hinted at further possible tightening. Analysts have subsequently revised their forecasts upwards for the Canadian dollar, while the loonie is expected to strengthen about 2% to 1.31 per U.S. dollar in the next six months.
Anticipated Fed Shift Will Boost Canadian Dollar
Bets are now placed on the Federal Reserve concluding its interest rate hikes, followed by rate cuts expected in early 2024, with the USD forecasted to soften broadly over the next 12 months. This anticipated shift, along with a globally improving risk backdrop, is seen as favorable for Canada, given its status as a significant commodities exporter.
Forex Market Awaits BOC’s Next Move
In conclusion, while the Bank of Canada may mirror the Fed’s interest rates adjustments in 2024, the Canadian dollar’s support is expected to come from a generally softer USD and investor diversification away from USD-denominated assets. Amid this drama, the Forex market waits for the next move.
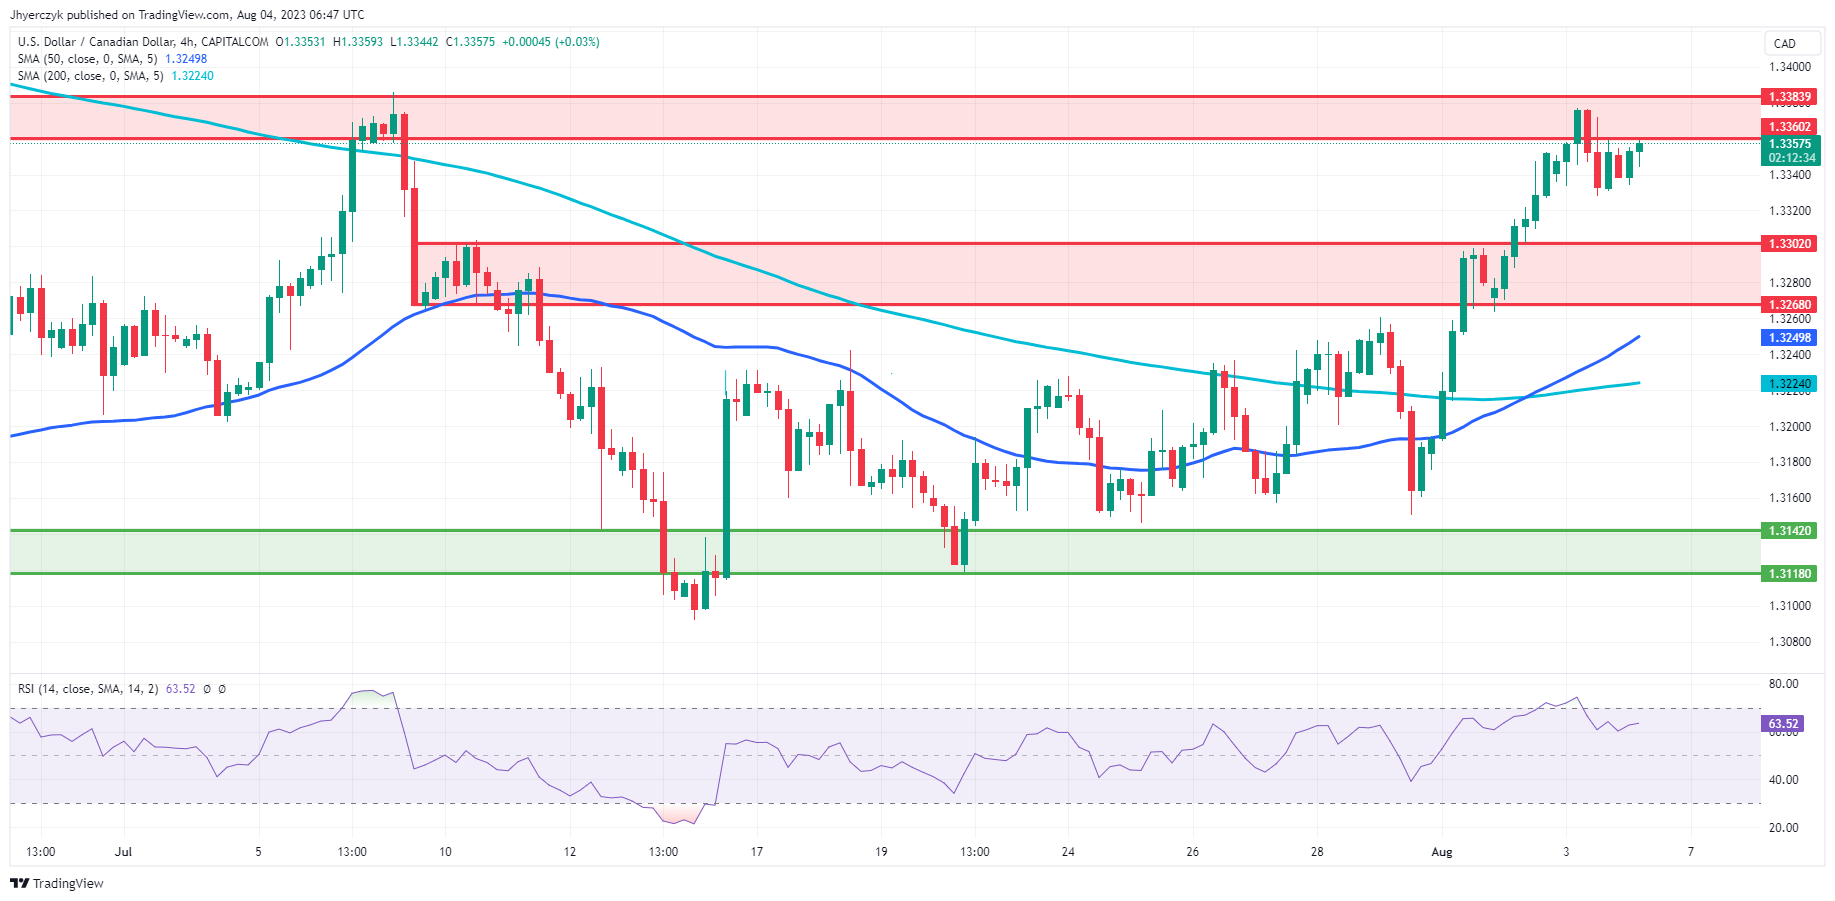
Technical Analysis

The pair is testing the main resistance zone. If broken, this could confirm the bullish bias. This analysis, however, should be continuously updated with new market information and developments because the USD to CAD is nearly overbought and ripe for a correction.