08166635848

Gold Price Forecast: XAU Traders Battling Fed Uncertainty Amid Strong Dollar

Gold Price Forecast: XAU Traders Battling Fed Uncertainty Amid Strong Dollar

Gold’s Uncertain Path

Gold (XAU) prices are on shaky ground as traders balance the impacts of U.S. labor market dynamics and looming inflation data on Federal Reserve’s policy trajectory. A softening dollar and easing bond yields have provided some respite for the yellow metal, but the road ahead remains uncertain.

The Current Market Stand: A Tug-of-War

As of 05:08 GMT, Gold (XAU) holds steady at $1,957.08 per ounce, rebounding slightly after plummeting to its lowest level since July 11. Meanwhile, U.S. December gold futures tread lower at $1,972.20. This market behavior comes on the heels of slowing U.S. job growth which caused a dip in both the dollar and bond yields, thereby inducing a technical closing price reversal for Gold on Friday.

Trading Derivatives carries a high level of risk to your capital and you should only trade with money you can afford to lose. Trading Derivatives may not be suitable for all investors, so please ensure that you fully understand the risks involved, and seek independent advice if necessary. A Product Disclosure Statement (PDS) can be obtained either from this website or on request from our offices and should be considered before entering into a transaction with us. Raw Spread accounts offer spreads from 0.0 pips with a commission charge of USD $3.50 per 100k traded. Standard account offer spreads from 1 pips with no additional commission charges. Spreads on CFD indices start at 0.4 points. The information on this site is not directed at residents in any country or jurisdiction where such distribution or use would be contrary to local law or regulation.

Deciphering Labor Market Signals: Fed’s Dilemma

Friday’s U.S. employment report showed a slower than anticipated job growth in July, suggesting a cooling labor market. The data strengthened speculations that the recent rate hike by the Fed could be the final leg in the current tightening cycle. However, solid wage gains and a falling unemployment rate hint at persistent labor market tightness, thus painting a mixed picture that leaves the Fed’s interest rate path wide open.

Inflation and Gold: An Intricate Dance

With the labor market sending mixed signals, all eyes are on the upcoming U.S. consumer prices (CPI) data due for release on Wednesday. It will be a key determinant in understanding if additional rate hikes are warranted to keep inflation in check. Gold, traditionally considered a safe bet against inflation, may lose its appeal should rates rise.

Gold’s Forecast: A Tenuous Balancing Act

Given the evolving economic landscape, the outlook for gold seems to hinge on further weakening of the U.S. dollar. While the post-jobs data conditions have brought some relief for gold, it might take a significantly softer dollar to give the yellow metal a solid boost. Until such a scenario unfolds, the gold market is likely to remain volatile and traders should tread with caution.

Technical Analysis

4-Hour Gold (XAU)Gold (XAU) is currently experiencing a bearish market sentiment, trading at $1936.90, marginally below the previous 4-hour price of $1938.90. The price is also trading beneath both the 200-4H and 50-4H moving averages, at $1940.90 and $1951.04 respectively, suggesting negative momentum.

The 14-4H Relative Strength Index (RSI) sits at 43.36, indicating slightly weak momentum, although it is not in the oversold territory.

Despite residing above the main support area between $1902.75 and $1914.00, the commodity has significant resistance to overcome at $1979.00 to $1987.53. In the short term, Gold’s price action is largely under the sway of bears.

Natural Gas Price Technical Forecast: Bearish Developments Brew on the 4-Hour Chart

Natural Gas Price Technical Forecast: Bearish Developments Brew on the 4-Hour Chart

Daily Chart

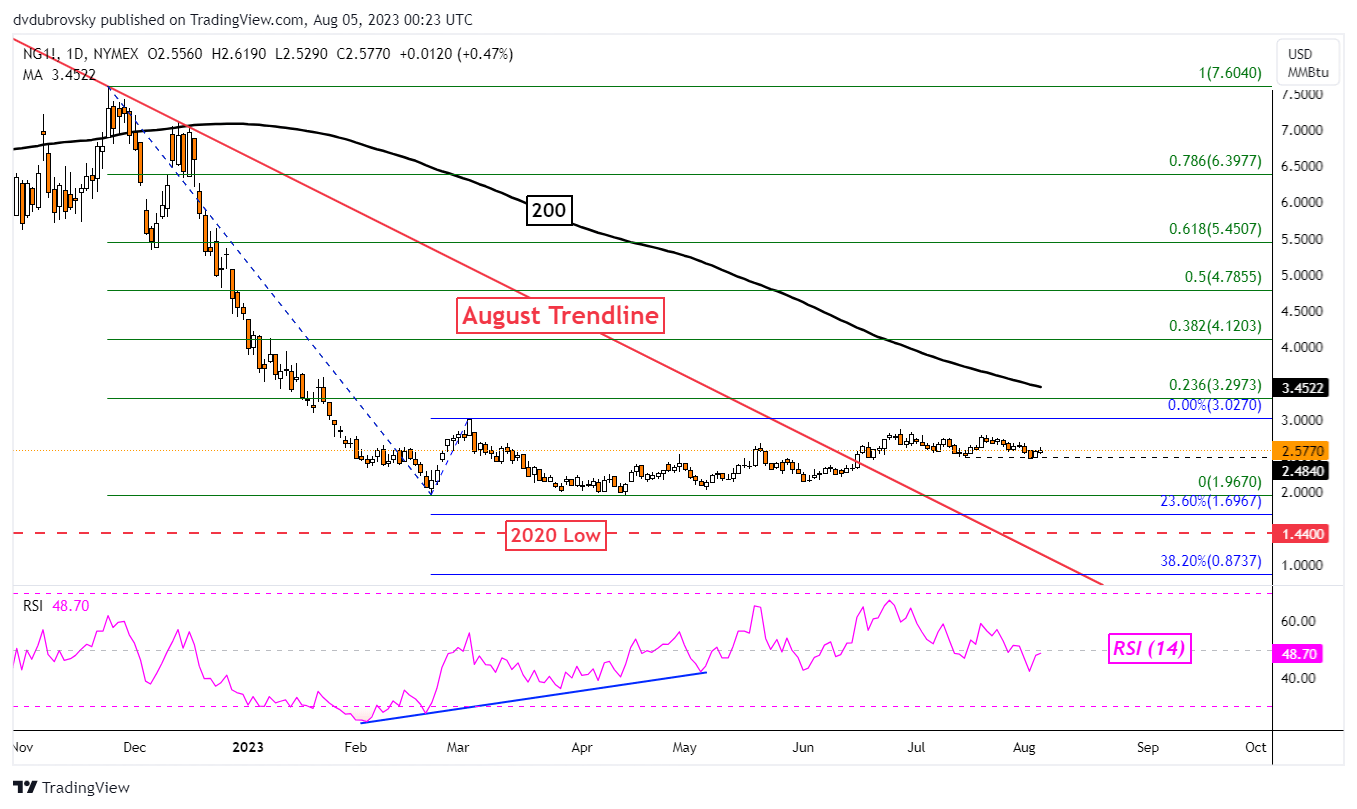
Natural gas prices cautiously weakened this past week. In total, the heating commodity is down about 2.3% over the past 2 weeks. That is the worst performance over this interval since early July. Still, despite the cautious decline, natural gas remains in a neutral price setting.

On the daily chart below, you can see that the heating commodity has struggled to make meaningful upside progress ever since clearing the falling trendline from August. In fact, since the beginning of this year, natural gas has been ranging between 3.027 and 1.967.

That said, because of the sideways price action, the 200-day Moving Average has been quickly nearing current price levels. It currently sits above the 23.6% Fibonacci retracement level at 3.297. Further range-bound price action could bring the MA closer to current levels, perhaps maintaining the downside focus.

image1.png

4-Hour Chart

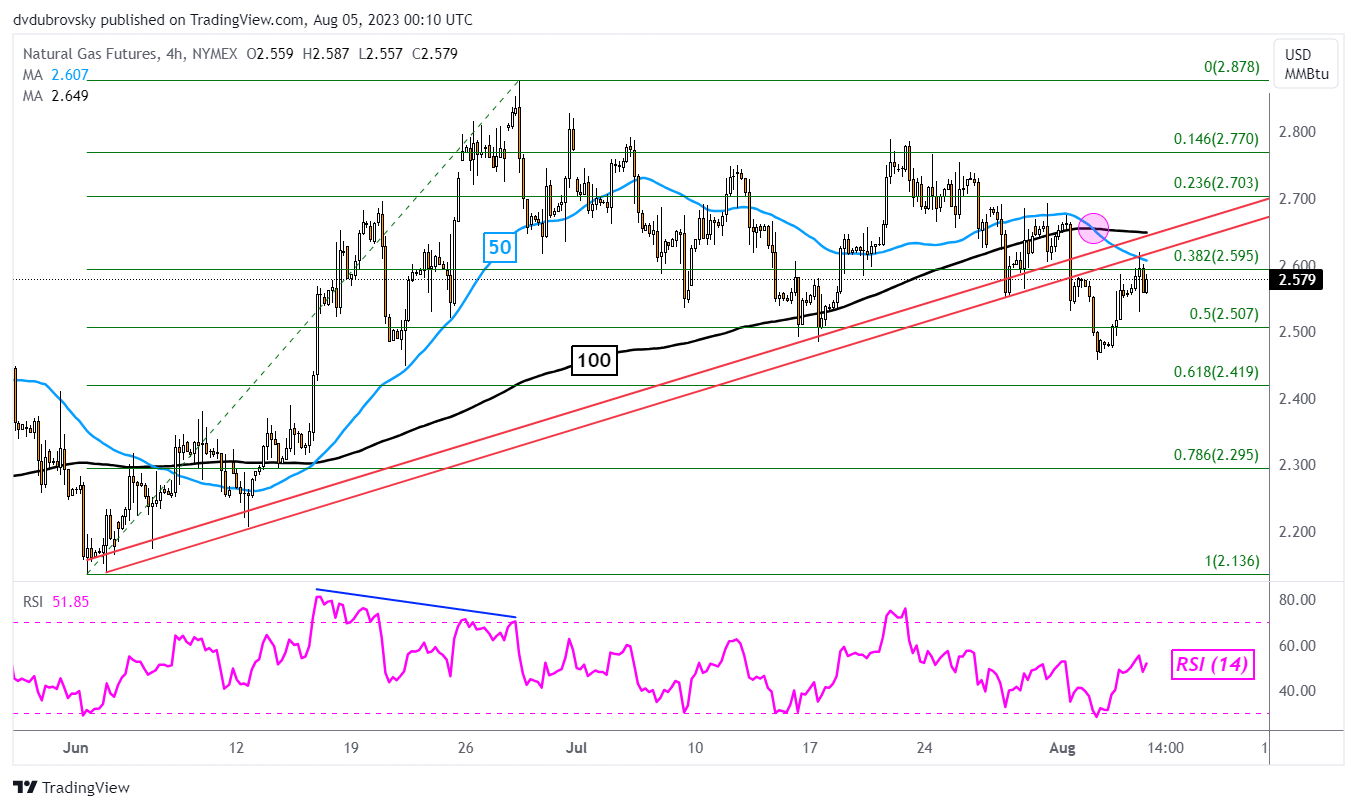
Zooming in on the 4-hour chart offers a more interesting development of price action. For starters, natural gas has confirmed a breakout under a rising zone of support from June. This past week, prices fell to the midpoint of the Fibonacci retracement level at 2.507 before bouncing back to rising support.

The latter held as new resistance, maintaining the integrity of the trendline breakout. Meanwhile, a bearish Death Cross has formed between the 50- and 100-period Moving averages. This is adding fuel to the near-term bearish perspective.

That said, a confirmatory breakout under 2.507 would underscore a bearish view considering price action on the daily setting. Further losses may open the door to a revisit of June lows.

image2.png


The CPI and Forex: How CPI Data Affects Currency Prices

The CPI and Forex: How CPI Data Affects Currency Prices

In this article, we’ll explore CPI and forex trading, looking at what traders should know about the Consumer Price Index to make informed decisions. We’ll cover what CPI is as a concept, the CPI release dates, how to interpret CPI, and what to consider when trading forex against CPI data.

What is CPI and why does it matter to forex traders?

The Consumer Price Index, better known by the acronym CPI, is an important economic indicator released on a regular basis by major economies to give a timely glimpse into current growth and inflation levels.

Inflation tracked through CPI looks specifically at purchasing power and the rise of prices of goods and services in an economy, which can be used to influence a nation’s monetary policy.

CPI is calculated by averaging price changes for each item in a predetermined basket of consumer goods, including food, energy, and also services such as medical care.

It is a useful indicator for forex traders due to its aforementioned effect on monetary policy and, in turn, interest rates, which have a direct impact on currency strength. The full utility of knowing how to interpret CPI as a forex trader will be explored below.

CPI release dates

CPI release dates usually occur every month, but in some countries, such as New Zealand and Australia, quarterly. Some nations also offer yearly results, such as Germany’s index. The US Bureau of Labor Statistics has reported the CPI monthly since 1913.

The following table shows a selection of major economies and information about their CPI releases.

Country/jurisdiction Compiling body Frequency of releases
Australia Australian Bureau of Statistics Quarterly
Canada Statistics Canada Monthly
China National Bureau of Statistics of China Monthly
Eurozone European Central Bank Twice monthly
Germany Federal Statistical Office of Germany Monthly, yearly
Italy Istat Monthly
India Ministry for Statistics and Programme Implementation Monthly
Japan Statistics Japan Monthly
UK Monetary Policy Committee Monthly
US US Bureau of Labor Statistics Monthly

Why forex traders should follow CPI data

Understanding CPI data is important to forex traders because it is a strong measure of inflation, which in turn has a significant influence on central bank monetary policy.

So how does CPI affect the economy? Often, higher inflation will translate to higher benchmark interest rates being set by policymakers, to help dampen the economy and subdue the inflationary trend. In turn, the higher a country’s interest rate, the more likely its currency will strengthen. Conversely, countries with lower interest rates often mean weaker currencies.

The release and revision of CPI figures can produce swings in a currency’s value against other currencies, meaning potentially favorable volatility from which skilled traders can benefit.

Also, CPI data is often recognized as a useful gauge of the effectiveness of the economic policy of governments in response to the condition of their domestic economy, a factor that forex traders can consider when assessing the likelihood of currency movements.

The CPI can also be used in conjunction with other indicators, such as the Producer Price Index, for forex traders to get a clearer picture of inflationary pressures.

What to consider when trading forex against CPI data

When using CPI data to influence forex trading decisions, traders should consider the market expectations for inflation and what is likely to happen to the currency if these expectations are met, or if they are missed.

Similar to any major release, it may be beneficial to avoid having an open position immediately before. Traders might consider waiting for several minutes after the release before looking for possible trades, since forex spreads could widen significantly right before and after the report.

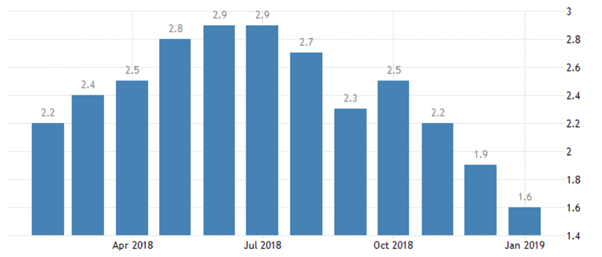
Below is a chart displaying the monthly inflation rates for the US. For the latest month, expectations are set at 1.6% inflation compared to last year’s data. If CPI is released higher or lower than expectations this news event does have the ability to influence the market.

Chart to show US inflation levels in 2018/19. Source: TradingEconomics.com. US Bureau of Labor Statistics

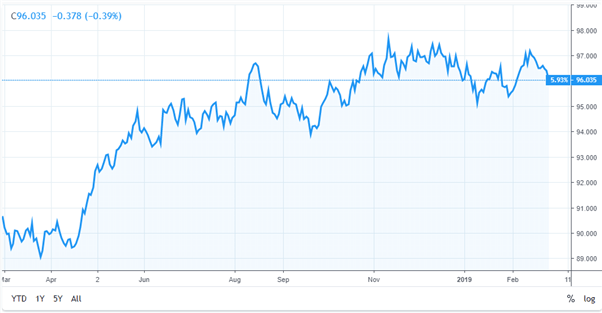
One way the effects of CPI data can be interpreted is by monitoring the US Dollar Index, a 2018/19 example chart for which is below. If CPI is released away from expectations, it is reasonable to believe this may be the catalyst to drive the Index to fresh highs, or to rebound from resistance.

Since the Index is comprised of EUR/USD, USD/JPY, and GBP/USD, by watching the US Dollar we can get a full interpretation of the events outcome.

Chart to show movement in the US Dollar Index. Source: TradingView.com

As can be observed in the example above, as inflation rose during the first half of 2018, the US Dollar Index went up accordingly. But with US inflation drifting lower in the following months and with a missed target of 2%, this pushed US interest rate hikes off the agenda. As a result, the dollar struggled and weakened against a basket of other currencies.

Not every fundamental news release works out through price as expected.

Once the CPI data has been released and analyzed, traders should then look to see if the market price is moving through or rebounding off any areas of technical importance. This will help traders understand the short-term strength of the move and/or the strength of technical support or resistance levels, and help them make more informed trading decisions.

Read more on CPI, inflation and forex

Make sure you bookmark our economic calendar to stay tuned in to the latest CPI data released by a range of countries, and stay abreast of all the DailyFX news and analysis updates. Also, reserve your place at our Central Bank Weekly webinar series to learn about news events, market reactions, and macro trends.

Asia Day Ahead: Asia on a Cautious Tone Following Wall Street’s Reversal: Nasdaq 100, USD/JPY, AUD/USD

Asia Day Ahead: Asia on a Cautious Tone Following Wall Street’s Reversal: Nasdaq 100, USD/JPY, AUD/USD

An initial move higher in Wall Street last Friday eventually faded into the close (DJIA -0.43%; S&P 500 -0.53%; Nasdaq -0.36%), as market participants took the opportunity for further profit-taking into the seasonally weaker month of August.

The focus was on the US July non-farm payroll report, which saw a miss in job addition for the second straight month (187,000 vs 200,000 consensus) but nevertheless, a downtick in unemployment rate (3.5% vs 3.6% consensus) and pull-ahead in wage growth (4.4% YoY vs 4.2% consensus) still denote signs of a tight labour market.

The data may support soft landing hopes, but persistent wage pressures seem to suggest keeping an eye on inflation risks ahead, alongside recent upmove in commodities prices over the past month. For now, market participants will want to see more evidence of inflation back on the rise to price for additional tightening, which will leave all eyes on the US Consumer Price Index (CPI) data this week.

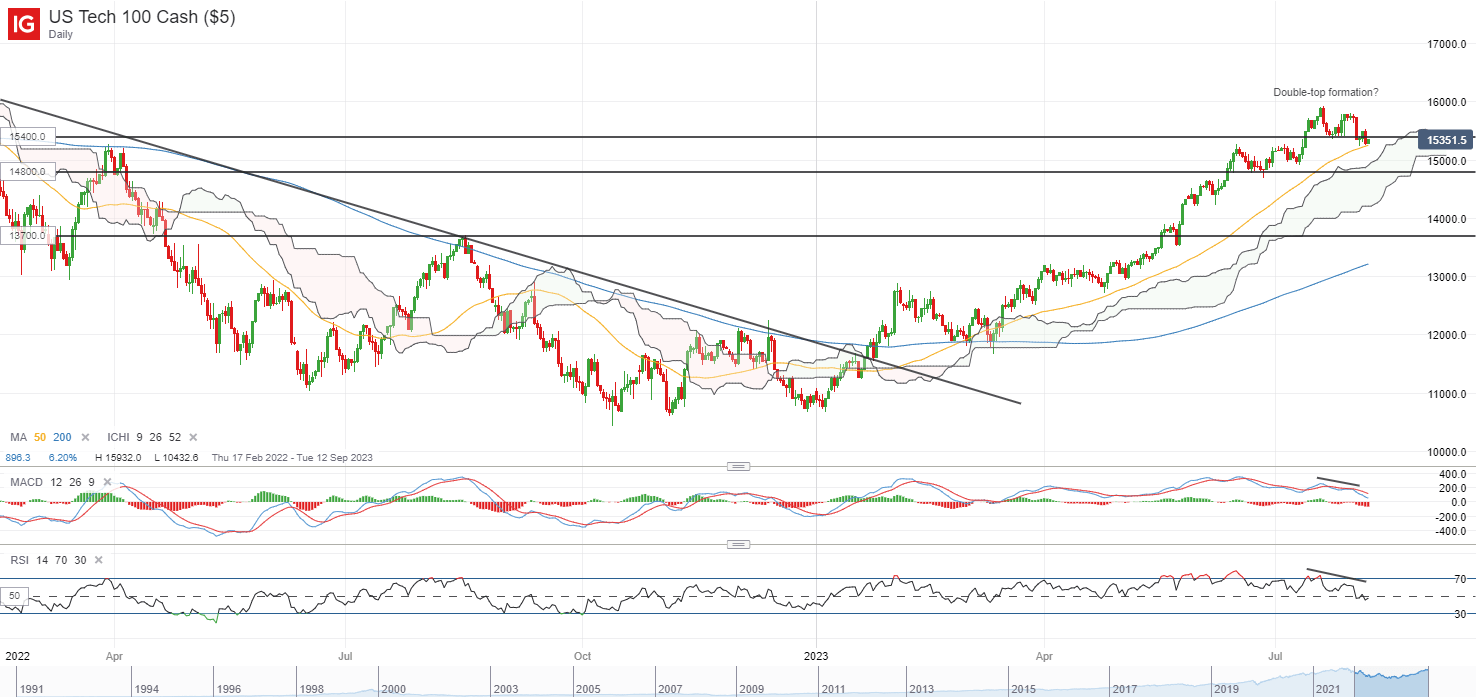
US Treasury yields reacted to the downside, which put the US dollar on a slight breather (-0.3%) following its recent rally. For the Nasdaq 100, the index continues to hover below its 15,400 level, which serves as a neckline for a near-term double-top formation. An attempt to reclaim the level last Friday was met with some resistance, which still denotes near-term exhaustion to its recent rally. Further downside may place the 14,800 level on watch next, where the upper edge of its Ichimoku cloud support stands.

image1.pngAsia Open

Asian stocks look set for a weak open, with Nikkei -0.67%, ASX -0.03% and KOSPI -0.06% at the time of writing, largely displaying a cautious tone following last Friday’s reversal on Wall Street. The release of the Bank of Japan (BoJ)’s summary of opinions this morning revealed wide consensus for its yield curve control policy to be more flexible, which saw some firming in the Japanese Yen upon its release.

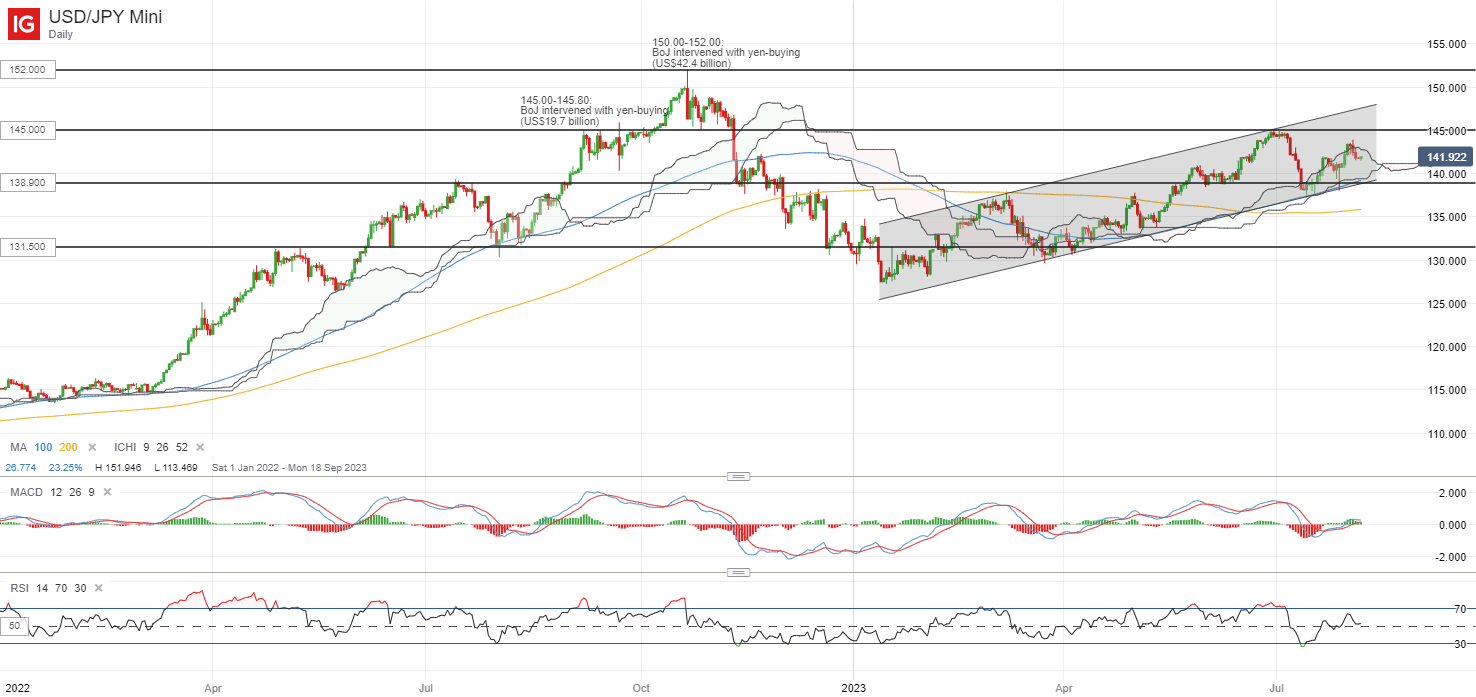
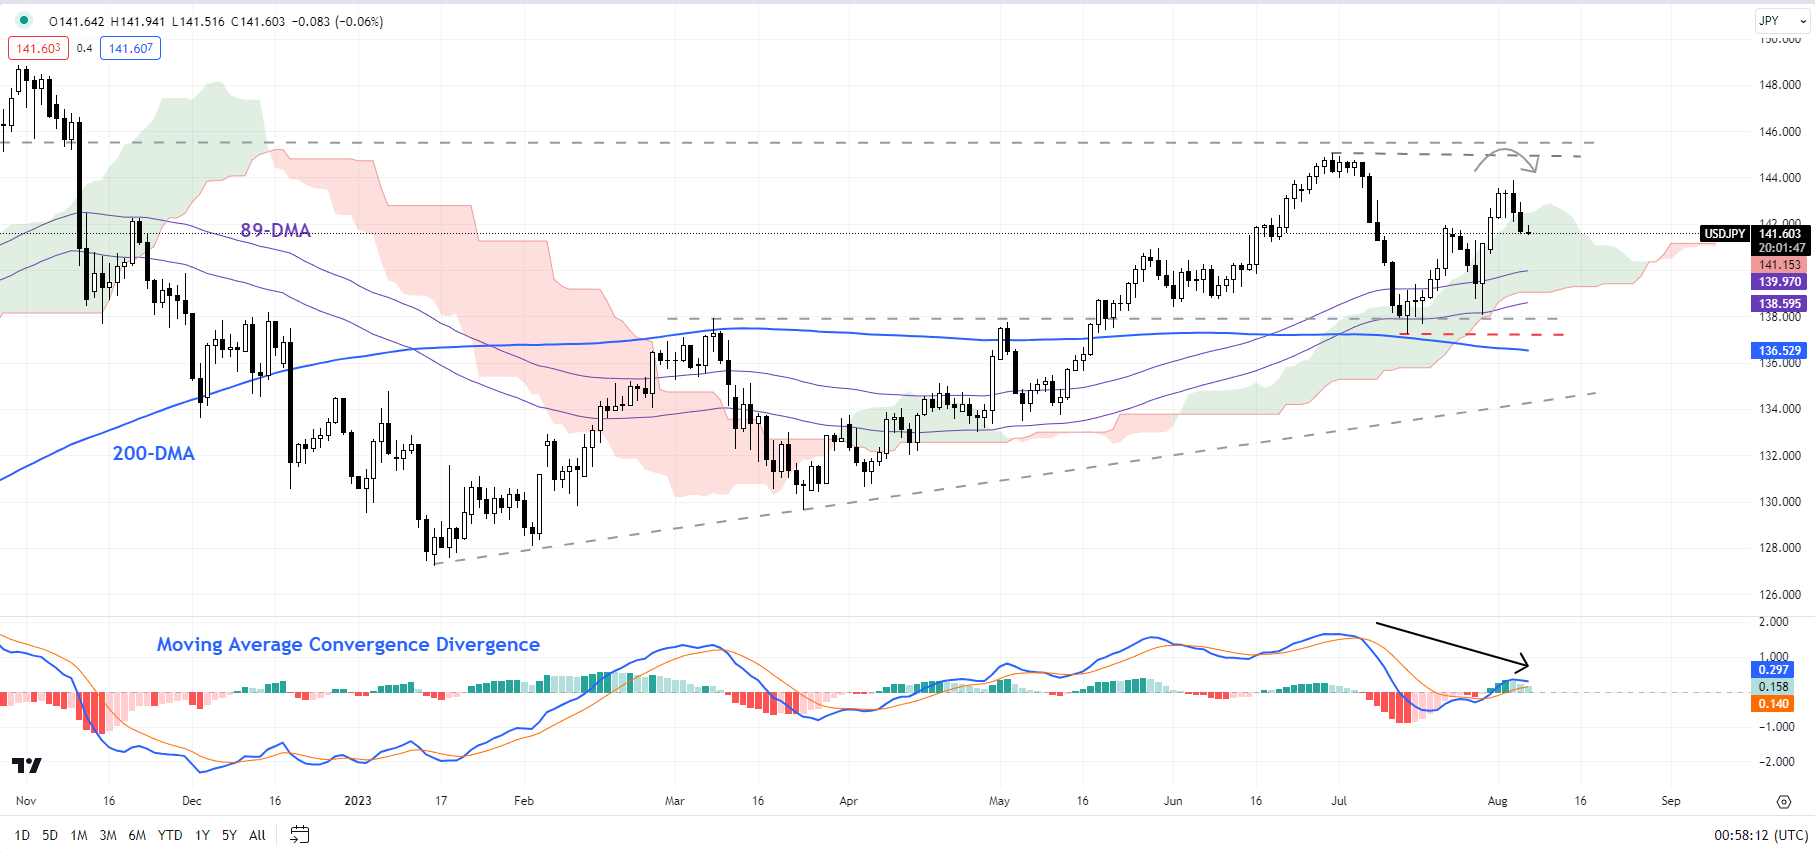
Nevertheless, the bias for the USD/JPY still seems to lean on the upside for now, having defended the lower trendline of its ascending channel pattern lately with a bullish pin bar formation. The 138.90 level could be a crucial support confluence to hold for the pair, where its 100-day moving average (MA) coincides with the lower channel trendline and the lower edge of its Ichimoku cloud support. For now, its relative strength index (RSI) continues to trend above the 50 level, which puts buyers in control.

The 145.00 will remain an immediate resistance to overcome ahead, having seen a sell-off in early-July this year from renewed speculations around currency intervention. Heading towards the 145.00-145.80 level, where previous intervention efforts were delivered back in September 2022, could potentially trigger some jawboning from authorities once more, which may reignite some resistance for the pair.

image2.pngOn the watchlist: AUD/USD moves below key support

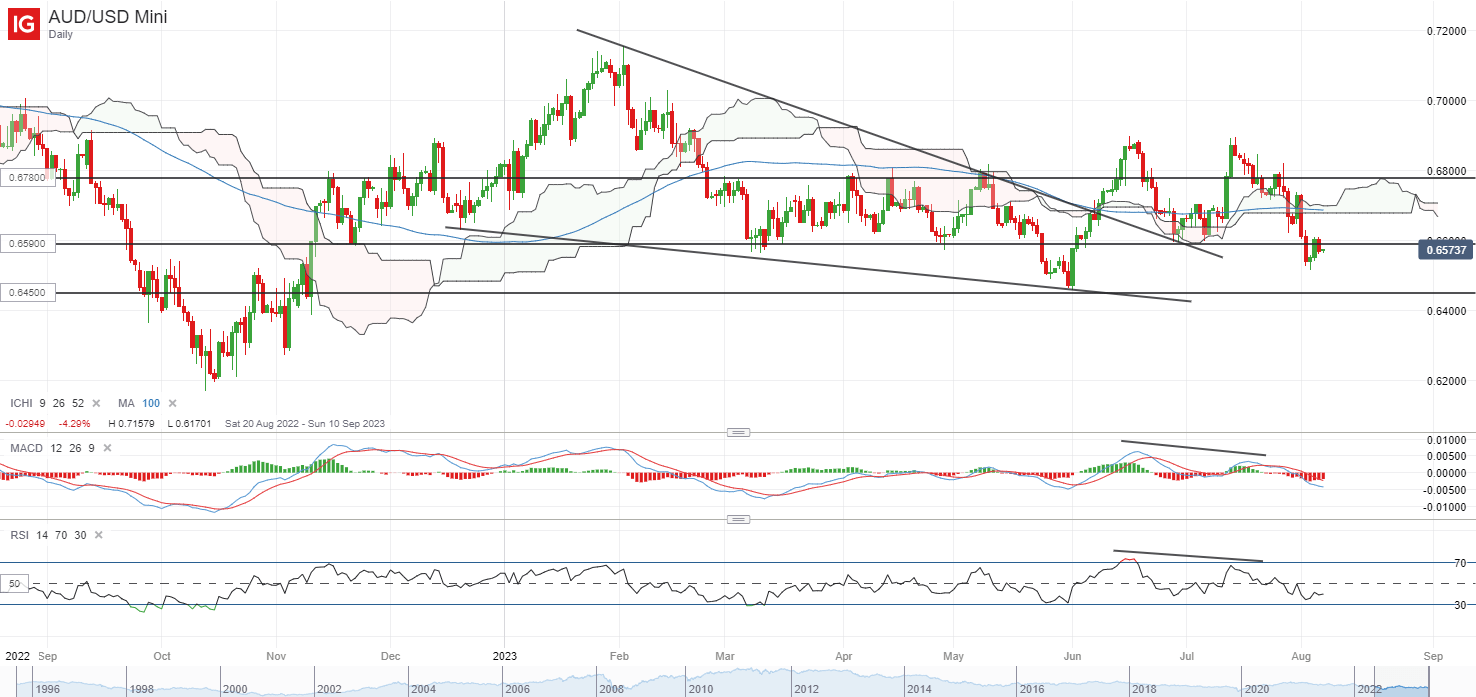
A rate hold from the Reserve Bank of Australia (RBA) last week, alongside a more subdued risk environment and mixed economic data out of China, have prompted the AUD/USD to fall below its horizontal support at the 0.659 level. This seems to point towards a breakdown of a near-term double-top formation, with a retest of the 0.659 level last Friday met with a bearish rejection.

Its moving average convergence/divergence (MACD) has crossed back below the zero mark, with its RSI sliding further below the 50 level, which seems to put sellers in control for now. Further downside may leave its year-to-date low at the 0.645 level on watch next, while on the other hand buyers may have to reclaim the 0.659 level to support a move back towards the 0.678 level.

image3.png

US Dollar Struggles to Hold Gains Ahead of CPI: EUR/USD, GBP/USD, USD/JPY Price Setups

US Dollar Struggles to Hold Gains Ahead of CPI: EUR/USD, GBP/USD, USD/JPY Price Setups

A mixed US jobs data released on Friday points to a limited upside in the US dollar ahead of the key US inflation data due on Wednesday.

The greenback fell quite sharply, nearly erasing all of the week’s gains after a not-so-bearish jobs report. Non-farm payrolls increased less than expected, the unemployment rate fell while average hourly earnings came in higher than expected. Granted the demand for jobs is slowing, but the labor market remains tight for now.

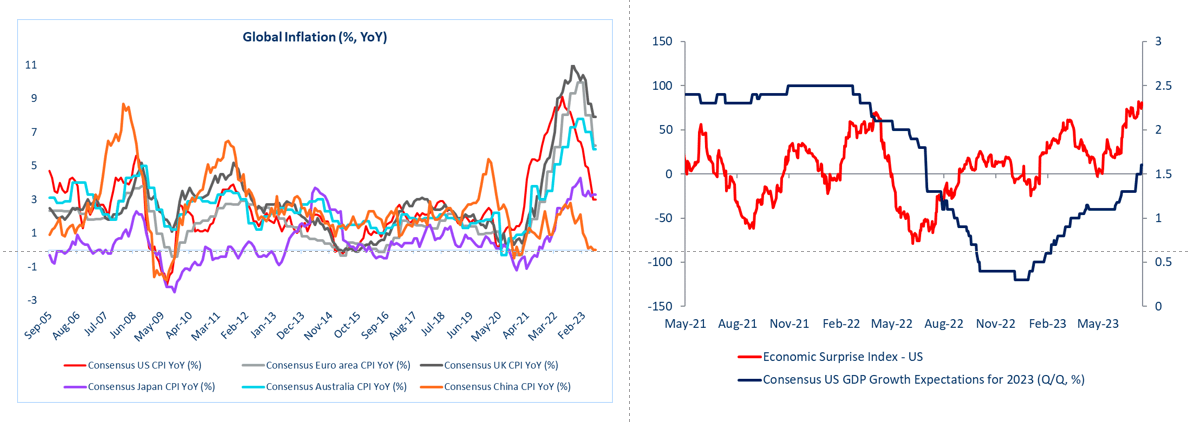
The market’s response to a rather mixed set of numbers is like the recent past – below-expected data has had an outsized response in USD, but upbeat data has failed to have a lasting impact. Despite the US Economic Surprise Index being at its highest since early 2021, the DXY Index (US dollar index) is around its year-to-date lows. For more discussion, see “Renewed Weakness in US Dollar: EUR/USD, GBP/USD, USD/JPY Price Setups,” published July 16.

Global Inflation and US Economic Surprise Index

Source Data: Bloomberg; Chart created in Microsoft Excel

The key focus is now on US CPI data due Wednesday. Core CPI is expected to have eased to 4.7% on-year in July from 4.8% previously. The next few weeks will be critical in determining whether the Fed and ECB hike again at their September meetings. US inflation has moderated faster than its peers, but economic growth expectations have been relatively resilient.

US Dollar Index (DXY) Weekly Chart

image1.png

DXY Index: Roadblock ahead

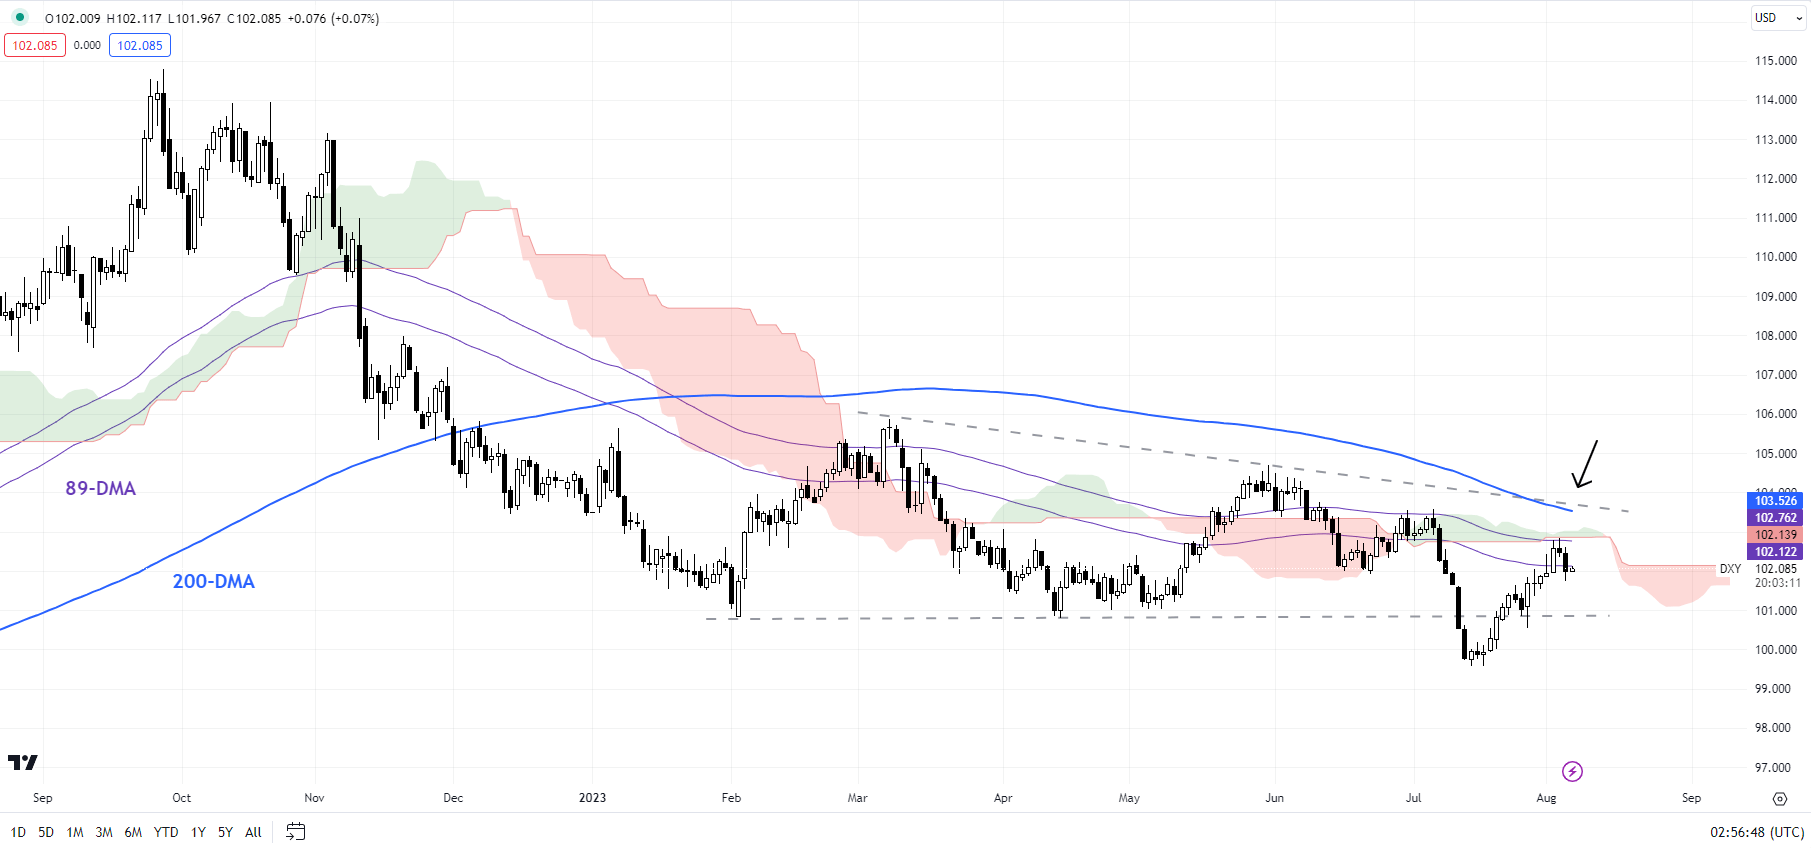
On technical charts, the US dollar index (DXY Index) posted a bearish evening star pattern on the daily candlestick charts toward the end of last week. The retreat came about from tough resistance on the 89-day moving average, slightly below the 200-day moving average.

DXY Index Daily Chart

image2.png

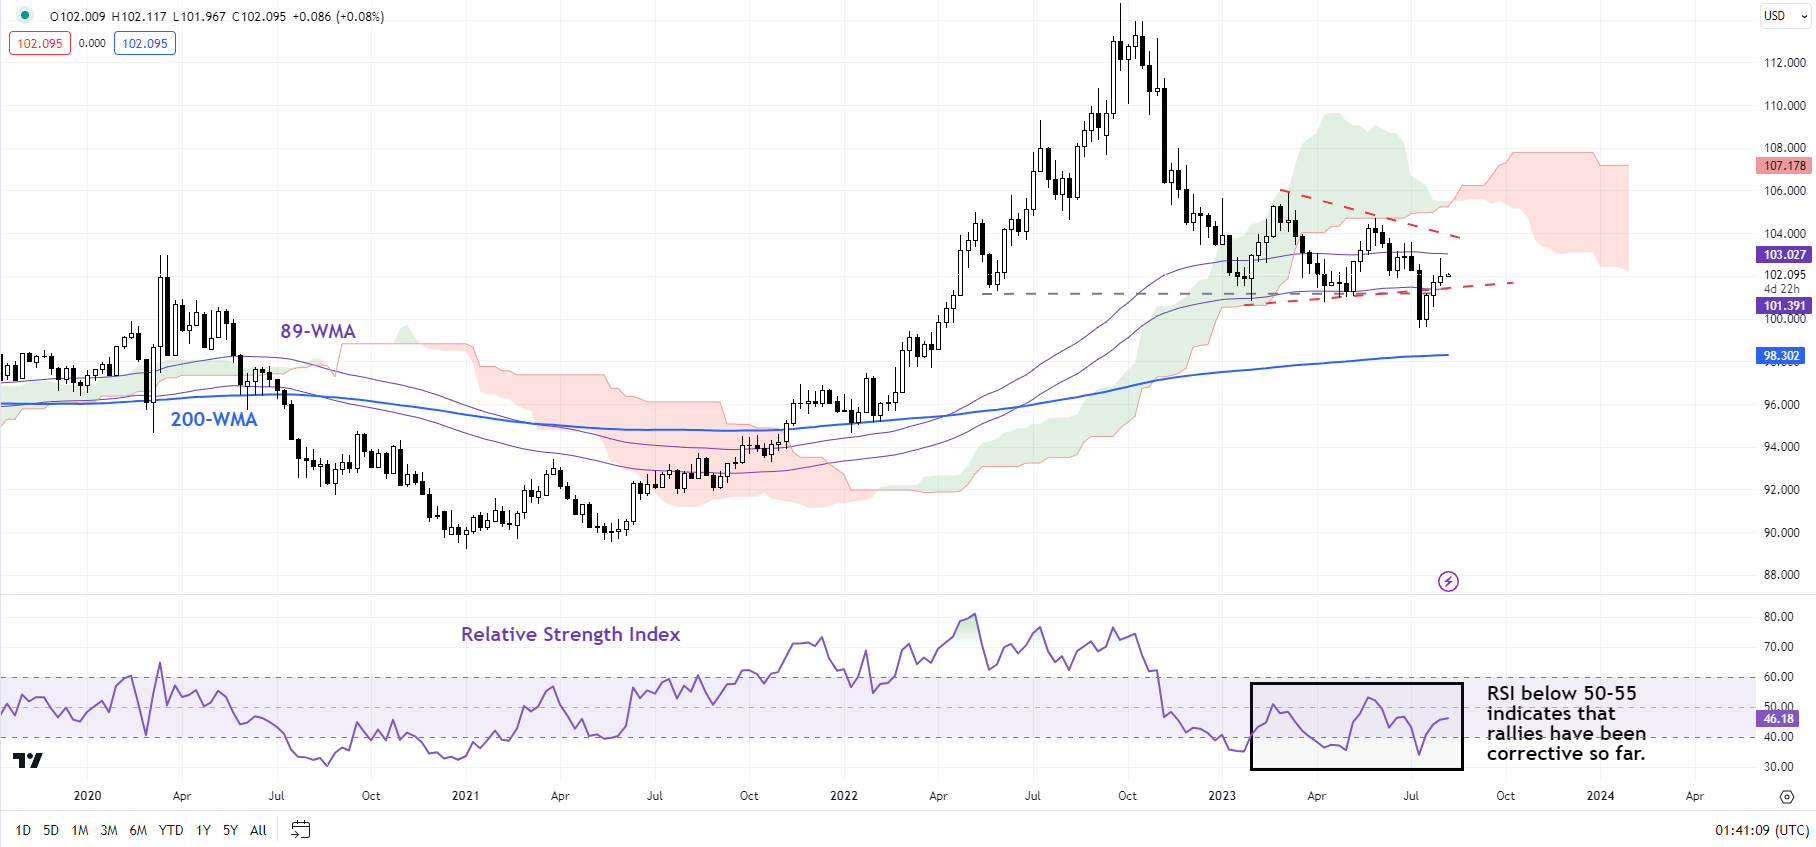
On the weekly charts, despite the rallies in recent months, the 14-week Relative Strength Index (RSI) has failed to rise above 50-55 – the threshold that typically differentiates between a corrective rally and the start of a new trend. Granted, the price action is still unfolding – and the index could extend its rise. In this regard, the March high of 106 is key – any break above would raise the odds of meaningful gains.

EUR/USD Daily Chart

image3.png

EUR/USD: Still within the uptrend channel

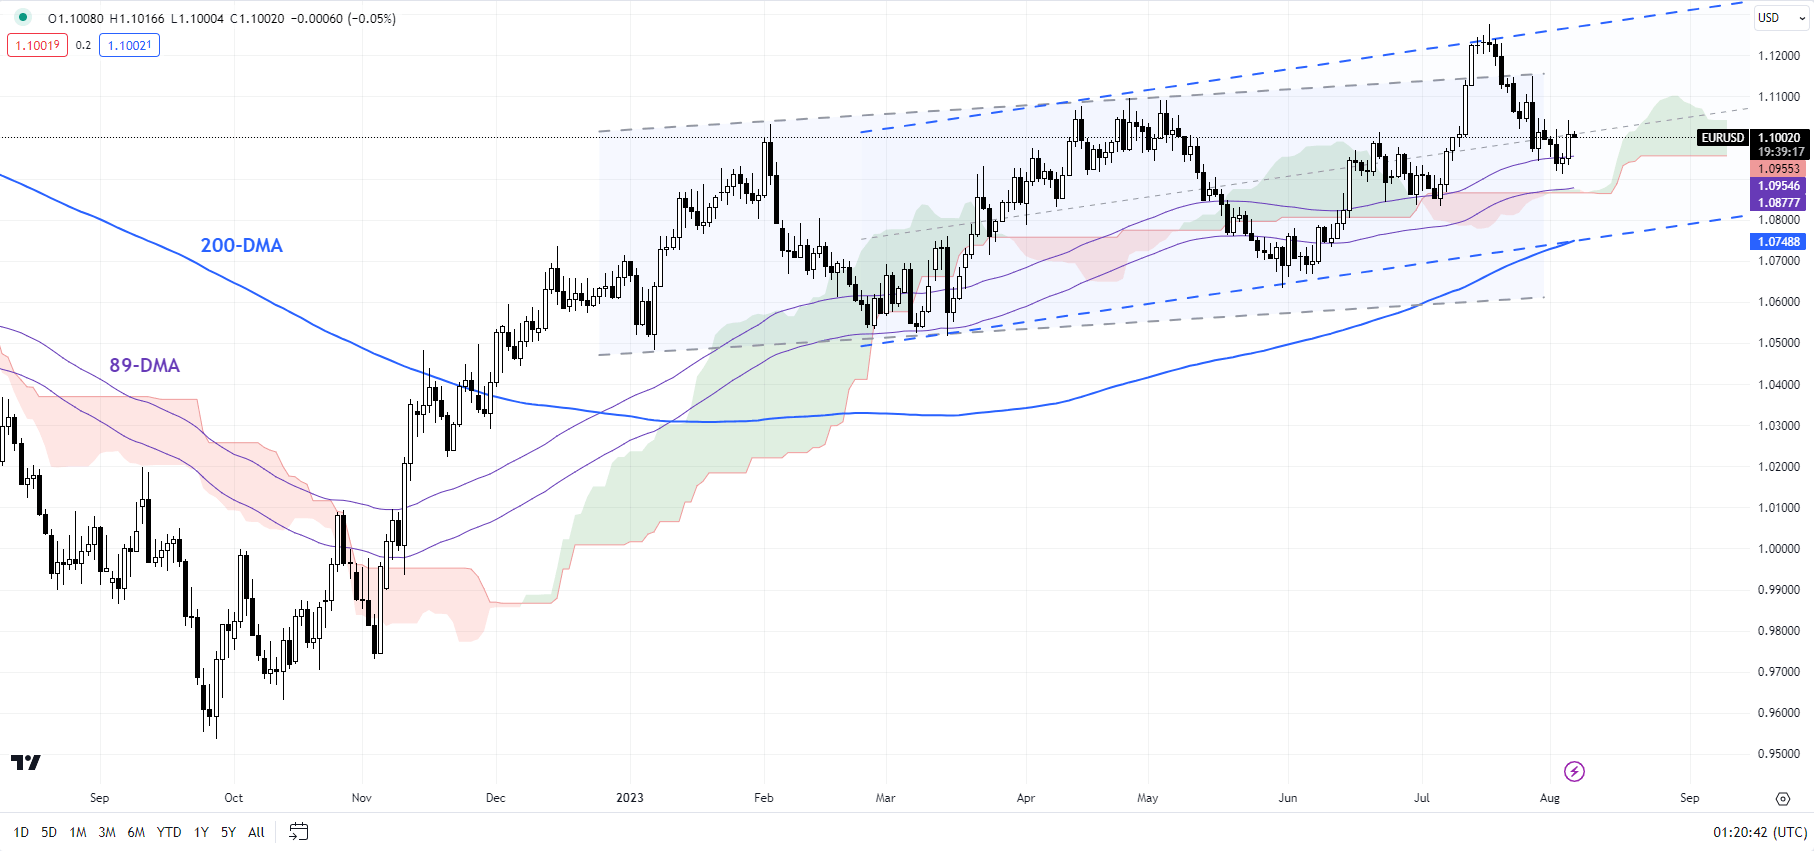
The broader bias forEUR/USD remains up given the higher-highs-higher-lows pattern since late 2022. Most recently, the pair has been hovering in an upward-sloping channel since March. However, the consolidation could extend a bit further in the near term. For more discussion, see “Euro Lifted Slightly by US Downgrade, but Will it Last? EUR/USD, EUR/AUD, EUR/NZD Price Action,” published August 2.

GBP/USD Daily Chart

image4.png

GBP/USD: Attempts to rebound from strong support

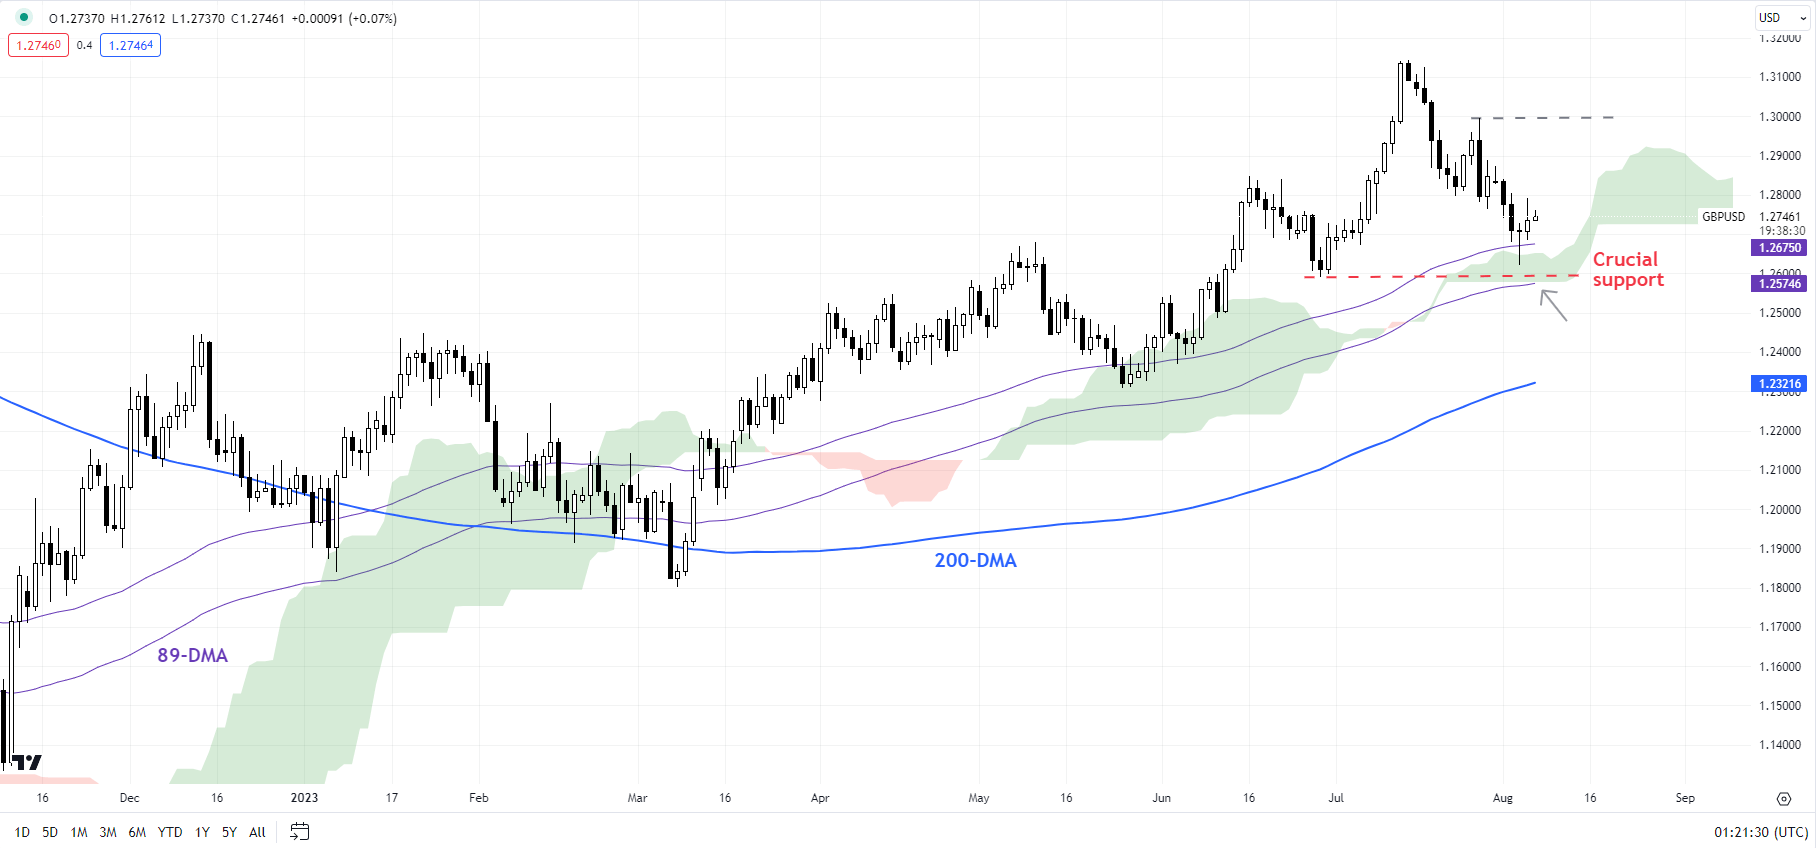
GBP/USDis holding above fairly strong support at the end-June low of 1.2600, around the 89-day moving average and the lower edge of the Ichimoku cloud on the daily charts – a possibility pointed out in the previous update. See “British Pound Could Stage a Rebound: GBP/USD, EUR/GBP, GBP/JPY Price Setups After BOE,” published August 4. Generally, oversold conditions point to a minor rebound, potentially toward a stiff resistance area around 1.2800-1.2900.

USD/JPY Daily Chart

image5.png

USD/JPY: Rally fatigue setting in?

USD/JPY’s failure to decisively sustain gains above the crucial barrier at 141.50-142.00, including the 200-period moving average and the July 21 high of 142.00, is a sign that the post-BOJ meeting rebound is running out of steam. Still, the pair needs to break below key support at 140.25-141.25 to confirm that the immediate upward pressure has faded.

Australian Dollar Fundamental Bias Breakdown: What Matters the Most for AUD/USD?

Australian Dollar Fundamental Bias Breakdown: What Matters the Most for AUD/USD?

Like other exchange rates, AUD/USD can be influenced by the difference in relative monetary policy, which in this case is between the RBA and the Fed. But that alone is one of the many ingredients that drive the direction of the Aussie. Financial markets are constantly adapting to changing economic environments. That also means the importance of what impacts the Australian Dollar changes over time.

For example, another ingredient that influences AUD/USD is financial market sentiment. That is because Australia finds itself sitting at the front end of the global supply chain, or in other words, the world business cycle. That is why you will often see the exchange rate being influenced by stock markets, especially those related to Emerging Markets.

China is Australia’s largest trading partner, and the latter heavily exports commodities to the former. That also means that understanding the dynamics of commodity prices is another factor that determines Australian Dollar direction. This means three vital ingredients are impacting the exchange rate: relative monetary policy, market sentiment and commodity prices.

With that in mind, this is a special report that focuses on trying to understand how the influence of these variables on the Australian Dollar changed from 2006 up until the middle of 2023. The purpose of the study will be to demonstrate why it is important to adapt fundamental analysis to constantly changing environments. With that in mind, let us cover how this was performed.

How the Study Was Conducted

Rolling regression modeling over a 36-month window in steps was used on the following variables (all of which were expressed in month-over-month form): AUD/USD, the spread between Australian and United States 2-year government bond yields, the MSCI Emerging Markets Index (EEM) and the Bloomberg Commodities Index (BCOM). Doing this created explanatory coefficients that changed in influence over time. It should also be noted that to gauge underlying relationships, a few data outliers were removed. If you are interested, a full analysis of how this was performed was outlined in a Twitter thread.

How Has RBA & Fed Policy Divergence Been Influencing AUD/USD?

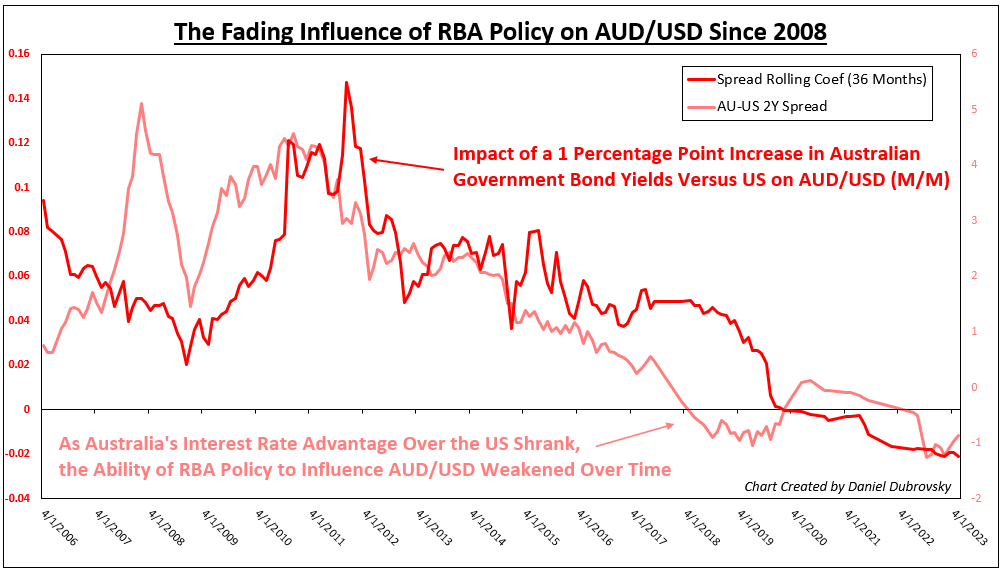
We will start with the importance of relative monetary policy. The dark red line on the chart below is the rolling bond yield spread coefficient and how it changed over time. When this line is rising above 0, that means a 1 percentage point improvement in 2-year bond yield returns in Australia relative to the United States produced an increasingly more positive reaction from AUD/USD (m/m), controlling for EEM and BCOM.

In other words, increasingly higher interest rates in Australia relative to the United States typically means stronger Aussie appreciation. What you may notice is that the dark red line has been falling steadily since 2011 and turned slightly negative around the time of 2020. When the dark red line is at 0, that means there is practically no relationship between AU-US bond yield spreads and AUD/USD.

So, what happened to this relationship? The yield advantage that Australia once had relative to the United States slowly evaporated after the 2008 Financial Crisis (light red line), turning negative heading into Covid and remaining mostly thereafter. In other words, interest rates in the US became higher than in Australia. As this happened, the ability of RBA monetary policy to influence AUD/USD (through setting interest rates) weakened significantly and remained so in the few years after Covid.
How Has RBA & Fed Policy Divergence Been Influencing AUD/USD?

How Has Emerging Market Sentiment Been Impacting AUD/USD?

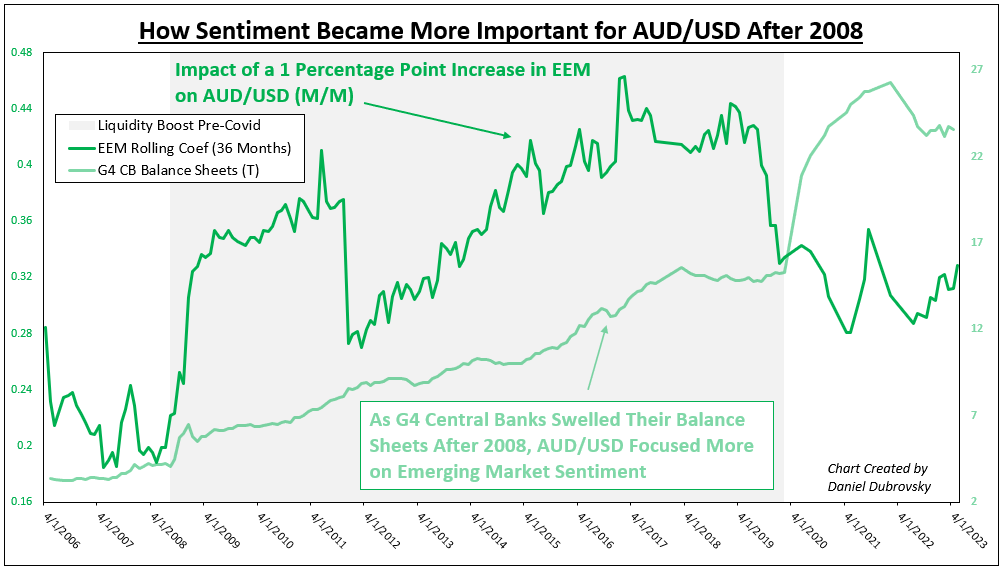
While RBA policy became an increasingly poorer predictor of AUD/USD, Emerging Market sentiment became more important. The dark green line on the chart below is the rolling EEM coefficient. When this line is rising above 0, a 1 percentage point boost in monthly Emerging Market performance shows increasingly better returns in AUD/USD (m/m), controlling for bond yield spreads and BCOM.

I have overlaid this with G4 central bank balance sheet assets. What you can see is that as major central banks injected liquidity into the financial system after the 2008 recession, sentiment became an increasingly better predictor of the Aussie exchange rate. But, you might notice that the dark green line peaked just before Covid and stayed lower thereafter despite the surge in asset holdings.

That would speak to less influence from market sentiment driving AUD/USD in the post-Covid era (although the relationship remained positive). Let us take a closer look at why this happened.
How Has Emerging Market Sentiment Been Impacting AUD/USD?

What About Commodity Prices?

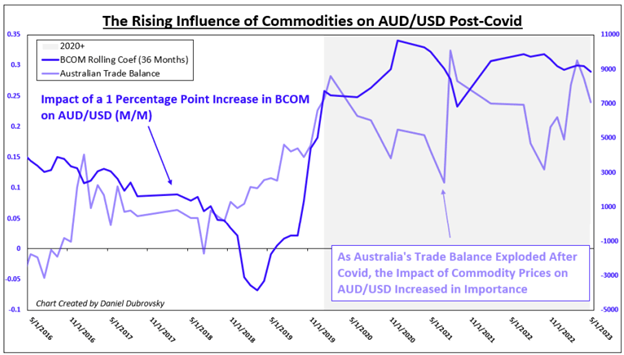
The dark blue line on the chart below is the rolling BCOM coefficient, zoomed in on just 2016+. When this line is rising increasingly above 0, a 1 percentage point boost in the BCOM Index tends to elicit a stronger positive effect on AUD/USD (m/m), controlling for bond yield spreads and EEM. What is very interesting is that the dark blue line surged higher heading into Covid and remained elevated thereafter.

This is as Australia’s trade balance exploded during Covid, meaning the value of the nation’s exports became significantly larger than its imports. In other words, as commodity prices surged, benefiting Australia, AUD/USD paid more attention to the BCOM Index and less so to EEM and AU-US bond yield spreads.
What About Commodity Prices?

A Closer Look at Post-Covid

The last chart below plots the EEM and BCOM coefficients zoomed in on 2016+. The reason this was performed is to visualize the evolution of AUD/USD underlying fundamental dynamics during Covid. Specifically, you can see how entering the pandemic, commodities became a more important factor than Emerging Market sentiment for driving the Aussie exchange rate. This was likely due to the significance of how global trading and surging prices impacted Australia’s economy, and thus the exchange rate.
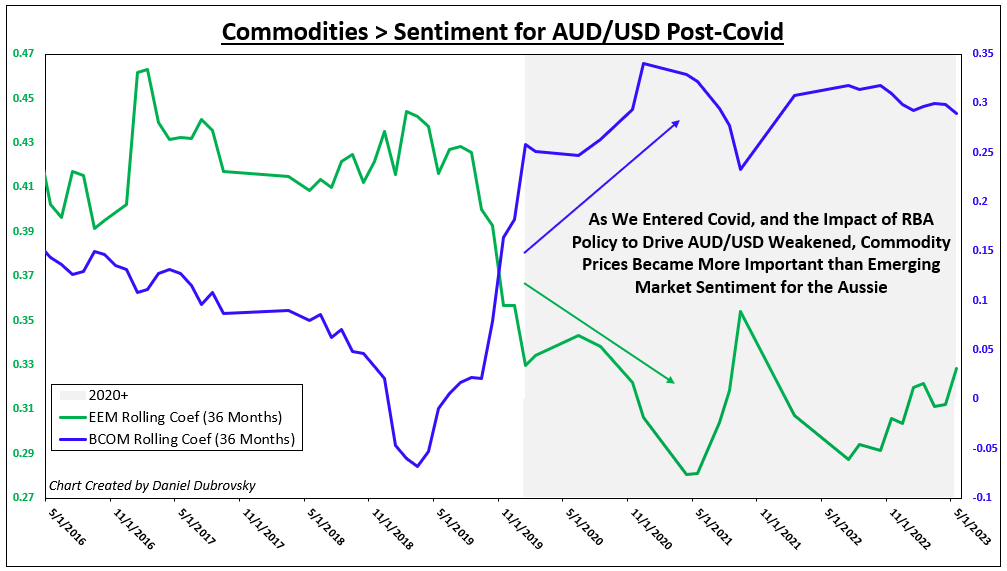
A Closer Look at Post-Covid

Conclusion and Study Limitations

While it is generally correct that monetary policy is a key driver of exchange rates, the truth is each currency behaves differently because of the unique traits of various economies. For the Australian Dollar, sentiment and commodity prices are other key factors that are involved in this equation.

On top of this, fundamental conditions change, and the influence of certain variables is no different. What this study has demonstrated is that for the Australian Dollar, RBA policy direction became an increasingly poorer predictor of the exchange rate in the aftermath of the 2008 financial crisis.

Instead, factors like market sentiment and commodity prices become better predictors of the exchange rate as underlying fundamental conditions evolved heading into Covid. Perhaps this could reverse course in the future, such as in a scenario where interest rates in Australia begin far outpacing those in the US.

It should be noted that this kind of modeling with rolling regressions creates many outputs, 180 to be exact in this sample. That is 180 different regressions that could each have their quirks or issues, such as creating a coefficient that is not statistically significant.

This was not considered. Instead, a general comprehensive regression of the entire dataset was thoroughly analyzed for potential issues. This included testing for correlation between control variables, residual normality, residual autocorrelation and heteroskedasticity. No major faults were identified.

AUD/JPY trims a part of intraday gains to 94.00 neighbourhood, still up over 0.25% for the day

AUD/JPY trims a part of intraday gains to 94.00 neighbourhood, still up over 0.25% for the day

The AUD/JPY cross attracts some buying during the Asian session on Friday and stalls a three-day-old downtrend from the 95.80-95.85 resistance zone. Spot prices, however, retreat a few pips from the daily peak and currently trade around the 93.65 region, up less than 0.30% for the day.

A generally positive tone around the US equity futures is seen undermining the safe-haven Japanese Yen (JPY) and turning out to be a key factor lending some support to the AUD/JPY cross. The risk-sensitive Australian Dollar (AUD) further draws support from the Reserve Bank of Australia’s (RBA) hawkish quarterly Monetary Policy Statement (MPS), indicating that interest rates may still need to go higher. Adding to this, China’s Commerce Ministry announced on Friday that the country will lift the anti-dumping and anti-subsidy tariff on barley imports from Australia, which provides an additional lift to the Aussie.

The RBA, meanwhile, remain concerned about the worsening economic conditions and slashed its short-term growth forecasts. The central bank now expects the domestic economy to grow by just 0.9% by the end of the year or the slowest pace since 1992. This, in turn, holds back bulls from placing aggressive bets around the AUD/JPY cross. Apart from this, the Bank of Japan’s (BoJ) intervention for the second time this week on Thursday to cool the speed of the rise in the 10-year Japanese Government Bond (JGB) yield, which shot to its highest since April 2014 on Thursday, contributes to capping the upside, at least for now.

The AUD/JPY cross fails just ahead of the 94.00 round-figure mark, which should now act as a pivotal point for intraday traders. Spot prices, however, manage to hold comfortably above last week’s swing low, around the very important 200-day Simple Moving Average (SMA). Bearish traders need to wait for a convincing break below a technically significant MA before positioning for the resumption of the recent pullback from the YTD peak, around the 97.65 region touched in June. Nevertheless, the cross, at current levels, remains on track to register modest losses for the second successive week.

Japan’s Fiscal Plight Draws Scrutiny After BOJ Tweak to YCC

Japan’s Fiscal Plight Draws Scrutiny After BOJ Tweak to YCC

The Bank of Japan’s tweak to its yield curve control mechanism created another reason to take a look at the nation’s fiscal conditions, as Tokyo seeks to expand spending on defense and childcare while shouldering a massive public debt.

BOJ Governor Kazuo Ueda’s loosening of restraints on 10-year bond yields prompted speculation among some that the end of the YCC program was somewhere on the horizon, and with it the quantitative easing program that allowed the government to grow the national debt to almost 260% of gross domestic product, the most in the developed world. With Tuesday’s move by Fitch Ratings to downgrade US government credit, Japan’s creditworthiness may also come under question if rates rise.


Ueda’s YCC adjustment was “a message to the government that it now will have to do financial management responsibly, because the BOJ won’t control yields as firmly as it used to,” said Takahide Kiuchi, economist at Nomura Research Institute Ltd. and a former BOJ board member. “Yields will rise if markets lose faith in their management.”

In the decade since then Bank of Japan Governor Haruhiko Kuroda launched his monetary bazooka in a bid to end entrenched deflation, the central bank has held the spotlight for economists and traders attempting to assess the outlook for Japan’s economy.

The prolonged period of rock-bottom interest rates, which predates Kuroda’s aggressive actions in 2013, helped turn fiscal policy into something of an afterthought, as the BOJ’s version of QE — YCC — ensured that the government could sell as much debt as needed and would always find a buyer.

Now some economists see near-term risks if rising rates complicate financing operations. “If talk emerges of a possible cut to Japan’s credit rating, it’s possible upward pressure would push yields over 1%,” said Shinichiro Kobayashi, chief economist at Mitsubishi UFJ Research and Consulting.

Japan’s credit ratings have been stuck in a downward trend for three decades. S&P last changed its assessment in 2015, when it cut its sovereign long-term rating to A+.

If 10-year yields rise by 1 percentage point from a base case, Japan’s debt-servicing payments are expected to increase by 3.6 trillion yen by fiscal year 2026, according to Finance Ministry calculations. Japan is expected to spend 22.1% of its 114 trillion yen ($795 billion) national budget for this year on debt-servicing costs.

Yields on those securities touched a fresh nine-year high of 0.65% Thursday, prodding the BOJ to announce an unscheduled bond-purchase operation for the second time this week in a sign of its determination to support the market.

For now, the mood in the finance ministry is calm. Given the nation’s enormous outstanding debt, the ministry needs to issue JGBs in a stable manner over the medium-to-long term without being constrained by short-term financing costs, said a senior official who asked not to be named. He noted that in addition to controlling short-term costs, authorities manage debt policy with an eye on preserving market functionality, so last week’s tweak to YCC is in line with the ministry’s thinking.

If investors lose faith in Japan’s fiscal management, and begin to fret over the safety of JGBs, negative sentiment could build on itself, warned Yasunari Tanaka, researcher at Mitsubishi Research Institute Inc.

“Foreign investors would shift from JGBs to other countries’ bonds if they believed JGBs to be risky,” Tanaka said. “This would lead to higher interest rates, which in turn would lead to a further deterioration of public finances.”

Tanaka emphasized that he doesn’t foresee a crisis, but a slow period of deterioration could mean further increases in interest rates lead to “a negative spiral.”

Moody’s Investors Service said last week’s YCC tweak probably won’t create headwinds for the finance ministry. “In the absence of a more fundamental shift in monetary policy toward tightening, we expect that interest rates will not rise so much that they undermine credit conditions for Japanese issuers over the next year,” analysts at Moody’s wrote in a report Monday.

A saving grace for Japan is that Japanese investors still own a large portion of outstanding JGBs, with the BOJ itself holding more than 50%. Less than 15% of all public debt was held by overseas investors as of the end of March. Before Kuroda launched his stimulus program in 2013, the central bank held 11.6% of outstanding debt.

Also, the BOJ’s failure to reinflate the economy through its ultraeasy policy may prevent problems for fiscal policy. Ten-year yields wouldn’t go up to 1% “even if the BOJ says it’s OK to get there,” said Kiuchi at Nomura Research. “That means that the BOJ hasn’t been able to generate much of an stimulative impact for the economy by holding down yields.”

Ueda’s assertion that the YCC tweak didn’t represent a first step toward policy normalization will assure Prime Minister Fumio Kishida and the finance ministry that the economy — and the government’s funding operations — will continue to benefit from low rates.

“The BOJ won’t say publicly, but it’s important to consider the impact on Japan’s finances,” Chotaro Morita, senior fellow at SMBC Nikko Securities, wrote in a report Tuesday. “It wants to avoid creating the impression there might be an abrupt increase in fiscal costs due to YCC adjustments.”

–With assistance from Emi Urabe, Yoshiaki Nohara and Yumi Teso.

©2023 Bloomberg L.P.

Top P

Will Sweden’s Woes Shake Europe’s Real Estate Markets?

Will Sweden’s Woes Shake Europe’s Real Estate Markets?

Sweden has become the poster child for European property-market volatility. The country’s residential property market has experienced one of Europe’s biggest booms and sharpest reversals in recent years. And Swedish commercial real estate (CRE) markets are facing oversupply, high vacancy rates and rising financing costs.

As a result, the bonds of leading Swedish real estate companies have faced successive credit rating downgrades, sparking fears that CRE troubles will extend to banks and property companies across Europe. We disagree. In our analysis, Sweden’s banks and property companies are mostly well placed to ride out the property-market downturn, and we see fears of a domino effect as overly pessimistic.

Sweden’s Property Market Is Atypical

Investors should take care not to extrapolate Sweden’s property woes across Europe, because Sweden’s financial stability is far more sensitive to CRE than the European average. For example, Sweden’s CRE is one of Europe’s smaller markets, accounting for about 2.8% of the total. But Sweden’s CRE market represents 47% of Swedish GDP, compared with a European average of about 11%.

Sweden’s CRE market is also closely entwined with the Swedish financial system: 47% of CRE bank lending originates from Swedish banks, and a similar proportion of CRE companies’ bonds are owned by Swedish financial institutions and investors. This makes Swedish banks highly sensitive to CRE market developments, given their above-average exposures to the property market (Display).

Sweden’s CRE market is dwarfed by Germany, the UK and France’s - but represents 47% of Swedish GDP.

Current and historical analyses do not guarantee future results.
Left display as of December 31, 2022; right display as of March 31, 2023
Source: Eurostat, Statista, Sveriges Riksbank and AllianceBernstein (AB)

Rising interest rates are weighing heavily on the share prices of Sweden’s CRE companies, which have increased their leverage substantially over the last 10 years. Many face much higher debt-service costs (Display), damaging investor confidence.

Swedish CRE Companies Face Painful Financing Resets Within Next Two Years
Out of 13 listed Swedish property companies, 10 have over 20% of their debt refixing at higher rates inside two years.

Current and historical analyses do not guarantee future results.
Percentages shown are adjusted for unutilized credit lines.
As of December 31, 2022
Source: Bank for International Settlements (BIS), company reports and AB

Most Swedish CRE Companies Still Look Robust

Allowing for the sharp increase in financing costs, our analysis suggests that the largest Swedish CRE companies’ earnings before interest and taxes (EBIT) will mostly remain positive over the next two years. This means that only a few would breach their interest-cover ratio (ICR) covenants, and only one would fail to keep its ICR above 1.0× (Display).

Earnings Likely to Support Most Listed Swedish CRE Companies
For half of the listed companies shown, earnings would need to fall by 45% or more for interest cover to fall below one.

Current analyses do not guarantee future results.
Forecasts quoted are S&P Capital IQ consensus, and assume Riksbank policy rate peaks at 4.5% versus prior assumption of 3.75%.
Positive blue bars denote companies that would already have breached their covenants if we adjusted their FY22 ICR to allow for the increased interest burden.
As of May 23, 2023
Source: S&P Capital IQ, company reports and AB

Overall, recent developments don’t point to a drastic CRE scenario. We expect only modest asset-quality deterioration and increased performing loan provisioning at Swedish banks.

Consequently, we think Swedish banks will weather the storm. Crucially, they still have capacity to provide further support to real estate borrowers by taking on more property exposure. Their non-performing loans (NPLs) are low, and loan to value (LTV) ratios are still healthy. Meanwhile, their profitability is strong after successive rate rises helped to widen their net interest margins.

Warding Off Worst-Case Scenarios

Faced with worst-case scenarios, CRE companies could implement an array of measures to mitigate the situation, while banks would likely also offer renegotiated terms and conditions for those companies at risk of breaching their covenants (whether LTV or ICR).

For Swedish banks, even if the estimated value of their collateral were to fall below the loan value, they would still have the option to retain the asset and divest it later once market stresses have eased. This tactic was used successfully in previous crises, and at higher LTV ratios than today.

Bank assets such as higher-yielding property portfolios with inflation-linked rents and leases that oblige tenants to meet buildings’ tax, insurance and maintenance expenses—typical of Nordic light industry, logistics and warehousing—would likely bounce back faster. By contrast, lower-yielding portfolios with no indexation or cost pass-through—typical for Swedish residential—would be much slower to recover and more likely to suffer write-downs.

European Banks Are in Good Shape

Meanwhile, across Europe, we think the risk of contagion from Swedish CRE lending is low. We find that most European banks’ property exposures are manageable, their LTV ratios (averaging about 50%) give them a significant cushion against property losses, and their NPLs are yet to increase.

With a handful of exceptions, European banks’ exposure to US CRE is also modest, representing only a small fraction of their overall US loan books. The majority of European banks also perform well in our financial stress tests based on scenarios such as the GFC and previous banking crises. In the UK, the Bank of England’s recently published Financial Stability Report shows that here too, banks are relatively resilient to a severe stress-test scenario.

Across Europe’s residential property markets, it’s also rare to find the characteristics that have made Sweden’s so volatile: a majority of interest-only loans on variable or short-term fixed-rate deals; no requirement for most households to pay down their debt below 50% of property values; and a relatively low level of fiscal support for householders.

Overall, we think the problems facing Sweden’s banks will impact their profits but not their solvency, and we expect relatively moderate hits to their capital buffers. For Swedish CRE companies, we think the real estate downturn will in most cases be survivable. And for property markets across Europe, we see Sweden as an outlier rather than a sign of things to come.

UK: Commercial work gains momentum, helping to offset another sharp fall in house building

UK: Commercial work gains momentum, helping to offset another sharp fall in house building

July data signalled a renewed expansion of overall construction output, following the marginal decline seen during the previous month. This was led by the strongest rise in commercial building since February and another solid contribution to growth from civil engineering activity. Meanwhile, latest data signalled another sharp reduction in residential construction activity. Survey respondents widely noted that higher interest rates and the uncertain UK economic outlook had constrained order books in July. Softer demand and fewer supply bottlenecks in turn led to the fastest improvement in vendors’ delivery times

Shopping Basket
Chat now!
1