Gold Price Forecast: XAU Rises Ahead of US CPI Report Amid Banking Jitters

Gold Price Forecast: XAU Rises Ahead of US CPI Report Amid Banking Jitters

Overview

Gold (XAU) prices are experiencing a slight uptick on Wednesday, lingering within the broad range established last Friday. As the trading world keenly awaits the U.S. Consumer Price Index (CPI) report due tomorrow, the precious metal finds itself in the spotlight.

At 05:00 GMT, Spot Gold is trading at $1930.44, marking an increase of $5.335 or 0.28%. This upswing follows a slump to a month-long low of $1,922 on Tuesday. Concurrently, U.S. gold futures are echoing a similar upward trend.

Trading Derivatives carries a high level of risk to your capital and you should only trade with money you can afford to lose. Trading Derivatives may not be suitable for all investors, so please ensure that you fully understand the risks involved, and seek independent advice if necessary. A Product Disclosure Statement (PDS) can be obtained either from this website or on request from our offices and should be considered before entering into a transaction with us. Raw Spread accounts offer spreads from 0.0 pips with a commission charge of USD $3.50 per 100k traded. Standard account offer spreads from 1 pips with no additional commission charges. Spreads on CFD indices start at 0.4 points. The information on this site is not directed at residents in any country or jurisdiction where such distribution or use would be contrary to local law or regulation.

Gold Reacts to Dollar, Bank Downgrades

Several economic indicators and statements have been influencing the gold market. Notably, the dollar index has retreated from its peak in the last session, and longer-dated U.S. Treasury yields dipped after Moody’s took the unexpected step of slashing credit ratings for multiple small to mid-sized American banks. This downgrade also rippled through the banking sector, with both U.S. and European bank stocks experiencing a fall. Furthermore, Italy’s sudden decision to impose a 40% windfall tax on its lenders added to the sector’s apprehension.

Trade Deficit Narrows: Imports at 18-month Low

On the U.S. trade front, there’s positive news as the trade deficit saw a considerable contraction in June. This reduction was primarily driven by businesses curbing their foreign capital goods purchases, leading to the lowest import levels in over a year and a half.

Fed Members Discuss Rate Hike Possibilities

Meanwhile, in the world of interest rates, there’s a buzz of anticipation. Richmond Fed President, Thomas Barkin, hinted that more data scrutiny is essential before determining future rate hikes. Supporting this cautious approach, Philadelphia Fed President Patrick Harker expressed that unless drastic shifts in economic indicators emerge, the interest rates might remain unchanged.

Short-term Outlook:  Neutral

Given the current economic climate, with a softened dollar, fluctuating yields, and the looming Consumer Price Index report, gold’s short-term outlook appears neutral. Investors are also monitoring emerging market stocks and their currency trends, especially with global interest rates witnessing a unique divergence. Meanwhile, in related news, Canadian gold mining giant Barrick Gold Corp surpassed Q2 profit expectations, further testament to gold’s enduring allure in these uncertain times.

Technical Analysis
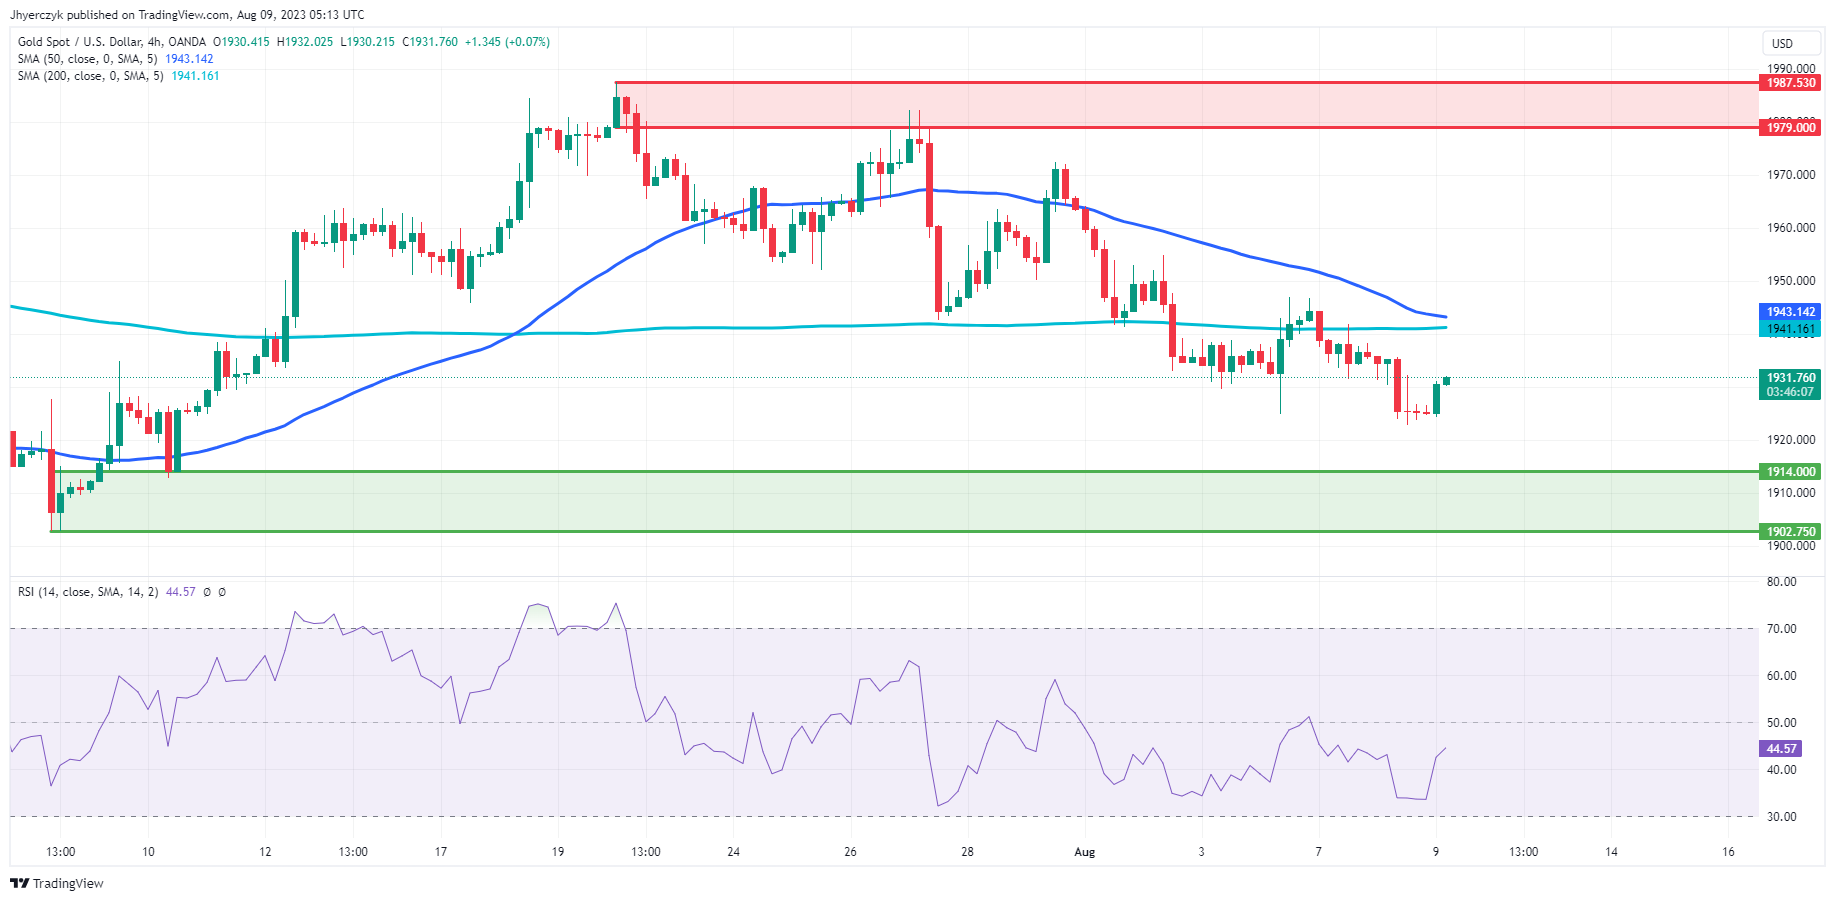
4-Hour Gold (XAU)Currently, Gold (XAU) is trading at $1931.87, which is below both its 200-4H moving average of $1941.16 and its 50-4H moving average of $1943.14. This positioning suggests bearish sentiment as the commodity is unable to breach these significant levels. The 14-4H RSI, at 44.41, indicates weaker momentum, while climbing toward neutral or a 50 reading.

Gold is trading above its main support zone of $1914.00 to $1902.75, offering a buffer against further declines. However, with the current price well below the main resistance range of $1979.00 to $1987.53, upward movement might face hurdles. Given its position beneath both moving averages and proximity to support, the short-term market sentiment for Gold seems bearish. But conditions could change rapidly if buyers can overcome both the 50-4H and 200-4H moving averages.

China Consumer Prices Rise by 0.2% but the PPI Signals Weak Demand

China Consumer Prices Rise by 0.2% but the PPI Signals Weak Demand

It was another testy start to the day for the Asian markets. After the disappointing trade data from China, consumer price inflation and producer price index figures from China drew interest this morning.

Consumer prices fell by 0.3% year-over-year in July after stalling in June. Economists forecast a 0.4% decline, signaling weak consumer demand. However, consumer prices increased by 0.2% in July, reversing a 0.2% decline in June. Economists forecast a 0.1% increase.

Producer price index figures also influenced market risk sentiment. On Tuesday, trade data from China highlighted the weak demand environment suggesting further downward pressure on producer prices.

However, the producer price index fell by 4.4% year-over-year, following a 5.4% decline in June. Economists forecast a 4.1% decline.

While the producer price index declined at a less marked pace in July, the 4.4% fall reflected the ongoing weakness in global demand, aligned with the July Caixin manufacturing PMI and the latest import and export figures. Nonetheless, a possible bottoming out and a pickup in consumer prices should provide some comfort.

AUD/USD Reaction to the China Inflation Numbers

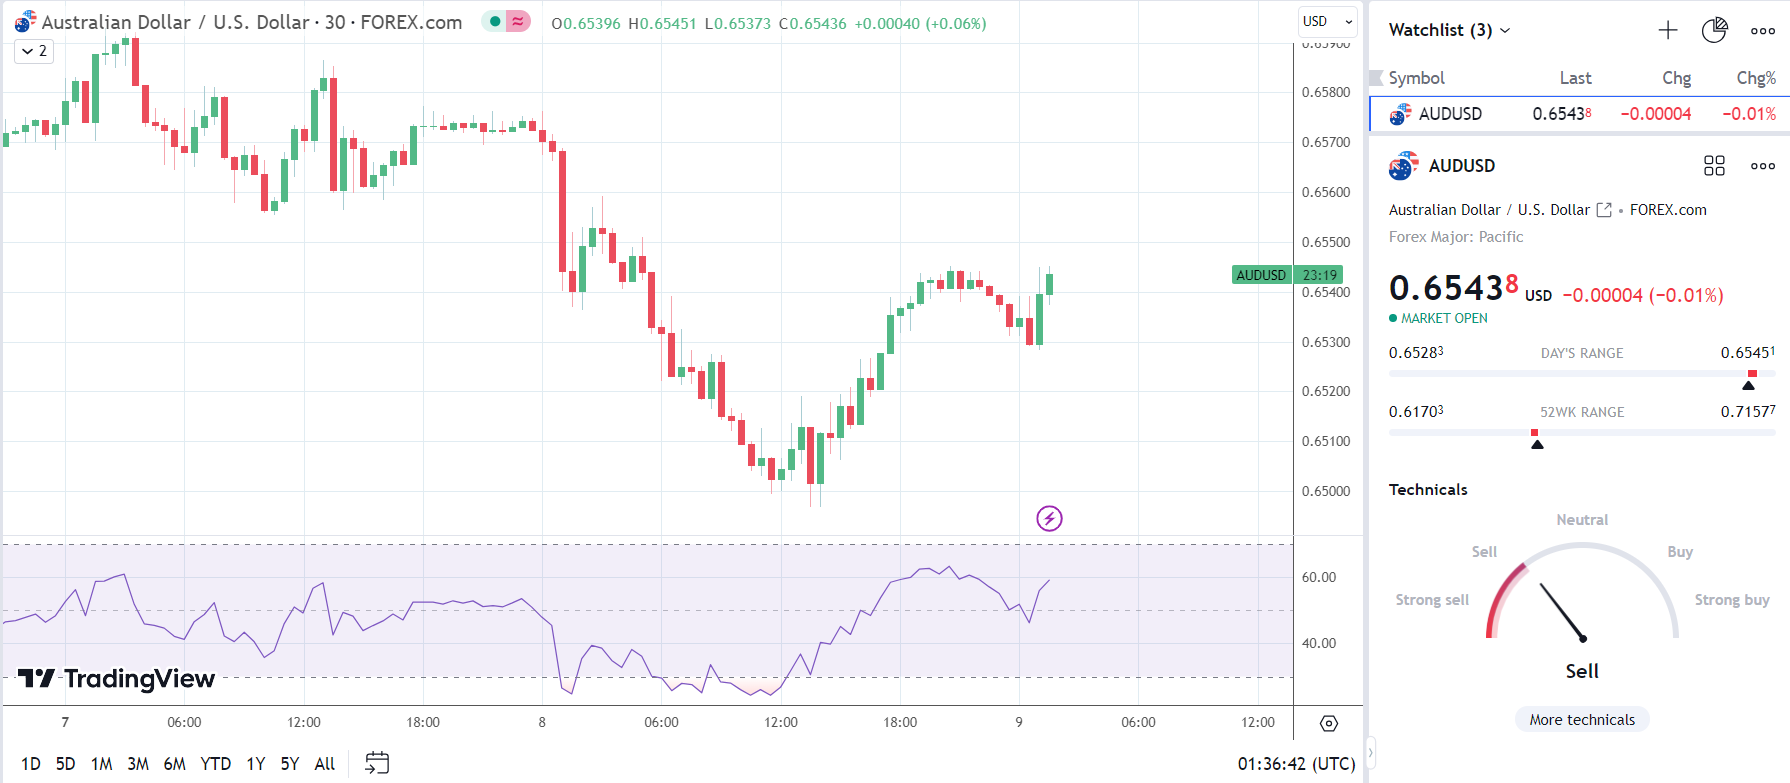
Before the China inflation numbers, the AUD/USD fell to an early low of $0.65283 before rising to a pre-stat high of $0.65449.

However, in response to the inflation figures, the AUD/USD fell to a post-stat low of $0.65373 before rising to a high of $0.65451.

This morning, the AUD/USD was down 0.01% to $0.65438.

AUD/USD responds to the inflation numbers from China.
090823 AUDUSD 30-Minute Chart
Gold (XAU/USD) Remains Subdued as the DXY Continues to Advance

Gold (XAU/USD) Remains Subdued as the DXY Continues to Advance

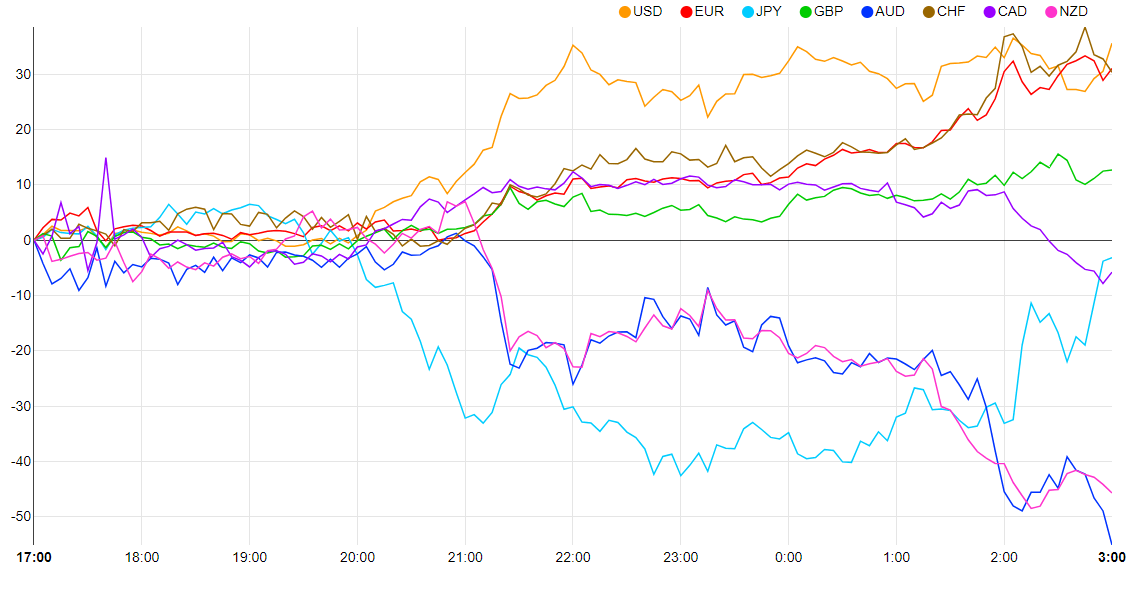
Gold prices remain subdued with the 50-day MA capping any potential move to the upside with the help of rising US Yields and a slightly stronger US Dollar. The US Dollar also received a boost from hawkish comments from Fed Policymaker Michelle Bowman who stated that further rate hikes may be required to get inflation below target.

Currency Strength Chart: Strongest – USD, Weakest – AUD.

image1.png

DXY AND US CPI DATA

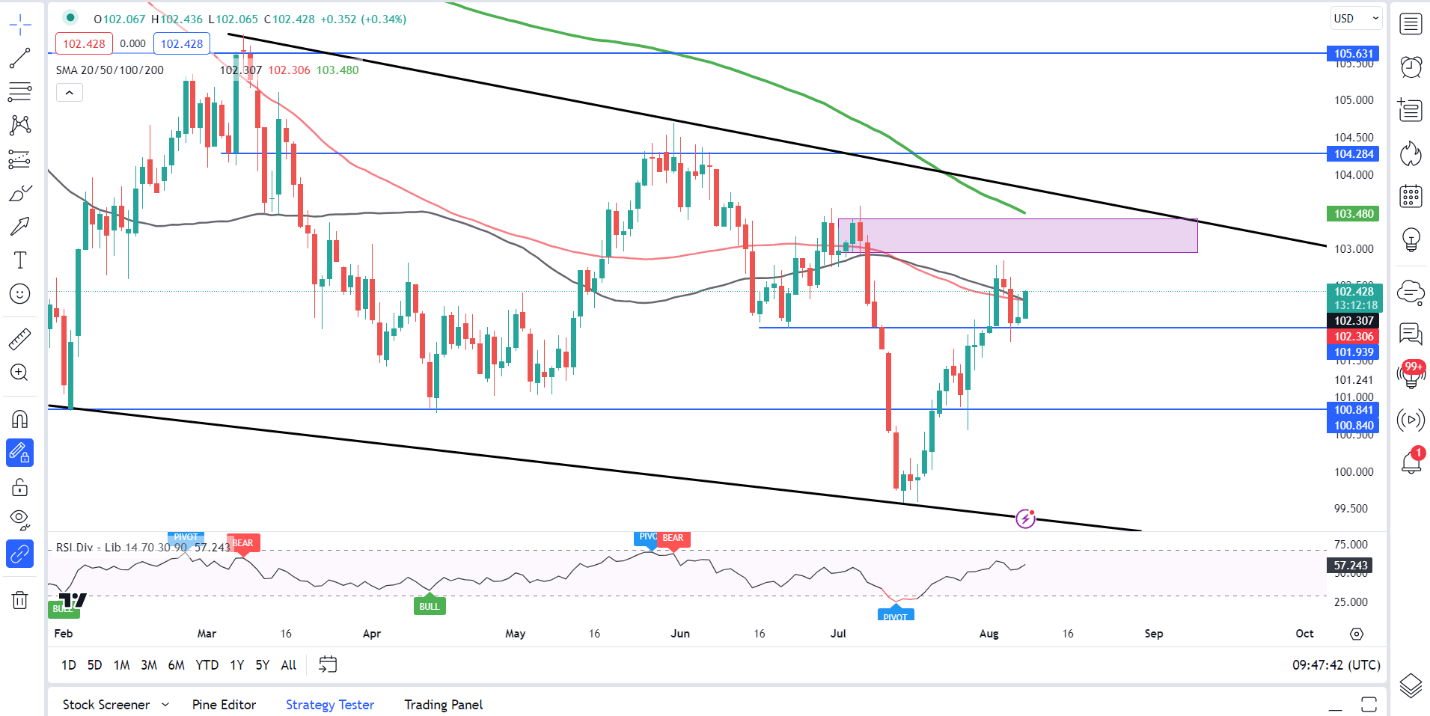
The Dollar Index (DXY) and US Yields helped keep Gold on the backfoot yesterday with Dollar strength continuing this morning. The US Dollar appears to be benefitting from a risk-off tone this morning following lackluster data from China as well as Moody’s downgrading a host of small to medium sized US Banks.

Given the cautious tone in markets it will be interesting to see if the DXY is able to hold onto gains as the US session begins. Yesterday’s rally failed to hold the high ground as the US session brought a modest pullback with the index struggling to close above the 50 and 100-day MA.

Personally, I do think we could be in for a period of consolidation heading into Thursdays US CPI print. There is not a lot on the calendar in terms of risk events today with Fed policymaker Barkin scheduled to speak later in the day. Should Barkin strike a similar tone to Michelle Bowman the Dollar may continue to rise toward a key confluence area between the 103.00-103.55 area with Gold prices likely to struggle as a result.

Dollar Index (DXY) Daily Chart – August 8, 2023

image2.png

TECHNICAL OUTLOOK AND FINAL THOUGHTS

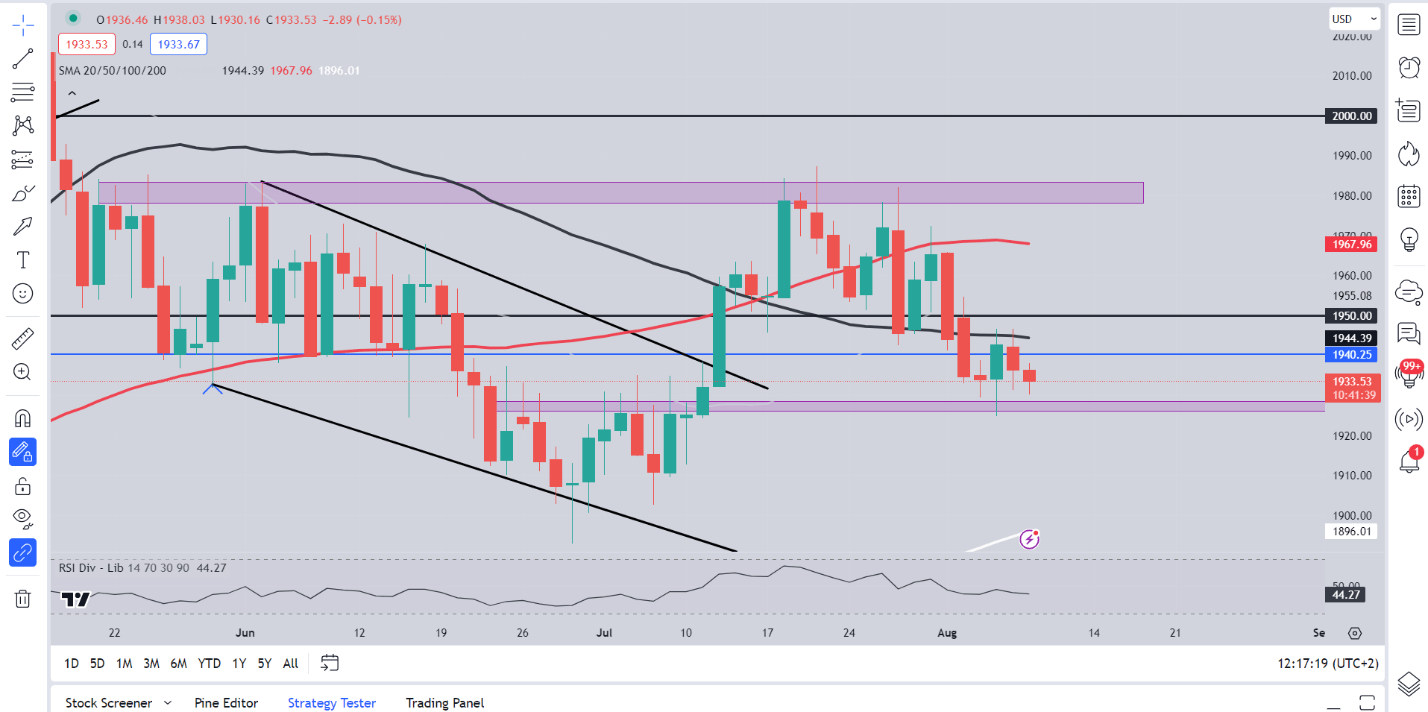
Form a technical perspective, Gold prices do appear as though a retracement higher could be in the offing. A key support level rests around the 1927.00 to 1925 mark and a failure to break below may sweeten the narrative for bulls.

The precious metal is stuck in a tight range between the 50-day MA and the 1925.00 to 1927.00 for the last 4 days. A break and daily candle close above the 50-day MA could facilitate a run up toward the 100-day MA resting at 1967.67.

Gold (XAU/USD) Daily Chart – August 8, 2023

image3.png

Alternatively, a break lower from here could lead to further declines for Gold with the 1900.00 psychological handle remaining a possibility. It is important to keep in mind that with US CPI out on Thursday price could continue to consolidate with market participants likely to minimize risk exposure and reposition ahead of the release.

Taking a quick look at the IG Client Sentiment retail trader data shows 75% of traders are net-long on Gold with the ratio of traders long to short at 3 to 1.

Brent Crude Oil: Poor Chinese Trade Data Sends Oil Lower

Brent Crude Oil: Poor Chinese Trade Data Sends Oil Lower

Chinese Exports and Import Data Worsens Further

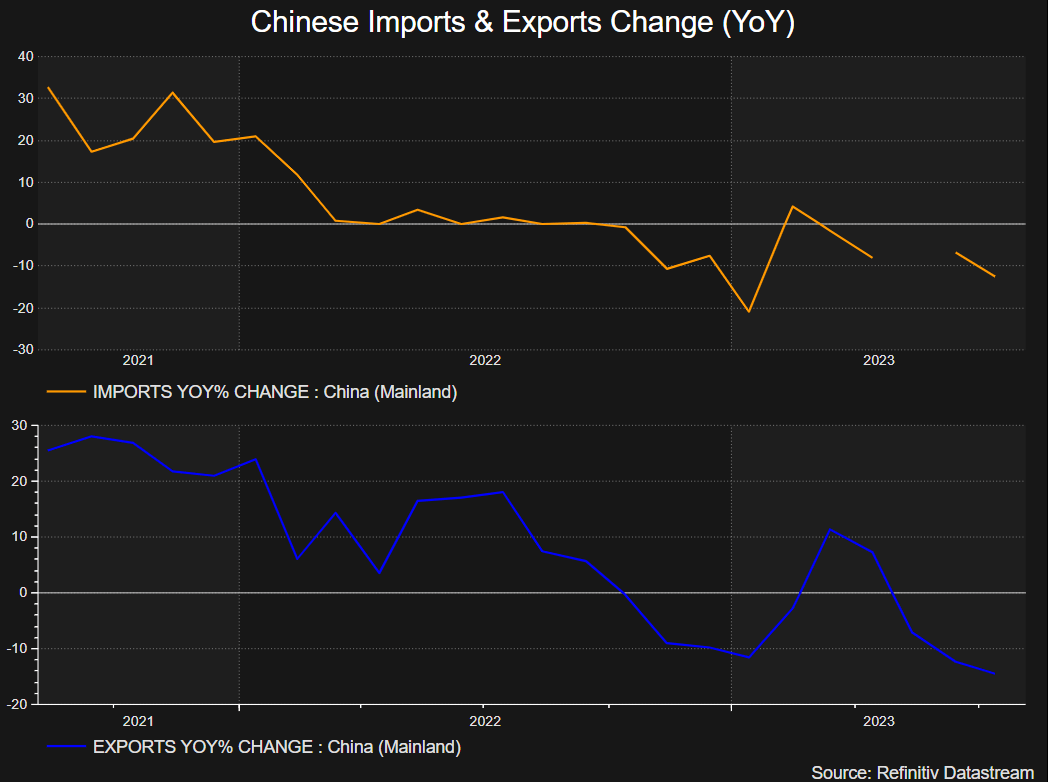
Chinese data took another step backwards in the early hours of this morning as import and export data witnessed worse-than-expected declines in July. Exports dropped 14.5%, worse than the 12.5% contraction anticipated while imports plummeted 12.4% from an expected 5% drop.

image1.png

The data accompanies lower trending manufacturing data which is seen contracting, no matter which version you refer to, the NBS or Caixin measure. The data confirms the harsh reality of the challenges faced by the Chinese reopening at a time when global growth is under threat – apart from the US it would seem.

The chart below shows import data on a downtrend even before the lockdown restrictions were removed, while export data appeared to top out at the end of last year when restrictions were lifted.

Chinese Trade Data Weakens Further

image2.png

Brent Crude Oil Heads Lower After Souring Chinese Trade Data

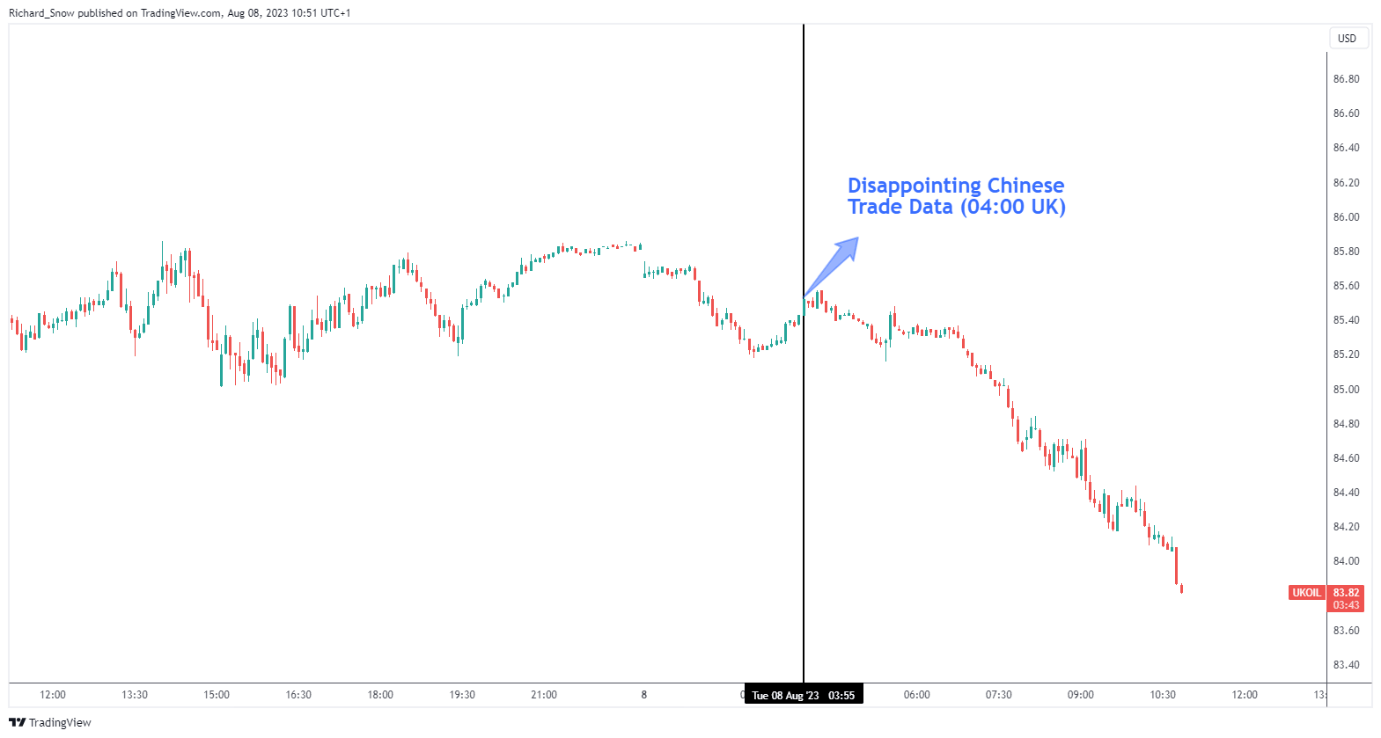
At the time of the data release (04:00 UK time) when the price of oil was around $85.50, oil started moving lower – something that continued into early European trade.

Brent Crude Oil 5-Minute Chart

image3.png

Brent Crude Oil Fails to Test Significant Level of Resistance

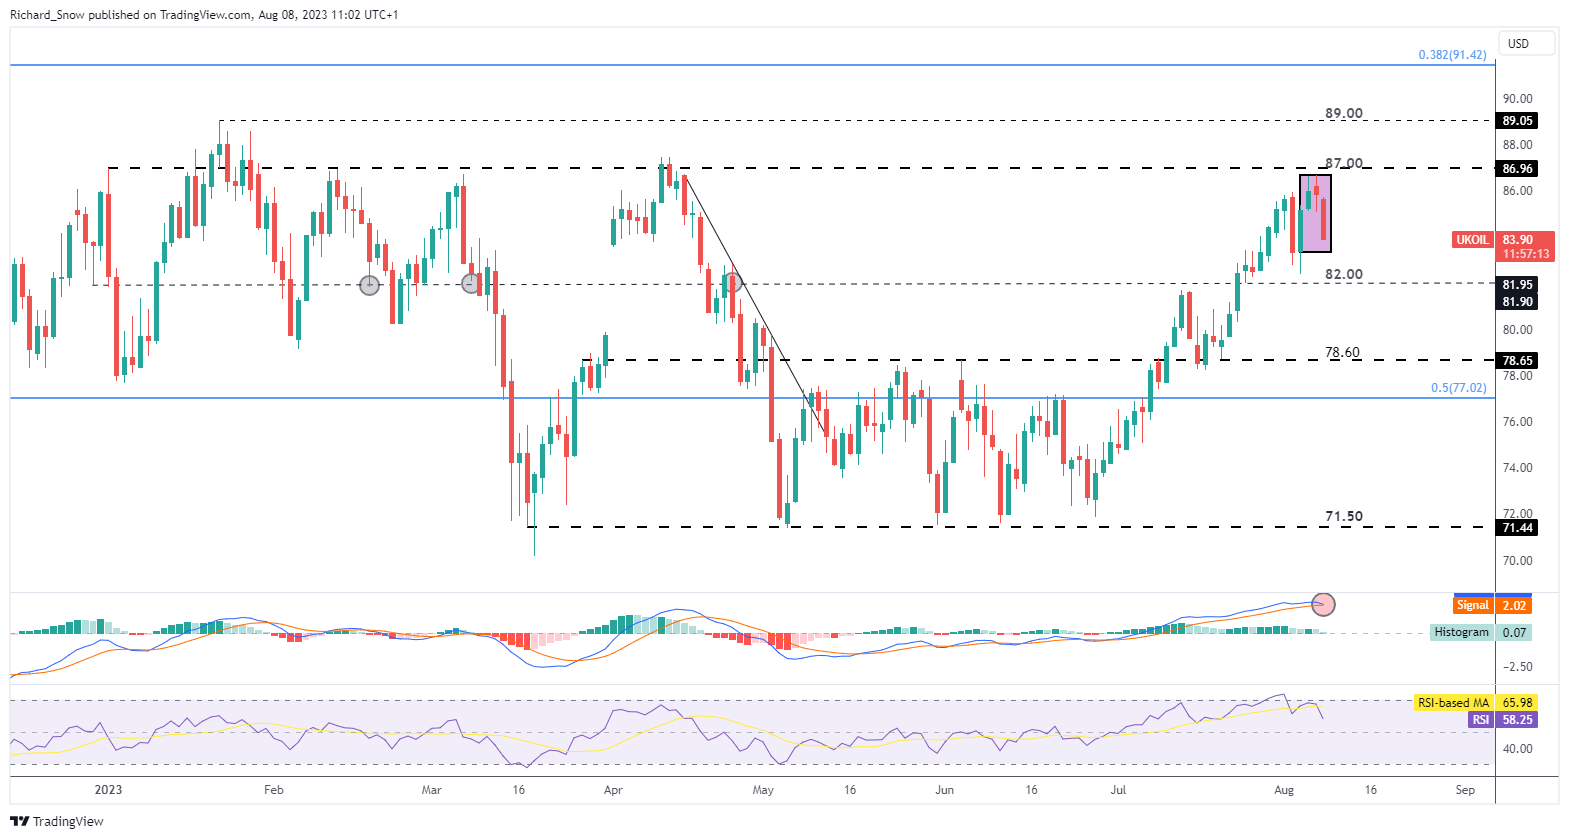
The daily chart reveals oil prices continuing from yesterday’s slight move lower, now accelerating the selloff in the commodity. Oil approached the very significant $87 marker and had seen signs of waning bullish momentum in the lead up to todays move lower.

Two daily candles attempting to trade back at $87 fell short of the mark, with intra-day pullbacks providing telling upper wicks. Today’s selloff continues with vigor, setting up what could land up being an ‘evening star-like’ candle stick pattern. While the candles do not match the exact characteristics of the pattern, price action appears to be sending a signal that bulls failed to reach a significant level of resistance allowing bears to see value to the downside on the back of the pessimistic Chinese data.

The MACD indicator is on the verge of a bearish crossover while the RSI heads lower after previously entering overbought territory. Levels to the downside appear at $82, followed by $78.60. Resistance remains at the $87 level.

Daily Brent Crude Oil Chart

image4.png

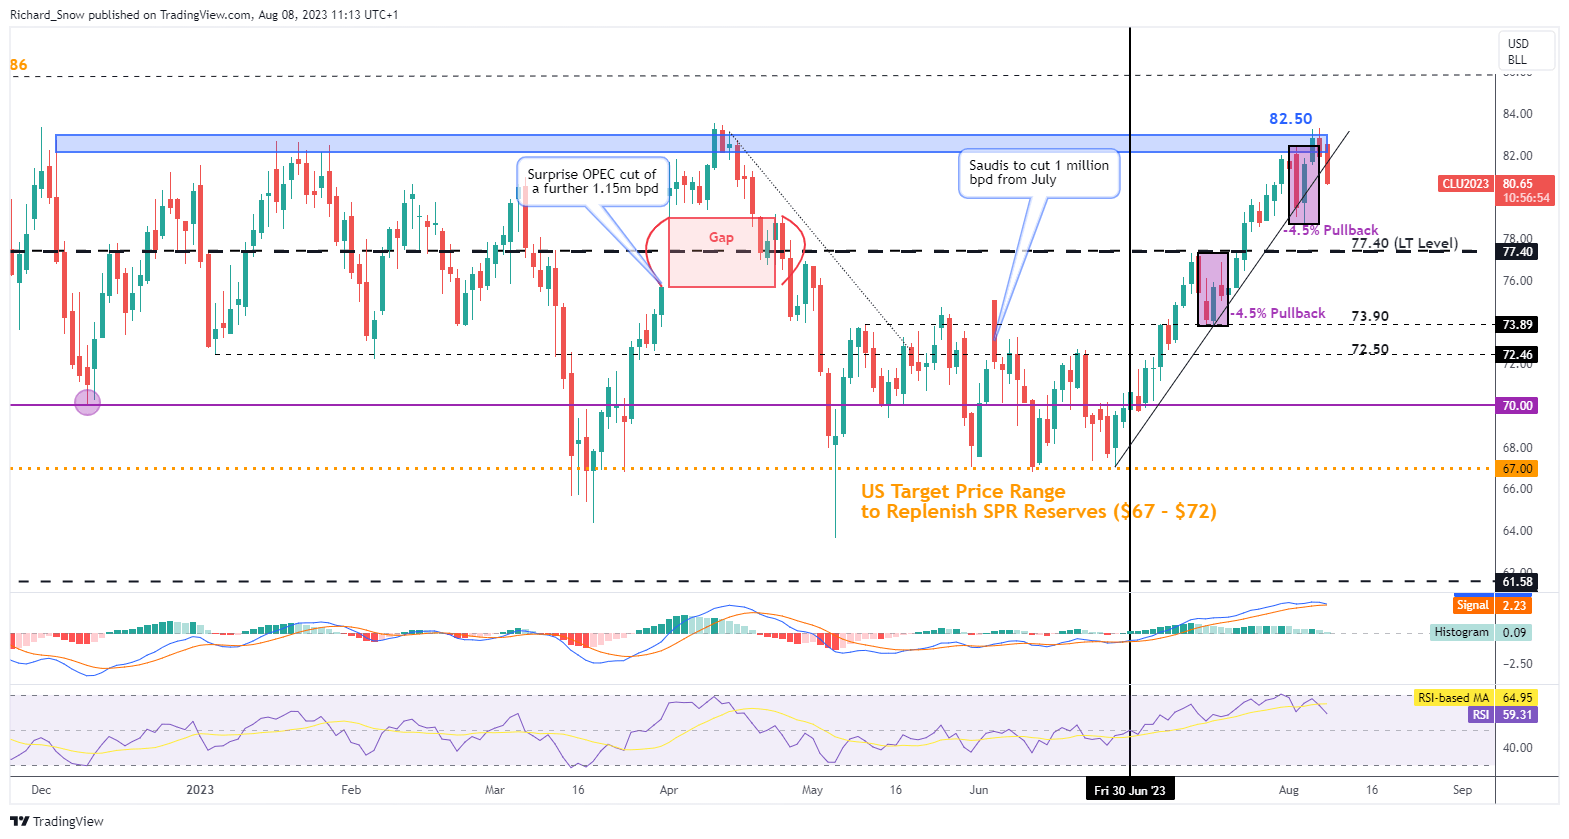
The WTI chart follows Brent lower, breaking trendline support which has characterised the bullish advance which broke out since early July. Saudi Arabia announced that it would be removing a further 1 million barrels per day (bpd) alongside ongoing OPEC supply cuts, hoping to see oil prices head higher.

The bullish advance had taken shape since the Saudi cuts came into effect, which was also supported by a softer dollar in the early stages of July but prices continued to strengthen even as the dollar witnessed strong performance in the lead up to the FOMC announcement. Downside levels of interest appear at $78.70, followed by the long-term level of $77.40. Resistance appears at the prior trendline support, now resistance, followed by $82.50.

WTI Oil Daily Chart

image5.png


Bitcoin Price Latest: BTC/USD Remains Lifeless But Has it Found a Bottom?

Bitcoin Price Latest: BTC/USD Remains Lifeless But Has it Found a Bottom?

Bitcoin continues to show little sign of life with the cash price stuck in a narrow range over the last 10 weeks. Volatility is at a multi-month low with analysts at Bitcoin on-chain data specialists Glassnode pointing out that ‘The 30-day price range is even more extreme, constricting price to just a 9.8% band over the last month, and with only 2.8% of all months being tighter.Periods of consolidation and price compression at this magnitude are extremely rare events for Bitcoin.’ The 14-day ATR volatility indicator is also showing the uber-low levels of current price action and is at a low last seen in early January this year

The BlackRock spot Bitcoin ETF fever that sparked the last round of volatility in mid-June seems to have faded with the SEC not expected to give a decision on any of the spot Bitcoin ETFs until September at the earliest. The low volatility suggests that holders of Bitcoin are not selling ahead of any decision, while buyers remain reticent at current levels.

In other crypto news, online payments giant PayPal announced Monday the upcoming launch of a US dollar-pegged stablecoin PayPal USD (PYUSD). According to the news release, ‘PYUSD is fully backed by U.S. dollar deposits, short-term U.S. treasuries, and similar cash equivalents, and can be redeemed 1:1 for U.S. dollars.’

PayPal Launches U.S. Dollar Stablecoin

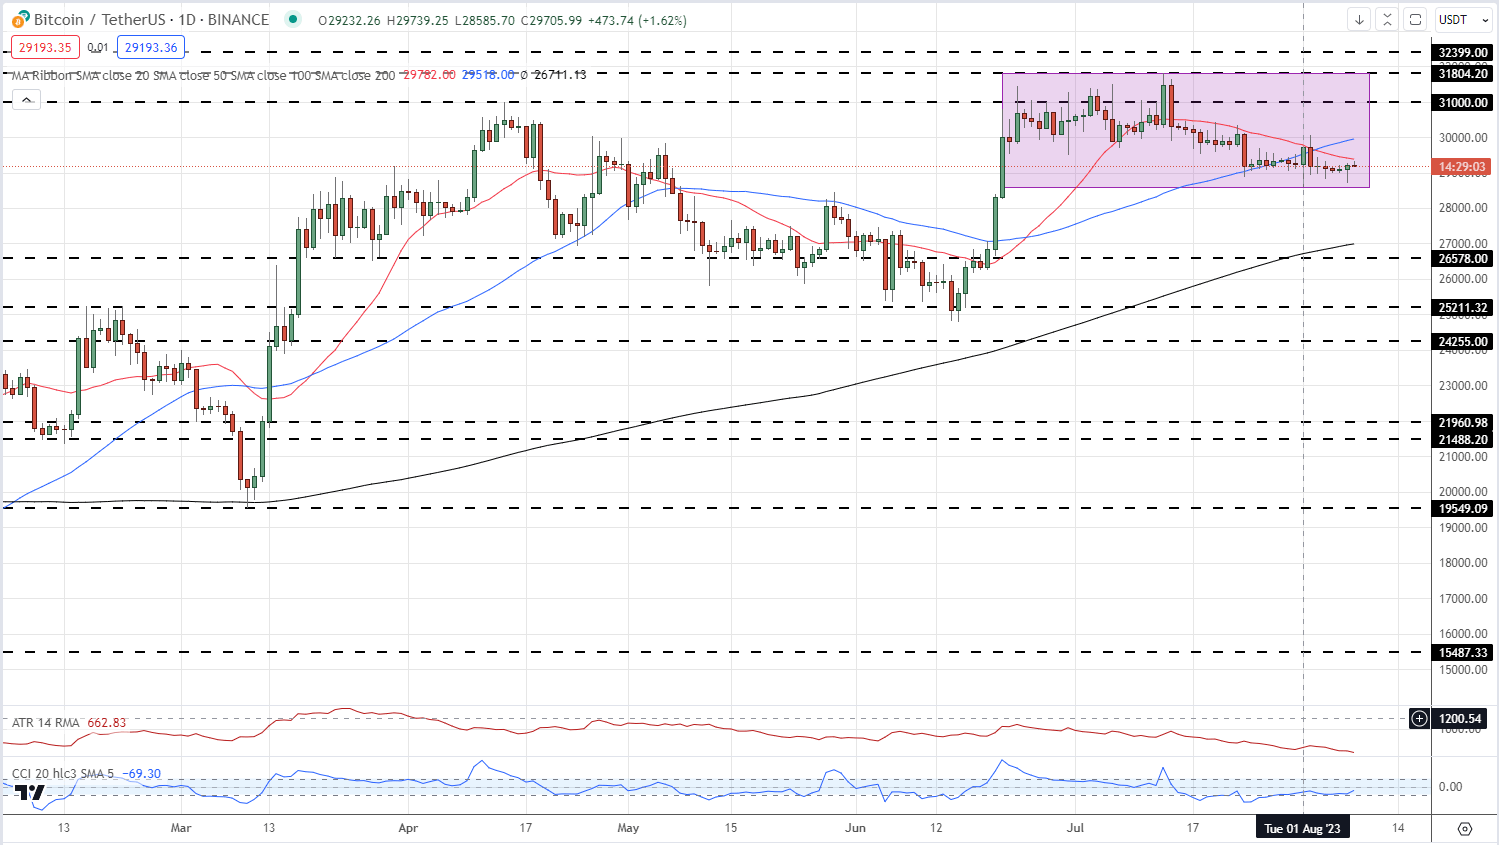
Bitcoin remains stuck in a $28.6k to $31.8k range but sits near the lower end of this range. The outlook remains mixed with the 20-dma crossing below the 50-dma, while BTC/USD is supported by the longer-dated 200-simple moving average. Despite the current low levels of volatility, Bitcoin could easily make a run at either support or resistance in the coming days. To do this there needs to be a fundamental driver as the technical picture is mixed at the moment. Bitcoin may be down, but is definitely not out.

To learn more about range trading download the free guide below

Bitcoin (BTC/USD) Daily Price Chart – August 8, 2023

image1.png

Gold Price Forecast – Gold Continues to Consolidate

Gold Price Forecast – Gold Continues to Consolidate

Gold Price Predictions Video for 09.08.23

Gold Market Technical Analysis

Navigating the gold market can be a challenging task, especially when it exhibits choppy behavior, as was seen during Tuesday’s trading session. Prices were seen hovering around the crucial 50-Day Exponential Moving Average, a technical indicator that holds considerable significance for many traders. While we have broken below it, we are still close enough that it hasn’t changed the overall picture. At the same time, the psychological milestone of the $2000 level looms above, capturing the interest of market participants. However, breaking through this level will likely require substantial momentum and careful consideration.

Trading Derivatives carries a high level of risk to your capital and you should only trade with money you can afford to lose. Trading Derivatives may not be suitable for all investors, so please ensure that you fully understand the risks involved, and seek independent advice if necessary. A Product Disclosure Statement (PDS) can be obtained either from this website or on request from our offices and should be considered before entering into a transaction with us. Raw Spread accounts offer spreads from 0.0 pips with a commission charge of USD $3.50 per 100k traded. Standard account offer spreads from 1 pips with no additional commission charges. Spreads on CFD indices start at 0.4 points. The information on this site is not directed at residents in any country or jurisdiction where such distribution or use would be contrary to local law or regulation.

For investors seeking an upward trend, the current short-term outlook remains choppy and sideways, demanding patience. There is potential support around the $1950 level, with further reinforcement from the 200-Day EMA positioned below. As of now, the $1900 level acts as a firm floor, but a breach below this level could signal a significant trend change, so investors need to be cautious.

Despite a recent pullback, buyers seem eager to support the market, evident as we observe fluctuations around the 50-Day EMA. Crossing above the Friday candlestick’s high could open up the possibility of reaching the coveted $2000 level. However, this journey may not be without challenges, as volatility could increase, making it prudent for traders to maintain reasonable position sizes.

From a technical analysis perspective, the market’s current pattern might resemble a “bullish flag,” indicating the potential for further upward momentum. Nonetheless, it is essential to exercise caution, as the gold market is known for its volatility. Jumping “all in” right away can lead to significant losses in this environment, so it is wise to be cautious and measured in your approach.

One important factor to closely monitor is the performance of the US dollar, as it often exhibits a negative correlation with gold. However, this correlation is not absolute and can diverge, especially during times when investors seek safe-haven assets. Therefore, it is crucial to be aware of any panic or major negativity in the overall attitude of traders in the near term, as psychological factors can influence the market.

In the end, navigating the gold market at present requires a careful and patient approach, given its choppy nature and proximity to key technical levels. The 50-Day EMA and the $2000 level are of utmost importance, influencing short-term price movements. Traders should exercise patience and remain vigilant, considering potential support levels and maintaining reasonable position sizes.

US Dollar Index News: DXY Soars Amid China’s Trade Woes, Euro Weakness

US Dollar Index News: DXY Soars Amid China’s Trade Woes, Euro Weakness

Overview

The U.S. dollar surged in comparison to major global currencies after dismal trade data from China and declining European demand, while the spotlight is set on the U.S.’s upcoming inflation data for a potential market shake-up.

China’s Dim Trade Figures

A worrisome decline was observed in China’s July trade data with imports plunging by 12.4% year-on-year and exports falling by 14.5%. This spells another indication of China’s struggling economic rebound and a subdued worldwide demand. The yuan reacted swiftly, with the offshore yuan hitting a 2.5-week low, and the onshore yuan dropping to a two-week nadir.

Trading Derivatives carries a high level of risk to your capital and you should only trade with money you can afford to lose. Trading Derivatives may not be suitable for all investors, so please ensure that you fully understand the risks involved, and seek independent advice if necessary. A Product Disclosure Statement (PDS) can be obtained either from this website or on request from our offices and should be considered before entering into a transaction with us. Raw Spread accounts offer spreads from 0.0 pips with a commission charge of USD $3.50 per 100k traded. Standard account offer spreads from 1 pips with no additional commission charges. Spreads on CFD indices start at 0.4 points. The information on this site is not directed at residents in any country or jurisdiction where such distribution or use would be contrary to local law or regulation.

US Trade Landscape

In contrast, the U.S. trade deficit reduced by 4.1% to $65.5 billion in June, signaling a potential slowdown in domestic demand. This contraction was influenced by the decline of goods and services imports to their lowest since November 2021. The economy exhibited a growth of 2.4% annually in the last quarter, despite trade playing a minimal role.

Currency Dynamics

With the greenback shining, other currencies faced downturns. The dollar index lifted by 0.5% to 102.59, moving past Friday’s tepid U.S. jobs report. In Europe, the sterling and euro both depreciated by 0.5% against the dollar. The U.S. dollar also marked a 0.6% increase against the yen. Interestingly, Japan saw a continuous drop in real wages for the 15th month, presenting a conundrum for the Bank of Japan.

Upcoming Market Influencers

All eyes are set on the forthcoming U.S. inflation data. Predictions suggest a 4.8% annual rise in core consumer prices for July. This crucial data may sway the market either way, rendering it essential for sentiments preceding Federal Reserve meetings in September and October.

Short-term Outlook:  Robust

Amid fluctuating global trade dynamics, the U.S. dollar stands robust. However, with upcoming pivotal data, traders and markets remain on their toes, eager to discern future economic trajectories.

Technical Analysis

4-Hour US Dollar Index (DXY)

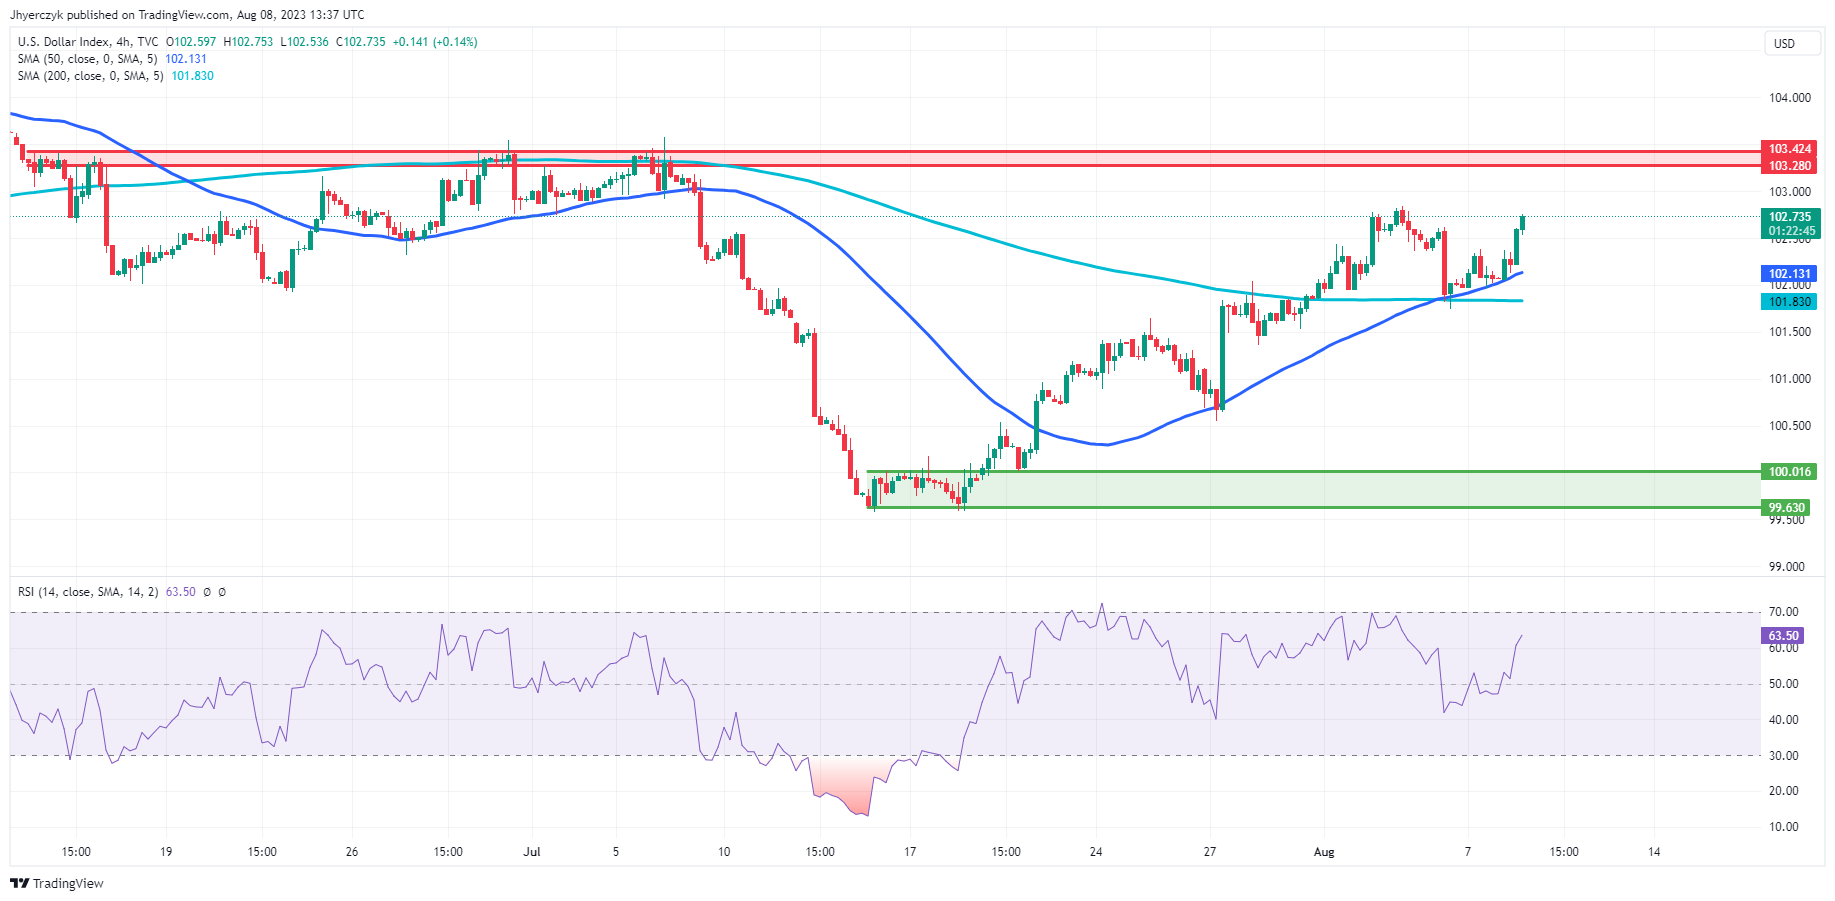
The US Dollar Index (DXY) is currently positioned at 102.725, showing an increment from its prior 4-hour price of 102.594. Its location between the 50-4H moving average of 102.130 and the 200-4H moving average of 101.830 suggests it has recently breached the shorter-term average, indicating bullish momentum. The 14-4H RSI at 63.16 is above the midpoint of 50, further underscoring this momentum without reaching overbought territory.
DXY’s current price resides above the main support region of 100.016 to 99.630 but hasn’t touched the main resistance span of 103.280 to 103.424. Considering these metrics, the market sentiment for DXY appears bullish.
EUR/USD Forecast – Euro Pulls Back

EUR/USD Forecast – Euro Pulls Back

EUR/USD Forecast Video for 09.08.23

Euro vs US Dollar Technical Analysis

The Euro has fallen significantly during the trading session on Tuesday, as we have sliced through the 50-Day EMA. The 1.09 level underneath continues to offer support, and I do think that a lot of people will pay close attention to it. That is right in the middle of the 50-Day EMA and the 200-Day EMA indicators, suggesting that we could see a lot of noisy behavior and of course a lot of potential support. With that being the case, the market also has to pay close attention to the uptrend line just underneath there as well, so it all makes quite a bit of sense that we would see that as the “bottom of the trend.”

Trading Derivatives carries a high level of risk to your capital and you should only trade with money you can afford to lose. Trading Derivatives may not be suitable for all investors, so please ensure that you fully understand the risks involved, and seek independent advice if necessary. A Product Disclosure Statement (PDS) can be obtained either from this website or on request from our offices and should be considered before entering into a transaction with us. Raw Spread accounts offer spreads from 0.0 pips with a commission charge of USD $3.50 per 100k traded. Standard account offer spreads from 1 pips with no additional commission charges. Spreads on CFD indices start at 0.4 points. The information on this site is not directed at residents in any country or jurisdiction where such distribution or use would be contrary to local law or regulation.


If we turn around and rally from here, the 1.10 level is an area where you would see a lot of psychological resistance, and an area that has been resistance previously anyway. After that, then we could go looking to the 1.1250 level, which is where the market had recently run out of momentum. That resistance could make a nice target, but at this point we need to see some type of major turnaround to pick up enough momentum to get to that area, but it is something worth paying attention to.

If we were to break below the uptrend line, then the market could drop down to the 1.06 level, which of course is an area where we had seen a lot of noise previously, but quite frankly if we break down below that uptrend line, it would not surprise me at all to see the euro drop even further. A lot of this is going to come down to whether or not the Federal Reserve remains tight for as long as they state that they are going to, which at this point in time there’s no reason to doubt that, but the market has seen that to be the case occasionally.

At this point in time, I do think that there is only a matter of time before we have to sort things out, but in the short term it looks like we are going to continue to see a lot of choppy volatility.

Natural Gas Forecast: Futures Approaching June Peak Amid Rising Demand

Natural Gas Forecast: Futures Approaching June Peak Amid Rising Demand

Overview

U.S. natural gas futures are nearing their June 26 high of 2.878, a pivotal point for potential upward acceleration. As of 11:33 GMT, the commodity was trading at 2.719, marking an increase of 0.59%. This uptick can be attributed to warmer weather forecasts for the next couple of weeks, pushing national demand higher. According to NatGasWeather, weather predictions for August 13-20 remain significantly warm, suggesting that surpluses may see a decline in the upcoming weeks, tightening the supply-demand balance.

Weather Forecasts Call for High Demand

Weather forecasts from August 7-13 indicate high pressure prevailing in the southern U.S., with temperatures soaring between the upper 80s and 110s, particularly from California to Texas. In contrast, the northern U.S. will experience cooler weather systems, with highs ranging between 70s and 80s. By the weekend, the East will warm up, showing a temperature increase to mid-80s to 90s. Given these conditions, demand will likely shift from seasonal to high, especially during the weekends.

Trading Derivatives carries a high level of risk to your capital and you should only trade with money you can afford to lose. Trading Derivatives may not be suitable for all investors, so please ensure that you fully understand the risks involved, and seek independent advice if necessary. A Product Disclosure Statement (PDS) can be obtained either from this website or on request from our offices and should be considered before entering into a transaction with us. Raw Spread accounts offer spreads from 0.0 pips with a commission charge of USD $3.50 per 100k traded. Standard account offer spreads from 1 pips with no additional commission charges. Spreads on CFD indices start at 0.4 points. The information on this site is not directed at residents in any country or jurisdiction where such distribution or use would be contrary to local law or regulation.

Furthermore, meteorological predictions anticipate the weather across the Lower 48 states to remain hotter than average until at least August 19. Consequently, data from Refinitiv suggests that the U.S. gas demand, inclusive of exports, will ascend from 102.4 billion cubic feet per day (bcfd) to 105.8 bcfd in the forthcoming week. This surge in demand arises as power generators ramp up fuel usage and exports witness an uptick.

LNG Export Demand Lower in August

However, it’s essential to note that the average gas output in the U.S. Lower 48 states for August was 102.2 bcfd, a slight increase from July’s 101.8 bcfd, equating the record set in May. In comparison, gas flows to the major U.S. LNG export plants have dipped marginally this month, primarily due to reductions at Cheniere Energy’s Sabine Pass in Louisiana.

Short-Term Outlook:  Cautiously Bullish

In light of the warmer forecasts and rising demand, the short-term outlook for U.S. natural gas futures remains bullish, but traders should stay vigilant of fluctuating export figures.

Technical Analysis

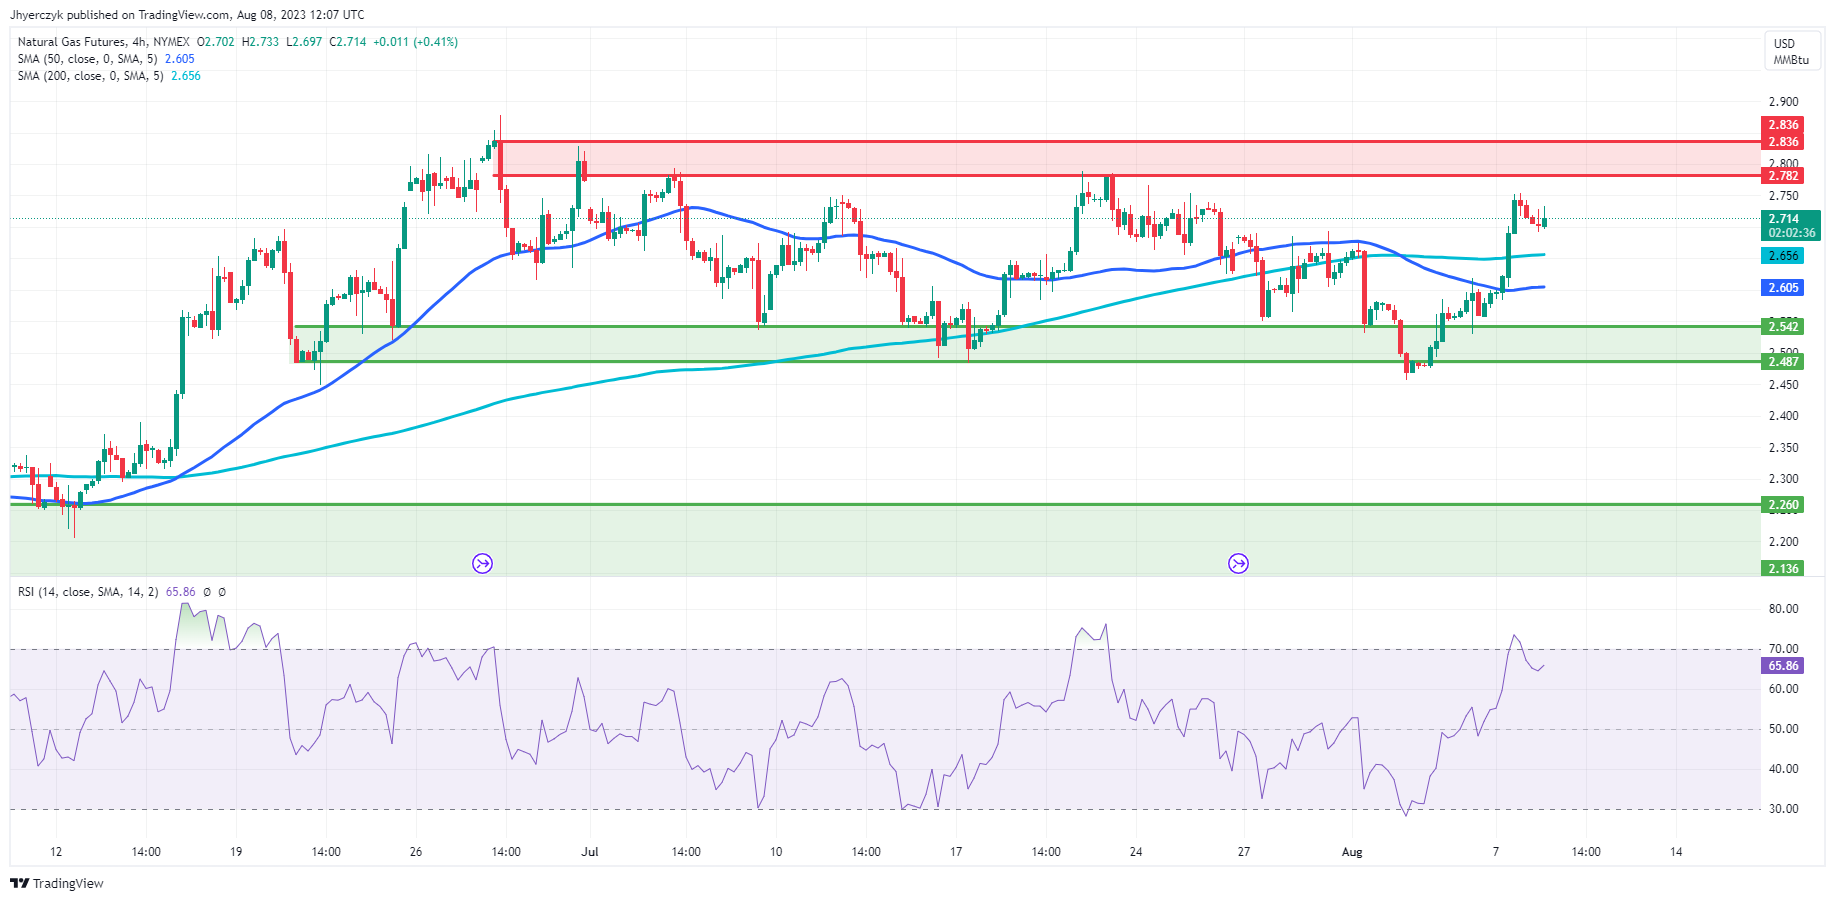
4-Hour Natural GasNatural Gas’s current 4-hour price of 2.709 indicates a marginal increase from the previous 4-hour level of 2.703, suggesting a subtle bullish inclination. Observing the moving averages, the present price remains above both the 200-4H moving average at 2.656 and the 50-4H moving average at 2.605, reinforcing this bullish trend.

The bullish sentiment is further supported by the 14-4H RSI, which, at 66.70, leans towards the overbought region, denoting stronger momentum.

Notably, the commodity’s price is closer to its main resistance range of 2.782 to 2.836 than the main support zone of 2.542 to 2.487, indicating a potential challenge ahead.

These technical indicators suggest that the short-term market sentiment for Natural Gas leans bullish, but traders should exercise caution because of the nearby resistance.

NASDAQ 100, Dow Jones, S&P 500: Weak as Moody’s Sounds Alarm on Banks

NASDAQ 100, Dow Jones, S&P 500: Weak as Moody’s Sounds Alarm on Banks

Overview

Stock futures suffered on Tuesday, failing to ride on the coattails of Wall Street’s earlier optimism. With futures for the Dow Jones, S&P 500, and Nasdaq 100 all dipping, bank shares took a considerable hit after Moody’s decision to downgrade various banks, signaling concerns in the banking sector.

Banks Under the Microscope

Moody’s, the esteemed credit rating agency, lowered ratings for 10 banks, while keeping heavyweights like Bank of New York Mellon and U.S. Bancorp under close review. Reasons cited by Moody’s analysts Jill Cetina and Ana Arsov revolve around growing profitability pressures for banks due to rising interest rate risks and challenges in asset-liability management. Moreover, a potential mild U.S. recession in 2024 could result in asset quality declines, with commercial real estate portfolios emerging as a particular area of concern. The effects were immediately seen with shares of major banks, including JPMorgan Chase, Goldman Sachs, and Citigroup, declining in premarket trading.

Trading Derivatives carries a high level of risk to your capital and you should only trade with money you can afford to lose. Trading Derivatives may not be suitable for all investors, so please ensure that you fully understand the risks involved, and seek independent advice if necessary. A Product Disclosure Statement (PDS) can be obtained either from this website or on request from our offices and should be considered before entering into a transaction with us. Raw Spread accounts offer spreads from 0.0 pips with a commission charge of USD $3.50 per 100k traded. Standard account offer spreads from 1 pips with no additional commission charges. Spreads on CFD indices start at 0.4 points. The information on this site is not directed at residents in any country or jurisdiction where such distribution or use would be contrary to local law or regulation.

Federal Reserve & Interest Rates

Complicating the banking landscape is the Federal Reserve’s decision to raise its borrowing rate to between 5.25% and 5.5% in a move to combat inflation. According to Moody’s, this rate hike might pose further challenges to banks, particularly regional ones with lower regulatory capital. Banks’ assets, especially those fixed-rate, might feel the heat, and any onset of a recession could exacerbate these pressures.

Earnings Impacts

Aside from the banking turbulence, corporate earnings are showing promise. About 86% of S&P 500 companies have reported quarterly results, with a majority surpassing Wall Street expectations. However, UPS shares saw a 5.6% dip after reporting lower-than-anticipated revenue. In contrast, educational tech firm Chegg and Restaurant Brands International witnessed positive financial outcomes.

Short-term Outlook

With U.S. Treasury yields adjusting and significant economic data, such as July’s consumer price index report set for release, Wall Street remains on its toes. Moody’s warning on potential risks in the banking sector, coupled with looming interest rate challenges, paints a cautious, if not bearish, short-term forecast for the financial sector.