High Real Yields Starting to Bite Gold? XAU/USD Price Setup Ahead of US CPI

High Real Yields Starting to Bite Gold? XAU/USD Price Setup Ahead of US CPI

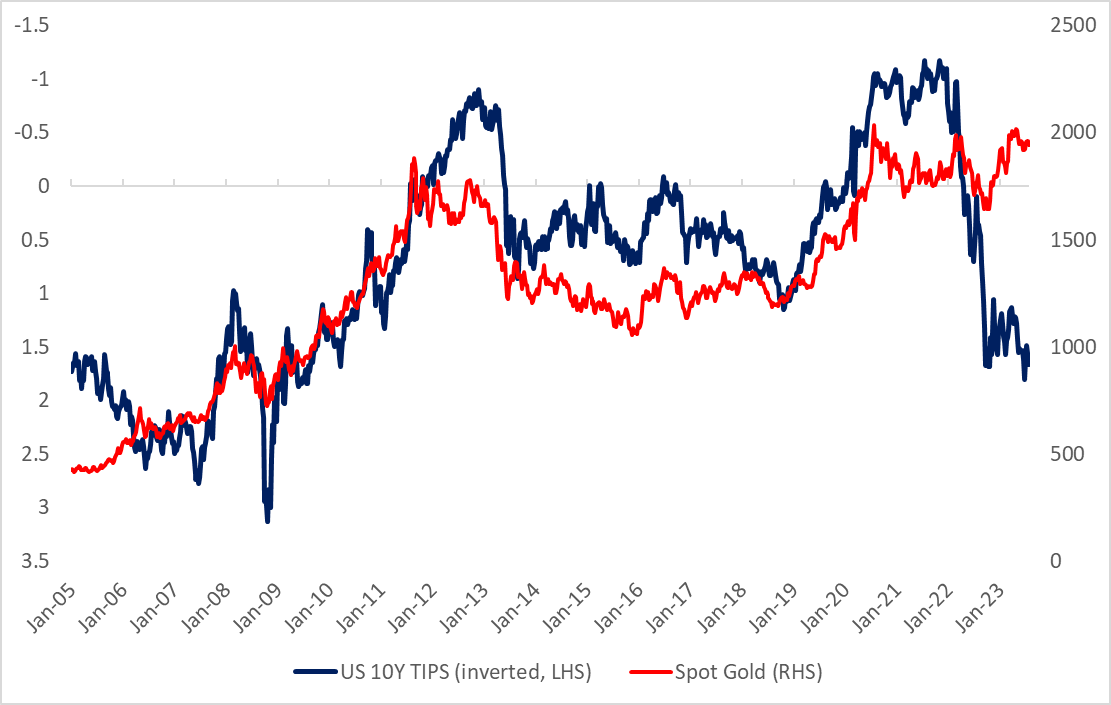
Higher real rates could be starting to finally weigh on gold prices. Real yields have been elevated on rising nominal interest rates, moderating price pressures/inflation expectations amid the growing perception of the ‘higher-for-longer-rates’ theme.

Gold Vs US 10-Year TIPS yield

image1.png

Source Data: Bloomberg; chart created in Microsoft Excel

In contrast, gold has stayed broadly in a range, widening the gap with real yields. Gold is a non-interest, non-coupon-bearing asset, and positive real yields tend to increase the opportunity cost of holding the zero-yielding yellow metal.

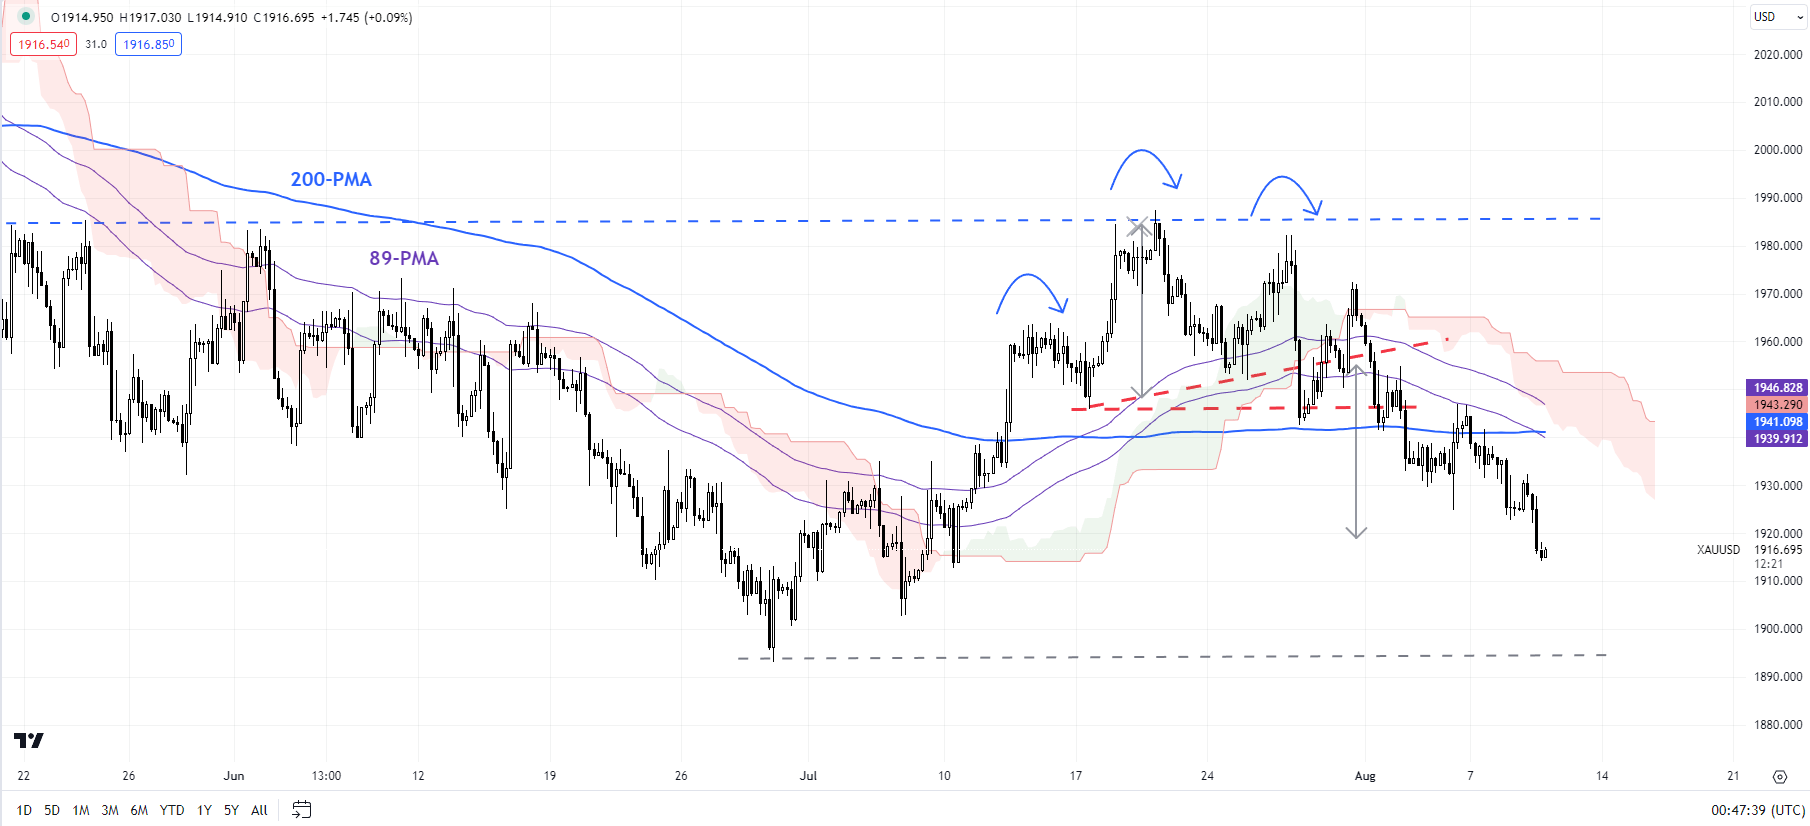
XAU/USD 240-minute Chart

image2.pngOn technical charts, XAU/USD fall below crucial converged support, including the mid-July low of 1945 and the late-July lows of 1953, has opened the way toward the June low of 1892 – a risk pointed out in the previous update. See “Gold and Silver Forecast: Rate Hikes Weigh on XAU/USD, XAG/USD,” published July 30. The lower-top-lower-bottom since late July indicates the June-July uptrend is over as indicated on the four-hour chart. (See the 240-minute chart.)

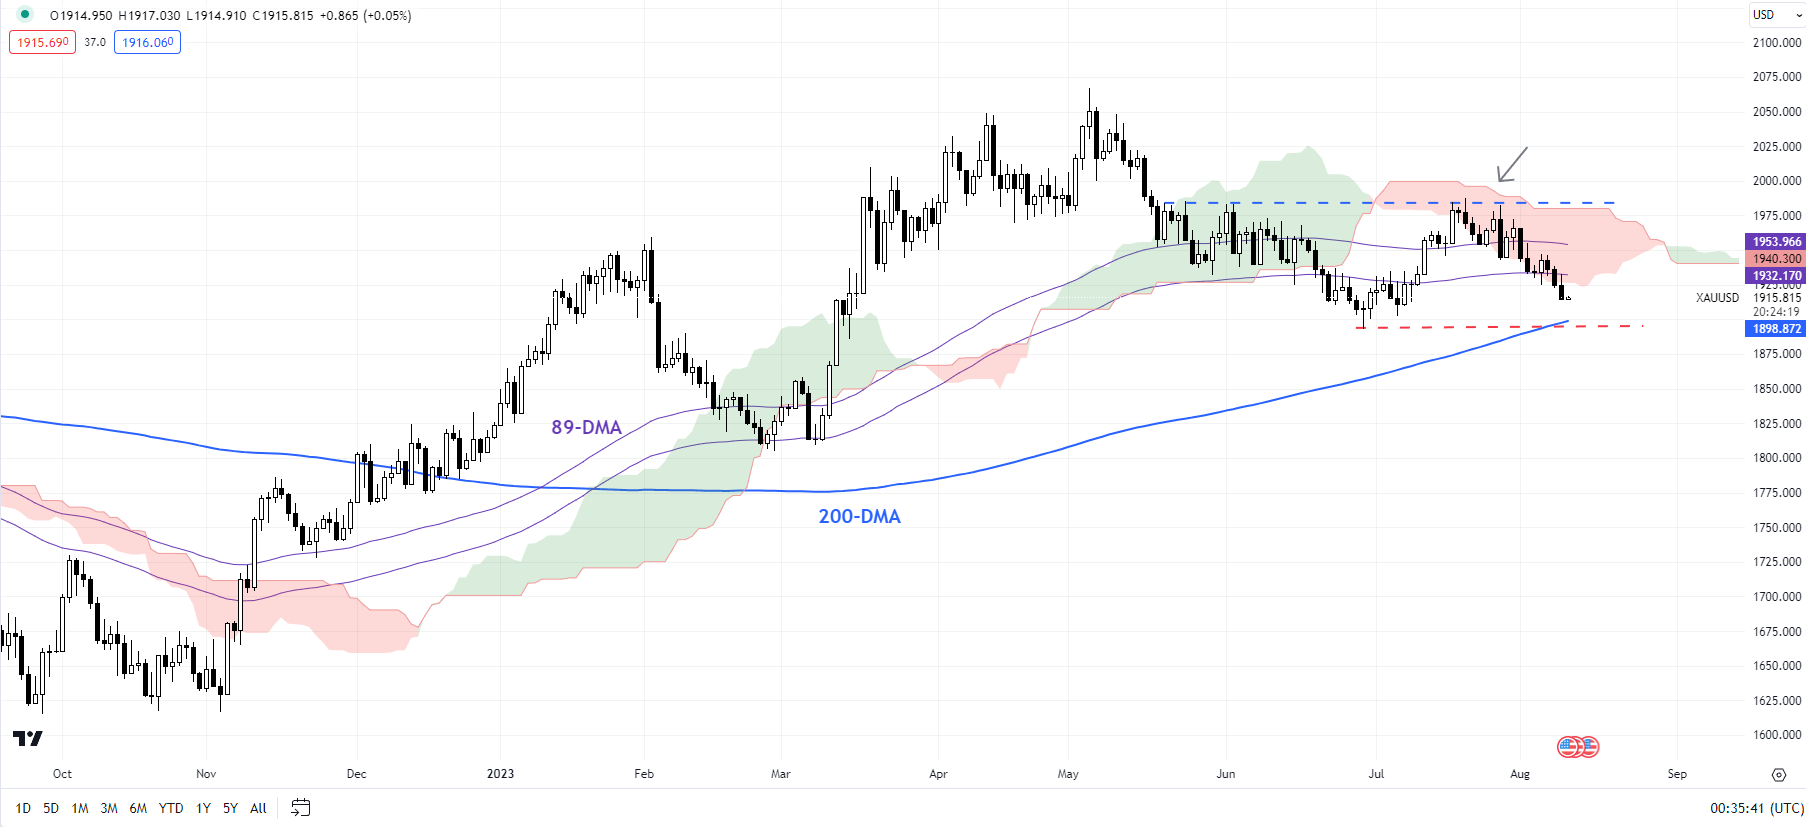
XAU/USD Daily Chart

image3.png

This follows a failed attempt in mid-July to rise above stiff resistance at the early-June high of 1983, slightly below the upper edge of the Ichimoku cloud on the daily charts – a risk pointed out in late July. See “Is Gold’s Rebound Over Ahead of FOMC? XAU/USD Price Setups,” published July 25.

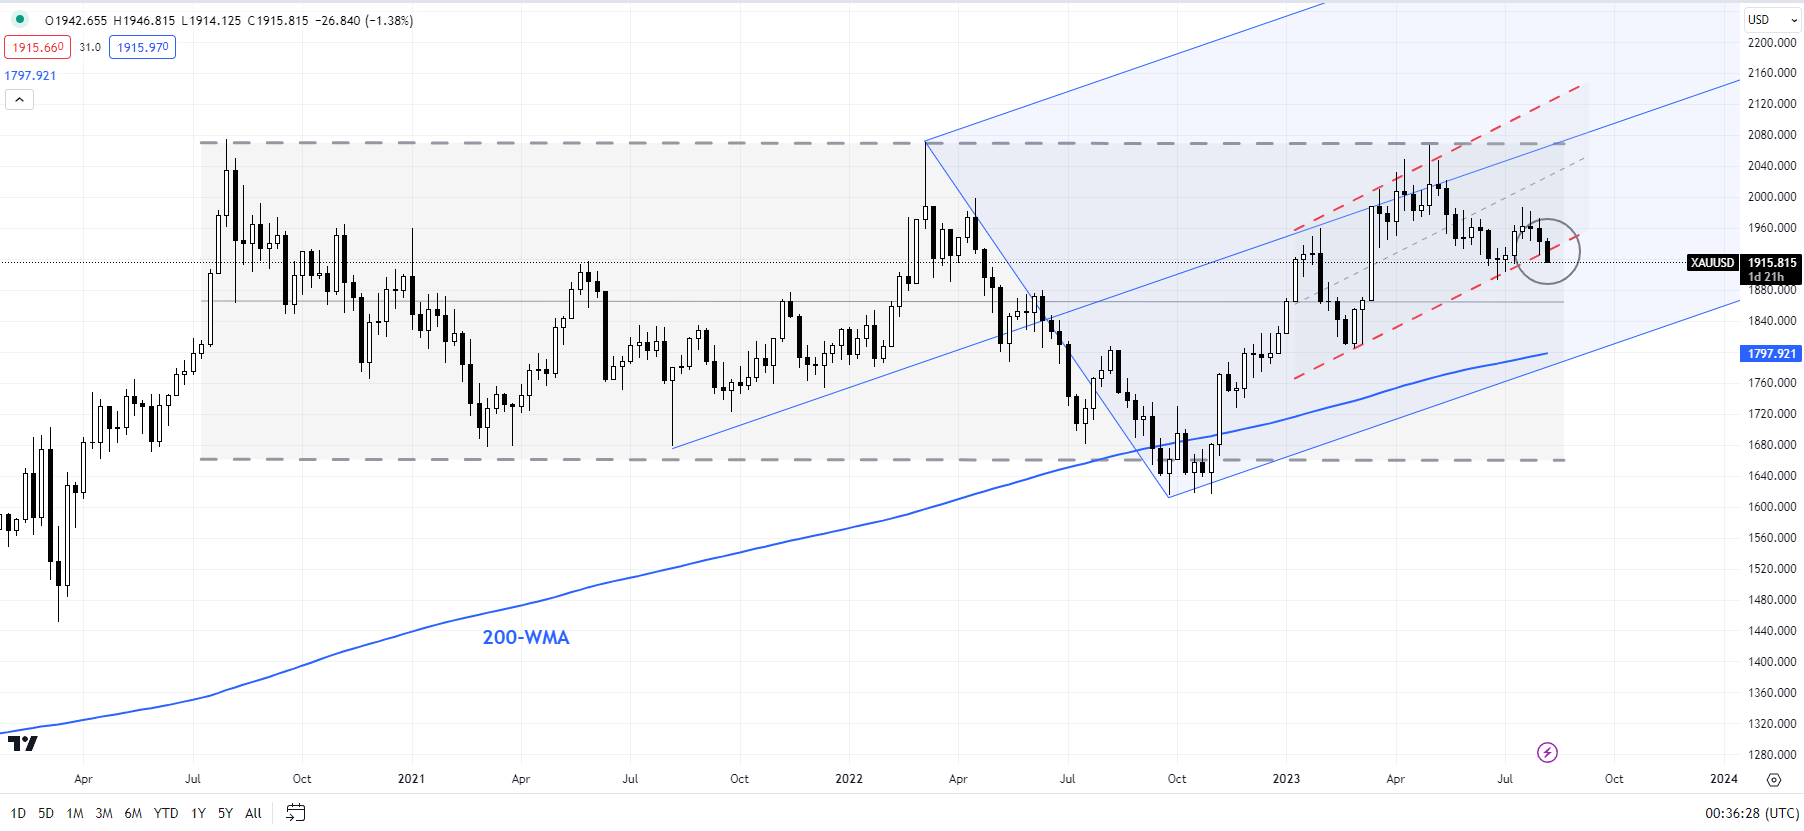
XAU/USD Weekly Chart

image4.png

XAU/USD is now testing a vital cushion on the 200-day moving average, the June low, and the lower edge of a rising channel since early 2023 (see the weekly chart). Any break below could pave the way toward the February low of 1805. Importantly, it would reinforce the bearish developments on higher timeframe charts in recent months. See “Gold Could Find It Tough to Crack $2000”,published March 28, and “Gold Weekly Forecast: Is it Time to Turn Cautious on XAU/USD?” published April 16.

Crude Oil Catapults to New Highs While the US Dollar Steadies Ahead of CPI. Higher WTI?

Crude Oil Catapults to New Highs While the US Dollar Steadies Ahead of CPI. Higher WTI?

The crude oil price has reclaimed levels not seen since November last year despite inventory data revealing a surge in stockpiles.

The American Petroleum Institute (API) report showed that 4.067 million barrels were added to storage for the week ended August 4th.

It comes after a notable depletion in the week prior of -15.4 million barrels. The US Energy Information Agency (IEA) report later today will be watched for hints on the state of play for oil reserves.

The WTI futures contract is near US$ 84.50 bbl while the Brent contract is oscillating around US$ 87.50 bbl.

Energy markets have caught a bid with liquefied natural gas prices (LNG) surging on the prospect of strike action in Australia at Woodside Energy Group and Chevron. The operations in the northwest of the continent are a large supplier to global markets.

Currency markets have been relatively subdued going into Thursday although the Japanese Yen has struggled again today. USD/JPY is climbing over 144.00 and EUR/JPY has printed a fresh 15-year high above 158.00.

The weaker Yen has Japanese banking stocks take a hit. Other APAC equity markets are mixed with the largest move among the major indices being Hong Kong’s Hang Seng Index (HSI), down around 1%.

Spot gold is languishing near overnight lows at US$ 1,916 at the time of going to print.

US CPI will be the focus for markets ahead and there will also be several Fed speakers crossing the wires that could cause market gyrations.

WTI CRUDE OIL TECHNICAL ANALYSIS SNAPSHOT

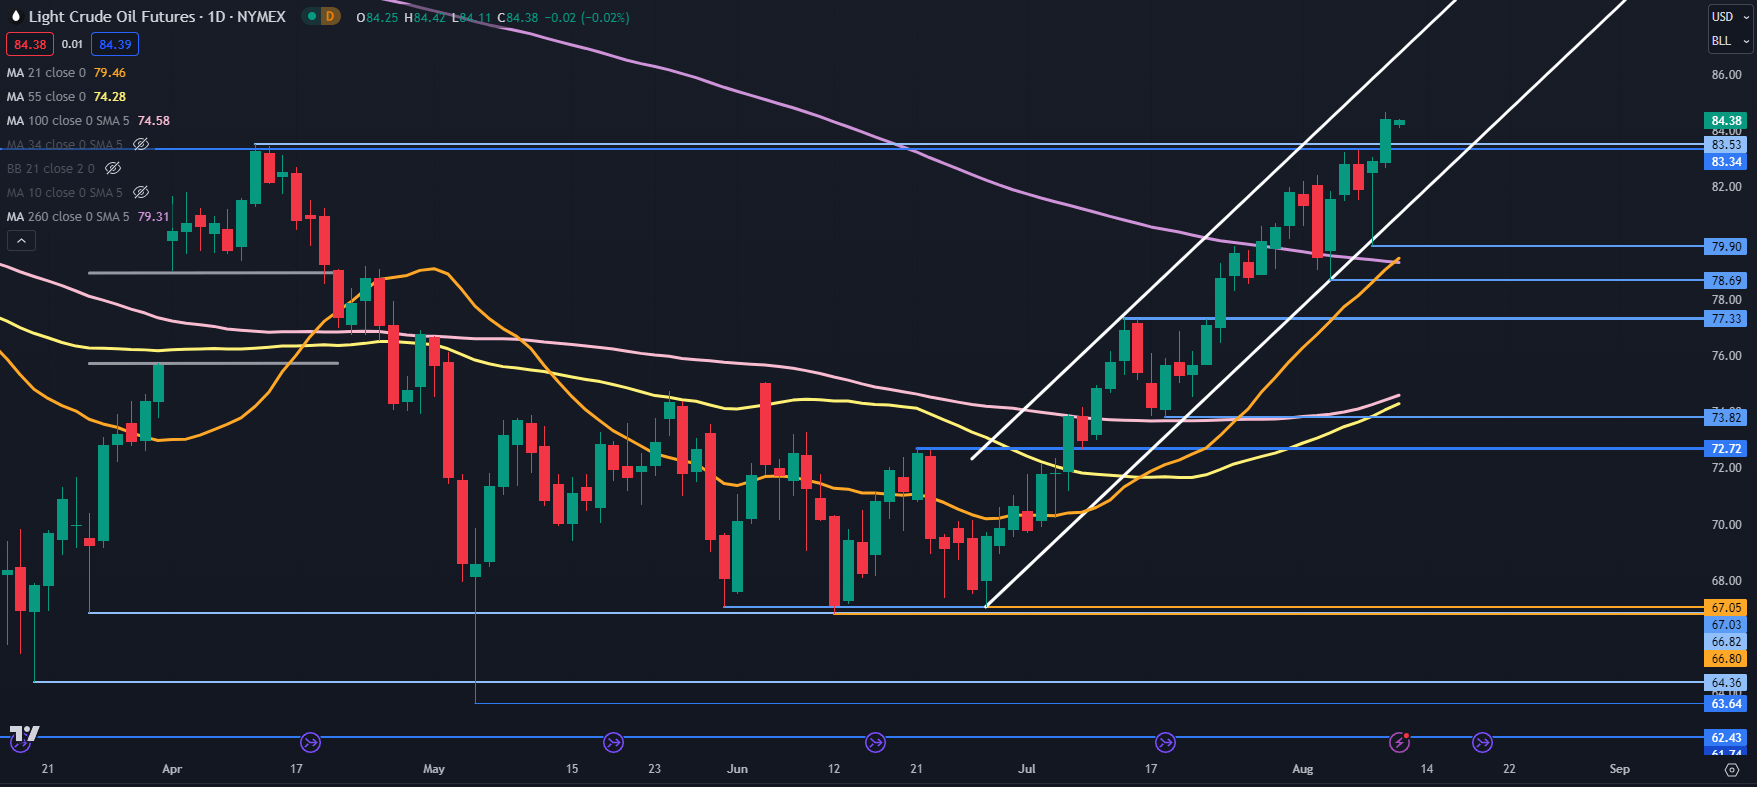
The WTI futures contract remains in an ascending trend channel after it broke above several resistance levels in the last few sessions.

The price action today this week has seen the 21-day simple moving average (SMA) cross above the 260-day SMA to form a Golden Cross. It might imply that bullishness is still evolving.

On the downside, support may lie at the recent lows of 49.90 and 78.69. Further down, support could be at the breakpoint of 77.33 and the prior low at 73.82.

The latter also has the 55- and 100-day SMA in the vicinity and they may lend support.

image1.png


Bitcoin & Ethereum Hold Ground Ahead of US CPI: BTC/USD & ETH/USD Price Setups

Bitcoin & Ethereum Hold Ground Ahead of US CPI: BTC/USD & ETH/USD Price Setups

BITCOIN: Renewed base?

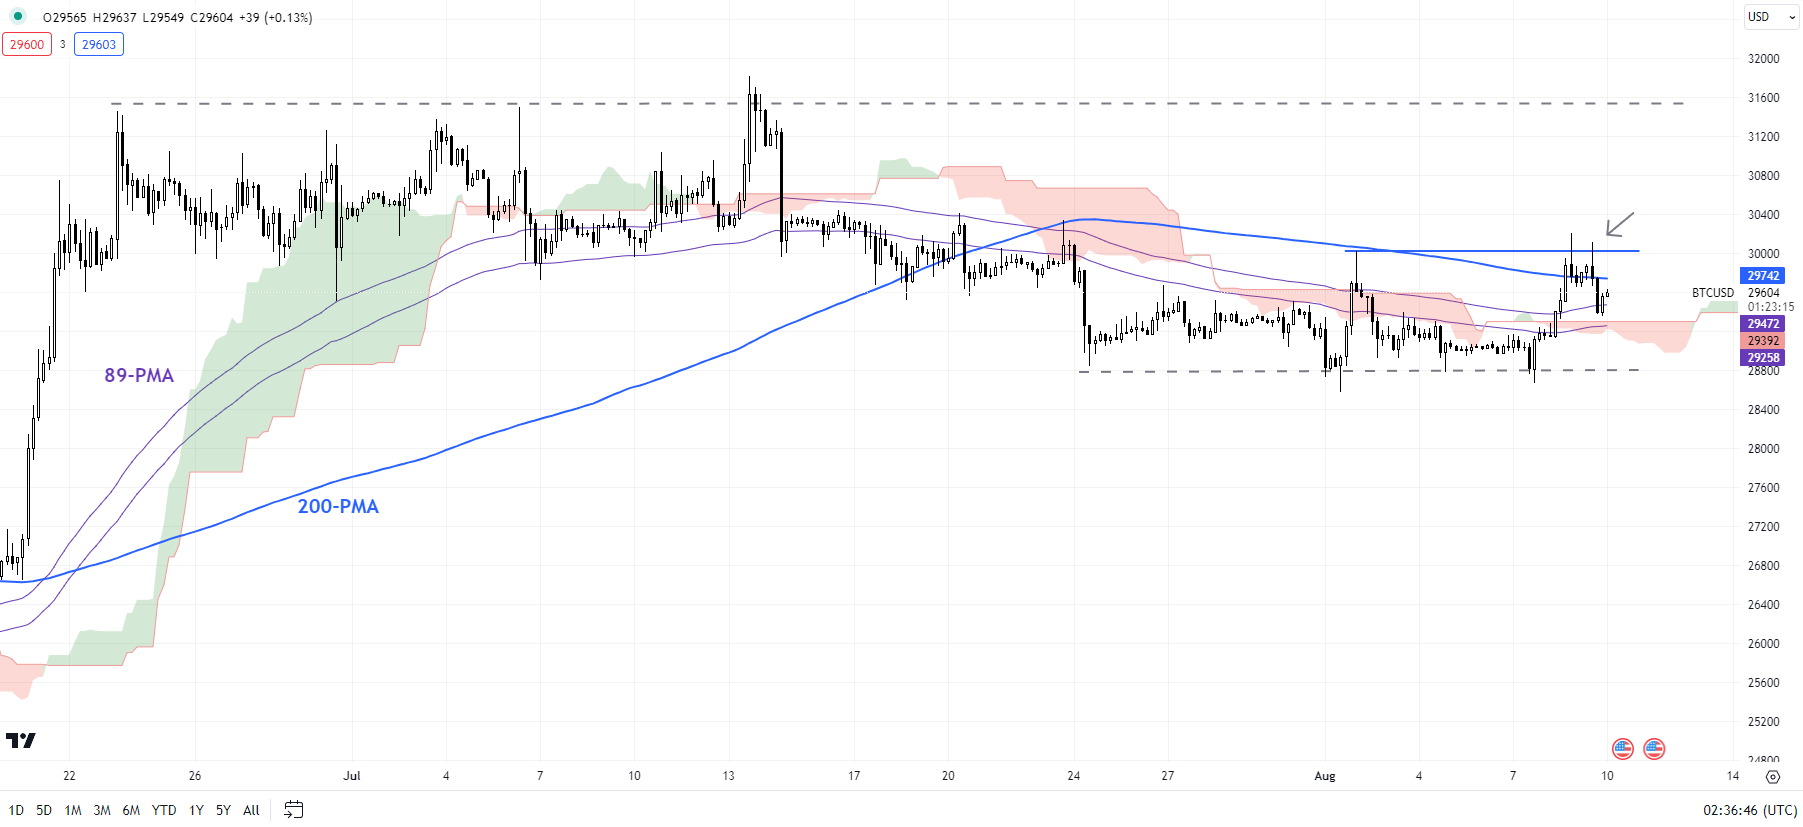
On the daily charts, despite the recent softness, BTC/USD has managed to hold quite strong support around 28500, roughly coinciding with the 89-day moving average and the lower edge of the Ichimoku cloud on the daily charts.

BTC/USD 240-Minutes Chart

image1.png

Importantly, the fall in realized volatility hasn’t altered the higher-top-higher-bottom sequence established late last year, suggesting the interim trend remains up. Only a break below the June low of 24750 would trigger a reassessment of the overall bullish bias.

BTC/USD Weekly Chart

image2.png

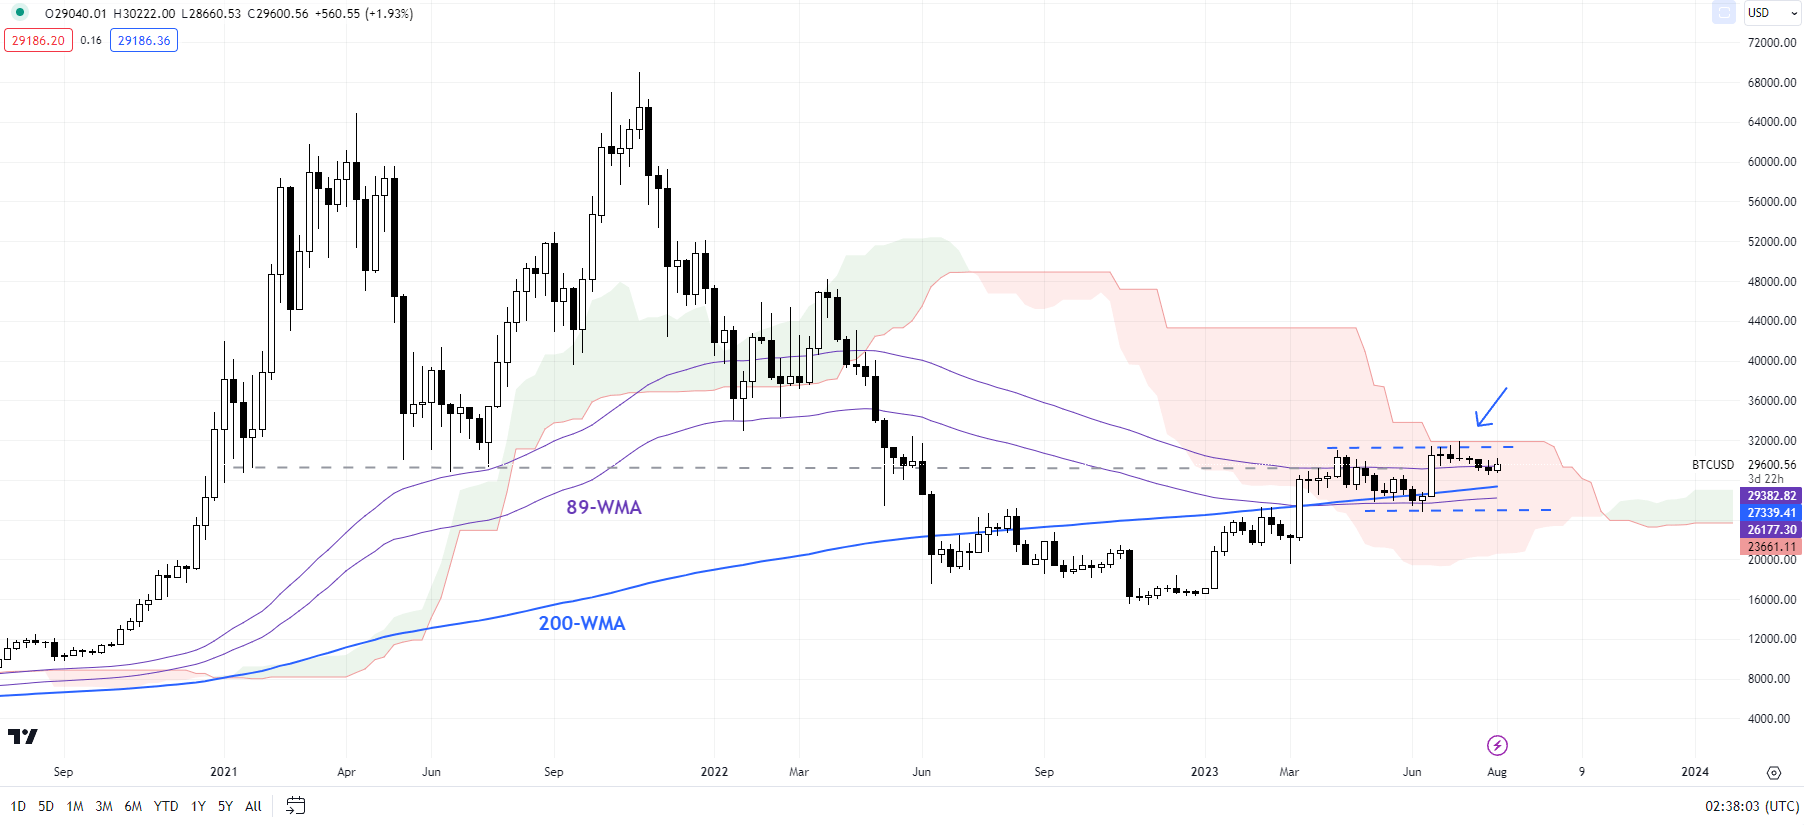
On the top side, as highlighted in the previous update, BTC/USD has been weighed by a key converged barrier at the April high of around 31000, coinciding with the 89-week moving average and the upper edge of the Ichimoku cloud on the weekly chart. See “Could the Fed Trigger a Deeper Retreat in Bitcoin & Ethereum? BTC/USD & ETH/USD Price Action,” published July 26. A break above the converged barrier would be a strong signal that the bearish pressure from 2021 is rising. Such a move could open the door toward 40000.

ETH/USD Daily Chart

image3.png

ETHEREUM: At trendline support

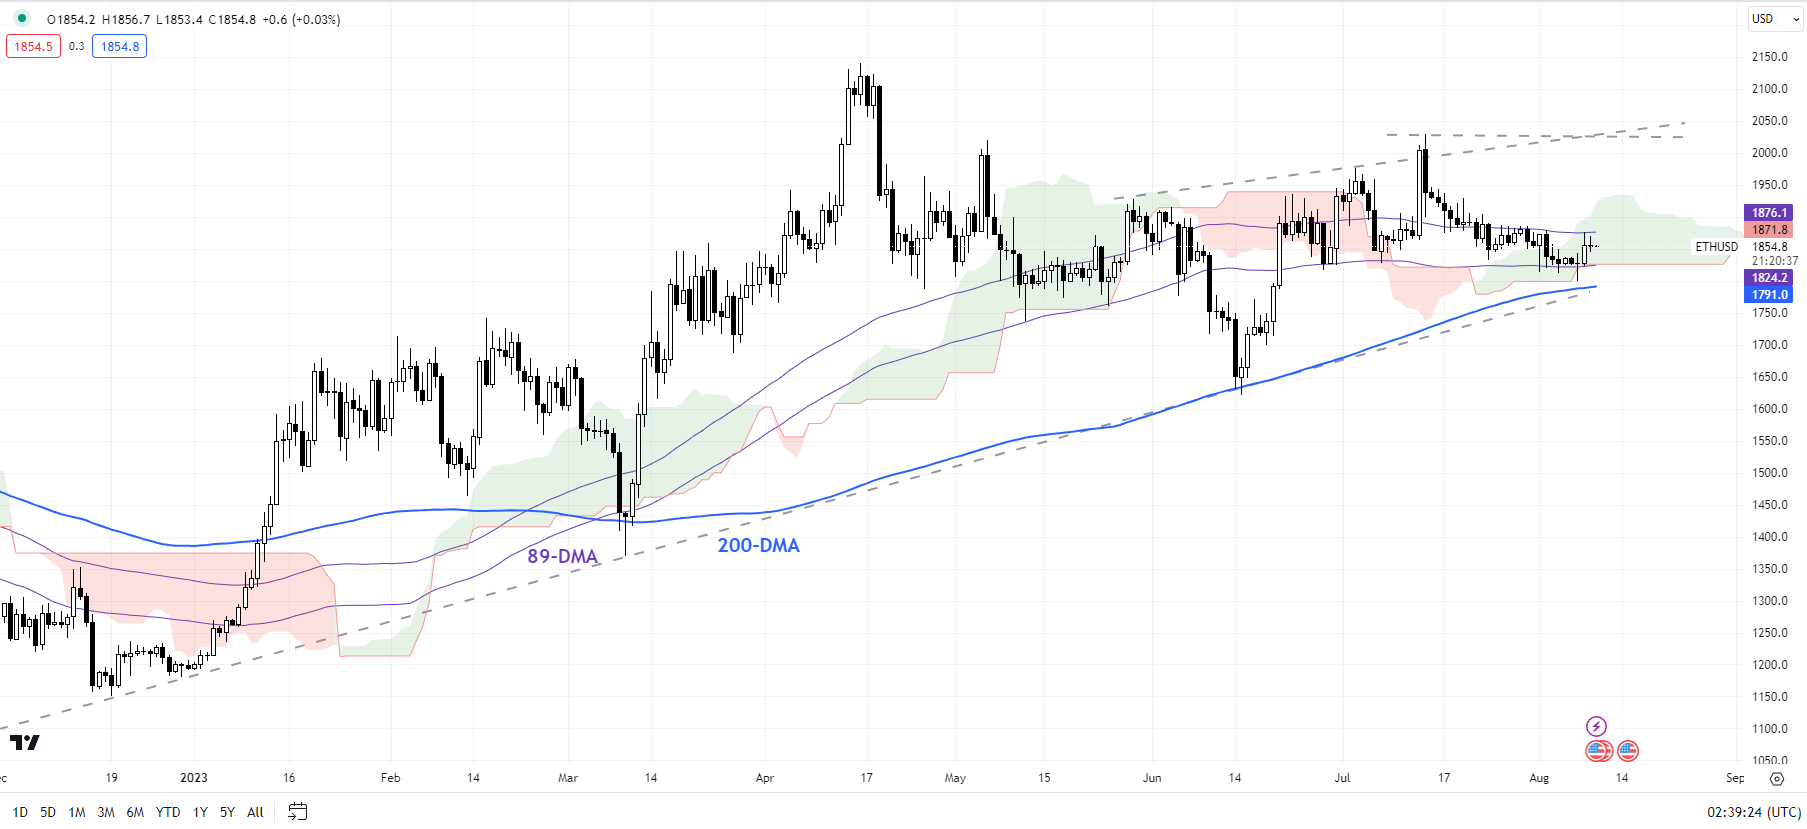
After the sharp rise from the end of June, ETH/USD’s uptrend appears to have stalled. The recent minor retreat has brought ETH/USD toward strong converged support, including the 200-day moving average, and the 89-day moving average. Importantly, it holds above major support at the June low of 1620. The interim bias (from the end of 2022) remains up while this support is intact. On the upside, the May and July highs of 2020-2030 are crucial barriers

GBP/USD Hovers at Key Inflection Point Ahead of Inflation and GDP Data

GBP/USD Hovers at Key Inflection Point Ahead of Inflation and GDP Data

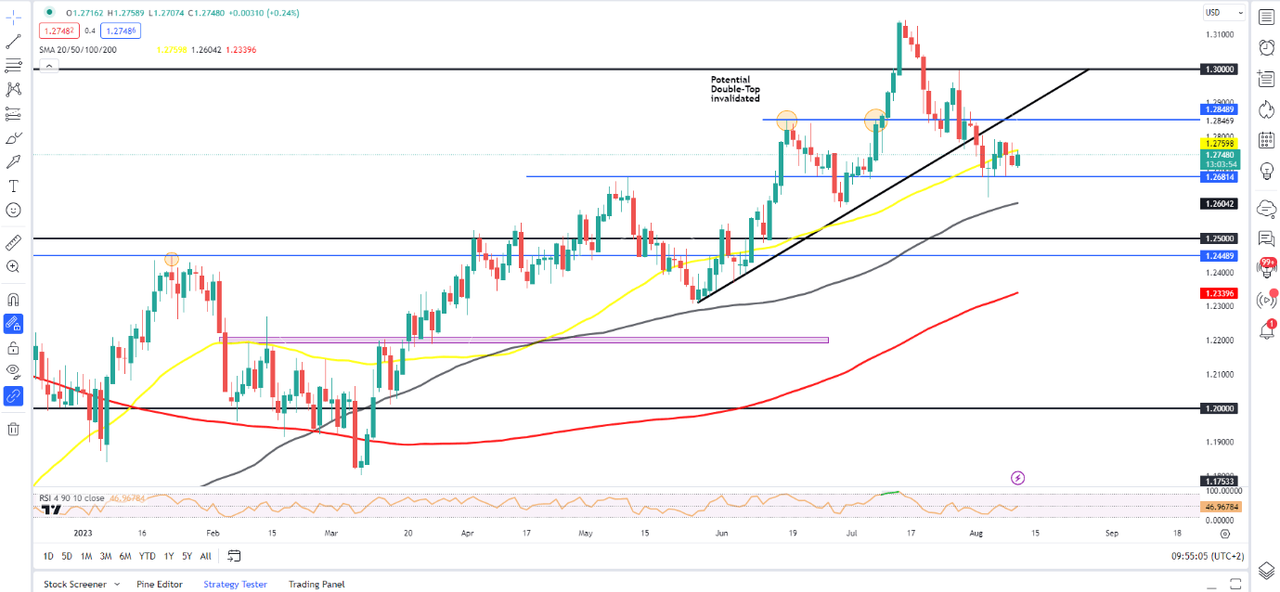
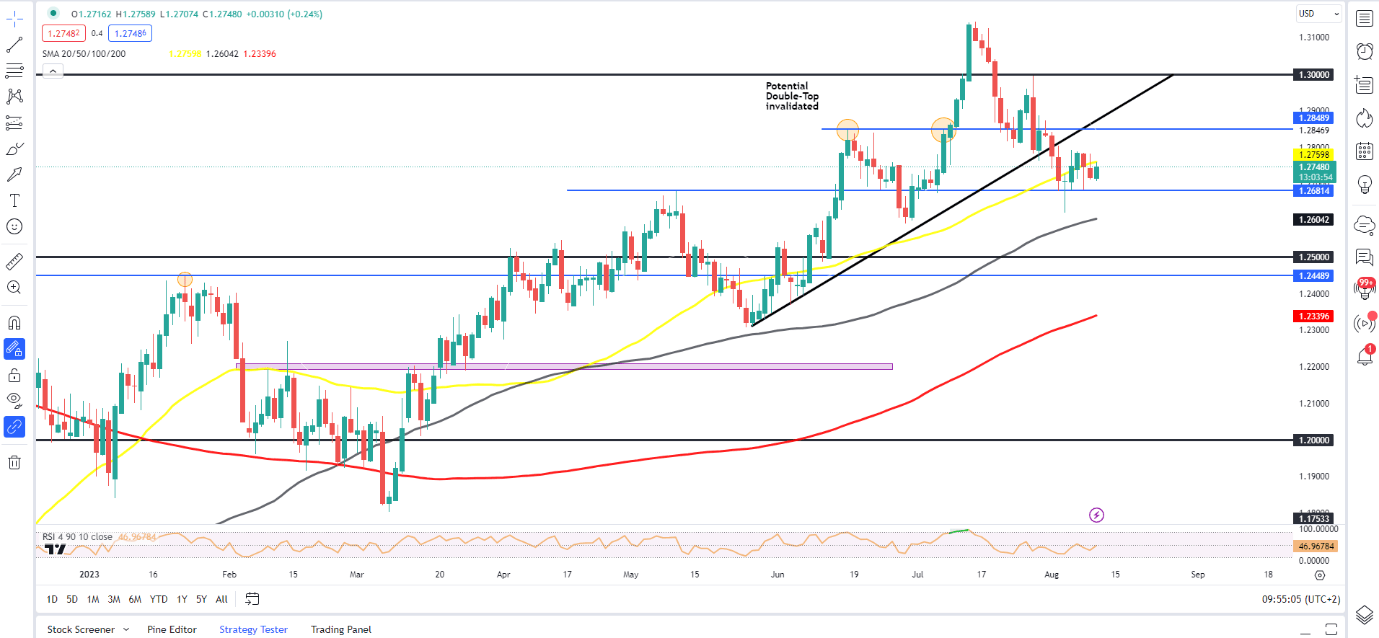
Cable has enjoyed a mixed week thus far as a resurgent US Dollar has kept the pair from gaining significant momentum in either direction. Heading into a busy end to the week GBPUSD is trapped in a 100-pip range between the 1.2680 and 1.2780 handles with price action choppy as well.

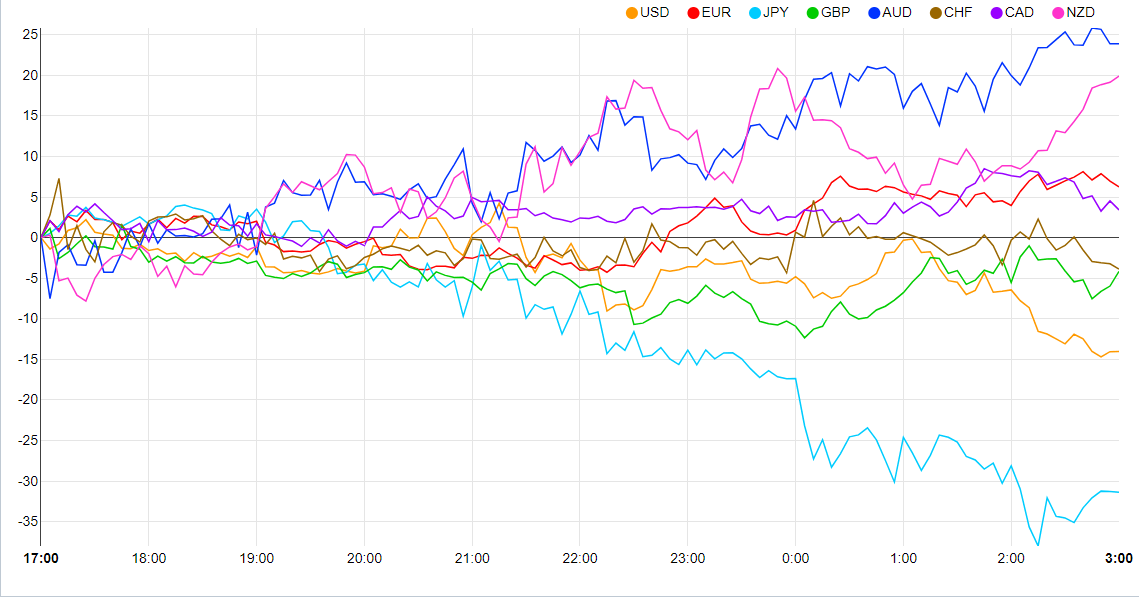
Currency Strength Chart: Strongest – AUD, Weakest – JPY.

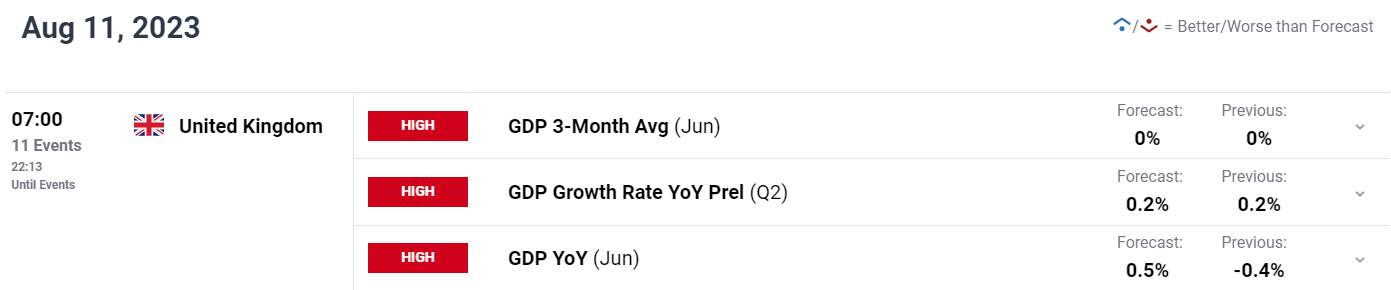
US CPI AND UK GDP DATA AHEAD

GBPUSD has been struggling since the fresh highs printed on July 13 with a steady move lower ever since. The recent bout of consolidation which seems to be across many asset classes could have an element of seasonality to it, as August has proved a choppy month historically speaking.

US CPI later today is sure to add some fireworks, however, will it have enough to give GBPUSD impetus for a sustained range breakout. As we saw at the back end of last week as price dipped below key support at the 1.2680 handle and was met with significant buying pressure. The longer price lingers above this support handle the more likely we are to see an explosive break to the upside; this might still require a catalyst though and increases the significance of today’s US CPI and tomorrows UK GDP data.

For a Full Breakdown on Trading Range Breakouts, Get Your Free Guide Below

The potential for a softer US inflation print could be just what Cable requires to reignite the bullish move to the upside. US inflation has shown a significant drop off over the past 3 months with forecasts suggesting more of the same. Once more Core CPI will be key as it has remained more stubborn than headline inflation with markets keen to see if last month’s steep drop was a once off or the start of a consistent fall. A rise in the Core or Headline Inflation print could offer the US Dollar some renewed support as the risk off sentiment which propped the US Dollar up earlier in the week appears to have run its course, for now.

UK GDP data is on the docket for tomorrow and will be key for the Bank of England’s (BoE) and its rate hike path. Given the announcement around data dependency there is a chance that a stark slowdown may see the BoE temper its policy path moving forward and could see sterling face some short-term selling pressure. A positive GDP print on the other hand could see market participants reprice the probability of rate hikes as well as the size of said hikes moving forward and keep Cable on the front foot.

We also have a host of US Federal Reserve policymakers speaking later today post the CI release and this could further add to volatility in the US session.

image1.pngA screenshot of a phone  Description automatically generatedA screenshot of a phone  Description automatically generated

Two other developments around the UK worth mentioning come in the form of the UK’s leading thinktank, the National Institute of Economic and Social Research (NIESR). The NIESR stated their belief that inflation is likely to hover above the BoE target of 2% for the next four years. This in theory could see a stronger Pound moving forward as other Central Banks reach their peak rates.

There has also been rumors around M Rishi Sunak looking at a potential ban on British investment in China with the technology, AI, chipmaking and quantum computers areas of concern. This would see the UK adopt a similar approach to the US as the global AI race begins to heat up. These two events are however geared more toward a longer-term outlook for GBP as well as the potential risks facing the currency.

TECHNICAL OUTLOOK AND FINAL THOUGHTS

GBPUSD has been ticking lower since the fresh YTD high on July 13. Price does appear to be running out of momentum though with the 1.2680 handle proving a tough nut to crack. This week has seen a mixed bag with Cable just slightly higher than the Monday open as we have had two successive days of losses.

Looking ahead and the range between the 1.2680 and 1.2780 handles continues to hold with a daily candle close below or above the level required. An upside breakout could facilitate a quick run up toward the 1.3000 psychological level with the longer-term prospects for bulls remain promising.

Alternatively, a downside breakout faces a hurdle with the 100-day MA resting around the 1.2600 level before a push to the 1.2500 handle becomes a possibility.

Key Levels to Keep an Eye On:

Support levels:

  • 1.2680
  • 1.2600 (100-day MA)
  • 1.2500

Resistance levels:

  • 1.2780
  • 1.2850
  • 1.3000 (psychological level)

GBP/USD Daily Chart

image4.png

China’s long term ‘advantages’ over the US

China’s long term ‘advantages’ over the US

What will work better between USA and China, short-term economic cycles or long-term systemic assets or baggage? The picture may look not so clear if seen from Beijing.

USA-China mirrors

Beijing has just launched a whole array of measures aimed at compensating for lackluster growth at the beginning of the year, and its main thrust is about pouring money into the market – but this may exacerbate the situation, as Reuters reports:

Latest official data shows financial institutions issued 5.5 trillion yuan ($766.12 billion) worth of long-term deposits known as certificates of deposit (CD) in the first quarter of this year — the largest such quarterly issuance since the product was introduced in 2015.

Domestic investors have rushed into these CDs over the past year in a desperate search for returns as they withdraw from real estate and the stock market, both traditional investment options now looking treacherous because of regulatory and economic problems.

Companies have joined the scramble this year, adding to the drag on China’s economy. It effectively means businesses and households are hoarding cash rather than investing it, despite lower interest rates. This classic liquidity trap plagued Japan for years beginning in the 1990s.

It means that so far, people and companies don’t want to spend their money; it’s not that they have no money to spend in the market. In that case, Beijing’s cash injections will not work because supply-side answers don’t solve demand-side questions.

It looks like Japan’s 1980s liquidity trap. What can Beijing do to kickstart demand and give confidence to consumers and investors? Why do they lose confidence? This might be the crux of the matter, and it’s not simply financial.

At least three elements contribute to the situation. The real estate market, for over two decades the main driver of growth, collapsed. Now, it languishes, with possibly up to 100 million unsold finished apartments. Real estate accounts for some 60% of the outstanding bank loans.

No other engine can replace real estate at the moment. Infrastructure building was the other significant driver, with long-term and low returns; meanwhile, it blew up the local and national debt.

Moreover, investors and consumers have grown more timid. A decade of anti-corruption campaigns has scared many entrepreneurs who initially made money while cutting many corners. Plus, longstanding anti-Covid measures choked the markets for three years instead of one year for other countries. Now, many still feel the aftershocks. Finally, the tense international situation and the threat of sanctions cast a shadow over foreign trade.

The accumulation of all these problems could crush the Chinese economy and thus spread into society and politics. Chinese leaders know it. They are pragmatists, not ideologues, and before these issues, they radically changed course in the past. Then the question is whether we can expect a dramatic turn in China soon.

China’s consumer prices drop for first time in over 2 years

China’s consumer prices drop for first time in over 2 years

China’s consumer prices fell for the first time in more than two years in July, while the country’s factory-gate price index declined at a slower rate, official data showed Wednesday.

China’s consumer-price index dropped 0.3% from a year earlier in July, after remaining flat in June, the National Bureau of Statistics said.

The reading marked the first decline since February 2021, when CPI fell 0.2% on year, and compared with the 0.4% fall expected by economists surveyed by The Wall Street Journal.

Food prices dropped 1.7% on year in July, compared with a 2.3% increase in June. Vegetable prices dropped 1.5%, compared with June’s 10.8% growth. Pork prices fell 26% in July, widening from a 7.2% decline in June.

Non-food prices remained flat on year in July after dropping 0.6% in June.

On month, China’s CPI climbed 0.2% in July, compared with June’s 0.2% decline, ending a five-month fall, according to the data.

Meanwhile, China’s factory-gate prices dropped 4.4% from a year ago in July, compared with the 4.1% fall anticipated by economists polled by The Wall Street Journal, narrowing from June’s 5.4% decline.

On a monthly basis, China’s PPI fell 0.2% in July, compared with June’s 0.8% decline, the statistics bureau said.

Looking Back at the US Markets in July and Ahead to August 2023

Looking Back at the US Markets in July and Ahead to August 2023

July was another good month for stocks across the board. The U.S. indices were up in the low single digits, while international markets also did well. Riskier investments like the Nasdaq and emerging markets did best. Fixed income, on the other hand, was much weaker for the month as interest rates rose and the Fed hiked base rates. Financial markets were clearly in a risk-on mode and benefited from riskier investments like tech stocks at the expense of more boring ones.

Looking Back

The economy. A mix of good economic news drove the strong performance in July. Second-quarter growth was reported at 2.4 percent—up from the first quarter’s 1.8 percent—showing an acceleration instead of the feared slowdown. Job growth remained strong, while consumer confidence rose to the highest level in two years. With business confidence staying solid, the economic data was almost uniformly positive.

Inflation. Even with the continued growth, we also received good news on inflation, which continued to trend down. While still too high, the improvement continued. And while the Fed increased rates last month, there is a growing conviction that there will be few, if any, increases in the future. Looking back, July was full of good news, and markets responded.

Looking Ahead

Job and wage growth. Looking forward, August may be more mixed. The jobs report for July showed slowing job growth—still healthy, but slower, especially for the private sector. Even with this slowdown, wage growth was high again. This result could keep service inflation high, which was one of the worries from the last report. Many of the tailwinds we saw for the economy and markets last month are now subsiding, and we see that in recent performance.

The Fed and interest rates. As we move into August, the key issue will be whether inflation continues to decline and what that means for the Fed and interest rates. Market expectations are changing rapidly, and if the Fed starts to act more hawkishly, markets could react negatively. That said, given that the underlying reason for the Fed’s hawkishness will be continued growth, markets have an economic cushion. So, while volatility is likely, the downside could be limited.

The economic news should stay positive for August. Job growth remains healthy, with some stats very strong. Consumer and business sentiment have improved, which could help spending and investment. If the underlying economy continues to grow, which is likely, any Fed actions will have some effect, but likely a limited one.

A Positive Outlook

And that is the bottom line here. Last month and the year so far have been very positive, and much of that good news continues. Because of that, however, the Fed may keep tightening, which will have a slowing effect. Even with that headwind, any recession is likely some time away, which should keep markets healthy.

In short, while July was a good month, August may be more challenging. Even if it is, conditions remain favorable overall. And while volatility may show up during the month, the trend will likely remain positive over the longer term.

Japan GDP grew 0.2% in June on export recovery: JCER

Japan GDP grew 0.2% in June on export recovery: JCER

TOKYO — Japan’s gross domestic product rose at an annualized 0.2% in June, on a seasonally adjusted basis, from the previous month thanks to a recovery in exports, with the economy expanding for the first time in two months, according to the Japan Center for Economic Research.

Exports of goods and services for June increased 4.7% from the previous month, reversing a 3% contraction in May. Goods headed for the U.S. and China rose 3.8% and 1.7%, respectively. Imports of goods and services also rose, but at a slower pace than exports, up 2.8%.

Meanwhile, private consumption, which accounts for over 50% of the country’s GDP, declined 0.7%. “While the economy has been steadily stabilizing after the COVID-19 crisis, and consumer confidence has been recovering, actual consumption is weak,” JCER noted in a report.

Based on monthly figures, the think tank now expects an annualized 5.1% expansion in GDP for the April to June quarter, versus the previous three months. The government is set to release official preliminary GDP figures for April to June on Aug. 15.

US Dollar Price Action Setups: EUR/USD, USD/JPY, Gold, GBP/USD

US Dollar Price Action Setups: EUR/USD, USD/JPY, Gold, GBP/USD

It’s a quieter week on the economic calendar this week and as I shared at the beginning of this webinar, that can put more emphasis on price action and technical analysis. There is one major item, however, with the release of US CPI data for the month of July. This was a big push point last month when headline CPI came in at a flat 3.0%, which led into a quick breakdown move in the US Dollar. This caused breach of a massive support level in DXY and as I stated in the webinar the week after, the big test was whether bears came into defend lower highs in order to continue that trend.

They haven’t, and the FOMC and ECB rate decisions in July helped to further reverse that move. And as we sit in front of the next US CPI release scheduled for Thursday, the US Dollar is holding on to bullish breakout potential.

This year has so far been consolidation in the USD, shown in the form of a falling wedge, and the resistance side of that formation has been tested multiple times:  There was the two weeks of grind in May and June which led to a pullback to 102, and then the next test in July was a quick touch before a reversal developed, which was later helped by that CPI print out of the US.

US Dollar – DXY Weekly Price Chart (indicative only, not available on Forex.com platforms)

us dollar weekly chart 8823

USD Shorter-Term

On a shorter-term basis, that bullish structure remains clear in USD price action. I had written a report ahead of the weekend to highlight the support zone at 101.80-102, the latter of which was that June swing low.

That support zone has since held the lows and price on the daily chart is shown a non-completed morning star formation, which could keep the door open for further highs. That resistance trendline sits overhead, however, and this is the next major spot for bulls to contend with.

The CPI print on Thursday is expected to show headline CPI at 3.3% which would be the first increase in that data point since June of last year, just before it topped. If we end up with an upside surprise on that data point it may compel even greater bullish drive which could expose resistance at 103.45 or 103.82.

US Dollar – DXY Weekly Price Chart (indicative only, not available on Forex.com platforms)

us dollar daily 8823

EUR/USD 1.0943

EUR/USD remains at a key spot of support of 1.0943. I’ve been talking about this level for a couple of weeks now and it was in the picture back in June, as well. This is the 50% mark of the same Fibonacci retracement that helped to mark the high at 1.1275, which is the 61.8% mark of the 2021-2022 major move.

EUR/USD Weekly Price Chart

eurusd weekly 8823

EUR/USD Shorter-Term

Bears have kept a brisk pace on this move, and it’s been the recent dimming in European data that’s contributed to the shake-up. There’s a bearish trendline in-play that caught another resistance test earlier today, and this keeps a descending triangle formation in play. These are often approached with the aim of bearish breakdowns and that door remains open – but bears have not been able to do much below 1.0943 yet and given the stark reaction to resistance at the 61.8% retracement, there could be residual support to play off of the 1.0943 level and this keeps the door open for a messy outlay ahead of that US CPI release on Thursday.

I’m tracking next support in the pair around the 1.0845 level that was last in-play in early-July, ahead of the CPI print that brought the false breakout to the US Dollar.

EUR/USD Four-Hour Price Chart

eurusd four hour chartr 8823

USD/JPY

USD/JPY is back to a key resistance level at 143.40. I had talked about this level in last week’s webinar as it’s a Fibonacci level that had started to stall a topside move. That led to the build of an evening star that completed last Thursday, and there was one day of run on Friday, but so far this week price has reversed and moved right back to that resistance level.

There’s also been a pullback to support at prior short-term resistance around 142.89, giving the appearance that bulls may soon go for another breakout. The big question, of course, is whether it can hold if that does play out. Sitting overhead is the 145 level which elicited a stark reversal when it came into play in late June.

USD/JPY Daily Chart

usdjpy daily 8823

Spot Gold

Gold is testing support at 1925-1932. This was a zone of prior resistance as taken from previous support. The challenge here is that bears have had an open door to push a breakdown move and they haven’ t yet, the question must be asked as to why. Breakout challenges have seemed especially challenging in Gold of late as there’s been a number of bear traps, such as what was seen at the 1900 level.

The 1943 area of prior support has already come in as resistance so that might be non-ideal if it comes back into the picture as that would be quite the stretch from bulls, but, on a shorter-term basis, this can highlight resistance potential around 1932 or perhaps at 1952, which could come into play if bulls force a break beyond the 1943 level that’s already been tested.

Gold (XAU/USD) Four-Hour Price Chart

gold four hour 8823

GBP/USD

GBP/USD tested a key support level last week at 1.2667. That helped to hold the low on the daily bar for last Thursday, which saw a Bank of England rate decision. That daily bar finished as a doji and then strength on Friday pushed into a morning star formation but that comes with questions, as a late-session sell-off erased the upper portion of the Friday bar.

Given the inflation picture in the UK, this does present a point of interest as bearish scenarios in the USD, which would likely come along with lower inflation and FOMC expectations, could be of benefit here as inflation remains brisk in the UK and the BoE will likely need to continue to address that.

A hold of support at 1.2667 will be necessary to keep that scenario as a possibility, however, and the 1.2848 level sits overhead as a point of resistance for bulls to contend with.

GBP/USD Daily Price Chart

gbpusd daily 8823

Euro Vulnerable as Retail Traders Boost EUR/USD Upside Exposure, Where to?

Euro Vulnerable as Retail Traders Boost EUR/USD Upside Exposure, Where to?

The Euro remains about 2.7% under the July high in what has been a short-term downtrend since the middle of last month. During this time, retail traders have been increasing their upside exposure in EUR/USD. This can be seen by looking at IG Client Sentiment (IGCS). IGCS typically tends to function as a contrarian indicator, especially in trending markets. With that in mind, is the single currency at risk of further losses?

EUR/USD Sentiment Outlook – Bearish

The IGCS gauge shows that about 58% of retail traders are net-long EUR/USD. Since most of them are now biased to the upside, this hints that prices may continue to fall down the road. This is as upside exposure increased by 21.3% and 16.07% compared to yesterday and last week, respectively. With that in mind, the combination of overall exposure and recent changes has strengthened the bearish contrarian trading bias.

EUR/USD Sentiment Outlook – Bearish

Euro Daily Chart

On the daily chart, EUR/USD seems to be struggling to make further upside progress after a bullish Morning Star candlestick pattern emerged last week. That is underscoring the near-term bearish bias. But, prices have been unable to breach the 100-day Moving Average (MA). The latter has been maintaining the broader bullish bias.

From here, confirming a breakout under the 100-day MA opens the door to extending losses, placing the focus on the late June low of 1.0834. Breaking under that then exposes the May low of 1.0635 and a stronger bearish technical perspective. Otherwise, in the event of a turn higher, keep a close eye on the 23.6% Fibonacci extension level of 1.1003. Confirming a push above this price opens the door to revisiting the 38.2% level at 1.1231.

Euro Daily Chart