08166635848

How Much More to Go in Crude Oil? Is There More Upside in Natural Gas?

How Much More to Go in Crude Oil? Is There More Upside in Natural Gas?

Natural gas: A hesitant rally

The sharp fall on Thursday isn’t new to natural gas’ recovery script – two steps forward one step back has been a feature of the hesitant uptrend from early 2023. After weeks of sideways movement, natural gas attempted to break past the upper edge of the range at about 2.70 only to surrender all the gains in a day.

That’s because the downtrend since late 2022 has been established, with several pivot points created along the way. For a pronounced uptrend to take place, natural gas would need to clear all the hurdles. One such barrier is the March high of 3.00-3.05 (including the March high and the 30-week moving average). With momentum beginning to falter, it could be tough to clear the resistance area, at least on the first attempt.

Natural Gas Daily Chart
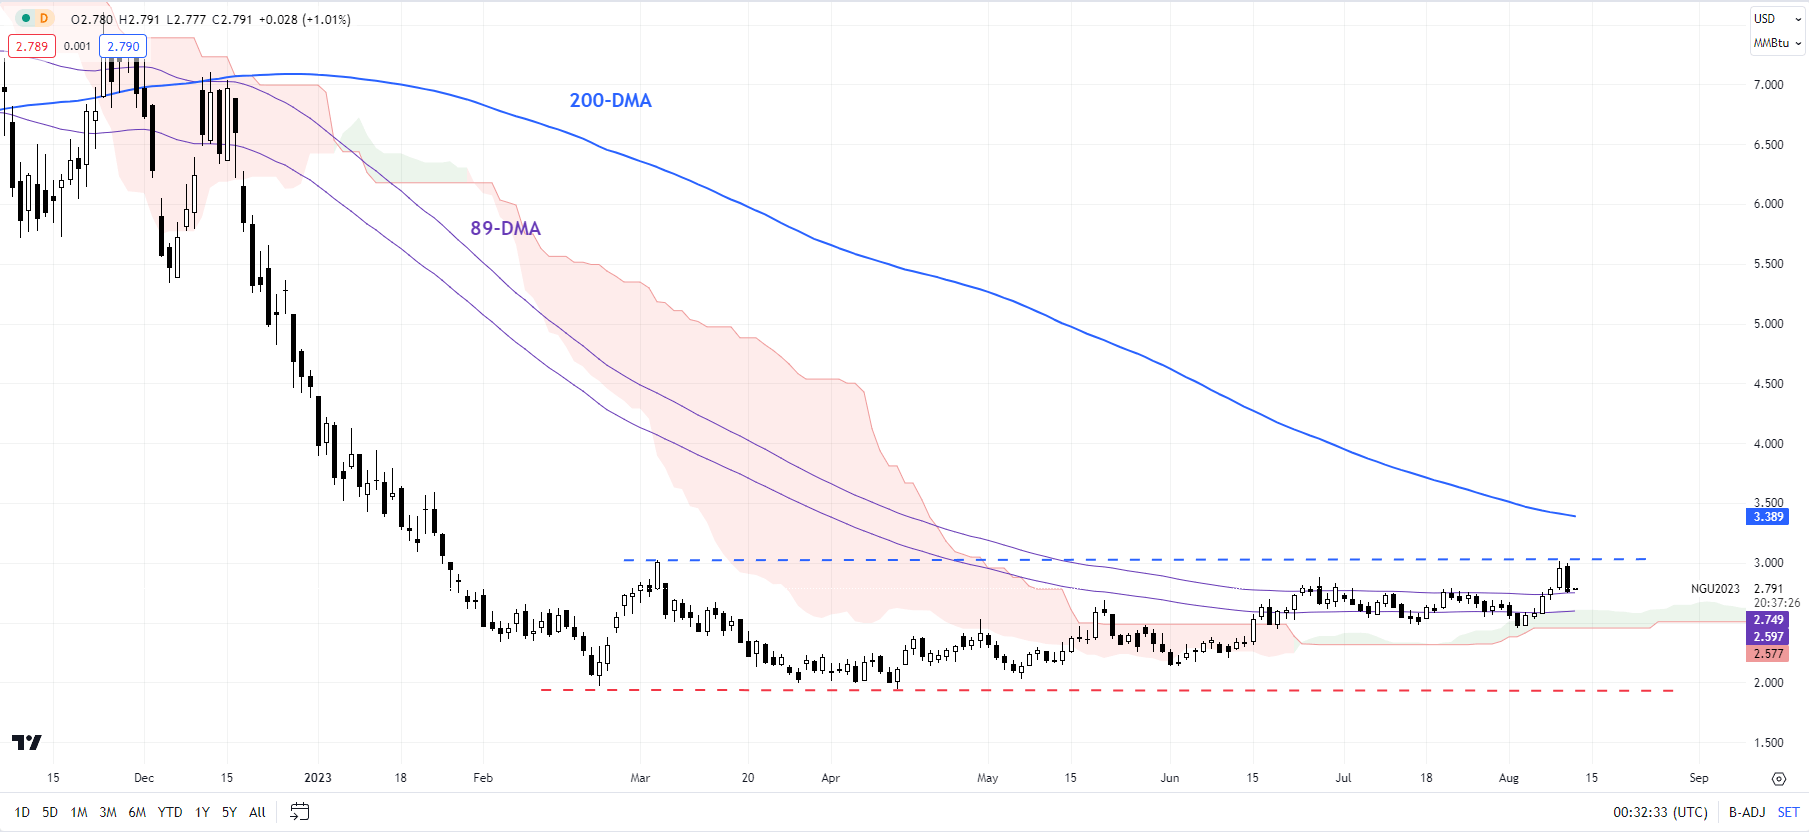
image1.png

Any break below the resistance-turned-support at 2.70 could open the way toward strong support at 2.40-2.50, including the lower edge of the Ichimoku cloud on the daily charts. While 2.40-2.50 remains intact, natural gas could re-attempt to decisively clear 2.70. Any break above 2.70 could open the door toward the 200-day moving average (now at about 3.40).

Natural Gas Weekly Chart
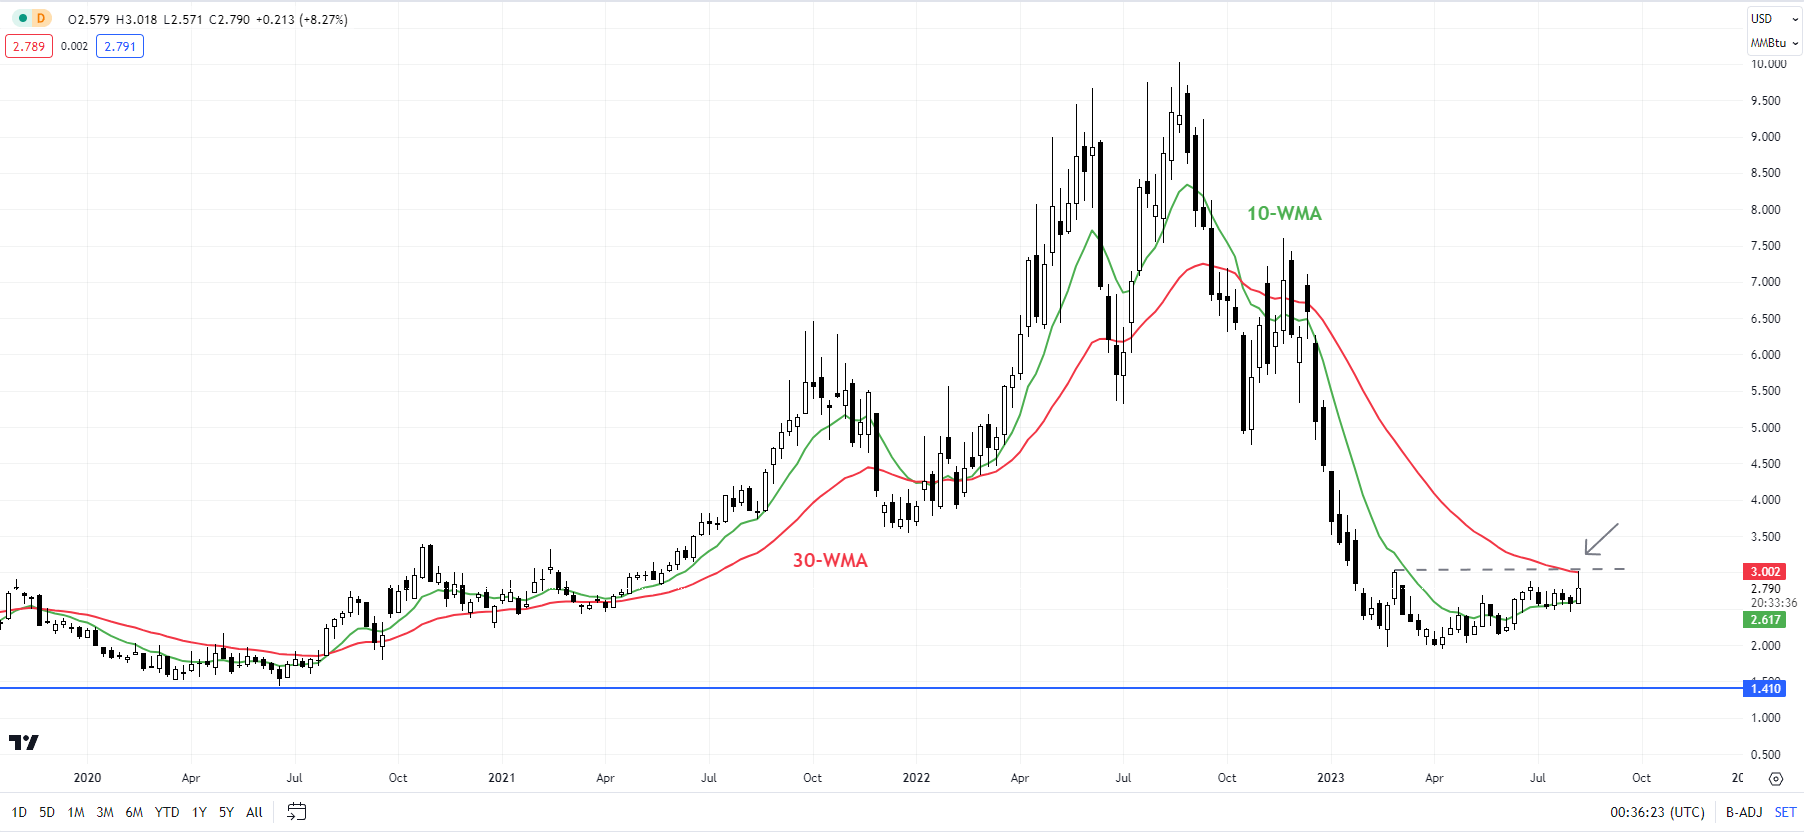
image2.png

From a medium-term perspective, as highlighted in recent updates, the downward pressure has abated as natural gas found support around the psychological 2.00 mark. Natural gas would need to clear the 200-day moving average for the rally from March to be more than just corrective. See “Natural Gas Week Ahead: Base Building May Have Started”, published May 22, and “Natural Gas Price Rebound Could Extend; What’s Next For Crude Oil?”, published May 18. The possibility of natural gas bottoming was first highlighted in early 2023 – see “Natural Gas Price Action Setup: Is the Slide Overdone?”, published February 21.

Crude Oil 240-Minutes Chart
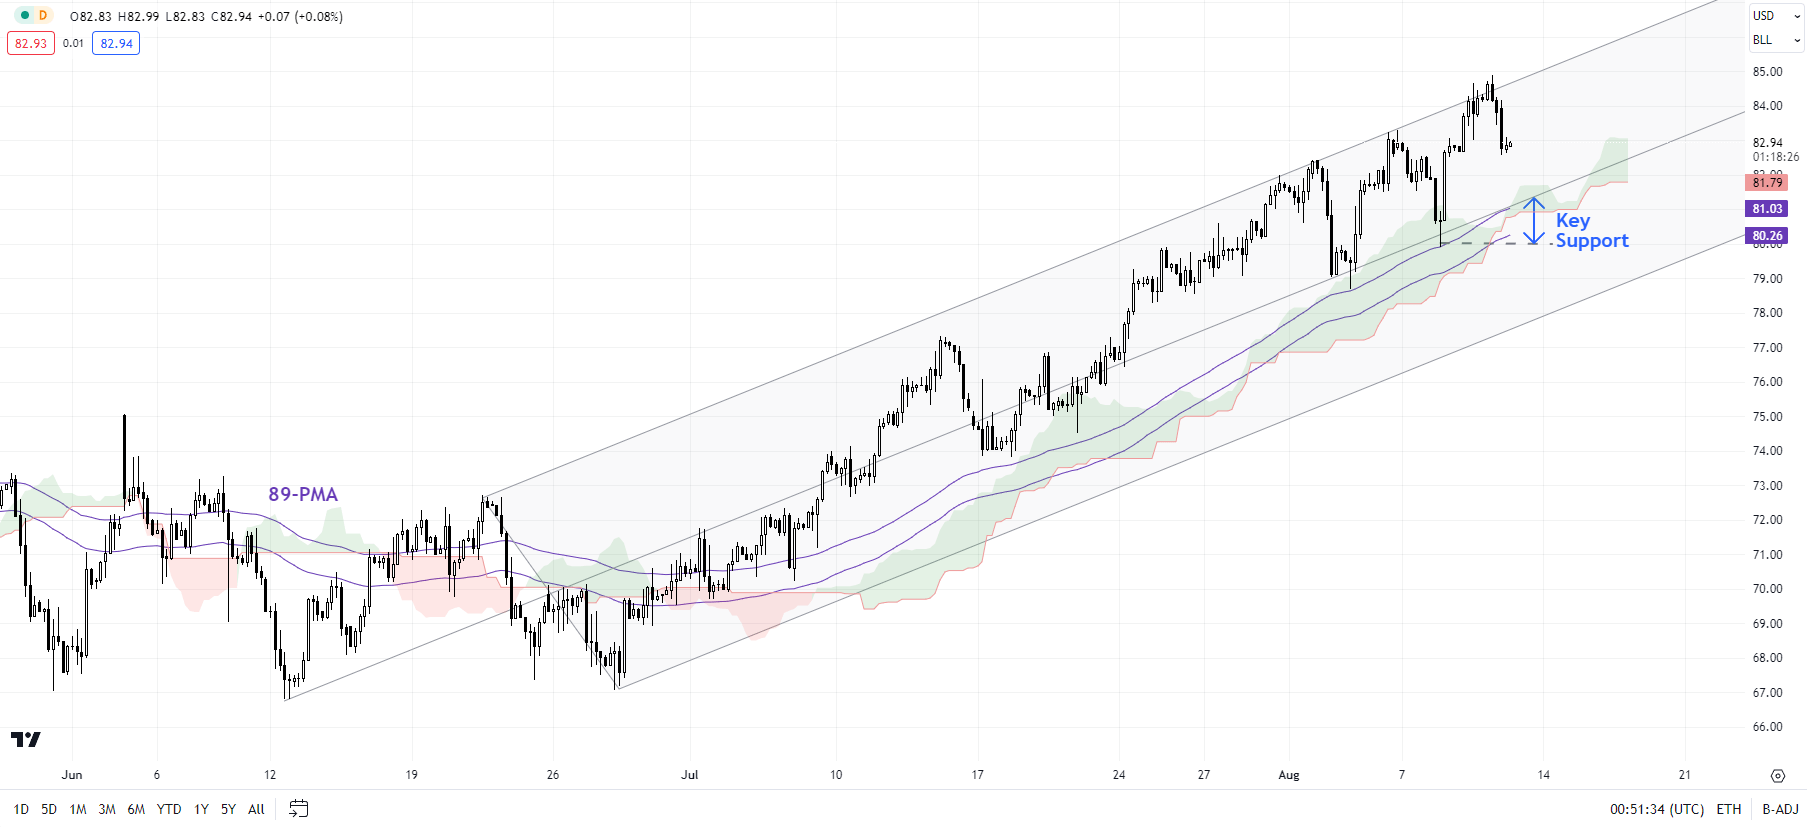
image3.png

Crude Oil: Runs into a crucial hurdle

On technical charts, crude oil has been flirting with the upper edge of a rising pitchfork channel since mid-June, coinciding with other hurdles at the April high of 83.50 and the 89-week moving average. Overbought conditions coupled with negative divergence on lower timeframe charts (rising price associated with a stalling in momentum) suggest crude oil could find it tough to clear the resistance, at least in the first attempt.

Crude Oil Weekly Chart
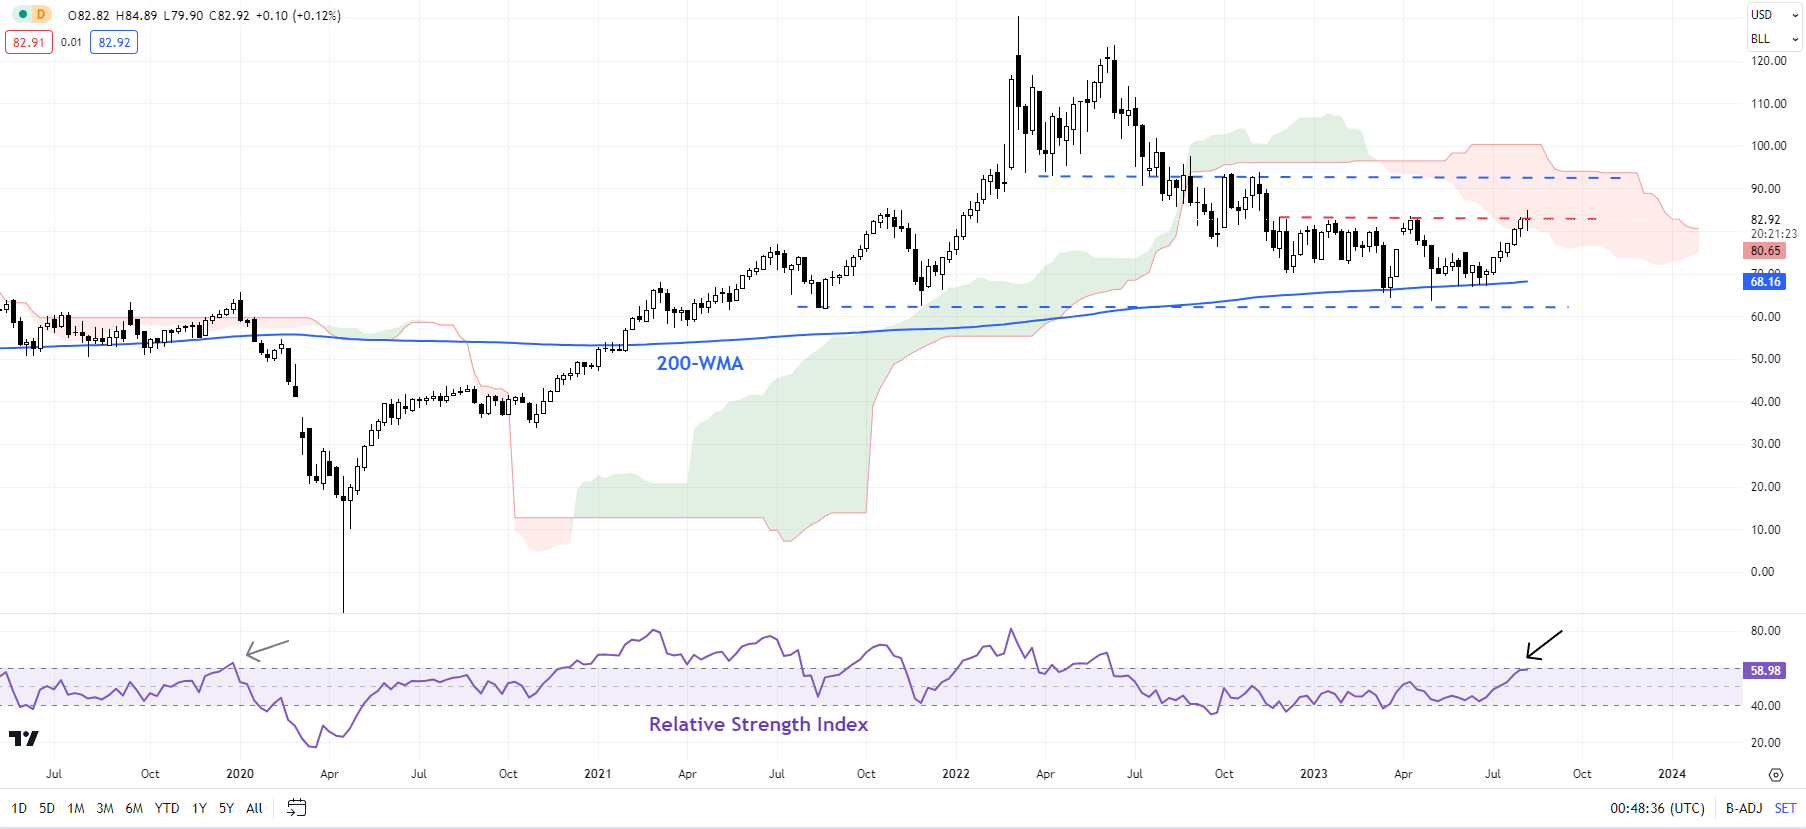
image4.png

To be fair, there is no sign of reversal of the uptrend yet – the higher-highs-higher-lows pattern is intact. A break below the immediate cushion area around 80.00-81.00 would be needed for the short-term upward pressure to fade. Until then, the path of least resistance remains sideways to up.A decisive break above 83.50 could initially open the way toward the November high of 93.75.

Crude Oil Daily Chart
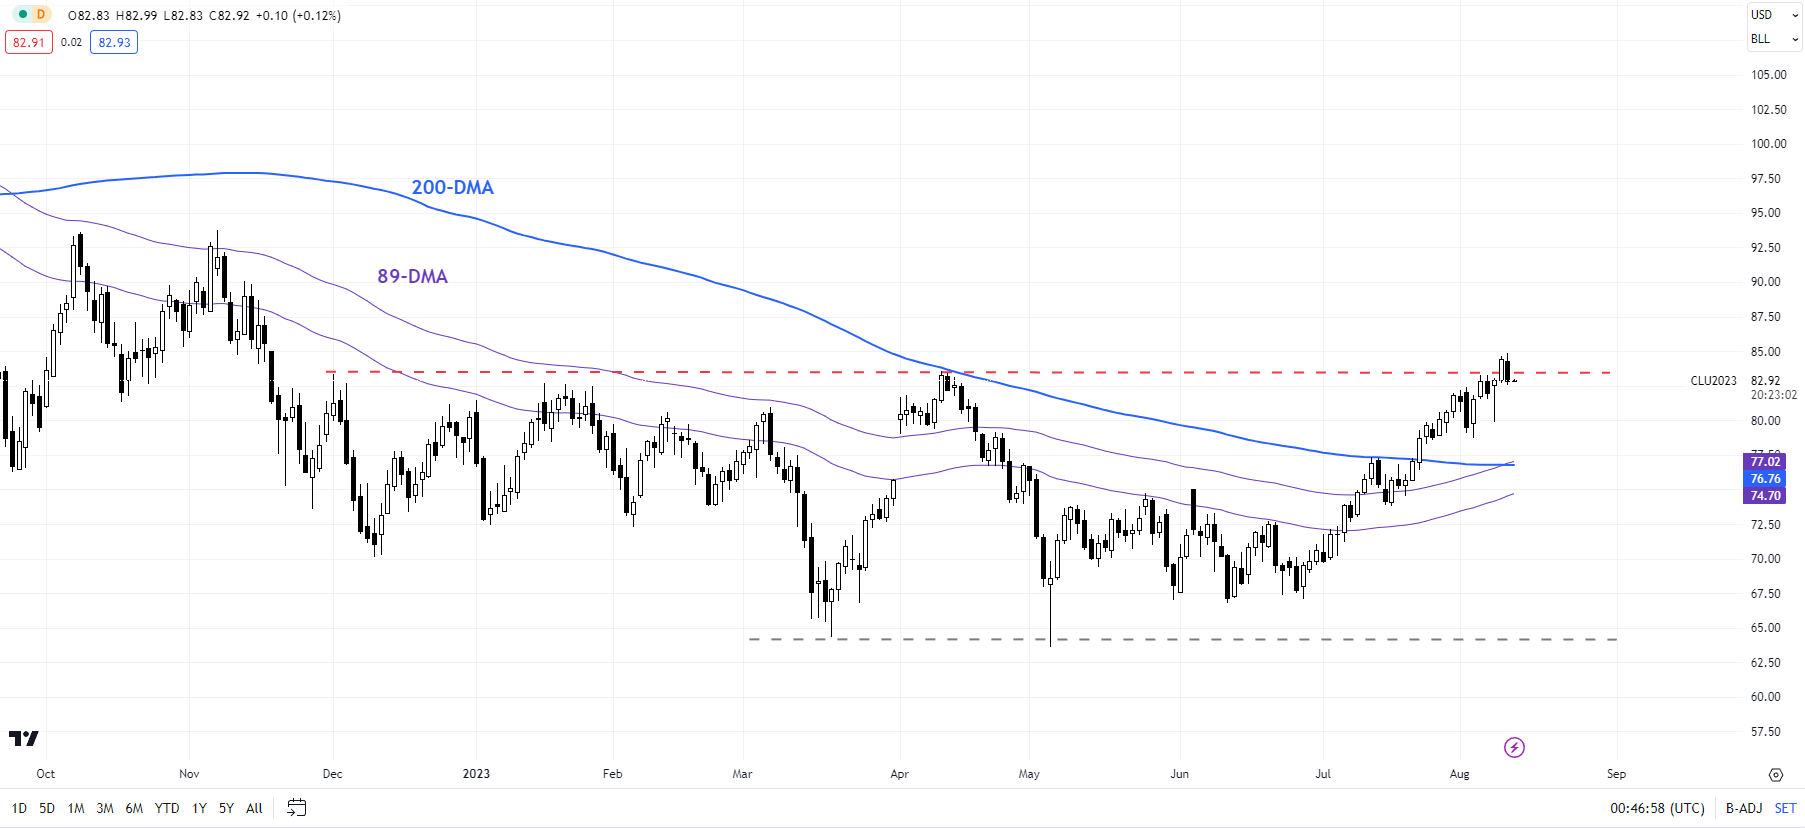
image5.png

British Pound (GBP) Latest: UK GDP Data Beats Estimates, Sterling Undecided

British Pound (GBP) Latest: UK GDP Data Beats Estimates, Sterling Undecided

The UK economy expanded by a better-than-expected 0.2% in Q2, beating forecasts of zero growth, while the economy grew by a more robust 0.5% in June compared to forecasts of 0.2%. According to Darren Morgan, director of economic statistics at the Office for National Statistics (ONS), ‘Services also had a strong month with publishing and cars sales and legal services all doing well, though this was partially offset by falls in health, which was hit by strike action’.

image1.png

The GDP y/y estimate jumped sharply higher to 0.9% compared to forecasts of 0.5% and from a prior -0.4%.

Manufacturing and industrial production also beat estimates, while the volatile construction orders reading jumped sharply higher, from -14.3% last month to 2.6%.


image2.png

ONS GDP First Quarter Estimate

Retail trader data shows 58.04% of traders are net-long with the ratio of traders long to short at 1.38 to 1.

For a More Detailed Look at Daily and Weekly Changes in GBP/USD and What it Means for Sentiment, Download the Free IG Client Sentiment Guide

Sterling is little changed in early turnover despite the positive data. The British Pound trades at 1.2715 against the US dollar, around 0.3% higher, and around 0.15% to the good against the Euro at 0.640. Today’s news will please the Bank of England and may give him food for thought ahead of the next monetary policy meeting. If next week’s CPI figures show a marked slowdown in UK inflation, then the MPC may well keep rates unchanged at the next meeting. While the good economic boost may underpin Sterling, if rates are left untouched, it is still a big data-dependent if, the British Pound may struggle to push higher in the weeks ahead.

GBP/USD Daily Price Chart August 11, 2023

image3.png


NASDAQ 100, Dow Jones, S&P 500: Stocks Resilient Ahead of US Inflation Data

NASDAQ 100, Dow Jones, S&P 500: Stocks Resilient Ahead of US Inflation Data

S Inflation Data Set to Influence Federal Reserve’s Next Move

U.S. stock index futures saw a positive momentum on Thursday as traders and investors eagerly awaited the release of the key Consumer Price Index (CPI) for July. Scheduled for 12:30 GMT, predictions lean towards a 0.2% rise, mirroring the previous month’s increase. Annually, it’s anticipated that the CPI will mark a 3.3% climb, a slight increase from the previous 3.0%.

Nasdaq’s Downtrend and Optimism in the MarketDespite the Nasdaq leading a dip in Wall Street the previous day, notably with Nvidia dropping by 4.7%, the index has shown remarkable resilience this year. It boasts a 31% growth, fueled by hopes for a stable U.S. economic landing amidst the Fed’s robust interest rate adjustments and budding enthusiasm surrounding artificial intelligence’s potential. As the tech sector responded, significant players like Amazon.com, Microsoft, and Apple saw a pre-bell uptick ranging from 0.5% to 0.9%.

Trading Derivatives carries a high level of risk to your capital and you should only trade with money you can afford to lose. Trading Derivatives may not be suitable for all investors, so please ensure that you fully understand the risks involved, and seek independent advice if necessary. A Product Disclosure Statement (PDS) can be obtained either from this website or on request from our offices and should be considered before entering into a transaction with us. Raw Spread accounts offer spreads from 0.0 pips with a commission charge of USD $3.50 per 100k traded. Standard account offer spreads from 1 pips with no additional commission charges. Spreads on CFD indices start at 0.4 points. The information on this site is not directed at residents in any country or jurisdiction where such distribution or use would be contrary to local law or regulation.

Corporate Highlights and Earnings Updates

Corporate America wasn’t without its fair share of action. Walt Disney stock prices leaped by 1.5% post their Wall Street estimates beat on the quarterly adjusted profit per share. Capri Holdings Ltd., the force behind Michael Kors, saw its stocks skyrocket by 58.3% following news of an $8.5 billion acquisition by Tapestry, which conversely dipped by 3.8% after the announcement. Additionally, U.S.-listed Alibaba stocks swelled by 4.3% after revealing encouraging quarterly sales figures, indicating an uptick in consumer sentiment.

Trade Concerns Amidst Positive Market Movements

While the market showed signs of optimism, President Joe Biden’s recent executive order could introduce an air of caution. The order, signed on Wednesday, restricts certain new U.S. investments in China, particularly in sensitive tech sectors like computer chips.

Short-Term Outlook

The general market sentiment leans towards optimism, as evidenced by traders’ 86.5% odds favoring the Fed’s halt in aggressive interest rate hikes. However, the S&P is expected to maintain its position for some time until clarity around the peak U.S. rates emerges. Given the looming inflation data release and corporate dynamics at play, the market appears cautiously bullish.

Natural Gas Forecast: Weather Demand, Global Factors Push Prices to 5-Month High

Natural Gas Forecast: Weather Demand, Global Factors Push Prices to 5-Month High

Overview

U.S. natural gas futures have surged to a five-month high, reacting to both domestic and global factors. With an extended hotter-than-normal summer fueling demand, an anticipated increase in the weekly storage report, and global energy market disruptions, the U.S. natural gas sector is witnessing significant activity.

Domestic Storage and Demand

Before the imminent release of the government’s weekly storage report, expectations are high for the Energy Information Administration (EIA) to indicate a build of 24 Bcf. This comes after net injections into storage were noted at 14 Bcf for the week ending July 28, a significant deviation from the five-year average of 37 Bcf. Current working natural gas stocks stand at 3,001 Bcf, which is 12% above the five-year average. If the refill season continues at its current rate, we can anticipate an inventory of 3,917 Bcf by October 31, surpassing the five-year average.

Trading Derivatives carries a high level of risk to your capital and you should only trade with money you can afford to lose. Trading Derivatives may not be suitable for all investors, so please ensure that you fully understand the risks involved, and seek independent advice if necessary. A Product Disclosure Statement (PDS) can be obtained either from this website or on request from our offices and should be considered before entering into a transaction with us. Raw Spread accounts offer spreads from 0.0 pips with a commission charge of USD $3.50 per 100k traded. Standard account offer spreads from 1 pips with no additional commission charges. Spreads on CFD indices start at 0.4 points. The information on this site is not directed at residents in any country or jurisdiction where such distribution or use would be contrary to local law or regulation.

Weather-Driven Demand

Persistent hot weather, especially in Texas, has seen power demand records shattered. Homes and businesses, running air conditioners non-stop due to the prolonged heatwave, are contributing to this demand. Forecasts suggest that the hot weather pattern will persist, driving the demand higher. This weather-driven demand is further reinforced by forecasts that suggest continuous high temperatures in the southern U.S. regions, with a special focus on Texas and California.

Global Influence and Outlook

European gas prices witnessed a sharp surge due to potential strike disruptions at Australian liquefied natural gas (LNG) facilities. This, combined with concerns over the global energy market, has been keenly observed by the White House. On the U.S. export front, while there’s a significant shift in LNG exports from Asia to Europe due to pricing dynamics, the U.S. is slated to become the world’s top LNG supplier by 2023, capitalizing on global price increases and supply disruptions.

Short-term Forecast

Bullish trends are anticipated in the short term. With sustained high demand, potential storage increases, and global energy market shifts, the U.S. natural gas market is poised for significant activity. Continued weather patterns further strengthen this outlook, with traders and speculators keenly watching for opportunities.

Technical Analysis

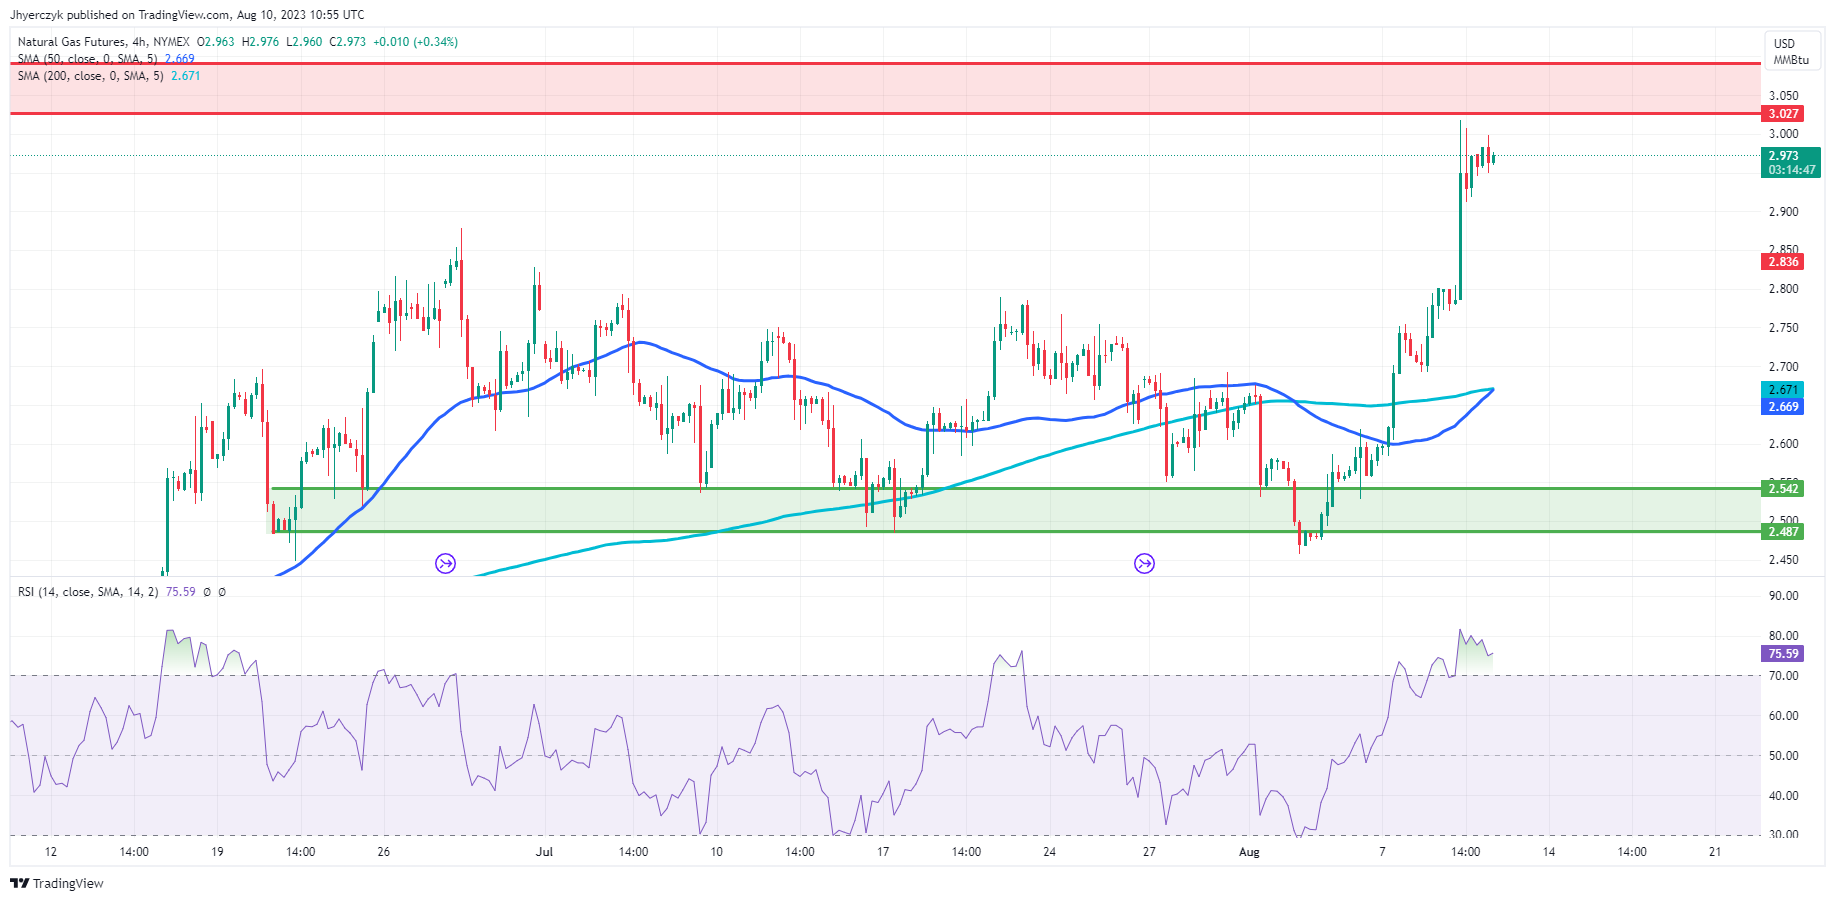
4-Hour Natural GasThe current 4-hour price for Natural Gas stands at 2.971, reflecting a minor increase from the prior 4-hour price of 2.963. This commodity is trading above both the 200-4H moving average (2.671) and the 50-4H moving average (2.669), indicating a bullish short-term trend. The 14-4H RSI is at 75.52, suggesting the market is in an overbought state, implying potential caution for buyers.

Currently, Natural Gas is significantly above its main support zone (2.542 to 2.487) and is approaching its primary resistance area (3.027 to 3.091). Given these indicators, the market sentiment leans bullish, but approaching resistance and a high RSI suggests potential near-term volatility.

US CPI Inflation at Annual Rates, using July Nowcast

US CPI Inflation at Annual Rates, using July Nowcast

Note that year-on-year CPI inflation will have a bump up if Cleveland Fed’s nowcast of 0.4% m/m headline inflation proves right. So too will instantaneous (3.5% annual rate). However, the Bloomberg consensus is for 0.2%, which means in a slightly declining instantaneous inflation rate (2.4% annual rate).”

Inflation has been running at something near 3%? I’m confused – we were told by the world renowned economic forecaster JohnH that inflation would be 6%. And of course Jonny boy is never wrong.

U.S. says 3-way summit with Japan, S. Korea to be “historic”

U.S. says 3-way summit with Japan, S. Korea to be “historic”

The United States expects that a trilateral summit with Japan and South Korea to be hosted by President Joe Biden later this month at his Camp David retreat will be “historic,” a White House official said Wednesday.

Biden is “very much looking forward to hosting” the summit on Aug. 18, White House national security spokesman John Kirby said, noting that bolstering a trilateral relationship with Japan and South Korea, both U.S. treaty allies, is important not only for Washington but also for the rest of the world.

“Camp David has been a historic setting for summit meetings and for significant foreign policy conversations throughout the history of its existence,” Kirby said during an online press briefing, when asked about the reasoning behind the Biden administration choosing the retreat near Washington as its venue.

He said Biden will host Japanese Prime Minister Fumio Kishida and South Korean President Yoon Suk Yeol for what the administration believes will be “a discussion of historic proportions in terms of the importance of this trilateral relationship to the Indo-Pacific region and, frankly, to the world.”

The forthcoming summit will be held at a time when Japan and South Korea seek to forge closer ties, with Kishida and Yoon agreeing earlier this year to move on from a long-festering dispute over wartime conscripted labor. It is also taking place as North Korea shows no signs of relenting in its pursuit of advanced missile and nuclear capabilities.

It will be the first standalone summit between the leaders of the United States, Japan and South Korea, as past trilateral discussions were all held on the sidelines of international meetings.

USD/JPY Bulls to Target 144.5 on Hotter US Inflation Numbers

USD/JPY Bulls to Target 144.5 on Hotter US Inflation Numbers

On Wednesday, the USD/JPY rose by 0.25% to wrap up the day at 143.716. Better-than-expected producer price index and consumer price inflation numbers from China supported riskier assets.

This morning, there are no economic indicators from Japan or China to draw interest. The lack of economic indicators will leave the USD/JPY in the hands of market risk sentiment as investors look toward the US CPI Report. With the Bank of Japan set to remain ultra-loose, monetary policy divergence could tip significantly in the dollar’s favor.

Trading Derivatives carries a high level of risk to your capital and you should only trade with money you can afford to lose. Trading Derivatives may not be suitable for all investors, so please ensure that you fully understand the risks involved, and seek independent advice if necessary. A Product Disclosure Statement (PDS) can be obtained either from this website or on request from our offices and should be considered before entering into a transaction with us. Raw Spread accounts offer spreads from 0.0 pips with a commission charge of USD $3.50 per 100k traded. Standard account offer spreads from 1 pips with no additional commission charges. Spreads on CFD indices start at 0.4 points. The information on this site is not directed at residents in any country or jurisdiction where such distribution or use would be contrary to local law or regulation.

The US Session

It is a big day ahead, with the all-important US CPI Report in focus. Hotter-than-expected inflation numbers would reignite bets on a September Fed interest rate hike, which could refuel recessionary jitters.

Economists forecast the US annual inflation rate to accelerate from 3.0% to 3.3% in July and for core inflation to hold steady at 4.8%.

Jobless claims figures will also draw interest. However, we expect the numbers to play second fiddle to the CPI Report.

While the Fed considers the Core PCE Price Index numbers a leading inflation indicator, the CPI Report carries significant weight. The Fed is looking for inflationary pressures to ease significantly to take its foot off the gas. Wage growth and tight labor market conditions remain risks to the inflation puzzle.

USD/JPY Price Action

Daily ChartThe Daily Chart showed the USD/JPY above the 141.9 – 141.2 support band. After the bullish Wednesday session, the USD/JPY remained above 50-day (141.011) and 200-day (137.322) EMAs, sending bullish near and longer-term price signals.

Notably, the 50-day EMA pulled further away from the 200-day EMA, signaling further price gains.

Looking at the 14-Daily RSI, the 60.82 reading offers a bullish outlook, supporting a return to 144 and a run at the 144.3 – 145.0 resistance band. However, a USD/JPY fall through the 141.9 – 141.2 support band would bring the 50-day EMA (141.011) into play.

USD/JPY Daily Chart sends bullish price signals.
USDJPY 100823 Daily Chart

4-Hourly Chart

Looking at the 4-Hourly Chart, the USD/JPY faces strong resistance at 144. The USD/JPY sits above the 141.9 – 141.3 support band and the 50-day (142.564) and 200-day (141.480) EMAs, sending bullish near and longer-term price signals. Significantly, the 50-day EMA pulled away from the 200-day EMA, signaling further gains.

A hold above the 50-day EMA and the 141.9 – 141.2 support band would support a run at the 144.3 – 145.0 resistance band. However, a fall through the 50-day EMA (142.564) would send the USD/JPY through the 141.9 – 141.2 support band and the 200-day EMA ($141.480) to sub-141.

The 14-4H RSI reading of 66.39 sends bullish signals, with buying pressure outweighing selling pressure. Significantly, the RSI aligns with the 50-day EMA, supporting a run at the 144.3 – 145.0 resistance band.

4-Hourly Chart affirms bullish price signals.
USDJPY 100823 4 Hourly Chart

USD/JPY Bulls to Target 144.5 on Hotter US Inflation Numbers

BTC Bears Eye Sub-$29,500 as the SEC Begins the Appeal Process

BTC Bears Eye Sub-$29,500 as the SEC Begins the Appeal Process

On Wednesday, bitcoin (BTC) fell by 0.51%. Partially reversing a 1.99% gain from Tuesday, BTC wrapped the day up at $30,190. Significantly, BTC held onto the $30,000 handle for the second time since July 23.

Bitcoin (BTC) Price Action

This morning, BTC was down 0.56% to $30,022. A mixed start to the day saw BTC rise to an early high of $30,243 before falling to a low of $30,020.

Trading Derivatives carries a high level of risk to your capital and you should only trade with money you can afford to lose. Trading Derivatives may not be suitable for all investors, so please ensure that you fully understand the risks involved, and seek independent advice if necessary. A Product Disclosure Statement (PDS) can be obtained either from this website or on request from our offices and should be considered before entering into a transaction with us. Raw Spread accounts offer spreads from 0.0 pips with a commission charge of USD $3.50 per 100k traded. Standard account offer spreads from 1 pips with no additional commission charges. Spreads on CFD indices start at 0.4 points. The information on this site is not directed at residents in any country or jurisdiction where such distribution or use would be contrary to local law or regulation.

Daily Chart

The Daily Chart showed BTC/USD sitting below the $30,750 – $31,250 resistance band. However, BTC sat above the 50-day ($29,546) and 200-day ($27,284) EMAs, sending bullish near and longer-term price signals. Notably, the 50-day EMA widened from the 200-day EMA, signaling further gains.

Looking at the 14-Daily RSI, the 54.26 reading reflects bullish sentiment. The RSI signals a breakout from the $30,750 – $31,250 resistance band to target $31,500. However, a fall through the 50-day EMA would bring sub-$28,500 and the $27,500 – $26,850 support band into view.

BTC Daily Chart sends bullish price signals.
BTCUSD 100823 Daily Chart

4-Hourly Chart

Looking at the 4-Hourly Chart, BTC remains below the $30,750 – $31,250 resistance band. However, BTC sits above the 50-day ($29,729) and 200-day ($29,659) EMAs, sending bullish near and longer-term price signals.

Significantly, the 50-day EMA pulled away from the 200-day EMA after the Wednesday bullish cross. A hold above the 50-day EMA would support a breakout from the $30,750 – $31,250 resistance band to target $31,500. However, a BTC fall through the EMAs would bring sub-$28,500 and the $27,500 – $26,850 support band into view.

The 14-4H RSI reading of 53.72 indicates a bullish stance, with buying pressure outweighing selling pressure. Significantly, the RSI aligns with the EMAs, signaling a return to $31,500.

4-Hourly Chart affirms bullish price signals.
BTCUSD 100823 4 Hourly Chart

Spot BTC ETF Chatter and US Bank Downgrades Delivered Price Support

BTC and the broader market succumbed to profit taking at the lower level of the $30,750 – $31,250 resistance band.

Uncertainty surrounding the spot BTC ETF applications and SEC Court filings in the SEC Ripple case left BTC and the broader market in negative territory. While the SEC v Ripple case does not directly impact BTC, a stay of all proceedings pending appeal would leave the US crypto market in limbo for even longer.

On Wednesday, the SEC filed a letter outlining its basis for filing a Motion for Leave to File an Interlocutory Appeal regarding ‘Programmatic’ offers and sales to XRP buyers over trading platforms and Ripple’s Other Distributions. Significantly, the SEC is asking for the Court not to enforce the Judgment on Programmatic Sales until after an appeal.

The Day Ahead

SEC v Ripple-related chatter, ETF updates, and Binance and Coinbase (COIN)-related news will move the dial.

However, US lawmaker chatter and SEC activity would also need consideration. US lawmaker reaction to the SEC Court filing would draw interest, though both sides of the aisle would need to deliver favorable comments to support a sustainable breakout.

In the US session, investors should consider the US CPI Report. A pickup in inflationary pressure would reignite bets on a September Fed interest rate hike, which could refuel recessionary jitters.

Bitcoin and Ether Show Bears’ Strength

Bitcoin and Ether Show Bears’ Strength

The crypto market slightly corrected its previous growth, losing 0.3% of its capitalisation to $1.176 trillion. Bitcoin lost 0.5%, Ether – 0.2%, while top altcoins moved from -1.2% (XRP) to +0.9% (Dogecoin).

Bitcoin daily chartOn Wednesday, Bitcoin attempted to climb above $30K and was again pushed back by sellers. The decline in financial markets didn’t help Bitcoin this time, as risk-off sentiment was driven by global economic growth and losses in tech stocks.

Trading Derivatives carries a high level of risk to your capital and you should only trade with money you can afford to lose. Trading Derivatives may not be suitable for all investors, so please ensure that you fully understand the risks involved, and seek independent advice if necessary. A Product Disclosure Statement (PDS) can be obtained either from this website or on request from our offices and should be considered before entering into a transaction with us. Raw Spread accounts offer spreads from 0.0 pips with a commission charge of USD $3.50 per 100k traded. Standard account offer spreads from 1 pips with no additional commission charges. Spreads on CFD indices start at 0.4 points. The information on this site is not directed at residents in any country or jurisdiction where such distribution or use would be contrary to local law or regulation.

The technical picture at the start of the day on Thursday is on the side of the bears, who have managed to keep BTCUSD below its 50-day moving average, signalling a change in the medium-term trend from bullish to bearish. A break below $28.8K can switch the entire crypto market into a faster sell-off mode.

Ethereum daily chartEthereum has also been trading below its 50-day moving average since late last month, with the sell-off intensifying as it approaches $1900. A break below $1800 would likely accelerate the liquidation of long positions and highlight that the road to recovery for the crypto market will be long and bumpy.

Crypto News

Another recalculation saw bitcoin mining difficulty rise by 0.12%. The index reached 52.39T. The average hash rate since the previous change was 374.85 EH/s.

Mike Novogratz, Galaxy Digital CEO, citing sources at BlackRock and Invesco, said the first spot bitcoin ETF could be approved in the US sometime before February 2024.

The US Federal Reserve has increased its oversight of regulated banks involved in crypto and stablecoin transactions. Financial institutions must now obtain written authorisation from the agency before issuing, storing, or transacting crypto assets.

The stablecoin market could grow from $125 billion today to $2.8 trillion in the next five years, Bernstein predicts.

Meanwhile, the developers of the Telegram-bot wallet based on The Open Network announced the launch of the beta version of the TON Space non-custodial wallet.

ETH Staking Statistics Signal a Shift in Sentiment Despite SEC Filing

ETH Staking Statistics Signal a Shift in Sentiment Despite SEC Filing

Ethereum (ETH) slipped by 0.05% on Wednesday. Following a 1.53% gain on Tuesday, ETH ended the day at $1,855. Significantly, ETH held onto the $1,850 handle for the second consecutive session.

Ethereum Price Action

This morning, ETH was down 0.30% to $1,850. A mixed start to the day saw ETH rise to an early high of $1,857 before falling to a low of $1,849.

Trading Derivatives carries a high level of risk to your capital and you should only trade with money you can afford to lose. Trading Derivatives may not be suitable for all investors, so please ensure that you fully understand the risks involved, and seek independent advice if necessary. A Product Disclosure Statement (PDS) can be obtained either from this website or on request from our offices and should be considered before entering into a transaction with us. Raw Spread accounts offer spreads from 0.0 pips with a commission charge of USD $3.50 per 100k traded. Standard account offer spreads from 1 pips with no additional commission charges. Spreads on CFD indices start at 0.4 points. The information on this site is not directed at residents in any country or jurisdiction where such distribution or use would be contrary to local law or regulation.

Daily Chart

The Daily Chart showed ETH hovering below the $1,865 – $1,895 resistance band. ETH sat below the 50-day EMA ($1,862) while holding above the 200-day ($1,788), sending bearish near-term but bullish longer-term price signals. Notably, the 50-day EMA narrowed to the 200-day EMA, a bearish price signal.

Looking at the 14-Daily RSI, the 47.31 reading reflects bearish sentiment, supporting a fall through the $1,815 – $1,795 support band to target the 200-day EMA ($1,788). However, an ETH move through the 50-day EMA ($1,862) would support a breakout from the $1,865 – $1,895 resistance band to target $1,950.

ETH Daily Chart sends mixed price signals.
ETHUSD 100823 Daily Chart

4-Hourly Chart

Looking at the 4-Hourly Chart, the ETH/USD faces strong resistance at $1,900. ETH sits below the $1,865 – $1,895 resistance band and the 200-day EMA ($1,862). However, ETH held above the 50-day EMA ($1,845), sending bullish near-term but bearish longer-term price signals.

An ETH move through the 200-day EMA would support a breakout from the $1,865 – $1,895 resistance band to target $1,950. However, a fall through the 50-day EMA would bring the $1,815 – $1,795 support band into play.

The 14-4H RSI reading of 53.73 sends bullish price signals, with buying pressure outweighing selling pressure. Significantly, the RSI signals a breakout from the 200-day EMA and the $1,865 – $1,895 resistance band to target $1,950.

4-Hourly Chart sends bullish near-term price signals.
ETHUSD 100823 4 Hourly Chart

The SEC Leaves ETH and the Broader Market in the Red

It was a busy Wednesday session, with the SEC v Ripple case in the spotlight.

“The SEC filed a letter outlining its basis for filing a Motion for Leave to File an Interlocutory Appeal regarding ‘Programmatic’ offers and sales to XRP buyers over trading platforms and Ripple’s Other Distributions.”

Defense attorney James Filan shared the news, adding,

“The SEC seeking a stay of all proceedings pending appeal is not unexpected.”

Significantly, the SEC is asking for the Court not to enforce the Judgment on Programmatic Sales until after an appeal.

SEC Chair Gary Gensler threw ETH into the Crypto Securities Basket earlier this year. Uncertainty about the outcome of the appeal would be a bearish scenario.

Staking Statistics Signals Improve Despite the Mixed Session

According to CryptoQuant, staking inflows increased from 41,792 ETH on Tuesday to 52,800 on Wednesday. Despite the increase, staking inflows remained below recent trends.

Staking inflows remain subdued.
Staking Inflows 100823The overnight withdrawal profile was bearish, with ETH principal withdrawals at above-normal levels. However, withdrawal projections for the morning session turned bullish. Projections show ETH withdrawals will stay at normal withdrawal levels.

Withdrawal projections are bullish.
Withdrawal Profile 100823On Wednesday, the net ETH staking balance stood at a 42,590 ETH surplus ($78.46 million), up 105% over 24 hours. Deposits totaled 48,130 versus withdrawals of 5,540 ETH.

According to TokenUnlocks, total pending withdrawals stood at 48,620 ETH, equivalent to approximately $90.03 million. Notably, the staking APR stood at 5.72%, unchanged over 24 hours. While the downward trend in staking APR remains bearish, the fall in total pending withdrawals and the jump in the net staking balance are bullish price signals.

Shopping Basket
Chat now!
1