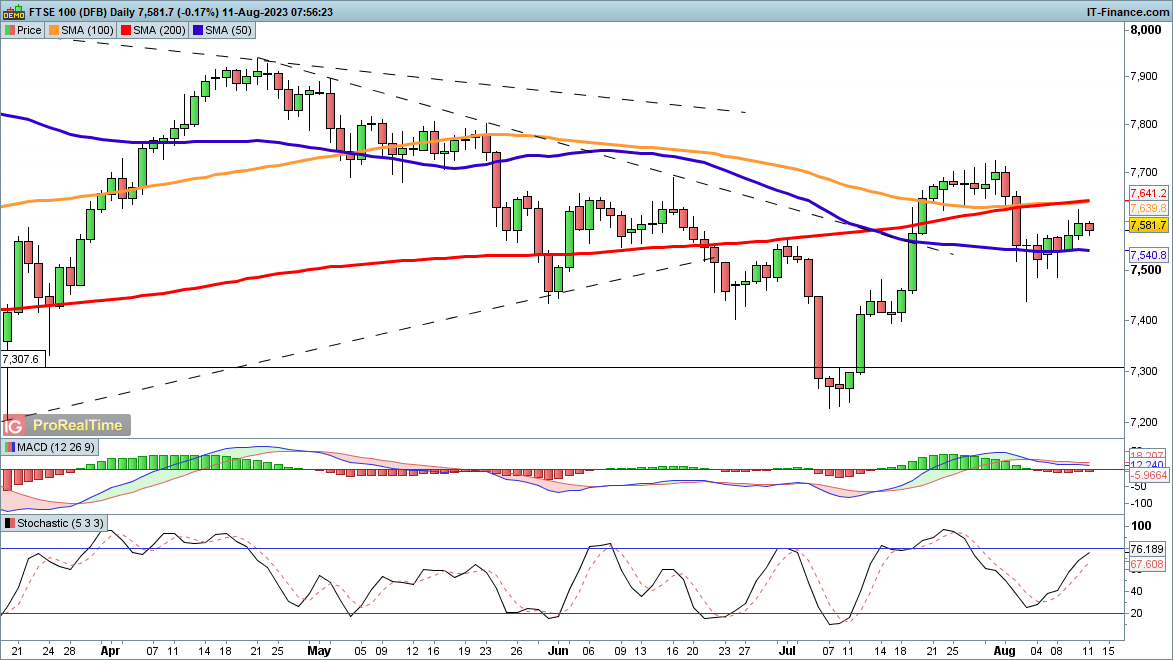
Friday’s losses have continued into a new week, with the index testing 7500 in early trading this morning. After failing to hold above 7600, a new bearish view appears to prevail. This will be cemented with a close below 7450 that might then see the price head lower, towards the lows of early July around 7250. Hopes of a break higher have been dashed for now.
It would need a move back above 7600 to suggest that the buyers are regaining control.
Learn How to Avoid Common Trading Mistakes – Download the Guide Below
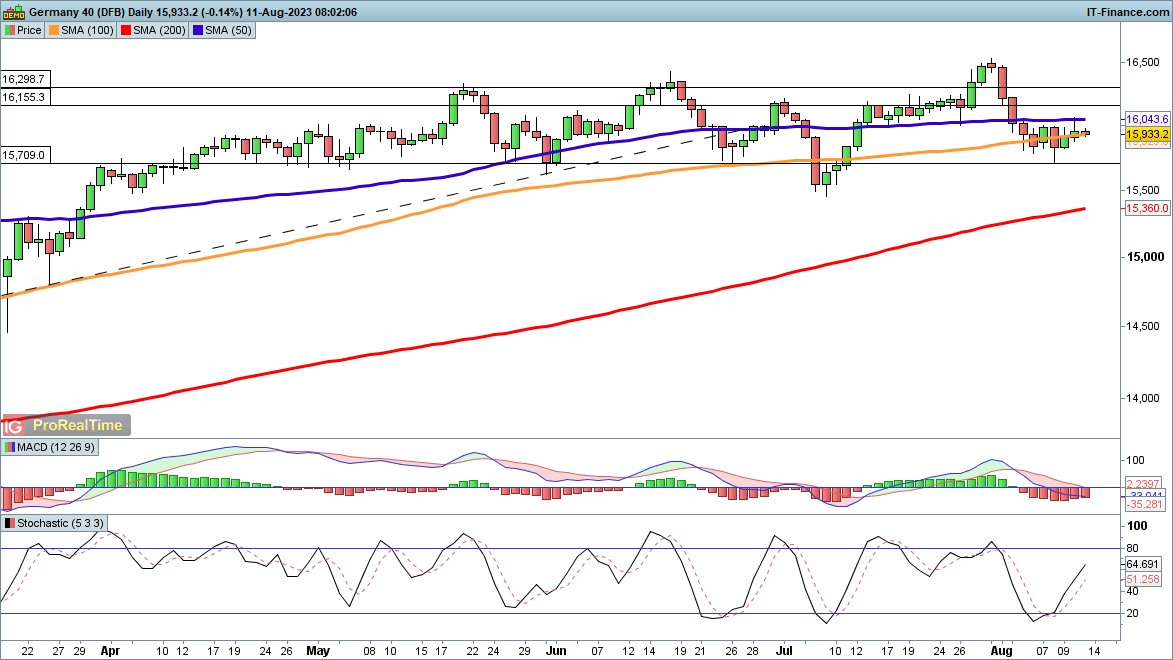
Losses have been stemmed at 15,700 over the past week, leaving bulls hopeful that the recent pullback can be halted and turned into a new move higher. A close back above the 50-day SMA is still needed for the buyers to reassert control. This then allows the price to contemplate a move back to 16,500, the high from the end of July.
The consolidation looks likely to resolve into a move higher unless sellers can achieve a daily close below 15,700, and then below 15,500.
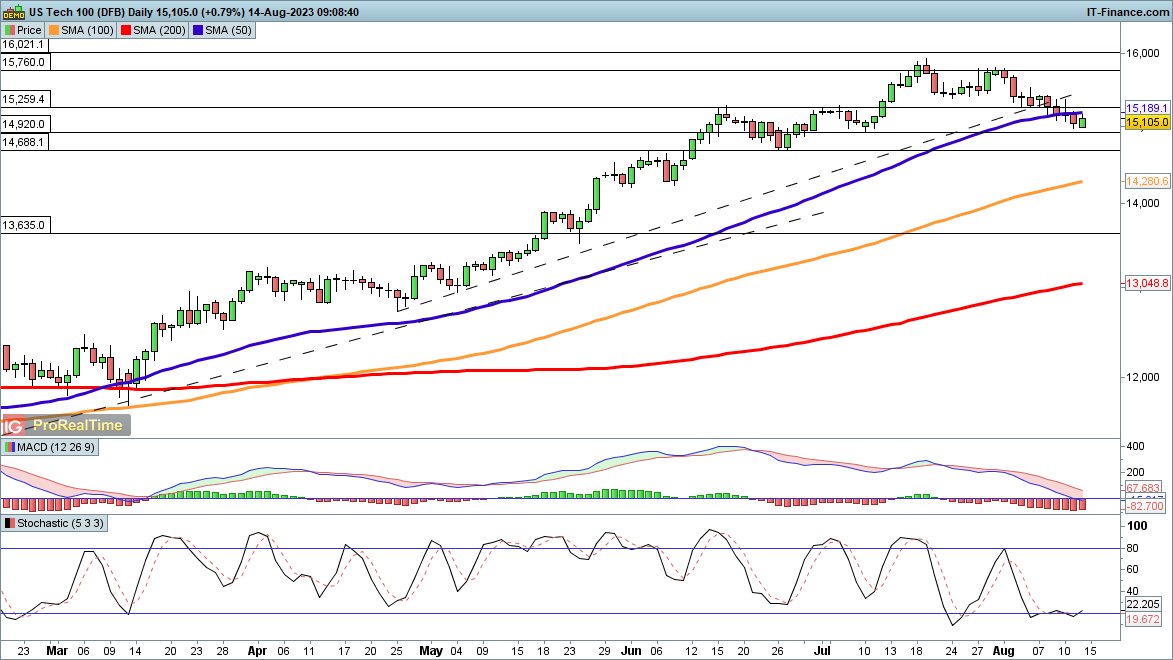
After pulling back over the past two weeks, the indexhas begun the week below the 50-day SMA, though it has edged higher in early trading.A close back above 15,260 might suggest that a higher low is in place and that a move back to the highs of July could now develop. This might then open the way to more gains, with the Q4 2021 record highs at 16,630 the next big level to watch.
Alternately, a close below 14,920 support would be a bearish development and bring the late June lows at 14,690 into view.
Gold markets have been slightly positive during the early hours on Friday, as we continue to look at the $1950 level with interest. The market is currently trading between the 50-Day EMA above, and the 200-Day EMA below. This typically means that you are going to see quite a bit of volatility, and this of course is especially true when you’re talking about the gold market.
Trading Derivatives carries a high level of risk to your capital and you should only trade with money you can afford to lose. Trading Derivatives may not be suitable for all investors, so please ensure that you fully understand the risks involved, and seek independent advice if necessary. A Product Disclosure Statement (PDS) can be obtained either from this website or on request from our offices and should be considered before entering into a transaction with us. Raw Spread accounts offer spreads from 0.0 pips with a commission charge of USD $3.50 per 100k traded. Standard account offer spreads from 1 pips with no additional commission charges. Spreads on CFD indices start at 0.4 points. The information on this site is not directed at residents in any country or jurisdiction where such distribution or use would be contrary to local law or regulation.
Be careful on the negative correlation between the US dollar and gold because the US dollar of course has been very noisy. There are a lot of concerns out there, so it’s not like that negative correlation has always been a major factor. In fact, the entire 1980s had seen a strong US dollar and strong gold at the same time. That being said, recently the correlation has been very negative, so it is certainly worth paying attention to it.
If the market were to break down below the 200-Day EMA, then it’s possible that the market truly falls apart. That involves dancing around the $1900 level, which opens up a move down to the $1800 level rather quickly. On the other hand, if we were to break above the 50-Day EMA, then it’s very likely that we eventually test the psychologically important $2000 level, an area that one would have to assume that there are a lot of options expiring at various time frames in that general region. Breaking above the $2000 level opens up the possibility of a move to the $2050 level and beyond.
Ultimately, this is a market that has been very choppy, and somewhat sideways, albeit with a very slight tilt to the upside. With this, I think that the market does have a real opportunity to continue to go higher over the longer-term, but it is not going to be an easy move. It will take a lot of patience to realize gains in this market, although it does look like we are at least trying to get back to the upswing currently. With this, I am mildly optimistic but also recognize that gold has a lot of work ahead of itself.
Its recent price fluctuations have once again brought its inherent volatility to the forefront of discussions among traders and investors. Friday’s trading session, in particular, provided a vivid illustration of this volatility, as the market experienced an initial attempt at decline, followed by a subsequent recovery of gains. This roller-coaster ride has prompted many to reevaluate their strategies and perspectives on silver’s trajectory.
Trading Derivatives carries a high level of risk to your capital and you should only trade with money you can afford to lose. Trading Derivatives may not be suitable for all investors, so please ensure that you fully understand the risks involved, and seek independent advice if necessary. A Product Disclosure Statement (PDS) can be obtained either from this website or on request from our offices and should be considered before entering into a transaction with us. Raw Spread accounts offer spreads from 0.0 pips with a commission charge of USD $3.50 per 100k traded. Standard account offer spreads from 1 pips with no additional commission charges. Spreads on CFD indices start at 0.4 points. The information on this site is not directed at residents in any country or jurisdiction where such distribution or use would be contrary to local law or regulation.
The prevailing narrative surrounding silver seems to be centered on the uphill battle of achieving upward momentum, especially in the short term. It’s evident that silver is facing challenges in maintaining a steady ascent. Amid this immediate struggle, a prevailing sentiment suggests that while silver’s path may currently be rocky, it is poised for higher price levels in the long run. However, before embarking on that anticipated ascent, a period of seeking stability might be on the horizon.
One key factor that experts and traders are closely monitoring is the potential inverse relationship between silver and the US dollar. This dynamic has recently wielded substantial influence on market movements. As the dollar strengthens, silver tends to face headwinds, and vice versa. This intricate dance between the two assets has added an extra layer of complexity to the market’s dynamics.
At present, all eyes are fixed on a critical support level at $22, a juncture that has proven significant on multiple occasions. If this level is breached, it could potentially trigger a more pronounced retreat in the market. In such a scenario, the silver market might find itself descending toward the pivotal $20 mark, a level that carries not only historical importance but also psychological weight, rendering it a key reference point for traders and analysts alike.
On the flip side, a reversal from the current stance, leading to a recapture of the 200-Day Exponential Moving Average, could signal a potential path toward the $24 level. This aligns closely with the 50-Day EMA, potentially acting as a catalyst for injecting momentum into the market. The convergence of these technical indicators might incite heightened trading activity as traders react to shifting market dynamics.
Despite the current market environment’s struggles, it’s important to recognize the presence of substantial underlying support. The central question revolves around the likelihood of a bounce that could potentially facilitate a recovery within the broader consolidation range. In this climate of uncertainty, practicing patience and allowing the market to dictate its trajectory is advisable, as attempting to predict or preempt market movements could expose traders to risks.
In the last 24 hours, the euro displayed a noteworthy upswing, finding support in a rebound from the 50-Day Exponential Moving Average. The significance of the 50-Day EMA as a pivotal indicator is not lost on market participants, who are closely scrutinizing it for potential market direction cues. Positioned below current levels, the 1.09 mark serves as a crucial support level. Further down the line, attention is drawn to the 200-Day EMA, strategically situated at the conflux point with the discernible uptrend line. The prominence of this evident uptrend line demands universal attention, functioning as a focal point within the market landscape.
Trading Derivatives carries a high level of risk to your capital and you should only trade with money you can afford to lose. Trading Derivatives may not be suitable for all investors, so please ensure that you fully understand the risks involved, and seek independent advice if necessary. A Product Disclosure Statement (PDS) can be obtained either from this website or on request from our offices and should be considered before entering into a transaction with us. Raw Spread accounts offer spreads from 0.0 pips with a commission charge of USD $3.50 per 100k traded. Standard account offer spreads from 1 pips with no additional commission charges. Spreads on CFD indices start at 0.4 points. The information on this site is not directed at residents in any country or jurisdiction where such distribution or use would be contrary to local law or regulation.
Consequently, a favorable outlook emerges, suggesting that surpassing the 1.1050 level could strongly indicate the continuation of the euro’s upward trajectory, potentially extending its momentum towards the 1.1250 level. This zone has proven its significance across multiple instances and historically marked pivotal reversal points. A successful breach at this juncture could conceivably unlock avenues for additional gains. With comprehensive analysis considered, the prevailing uptrend remains unshaken, and at present, substantial indicators of any significant shifts are absent. This prevailing market atmosphere is characterized by its volatility, as evidenced by frequent fluctuations.
Contemplating the possibility of a decline beneath the underlying uptrend line, a scenario might emerge where the market endeavors to gravitate towards the 1.06 level. A breach of this crucial trendline would transcend beyond being a mere support breach; it could underscore a potential reinforcement of the US dollar against not just the euro but also a spectrum of other assets.
Regardless of the unfolding scenario, it is prudent to brace for amplified volatility. Present circumstances firmly indicate the endurance of the overarching uptrend, hinting at an ongoing interest from buyers, particularly within the short term. Nevertheless, it’s vital to recognize the importance of specific pivotal levels, as previously highlighted, as they hold the potential to act as early precursors to a conceivable shift under evolving market dynamics. Turbulence is anticipated in this trading context, yet the bedrock of backing and buyer involvement is expected to remain unswerving. Pertinently, keeping a close watch on inflation metrics in the United States becomes a pivotal exercise to ascertain the sustainability of this reinforcing trend.
In summation, the recent trading session showcased a restrained surge in the euro, buoyed by a bounce from the 50-Day EMA. The ongoing ascent of the market is intrinsically linked to its ability to breach and conquer key thresholds such as 1.1050 and 1.1250. The existing upward trend retains its dominant influence, though diligence towards pivotal junctures and macroeconomic indicators, particularly US inflation data, is strongly recommended.
The USD to CAD forex pair is showing resilience, eyeing its fourth consecutive weekly gain despite data that U.S. inflation in July was softer than anticipated.
US Inflation Misses Forecast
U.S. consumer inflation data from Thursday reported a 0.2% rise, consistent with June’s figures, and a year-on-year increase of 3.2%, slightly under Reuters’ projection of 3.3%. While the Forex pair initially dipped after this reveal, it recuperated as the day progressed, showcasing its strength. The core CPI reading, which excludes volatile food and energy prices, increased by an annual 4.7%.
Trading Derivatives carries a high level of risk to your capital and you should only trade with money you can afford to lose. Trading Derivatives may not be suitable for all investors, so please ensure that you fully understand the risks involved, and seek independent advice if necessary. A Product Disclosure Statement (PDS) can be obtained either from this website or on request from our offices and should be considered before entering into a transaction with us. Raw Spread accounts offer spreads from 0.0 pips with a commission charge of USD $3.50 per 100k traded. Standard account offer spreads from 1 pips with no additional commission charges. Spreads on CFD indices start at 0.4 points. The information on this site is not directed at residents in any country or jurisdiction where such distribution or use would be contrary to local law or regulation.
Fed Expected to Retain Rates
Investors remain confident that the Federal Reserve will retain its benchmark interest rate between 5.25-5.5% during its September gathering. The recent inflation report adds weight to this speculation, with futures traders estimating a near-90% probability of this scenario – an increase from an already dominant 85% prior to the data’s release.
Fed’s Daly Cautions on Rate Halt
Contrarily, there’s a growing belief that the U.S. central bank can achieve an economic “soft landing” due to subdued inflation and a relaxing labor market. Yet, this optimism isn’t universal. San Francisco Fed President Mary Daly recently conveyed hesitance, suggesting it might be early to believe the central bank has halted its rate hikes.
Short-Term Outlook
Despite the initial dip post-inflation data, the recovery of USD to CAD indicates a bullish sentiment. Later today, the focus will shift to U.S. producer price inflation data, providing further direction for investors.
Technical Analysis
4-Hour USD to CADThe USD to CAD, with a current price of 1.3439, is slightly below its previous 4-hour close of 1.3444. Relative to its 200-4H moving average of 1.3257, the pair is trading above, indicating a bullish trend. It also sits above the 50-4H moving average of 1.3190, further reinforcing this bullish sentiment. The 14-4H RSI at 57.64 suggests a momentum leaning towards the stronger side but hasn’t reached an overbought level yet.
Currently, the currency pair trades near the upper end of its main resistance area, with a significant support buffer below. Overall, the market appears bullish for the USD to CAD.
The index managed to push its way above 7600 yesterday but was unable to hold these gains. A reversal below 7540 and the 50-day SMA would be a bearish development and signal that the sellers were in control once more. This might then open the way to a move to the lows of July around 7250.
A close above 7600 would mark a more bullish event and then allow the price to contemplate a renewed move to 7700. This is where the July rally stalled, so a close above this level would add to the bullish view.
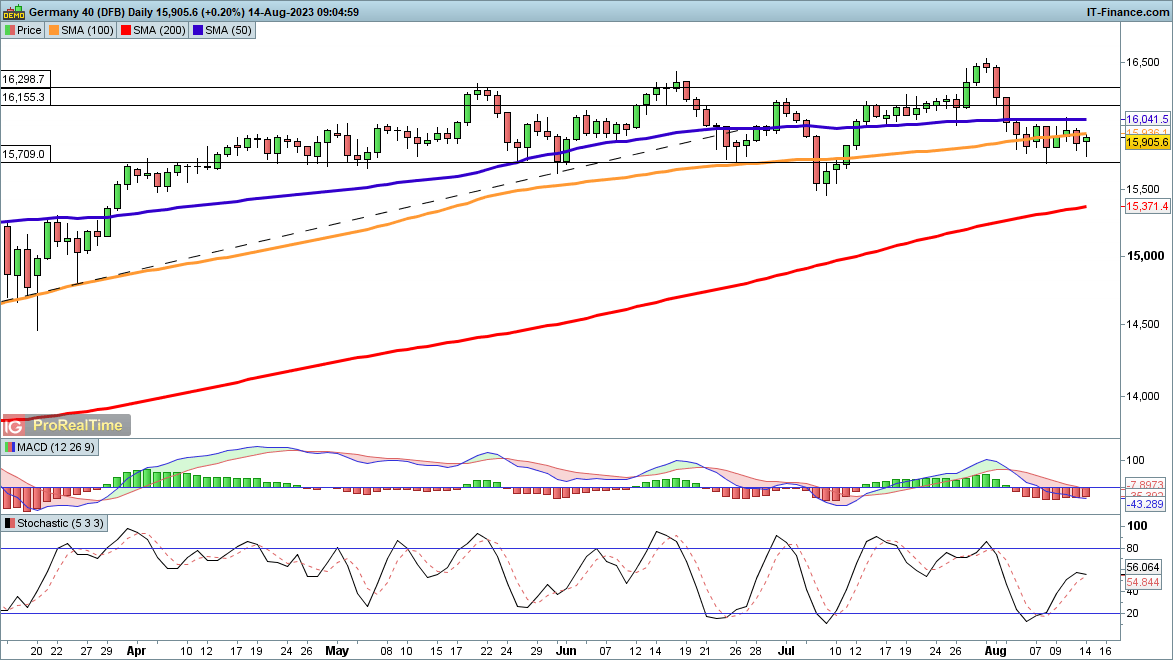
European indices had gained in the wake of the US CPI reading, but then failed to hold their gains. The Dax succeeded in reaching the 50-day SMA again but then fell back. Early trading this morning has seen the index drop back slightly. Further losses would suggest a retest of 15,700, and then down to 15,500 and the July low.
As throughout the past week, bulls will need a close above 16,000 to provide the necessary catalyst for a new move back to the record highs seen in July.
DAX 40 Daily Chart
Download the Free IG Client Sentiment Report to See How Shifts in Daily and Weekly Sentiment Affect Price Expectations
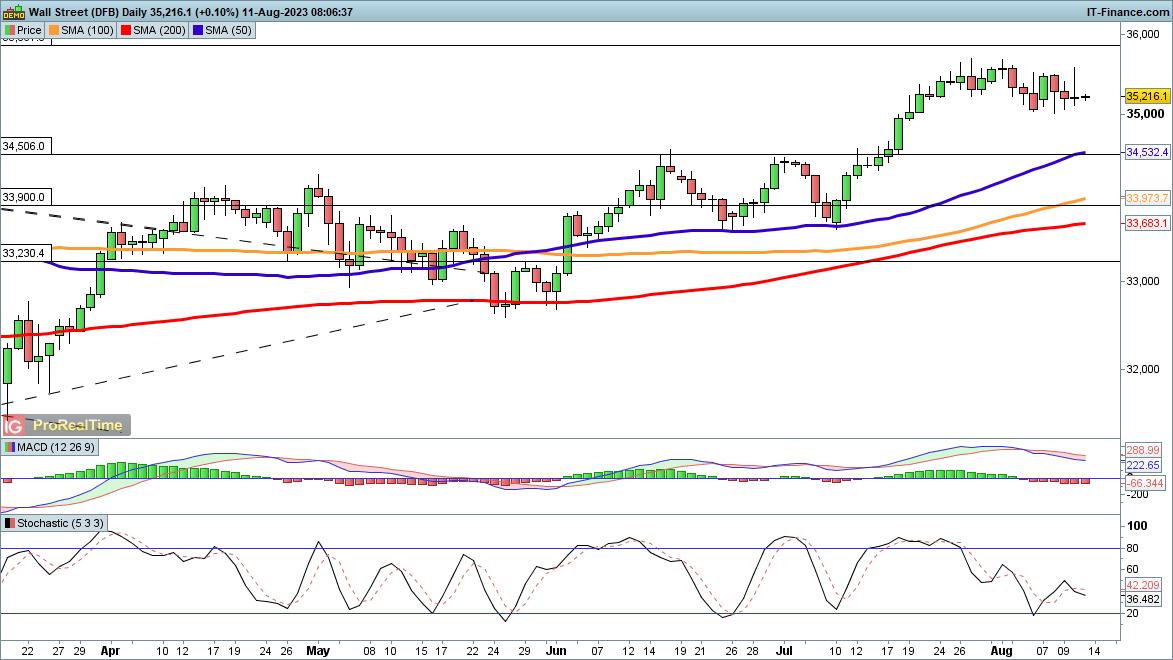
The Dow suffered a notable intraday reversal yesterday, after attempting to rally above 35,500 following the inflation reading. For the current weakness to turn into even a modest pullback to the 50-day SMA, the 35,060 level needs to be broken on a daily closing basis. This might then see further losses toward the June resistance level of 34,506.
For the moment, however, price action still looks like consolidation, and continued activity above 35,000 will bolster bullish hopes that a new move higher can develop.
Headline and core y/y CPI inflation undershoots slightly Bloomberg consensus (by 0.1%) (and below Cleveland Fed nowcast for headline of 0.4% m/m, see yesterday’s post). Overall, trend is down even if headline y/y is ticks up slightly. chart Figure 1: Annualized CPI inflation, year-on-year (bold black), quarter-on-quarter (tan), month-on-month (green), and instantaneous per Eeckhout, T=12, a=4 (bold red). Source: BLS, and author’s calculations. As discussed in Justin Ho’s Marketplace piece yesterday, the year-on-year calculation doesn’t show everything. In particular, q/q and m/m are down
Monthly construction output is estimated to have increased 1.6% in volume terms in June 2023; this came from increases in both new work (2.0%) and repair and maintenance (1.1%) on the month.
At the sector level, six out of the nine sectors saw a rise in June 2023, with the main contributors to the monthly increase seen in infrastructure new work and non-housing repair and maintenance, which increased 4.7% and 3.4%, respectively.
Quarterly construction output increased 0.3% in Quarter 2 (Apr to June) 2023 compared with Quarter 1 (Jan to Mar) 2023; the increase came solely from June 2023, with an increase in repair and maintenance (0.9%), while new work saw a decrease of 0.1%.
Total construction new orders decreased 7.1% (£786 million) in Quarter 2 2023 compared with Quarter 1 2023; this quarterly fall came mainly from public other new orders and infrastructure new orders, which fell 32.9% (£576 million) and 26.5% (£519 million), respectively.
The annual rate of construction output price growth was 4.6% in the 12 months to June 2023; this has slowed from the record annual price growth in May 2022 (10.4%).
Monthly construction output increased 1.6% in June 2023. This follows three consecutive falls in monthly construction output. This is the highest level of construction output (£15,620 million) since records began in January 2010.
Figure 1: Monthly all work construction output index in June 2023 increased on the month, with an increase in both new work (2.0%) and repair and maintenance (1.1%)
Monthly all work index, chained volume measure, seasonally adjusted, Great Britain, January 2010 to June 2023
Source: Construction output and employment data from the Office for National Statistics
MILAN: Italian Prime Minister Giorgia Meloni’s government watered down its surprise windfall tax on banks this week after a brutal market reaction, but the damage to investor confidence was done.
“The most damaging impact… will not be the hit to the earnings of Italian banks but the higher risk premium that investors will demand to compensate them for the risk of future government intervention,” noted Johann Scholtz, analyst at Morningstar.
Meloni’s hard-right government announced out of the blue on Monday night that it would levy a 40-percent tax on banks’ “surplus profits” generated by interest rate hikes, due to last one year.
Shares in Italian banks plunged the next day on the Milan exchange, losing 9.5 billion euros ($10.5 billion) in capitalisation – a figure well in excess of the money Rome had hoped to raise from the tax.
That evening, the government announced the levy would be capped at 0.1 percent of the total assets of a bank, causing them to recover some of their lost ground in trading on Wednesday and Thursday.
But ratings agency Moody’s said on Thursday that the one-off tax would “lower profits systemwide and significantly reduce the benefit of increased interest rates to the sector”.
Parliament must still approve the decree law but if implemented in its current form, the levy would represent “about 15 percent” of Italian banks’ net income in 2022, it said.
‘Haphazard manner’
It was Meloni’s first showdown with the markets since she took office in October, after her far-right Brothers of Italy party came top in September’s general election.
Initial alarm at the potential for radical change in the eurozone’s third-largest economy gave way to relief as Meloni mostly followed the path set by her predecessor, former European Central Bank chief Mario Draghi.
One of Draghi’s ministers, Giancarlo Giorgetti of the far-right League party, stayed on as Meloni’s economy minister.
He reassured banks in June that a windfall tax was not on the cards – but was absent on Monday when the measure was unveiled by League leader Matteo Salvini.
“An economy minister who does not show up for a press conference in such an occasion gives a very bad image of the country,” noted Francesco Giavazzi, a former economic advisor to Draghi.
“The haphazard manner of the announcement, where the government changed the terms of the tax at least three times in one day, will do little to restore investor confidence,” added Scholtz.
‘Populist target’
While Meloni left the announcement of the tax to Salvini, her deputy prime minister, she defended it in a video posted on social media on Wednesday.
She criticised the “unfair margins” of the banks, and said the money raised would help “fund measures of support for households and businesses” struggling with record inflation.
Italian banks, like their European counterparts, saw their net interest income soar in the wake of the European Central Bank’s rise in interest rates.
The government – which also includes the Forza Italia party of late former premier Silvio Berlusconi – has been criticised for cutting an anti-poverty mechanism and blocking opposition calls for a minimum wage.
“Banks are an easy populist target and their bashing can only attract political support,” said Lorenzo Codogno, former chief economist at the Italian Treasury.
But he warned that “a Soviet-style tax” such as this week’s levy “risks producing permanent damage to the attractiveness of Italy’s economy”.
World oil demand is scaling record highs, boosted by strong summer air travel, increased oil use in power generation and surging Chinese petrochemical activity. Global oil demand is set to expand by 2.2 mb/d to 102.2 mb/d in 2023. IEA #oott