Oil Price Forecast: China’s Economic Woes, US Dollar Strength Threaten Rally

Oil Price Forecast: China’s Economic Woes, US Dollar Strength Threaten Rally

Overview

Oil prices saw a dip on Monday, in a market that has been riding a seven-week high, due to concerns stemming from China’s wobbly economic stance and a bolstering U.S. dollar. This shift seems to be at odds with the persistent positive sentiment around U.S. economic health.

China’s Economic Challenges

China, an economic powerhouse, appears to be struggling to regain its footing post-pandemic. This slowdown in recovery, coupled with a dominant U.S. dollar, threatens to suppress oil demand, making it costlier for international buyers who hold other currencies.

Trading Derivatives carries a high level of risk to your capital and you should only trade with money you can afford to lose. Trading Derivatives may not be suitable for all investors, so please ensure that you fully understand the risks involved, and seek independent advice if necessary. A Product Disclosure Statement (PDS) can be obtained either from this website or on request from our offices and should be considered before entering into a transaction with us. Raw Spread accounts offer spreads from 0.0 pips with a commission charge of USD $3.50 per 100k traded. Standard account offer spreads from 1 pips with no additional commission charges. Spreads on CFD indices start at 0.4 points. The information on this site is not directed at residents in any country or jurisdiction where such distribution or use would be contrary to local law or regulation.

U.S. Economic Optimism & OPEC+ Influence

Despite the bearish cues from China and the eurozone, the oil market has remained notably bullish due to consistent optimism surrounding U.S. economic prospects. On the supply side, OPEC+, with key players Saudi Arabia and Russia, is determined to tighten oil supply, suggesting they’re gearing up to provide a counterbalance. The International Energy Agency’s (IEA) latest report hints at further inventory depletions, potentially spiraling oil prices even higher.

Geopolitical Tensions & U.S. Production

Geopolitical tensions flare as a Russian warship confronts a cargo vessel in the Black Sea, a pivotal region for commodities exports from both Ukraine and Russia. Meanwhile, in the U.S., despite the robust economic outlook, oil rig operations remained stable, reflecting perhaps a more cautious approach to production.

Short-term Forecast

While China’s economic hurdles and a resilient U.S. dollar pose bearish threats, OPEC+’s strategy might offset these challenges. However, unforeseen geopolitical issues could introduce volatility. In the short term, we can expect the market to tread cautiously, with a bearish tilt, awaiting clearer signals from both economic and geopolitical arenas.

Technical Analysis

4-Hour Crude OilThe Crude Oil price has seen a minor decline from 83.04 to 82.40. Positioned above the long-term 200-4H moving average of 76.84, it suggests an overarching bullish trend. However, its position below the 50-4H moving average at 82.28 and close to the lower boundary of the resistance zone (81.73 to 83.63) indicates near-term bearish pressures. The 14-4H RSI, at 45.50, confirms this slowing momentum, though it’s not signaling an oversold market yet.

Given the proximity to the resistance zone and the recent dip below the shorter-term moving average, the market sentiment leans bearish in the short term.

Natural Gas Forecast: Steady in Anticipation of Potential Demand Surge

Natural Gas Forecast: Steady in Anticipation of Potential Demand Surge

Overview

U.S. natural gas futures are showing signs of resilience this Monday, making a comeback from a sharp two-day decline that almost nullified last week’s gains. The initial price behavior hints at steady demand forecasts, with potential for even stronger demand looming on the horizon.

Supply Dynamics

The U.S. Energy Information Administration (EIA) disclosed that utilities have injected 29 billion cubic feet (bcf) of gas into storage for the week ending Aug 4. This surpassed analysts’ expectations by 4 bcf and took the total reserves to 3.030 trillion cubic feet (tcf), marking an 11% increase from the five-year average. On the flip side, U.S. energy firms have reduced the count of active oil and natural gas rigs, hinting at possible changes in future output.

Trading Derivatives carries a high level of risk to your capital and you should only trade with money you can afford to lose. Trading Derivatives may not be suitable for all investors, so please ensure that you fully understand the risks involved, and seek independent advice if necessary. A Product Disclosure Statement (PDS) can be obtained either from this website or on request from our offices and should be considered before entering into a transaction with us. Raw Spread accounts offer spreads from 0.0 pips with a commission charge of USD $3.50 per 100k traded. Standard account offer spreads from 1 pips with no additional commission charges. Spreads on CFD indices start at 0.4 points. The information on this site is not directed at residents in any country or jurisdiction where such distribution or use would be contrary to local law or regulation.

Current Demand Conditions

Despite the extended heatwave, especially in Texas where power demand soared to record levels, the robust production has managed to meet domestic needs. Meteorologists anticipate this hotter-than-average trend to continue across the lower 48 states until at least Aug. 26.

Demand and Supply Forecasts

Refinitiv, a prominent data provider, predicts that U.S. gas demand (inclusive of exports) will surge from 103.0 billion cubic feet per day (bcfd) to 104.5 bcfd this week. They attribute this to increased consumption by power generators and rising exports. On the supply side, the average gas output remained consistent, clocking 101.9 bcfd this August, quite close to July’s figure.

Short-term Outlook:  Slightly Bullish

With the balance between rising inventories and higher cooling demands due to persistent hot weather, the natural gas market shows a bullish tendency. The consistent gas production, coupled with potential increments in demand and existing weather conditions, signifies that prices may witness an upward trajectory in the short run.

Technical Analysis

4-Hour Natural GasNatural Gas is currently trading at a 4-hour price of 2.810, a small increment from its prior 4-hour price of 2.806. Positioned above its 200-4H moving average (2.671), it reveals a bullish trajectory. Additionally, its placement above the 50-4H moving average (2.707) reinforces this bullish sentiment. The 14-4H RSI, measured at 53.55, denotes a momentum slightly favoring the bulls.

Currently, the commodity is significantly above its main support bracket of 2.542 to 2.487, yet remains beneath the principal resistance territory of 3.027 to 3.091. Piecing together all indicators, the current market sentiment for Natural Gas appears dominantly bullish.

DAX Set for a Bearish Open on China Woes

DAX Set for a Bearish Open on China Woes

It was a bearish end to a bearish week for the DAX. On Friday, the DAX fell by 1.03%. Reversing a 0.91% gain from Thursday, the DAX ended the week down 0.75% to 15,832.

Investors brushed aside euro area economic indicators, with US inflation the focal point in the second half of the week. Hotter-than-expected US producer price index numbers fueled Fed Fear, leaving the DAX in negative territory.

Trading Derivatives carries a high level of risk to your capital and you should only trade with money you can afford to lose. Trading Derivatives may not be suitable for all investors, so please ensure that you fully understand the risks involved, and seek independent advice if necessary. A Product Disclosure Statement (PDS) can be obtained either from this website or on request from our offices and should be considered before entering into a transaction with us. Raw Spread accounts offer spreads from 0.0 pips with a commission charge of USD $3.50 per 100k traded. Standard account offer spreads from 1 pips with no additional commission charges. Spreads on CFD indices start at 0.4 points. The information on this site is not directed at residents in any country or jurisdiction where such distribution or use would be contrary to local law or regulation.

China’s economic woes added to the bearish mood, with trade and inflation numbers from the weak painting a grim picture of China’s economy. Trouble across the real estate sector was also a drag.

The Dow rose by 0.30% on Friday. However, the NASDAQ Composite Index and the S&P 500 saw losses of 0.68% and 0.11%, respectively.

Daily Chart sends bearish price signals.
DAX 140823 Daily Chart

US Producer Price Report Sends DAX South

Investors brushed aside finalized inflation numbers from France, despite revisions to prelim figures. Consumer prices increased by 0.1% in July versus +0.2% in June. The prelim report showed consumer prices flat in July.

However, US producer price index numbers for July moved the dial. After sticky US core inflation numbers on Thursday, producer prices increased by more than expected in July, raising expectations of a more hawkish Fed.

The US producer and core producer prices increased by 0.3% in July. Economists forecast producer and core prices to rise by 0.2%.

Late in the session, US consumer sentiment figures failed to deliver support despite softer inflation expectations. The Michigan Consumer Sentiment Index slipped from 71.6 to 71.2, while the inflation expectations eased from 3.4% to 3.3%.

The Market Movers

It was a bearish session for the auto sector. Continental AG slid by 3.21%, with Mercedes-Benz Group and BMW seeing losses of 1.87% and 1.73%, respectively.

Porsche and Volkswagen ended the day down 0.78% and 0.65%, respectively.

It was a mixed session for the banks. Commerzbank gained 2.23%, while Deutsche Bank fell by 0.71%.

Continental AG was among the worst performers.

The Day Ahead for the DAX

It is a quiet start to the European session, with no economic indicators from China to move the dial.

However, German wholesale inflation figures will draw interest. A more marked fall in wholesale prices would signal weaker demand, a bearish scenario for the DAX. Economists forecast wholesale prices to fall by 2.5% year-over-year in July versus a 2.9% decline in June.

There are no US economic indicators for investors to consider, leaving sentiment toward the economic outlook for German and China and Fed monetary policy to influence.

While there are no economic indicators to consider, investors should monitor the news wires for central bank chatter.

DAX Technical Indicators

Looking at the EMAs and the 4-hourly chart, the EMAs sent bearish signals. The DAX sat below the 50-day (16,010) and 200-day (15,951) EMAs, sending bearish near and longer-term price signals.

Significantly, the 50-day EMA narrowed to the 200-day EMA, sending bearish price signals and supporting a DAX return to sub-15,750 to bring the 15,600 – 15,525 support band into play.

However, a DAX move through the 200-day EMA (15,951) would give the bulls a run at the 50-day EMA (16,020) and the 16,000 – 16,080 resistance band.

The 14-4H RSI sits at 41.89, reflecting bearish sentiment, with selling pressure overweighing buying pressure. Significantly, the RSI aligns with the EMAs, supporting a return to 15,750 to target the 15,600 – 15,525 support band.

DAX 4-Hourly Chart affirms bearish price signals.
DAX 140823 4-Hourly Chart
USD to CAD Price Forecast: Soars Amid Rising U.S. Treasury Yields

USD to CAD Price Forecast: Soars Amid Rising U.S. Treasury Yields

Overview

The USD to CAD currency pair is showing significant strength, moving swiftly towards its multi-month pinnacle of 1.3502, established on August 8. This surge is primarily fueled by the rise in U.S. Treasury yields. Recent market sentiments underscore the notion that, despite the Federal Reserve’s current stance, commercial rates combined with bond yields are on an upward march.

July U.S. Producer Prices Surge

This boost in Treasury yields was further amplified by data unveiled last Friday, revealing a rise in U.S. producer prices for July. This increase surpassed initial forecasts, largely attributed to the rebound of service costs, marking their swiftest pace of growth in almost a year. Earlier, on Thursday, data had confirmed a moderate increment in consumer prices for July, casting shadows of doubt on the Federal Reserve’s future rate hike strategies.

Trading Derivatives carries a high level of risk to your capital and you should only trade with money you can afford to lose. Trading Derivatives may not be suitable for all investors, so please ensure that you fully understand the risks involved, and seek independent advice if necessary. A Product Disclosure Statement (PDS) can be obtained either from this website or on request from our offices and should be considered before entering into a transaction with us. Raw Spread accounts offer spreads from 0.0 pips with a commission charge of USD $3.50 per 100k traded. Standard account offer spreads from 1 pips with no additional commission charges. Spreads on CFD indices start at 0.4 points. The information on this site is not directed at residents in any country or jurisdiction where such distribution or use would be contrary to local law or regulation.

Market Expects Steady Federal Rates

Market pundits now gauge an approximate 89% probability that the Fed will maintain interest rates during its upcoming meeting, as indicated by the CME FedWatch tool. The general consensus seems to be in favor of no additional hikes for the remainder of the year, even though some central bank officials believe it’s premature to draw such conclusions.

July Retail Sales to Influence Fed

However, ANZ analysts opine that recent labor and inflation metrics signify the likelihood of the Fed retaining unchanged rates in their September assembly. They accentuated the forthcoming July retail sales data as a crucial determiner, highlighting the U.S. consumer’s resilience in these testing times. Factors such as escalating fuel prices and tightening credit conditions are anticipated to play a pivotal role.

Short-Term Forecast:  Bullish

As we approach the release of the U.S. Federal Reserve’s July meeting minutes, the USD to CAD’s performance remains crucial. Current trends and underlying data hint towards a bullish stance for the currency pair.

Technical Analysis

4-Hour USD to CADThe USD to CAD is displaying minor retreat from its previous 4-hour close, though the movement is negligible. When contrasted with the 200-4H moving average at 1.3266, the currency pair exhibits a bullish position, trading well above this key average.

Similarly, the currency slightly exceeds the 50-4H moving average of 1.3394, further emphasizing its robust standing. The 14-4H RSI, positioned at 60.28, leans towards stronger momentum, though not in the overbought territory.

Finally, the USD to CAD sits slightly above the main resistance area, suggesting building upside momentum. Summarily, the current sentiment for USD to CAD in the short term appears bullish.

German Wholesale Prices Down 2.8% in July

German Wholesale Prices Down 2.8% in July

It is a relatively busy day on the European economic calendar. German wholesale inflation figures were in focus this morning. The weak demand environment has continued to weigh on output prices, sparking fears of a deeper ECB-fueled economic recession in Germany.

German wholesale inflation figures provided little comfort. In July, the German wholesale price index fell by 2.8% year-over-year versus a forecasted 2.6% decline. Wholesale prices declined by 2.9% in June.

  • Wholesale prices of mineral oil products continued to weigh on the Indedx, tumbling by 20.8% year-over-year.
  • There were also significant declines in wholesale prices for waste and scrap (-32.8%), grain, unmanufactured tobacco, seeds, & animal seeds (-21.4%), metals & ores (-18.3%), and chemical products (-16.5%).
  • However, prices for fruit and vegetables were up 27.5%.
  • There were also wholesale price increases for live animals (+27.7%).

While the wholesale price index fell by just 0.2% in July, month-on-month, the latest report continued reflecting a weak demand environment.

EUR/USD Reaction to German Wholesale Inflation

Ahead of the German wholesale inflation numbers, the EUR/USD rose to an early high of $1.09543 before falling to a pre-stat low of $1.09293.

However, in response to the wholesale inflation numbers, the EUR/USD fell from $1.09373 to a post-stat low of $1.09270.

This morning, the EUR/USD was down 0.15% to $1.09304.

EUR/USD responds to German wholesale prices

Next Up

There are no euro area economic indicators to draw interest. The lack of economic indicators will leave central banks and Beijing in focus. Stimulus talk from Beijing would support riskier assets, while central bankers may need to tiptoe around the current risk-off sentiment.

However, No ECB or FOMC members are on the calendar to speak today, leaving chatter with the media to influence.

Later in the day, US consumer inflation expectation numbers could have more impact than usual.

Asia Day Ahead: Cautious Tone to Start the Week: Brent crude, China A50, USD/JPY

Asia Day Ahead: Cautious Tone to Start the Week: Brent crude, China A50, USD/JPY

Market Recap

The value-growth divide since the start of the month continued to play out last Friday, as market participants pare their exposure in US big tech and semiconductors, while value sectors held firm with a notable pull-ahead in the energy sector (+1.6%).

Some unease were triggered by the upside surprise in US producer prices, but for now, it will still have to take much more to convince markets of a September Fed rate hike. Current rate expectations from the Fed feds futures pricing remained firm that the Fed’s tightening cycle has already reached its end, with potential rate cuts in May next year. To end last week, US Treasury yields largely resumed their move higher, with the 10-year yields bouncing off its 4% level lately to attempt a move to a new year-to-date high.

The day ahead will be relatively quiet on the economic calendar front, which could drive a more subdued tone to start the week, but focus will be turned to Japan’s 2Q GDP release tomorrow, along with the RBA minutes and a series of economic data out of China to drive more market action.

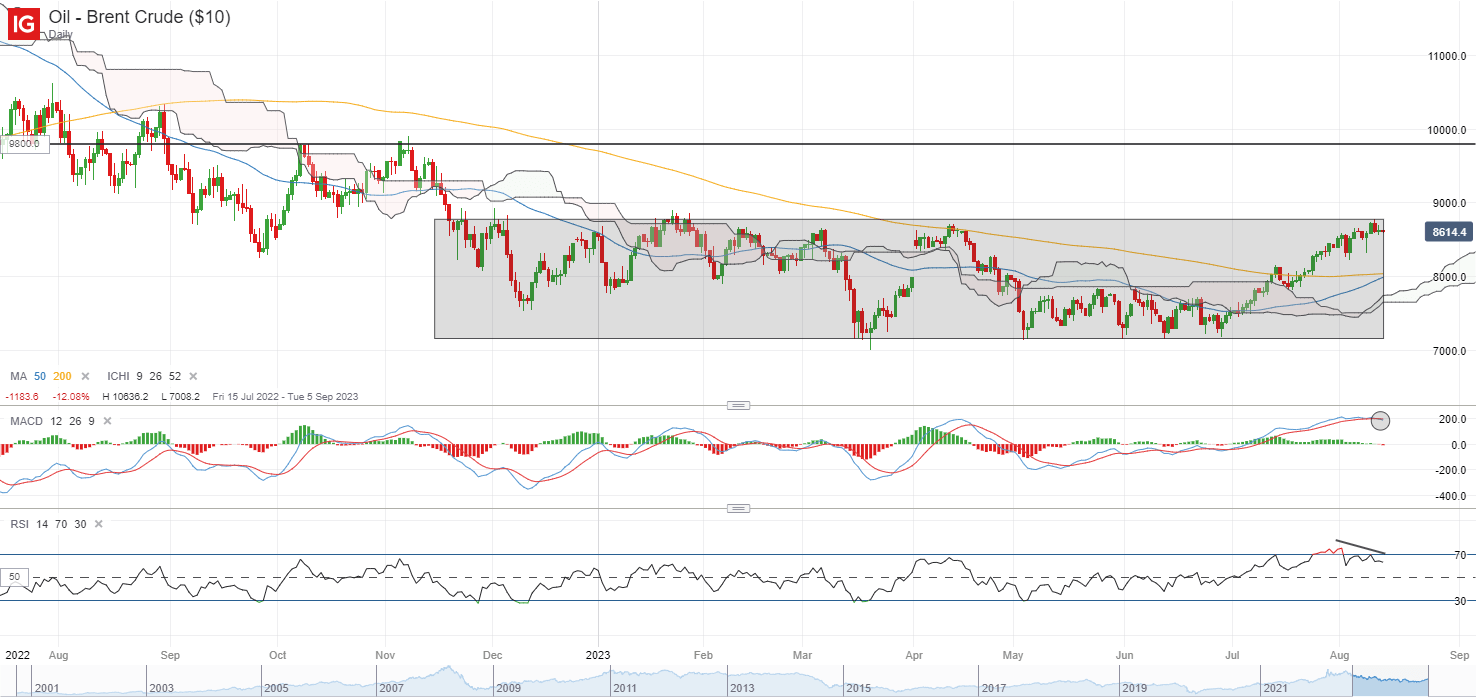
One to watch may be Brent crude prices, which continue to hover below its US$88.00 level of resistance. A bearish crossover on MACD may point to some near-term exhaustion, but a pull-ahead of its weekly RSI back above the 50 level lately may suggest buyers taking greater control. Any reclaim of the US$88.00 level may potentially pave the way to retest its November 2022 high at the US$98.00 level.

image1.png

Asia Open

Asian stocks look set for a weak open, with Nikkei -0.33%, ASX -0.38% and KOSPI -0.62% at the time of writing. China’s economic woes resumed with new bank loans for July tumbling to end last week (CNY345.9 billion versus CNY800 billion forecast), while a slump in foreign direct investment (April-June quarter) to its record low prompted China authorities to react with a list of guidelines to attract more foreign investments. That said, having been accustomed to the series of policy responses from authorities thus far, sentiments seem to be at the stage where they will want to see supportive policies translating into actual results.

Into the new week, fresh updates on China’s retail sales, industrial production and fixed asset investment figures will be on watch tomorrow. An uneven recovery in the numbers is expected to be the story, with industrial production to remain unchanged while retail sales are expected to rise to 4.7% year-on-year from previous 3.1%.

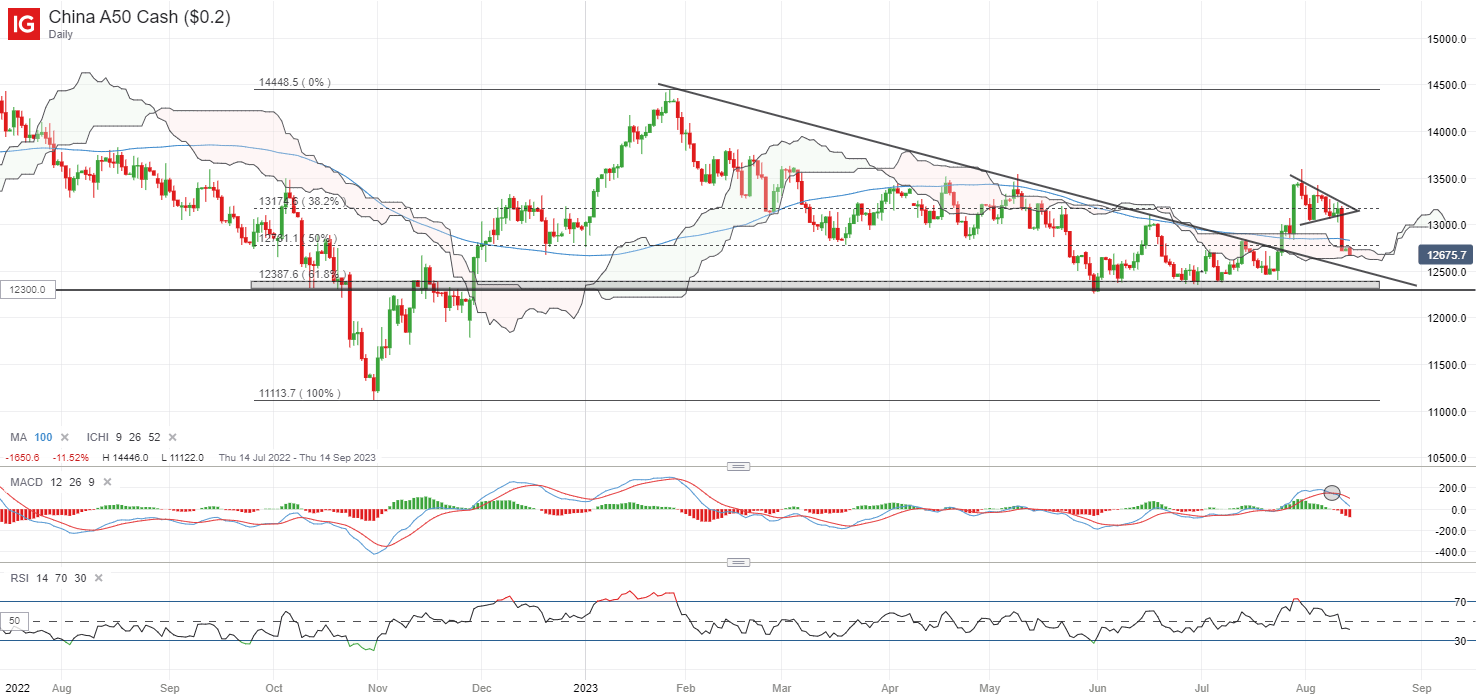
For the China A50 index, a recent bullish pennant formation on the daily chart failed to find an upward break, with sellers jumping in last week to put the index on a three-week low. With that, the 13,200 level will be a key resistance level to overcome ahead, while further downside may leave the 12,300-12,500 range on watch, where a previous downward trendline stands alongside its year-to-date bottom.

image2.png

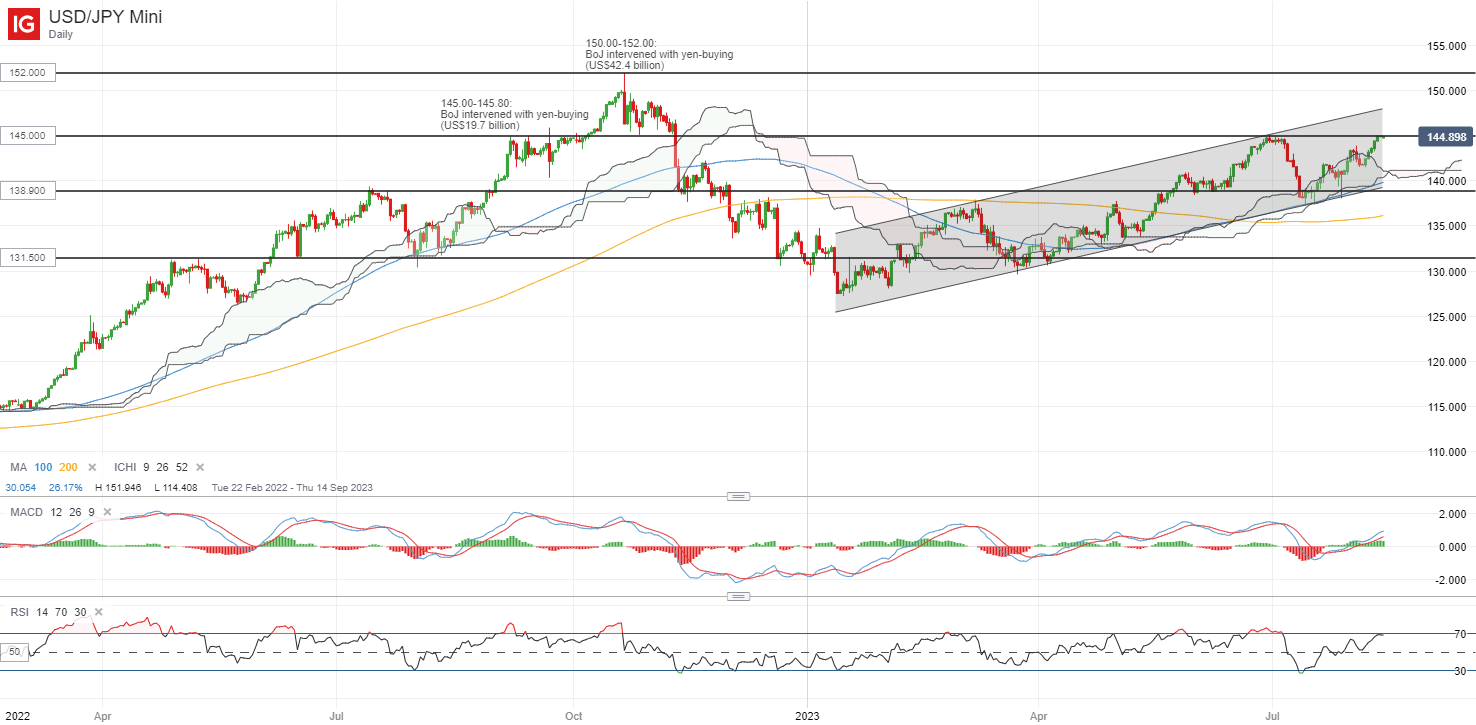
Market participants have been unfazed by the more flexible policy approach from the Bank of Japan (BoJ) thus far, with a continued rise in the US-Japan 10-year bond yield spread lifting the USD/JPY back to retest its year-to-date high at the 145.00 level. Previous retest of the level in June this year was met with some jawboning of yen intervention by Japanese authorities, but traders may be seeking for any concrete follow-through this time round.

For now, the overall upward bias in the pair remains intact, with the pair trading within an ascending channel pattern since the start of the year and its weekly RSI holding above the 50 level lately. On any downside, the 138.90 level will be on watch as near-term support from its 100-day MA, in coincidence with the lower edge of its Ichimoku cloud on the daily chart.

image3.png

Gold (XAU/USD) Slipping into Multi-Week Support, Volatility Remains Low

Gold (XAU/USD) Slipping into Multi-Week Support, Volatility Remains Low

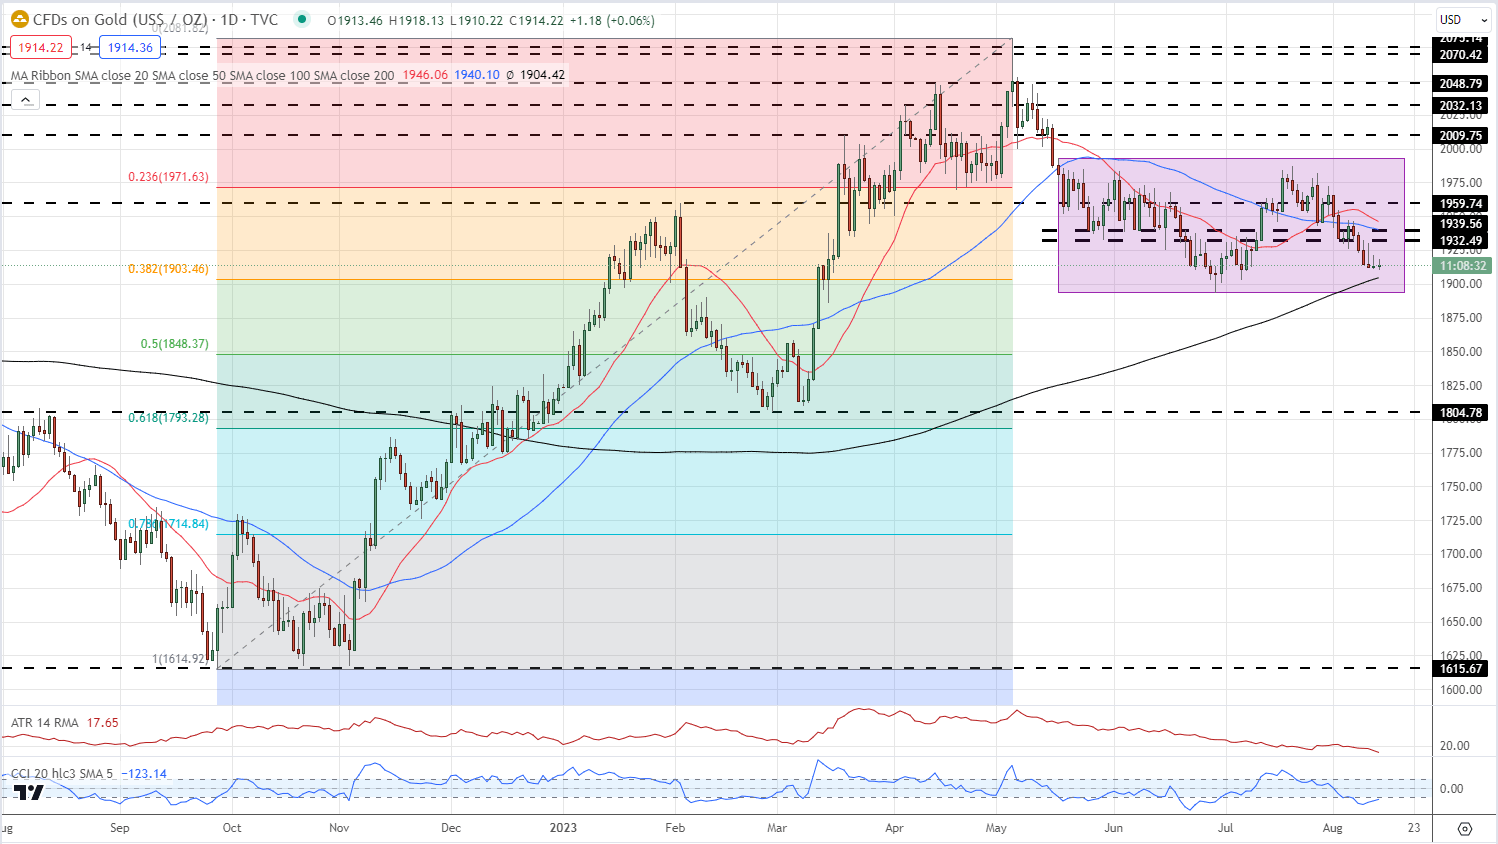
A stronger US dollar, bolstered by rising US Treasury yields, is pressing down on gold and sending it down to levels last seen over one month ago. The precious metal is also just $20 away from making a fresh multi-month low and if this happens, the technical outlook for the precious would turn further bearish.

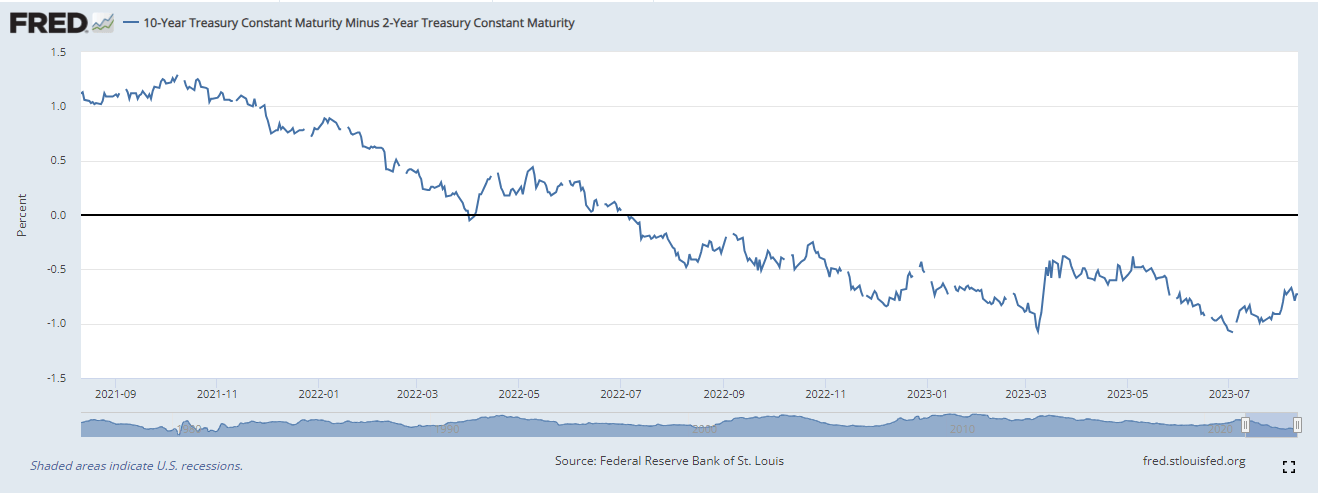
The US dollar continues to push higher, aided by higher US Treasury yields. While the short end of the curve is little changed, and pricing in unchanged rates over the coming months, the longer end of the curve is seeing higher yields. The 2-10 year curve remains inverted by around 73 basis points and as the possibility of a US recession recedes, the yield curve differential will move further towards flat.

image1.png

This week’s economic calendar will likely have little impact on the price of gold until the FOMC Minutes are released on Wednesday at 19:00 UK. After this release, the economic calendar goes quiet. Traders will need to monitor the ongoing real estate slump in China. Shares in Chinese property giant Country Garden Holdings fell to a record low today after the company missed bond coupon payments last week and warned that it faces challenges ahead. Country Garden Holdings shares fell by 18% overnight in Hong Kong, sparking fears of another Evergrande-style default.

The daily gold chart shows the precious metal near the 200-day simple moving average at $1,904/oz. This longer-dated ma has provided support for gold since mid-December last year. Just below here, is the 38.2% Fibonacci retracement level at $1,903.4/oz. can be seen before the $1,900/oz. the psychological level comes into view. A break below would leave the June 29 $1,893/oz. multi-month low vulnerable.

If gold gets a safe-haven bid, possibly driven by Country Garden, then a break higher will be met by a series of prior lower highs made over the last month. These may prove difficult to overcome in the short term.
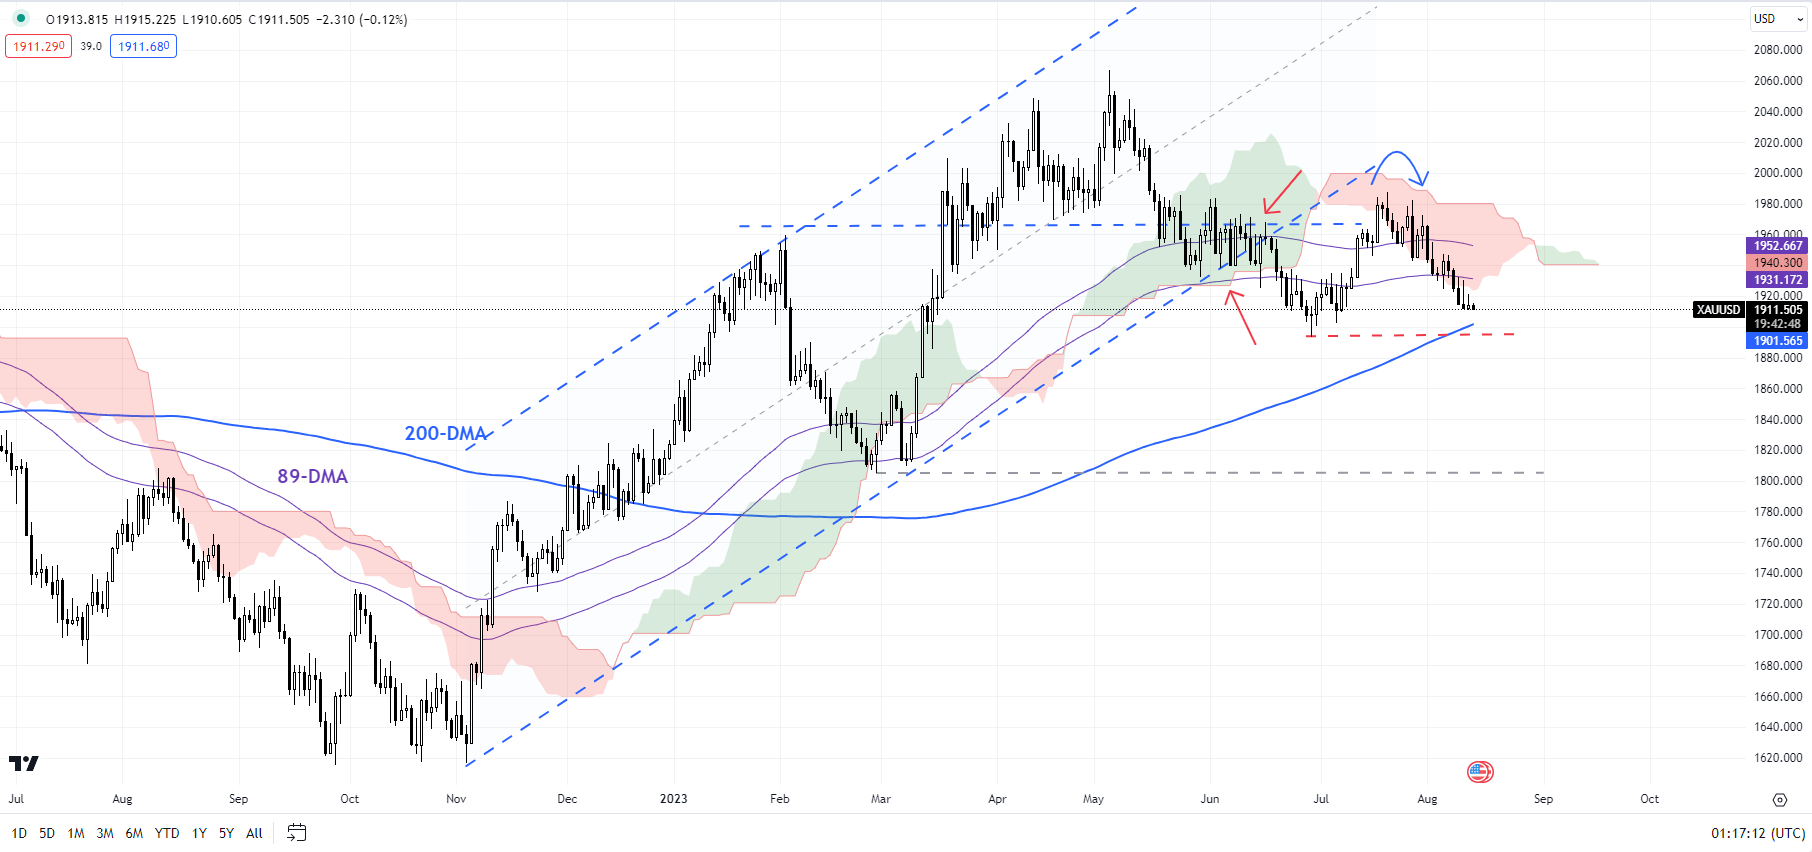
Volatility also remains low in the precious metal – along with a number of other markets – and this makes any sharp price moves less likely.

Gold Daily Price Chart – August 14, 2023

image2.png

Is Nasdaq Following Gold’s Footsteps? NDX, XAU/USD Price Setups

Is Nasdaq Following Gold’s Footsteps? NDX, XAU/USD Price Setups

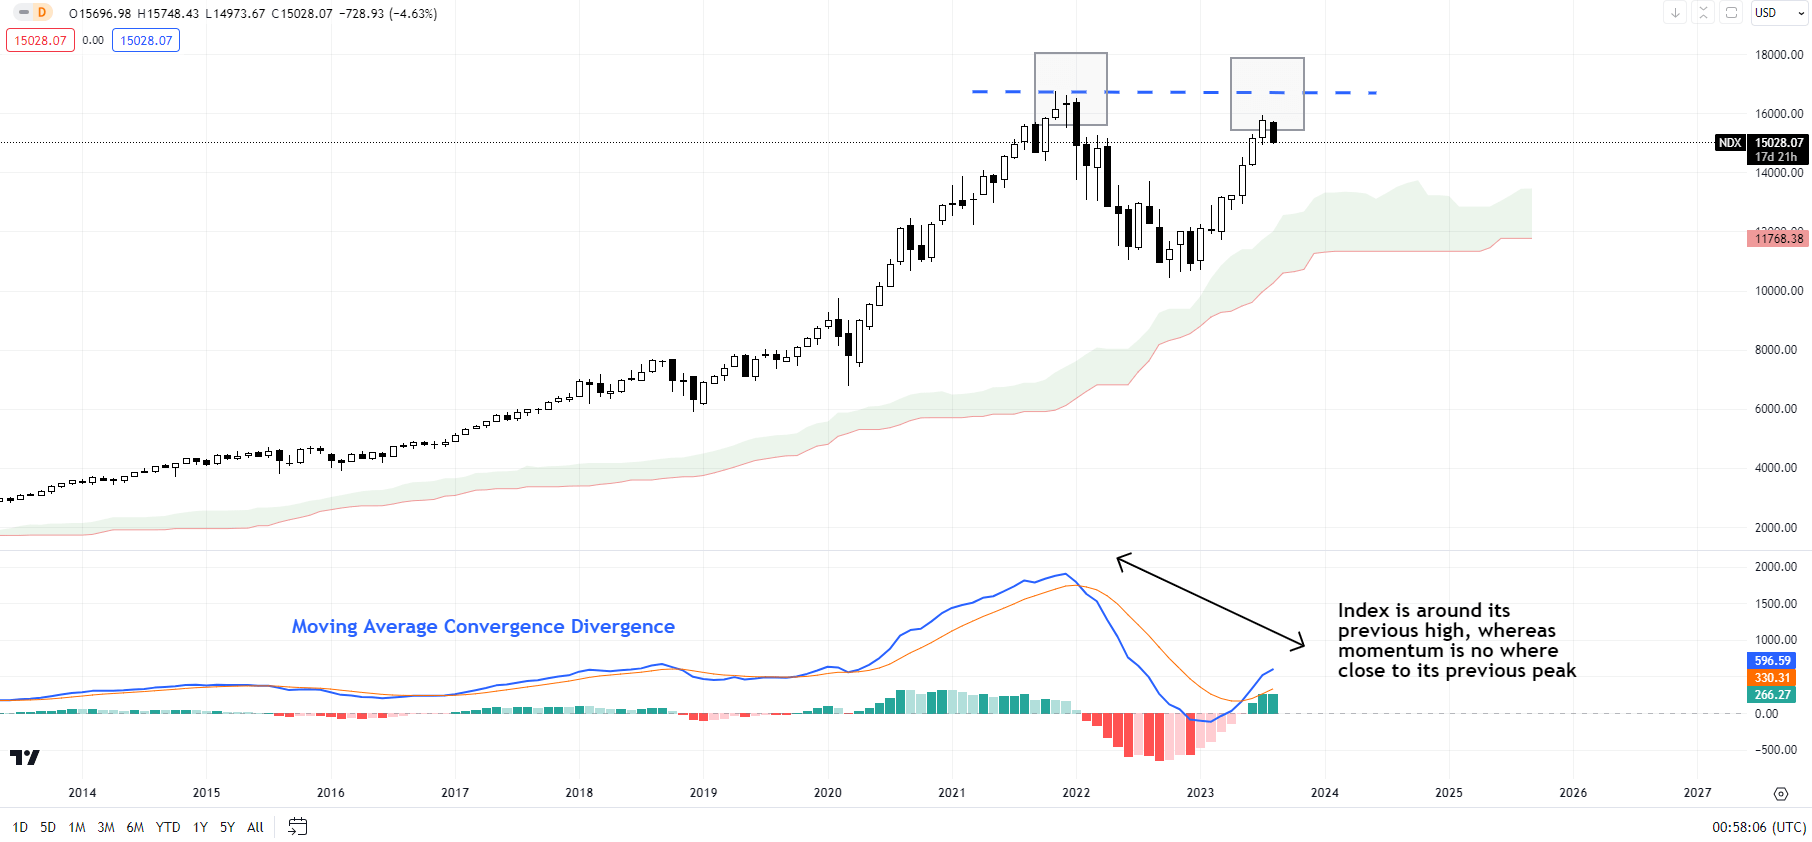
Growing similarities on the charts of the Nasdaq 100 index and gold suggest the former could be in for some consolidation/minor retreat in an environment of rising real yields.

The Nasdaq 100 index has had a spectacular run since the beginning of the year, rising nearly 50%. The absolute levels of the index and momentum on lower timeframe charts mask the developments on higher timeframe charts. Just as the index approaches its 2021 record high, momentum on higher timeframe charts has been feeble. Such situations typically raise the odds of a dead-cat bounce, rather than a start of a new trend (uptrend in this case). That is, the chances are that the rally from early 2023 is part of a larger correction that began in 2021.

Nasdaq 100 Index Monthly Chart

image1.png

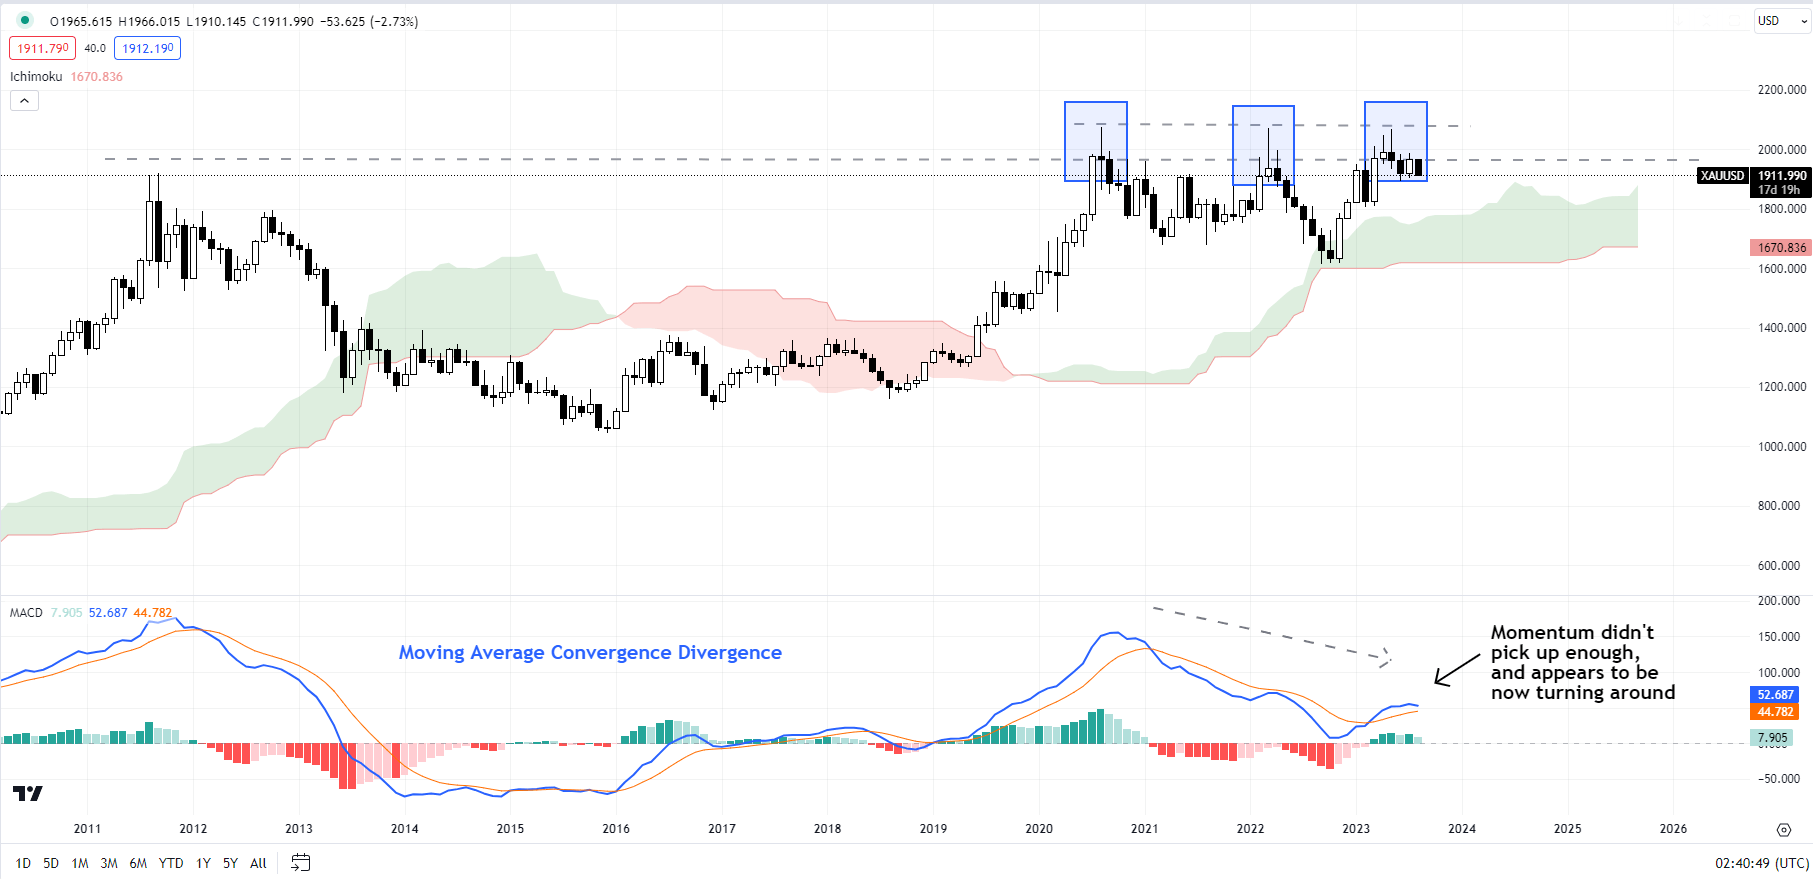
A similar development took place on the monthly charts of gold – first highlighted in Q2-2023. See “Gold Could Find It Tough to Crack $2000,”published March 28, and “Gold Weekly Forecast: Is it Time to Turn Cautious on XAU/USD?” published April 16. Subsequently, XAU/USD failed to decisively clear its previous 2020 and 2022 peaks. The yellow metal is now threatening to break below crucial support on the 200-day moving average. For more discussion, see “Gold, Silver Forecast: It’s Now or Never for XAU/USD, XAG/USD,” published August 13.

XAU/USD Monthly Chart

image2.png

Besides price charts, the real yields could be the common thread between the two markets. The surge in real yields appears to be the most recent driver pressurizing gold. As highlighted in an update last week, real yields have been elevated on rising nominal interest rates, moderating price pressures/inflation expectations amid the growing perception of the higher-for-longer interest rates. See “High Real Yields Starting to Bite Gold? XAU/USD Price Setup Ahead of US CPI,” published August 10.

Nasdaq 100 Daily Chart

image3.png

Chart Created by Manish Jaradi Using Tradingview

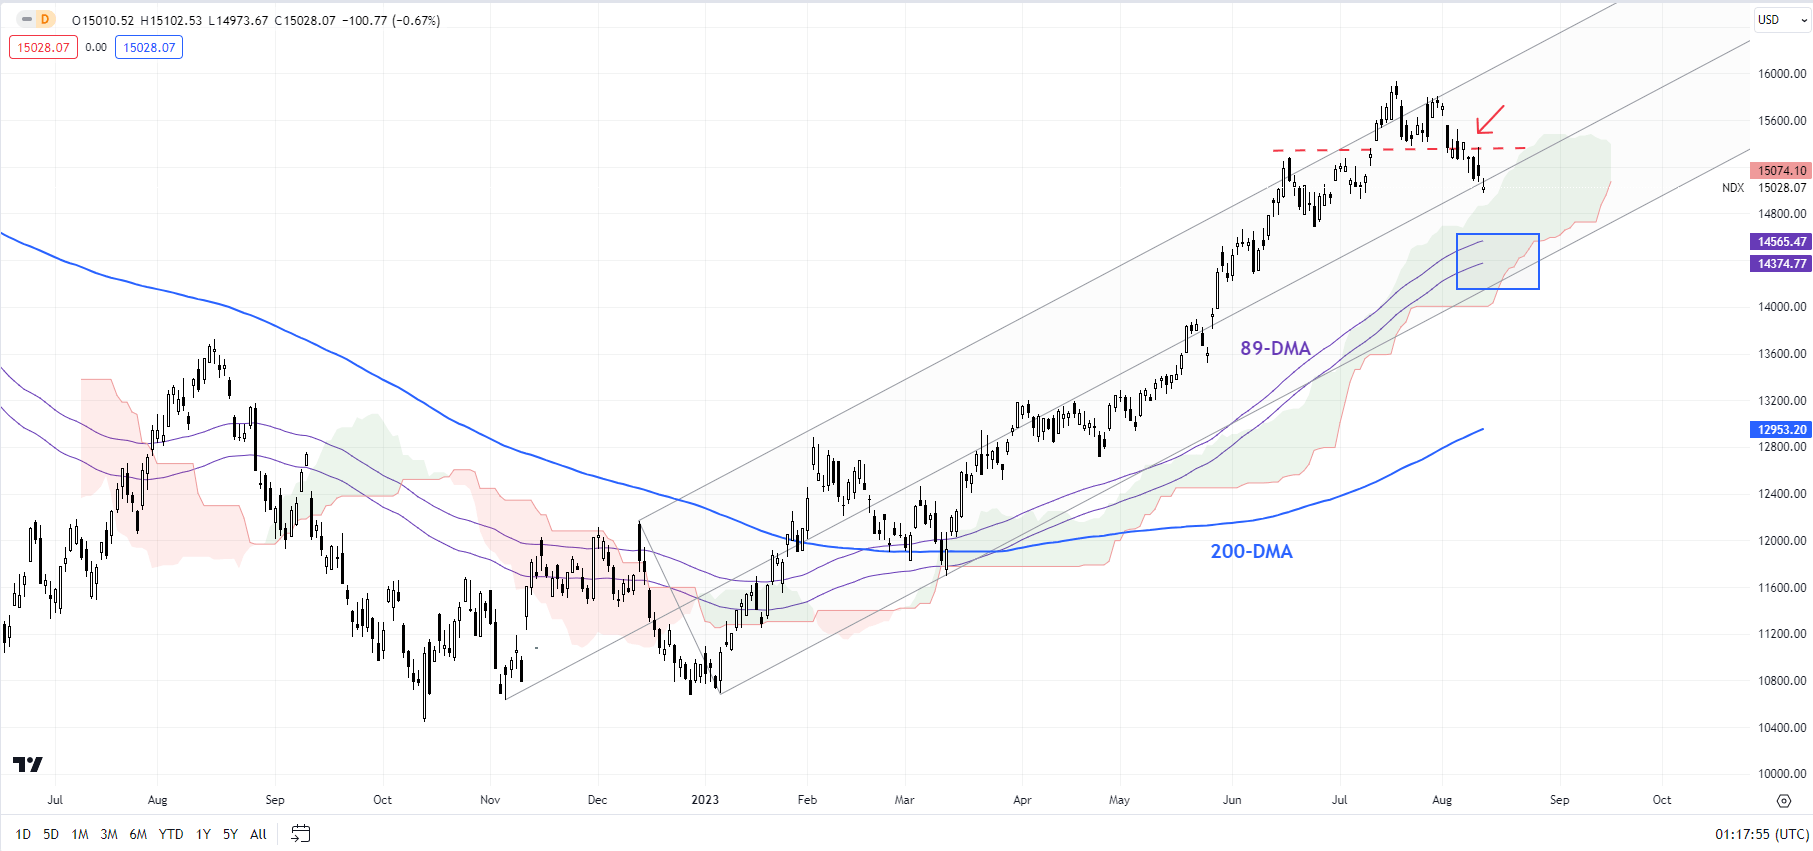
Equities thrived in an environment of near-zero interest rates and negative real rates. However, the rising cost of capital and positive real rates imply that the hurdle for equities to outperform other asset classes is now higher, especially with valuations above historical averages. Positive real rates have increased the opportunity cost of holding the non-yielding yellow metal, leading to its underperformance in recent months.

XAU/USD Daily Chart

image4.png

On its own, the Nasdaq 100 index’s rally appears to be losing steam. For more discussion on US indices’ trend, see “US Indices Rally Beginning to Crack? S&P 500, Nasdaq Price Setups,” published August 3. Moreover, the fall last week below minor support at the late-July low of 15375 suggests cracks could be developing on the Nasdaq 100 index’s rally. This follows a failure to decisively rise above the upper edge of a rising channel from late 2022.

A similar development on the gold daily charts in May pushed XAU/USD toward its 89-day moving average, near the lower edge of the Ichimoku cloud on the daily charts. For the Nasdaq 100 index, the 89-day moving average and the lower edge of the Ichimoku cloud currently stand around 14000-14400.

To be fair, this doesn’t mean the Nasdaq 100 index has turned imminently bearish. It means the risk: reward for those expecting continued gains doesn’t appear to be as attractive as it was a few months ago.

Japanese Yen Hits New Lows as US Dollar Flexes on Higher Treasury Yields

Japanese Yen Hits New Lows as US Dollar Flexes on Higher Treasury Yields

The Japanese yen declined to its lowest level since November last year against the US Dollar today touching 145.22. It then retreated below 145.00.

On a day when risk assets were generally undermined, the big dollar gained across the board with Treasury yields continuing to trade higher into the Monday session.

The benchmark 10-year note is trading close to 4.20%, a level not seen since November 2022 as well. Japanese Government bonds (JGB) are steady above 0.60% but the yield spread continues to favour the US Dollar.

image1.png

Typhoon Lan is anticipated to hit landfall in central Japan on Tuesday with airlines and rail networks anticipated to see significant disruptions. The latest Japanese GDP data will be released tomorrow.

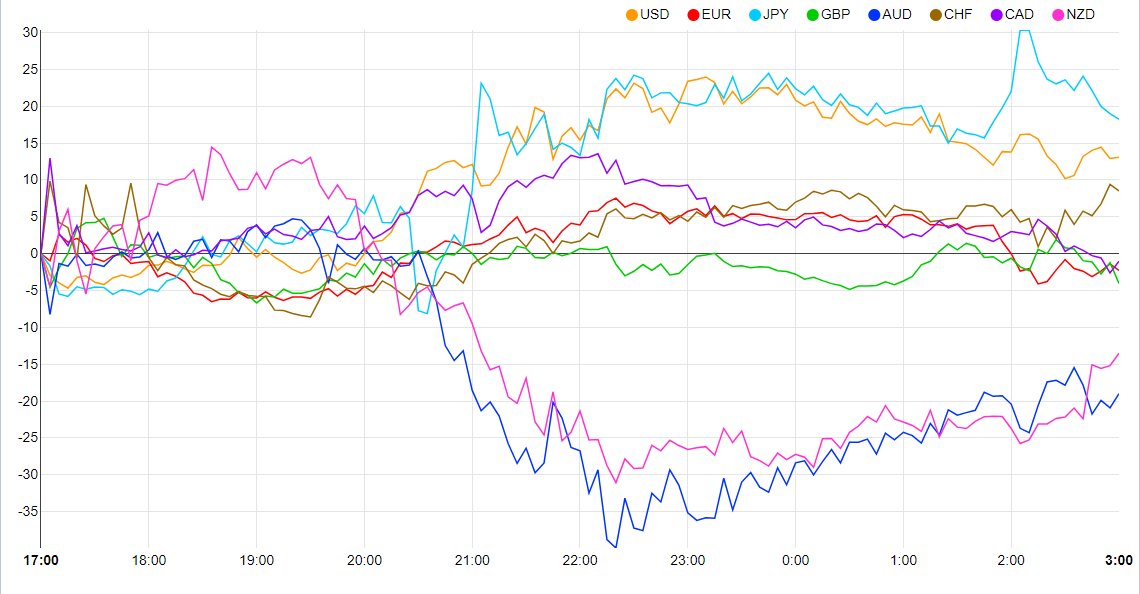
The high beta Aussie and Kiwi Dollars are the notable underperformers so far today while the Swiss Franc has been the ‘least worst’ currency against the US Dollar.

APAC equity indies are a sea of red to start the week with Hong Kong’s Hang Seng Index (HSI) leading the way lower, down over 2%.

Chinese stocks have also been hampered as concerns around Country Garden continue to swirl after trading in the Chinese property giant’s bonds was suspended on Monday.

Beijing announced that they want to encourage foreign investment in targeted areas by providing tax incentives. China industrial production and retail sales data will be released Tuesday.

CHINESE DATA AHEAD (GMT)

image2.png

Wall Street futures are pointing toward a soft start to their cash session and European bourses may also face some headwinds.

Gasoline prices are lower to start the week after making new highs on Friday. Crude oil has also eased today with the WTI futures contract trading under US$ 82.50 bbl while the Brent contract is approaching US$ 86 bbl.

The stronger USD has manifested itself in lower base metals prices, particularly aluminium, copper and nickel. Gold has sunk to its lowest level since early July but is steady near US$ 1,910.


EUR/USD Eyes Short-Term Retracement as DXY Runs Into Confluence Area

EUR/USD Eyes Short-Term Retracement as DXY Runs Into Confluence Area

EUR/USD has continued to trickle lower this morning, but a short-term retracement is beginning to look like a possibility. The Dollar Index (DXY) however, may cap any sustained move to the upside as risk-off sentiment keeps the Greenback supported. The Dollar is the second strongest currency this morning per the Currency Strength Chart below.

image1.png

CHINA REAL ESTATE WOES KEEPS US DOLLAR SUPPORTED

The risk-off tone this morning came about as Chinas real estate sector came to the fore once more. Country Garden which was at one time the largest private property developer in China risks default in a move that could have wider implications for the Chinese real estate market. There have long been concerns around the sector with hopes that a stimulus package by Government would ease concerns. Despite reports stating that the CCP were almost certain to come up with a renewed stimulus plan this has yet to materialize.

The impact of this has seen risk-off sentiment dominate this morning with the US Dollars safe haven appeal remaining intact. The Dollar has printed four consecutive weeks of gains with the last time the index experienced five consecutive weeks of gains coming back in May 2022. The FOMC minutes are due later this week and it will be interesting to see if the DXY will retreat or will it be five successive weeks of gains?

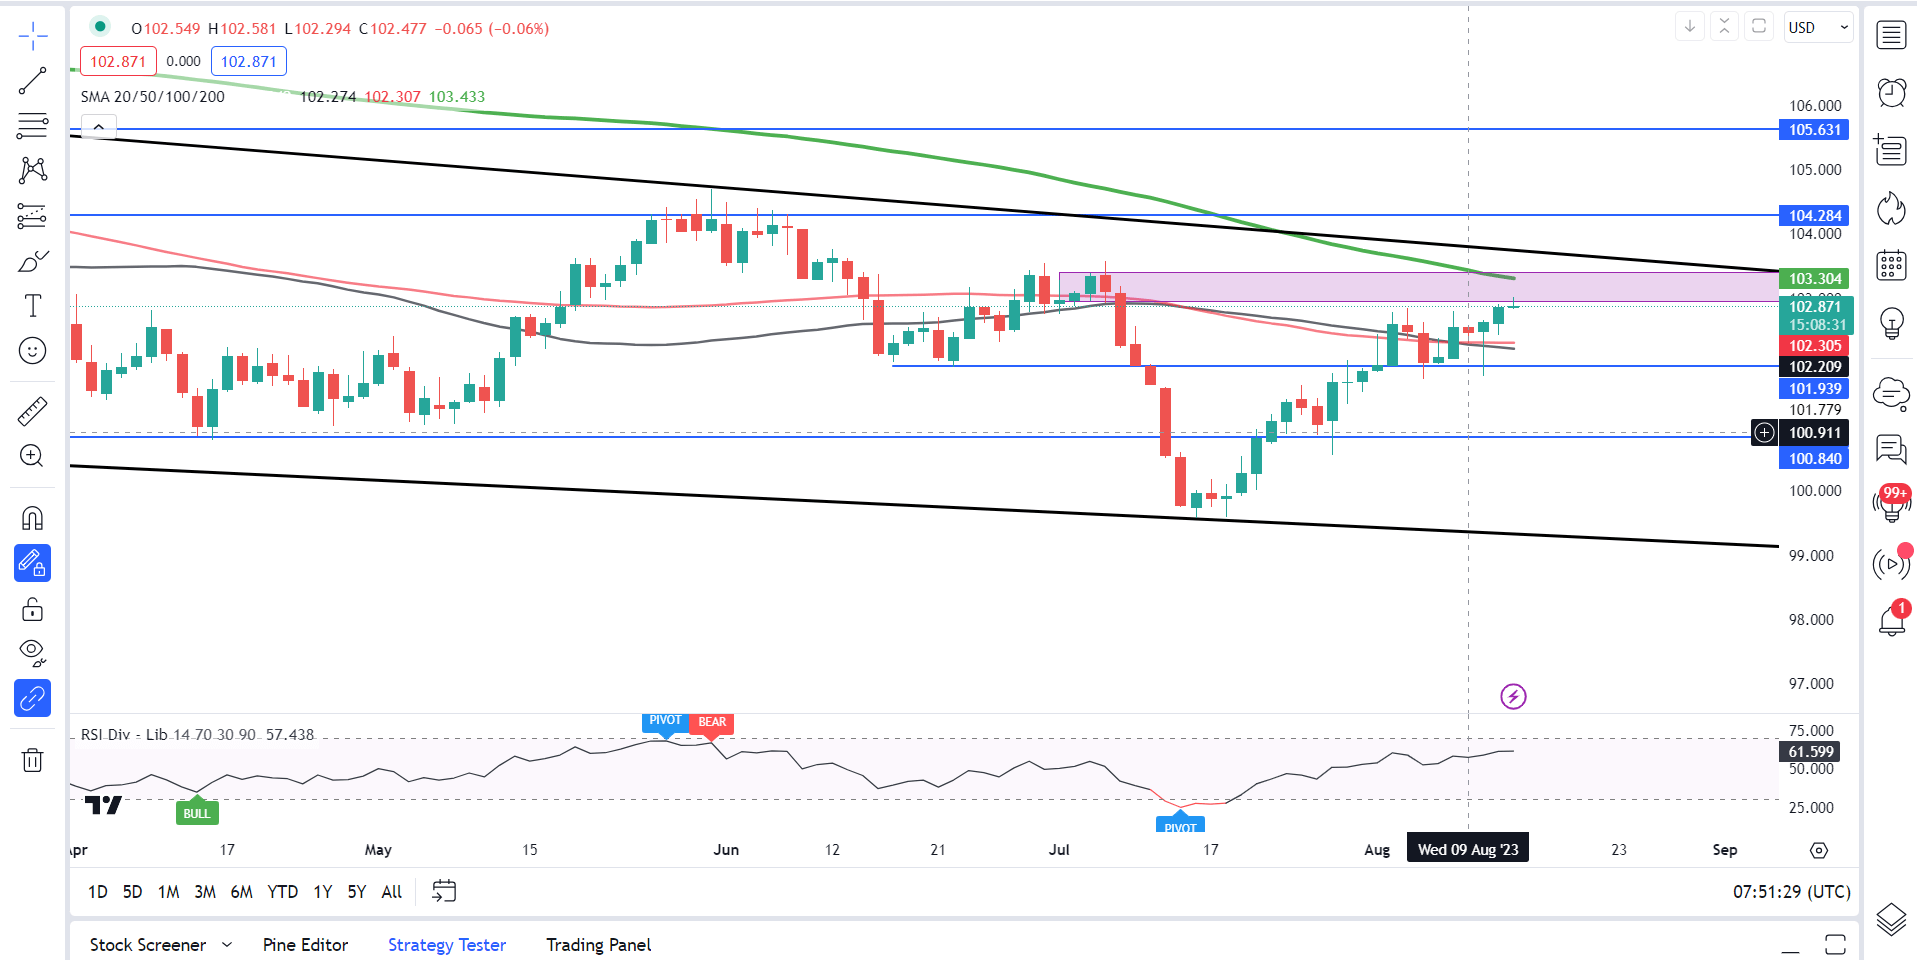
The DXY has run into a key confluence area as you can see on the chart below. I do believe there could be some room for further upside, but a lot of hurdles would need to be cleared. Resistance is currently provided by the 103.00 handle and just above the 200-day MA resting around the 103.30 mark.

Dollar Index (DXY) Daily Chart – August 14, 2023

A screenshot of a graph  Description automatically generated

Fridays PPI data out of the US showed a slight uptick and might be the reason behind some hawkish comments from Fed policymakers last week. There is some concern among members that inflation could pick up again as we head toward Q4 and the end of the year. August has historically been a choppy month for markets and this trend could continue given the uncertainties in play at the moment.

RISK EVENTS AHEAD

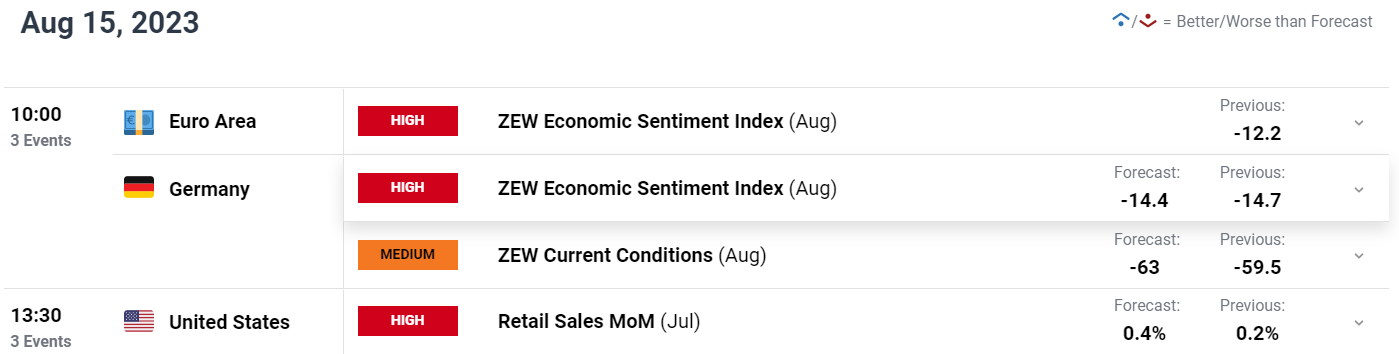
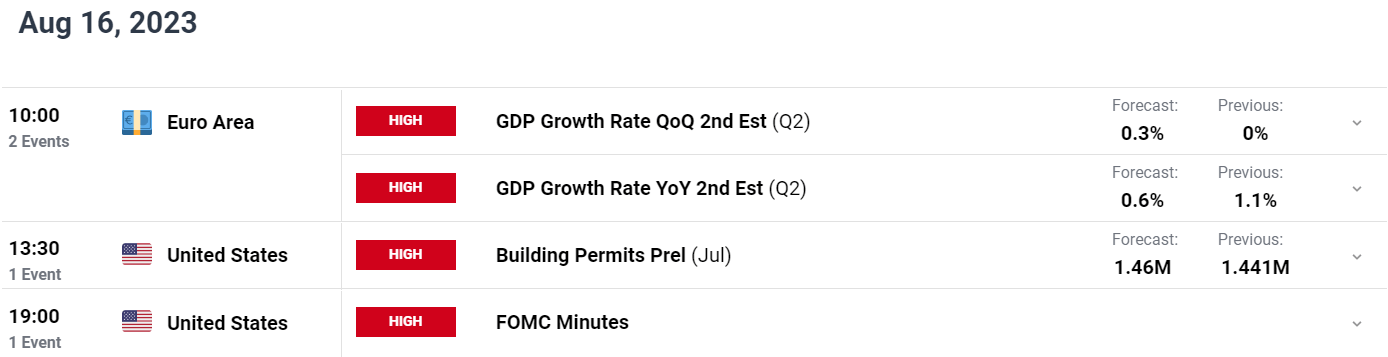
A quiet day in terms of risk events on the economic calendar but things should pick up pretty quickly tomorrow. We have the ZEW Economic conditions and sentiment data out from the Euro Area and Germany respectively before focus will undoubtedly switch to Wednesdays FOMC minutes release and US retail sales data.

image3.pngA screenshot of a graph  Description automatically generated

TECHNICAL OUTLOOK AND FINAL THOUGHTS

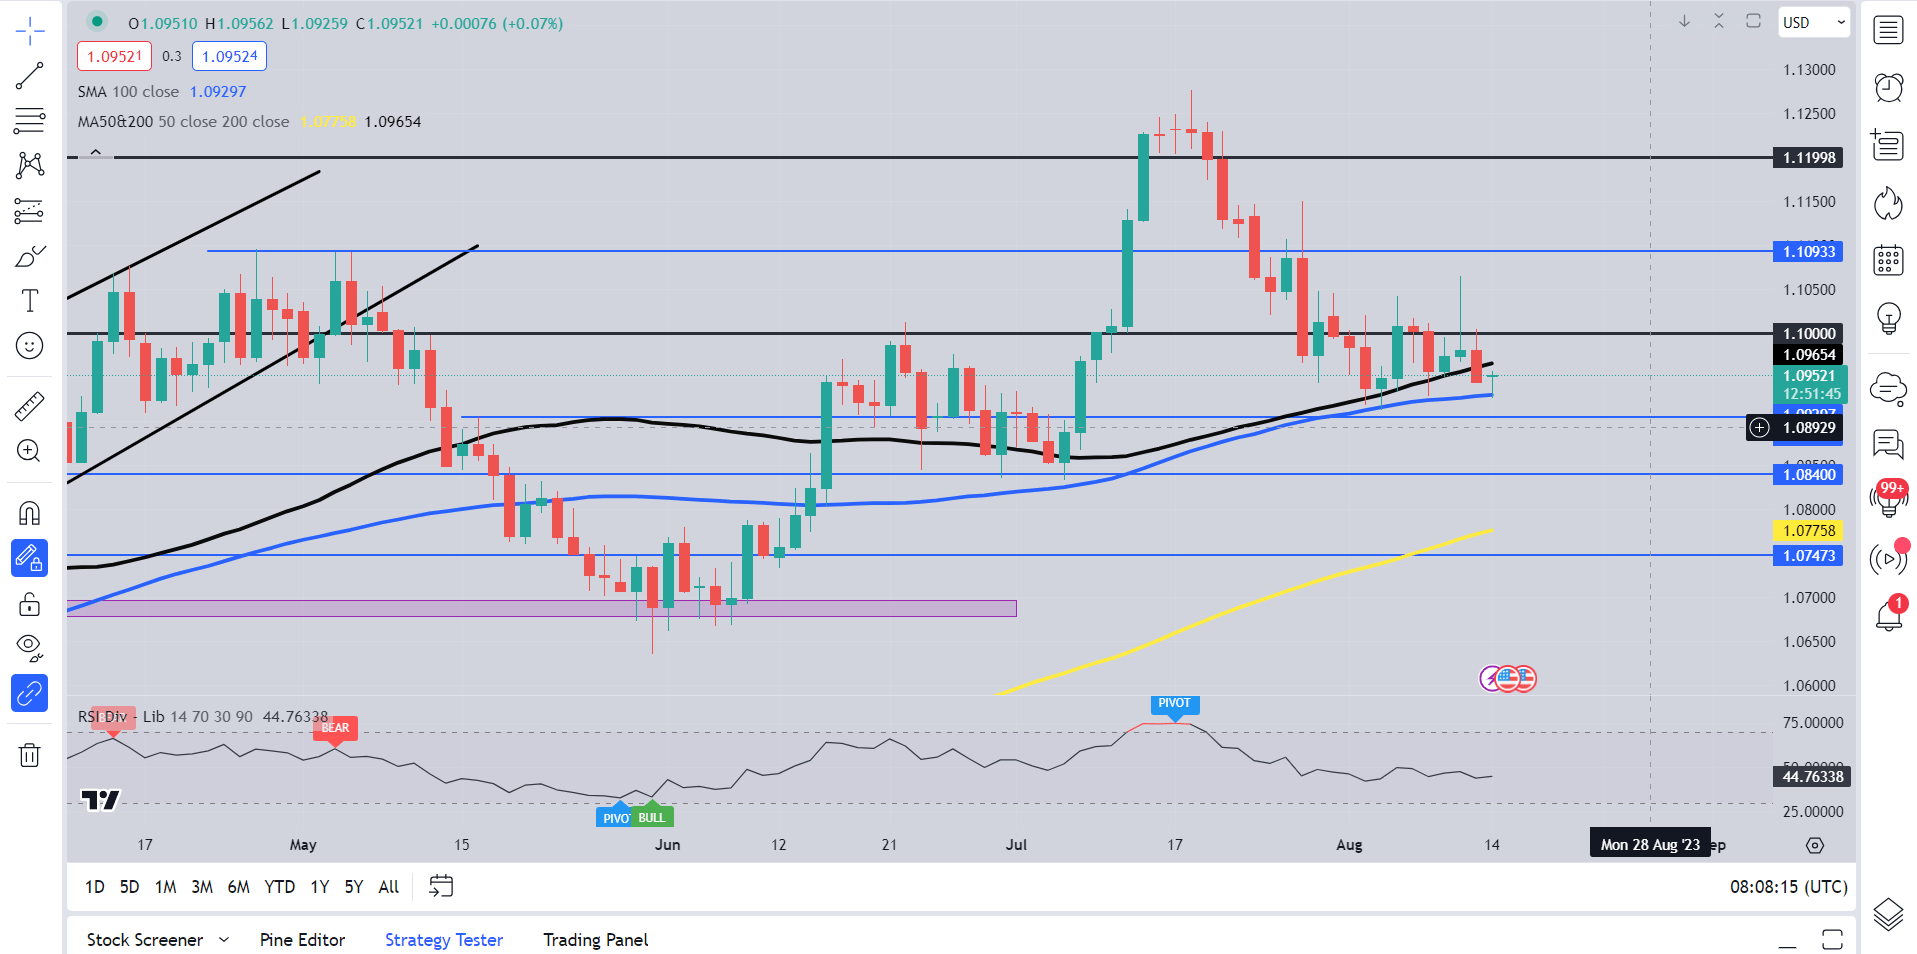
Looking at EURUSD from a technical perspective and last week’s daily candle close on Friday does not bode well for bulls. EURUSD printed a marubozu shooting star candle off key resistance at the psychological 1.1000 level.

The shooting star marubozu candle does hint at downside continuation, however given the US Dollar dynamic I think we could be in for a short-term retracement before continuing lower.

On the upside resistance is provided by the 50-day MA around the 1.0970 handle before a retest of the 1.1000 becomes a possibility. A downside move could retest the 100-day MA at the 1.0930 mark before any attempt by EURUSD to move lower.

EUR/USD Daily Chart – August 14, 2023