USD to CAD Prices Forecast: Loonie Falls as Major Importer China Struggles

USD to CAD Prices Forecast: Loonie Falls as Major Importer China Struggles

Overview

The USD to CAD edged higher on Tuesday, gaining momentum from rising Treasury yields and deepening economic concerns in China. The yuan fell to a nine-month low following an unexpected cut in China’s key policy rates, marking the second reduction in just three months. This move by China’s central bank is an attempt to invigorate its stuttering economy, which has shown disappointing indicators in industrial output and retail sales. Notably, these figures trailed behind economists’ predictions.

Greenback Rises Amid China’s Economic Uncertainty

Simultaneously, the greenback’s rally was propelled by the surge in demand for safer assets, as worrisome economic signals emerge from China. The Canadian Dollar, on the other hand, waned in light of the U.S. Dollar’s ascendancy and China’s murky economic picture. These shifts come at a time when the market is closely monitoring forthcoming U.S. retail sales data, keen to gauge the implications of heightened rates on consumer expenditure. On the horizon, the Federal Reserve’s July meeting minutes are set for release on Wednesday, adding another potential market mover to the mix.

Trading Derivatives carries a high level of risk to your capital and you should only trade with money you can afford to lose. Trading Derivatives may not be suitable for all investors, so please ensure that you fully understand the risks involved, and seek independent advice if necessary. A Product Disclosure Statement (PDS) can be obtained either from this website or on request from our offices and should be considered before entering into a transaction with us. Raw Spread accounts offer spreads from 0.0 pips with a commission charge of USD $3.50 per 100k traded. Standard account offer spreads from 1 pips with no additional commission charges. Spreads on CFD indices start at 0.4 points. The information on this site is not directed at residents in any country or jurisdiction where such distribution or use would be contrary to local law or regulation.

Yellen Praises Biden; Americans Skeptical

While U.S. Treasury Secretary Janet Yellen champions President Joe Biden’s policies for driving unparalleled job growth and reinforcing competitiveness, polls suggest that American sentiment remains unconvinced. Canada’s currency has further faced downward pressure due to dips in the materials and energy sectors. Sliding commodity prices, rooted in fears of China’s frail economic recovery and its debt-heavy property market, cast a shadow over China’s demand outlook.

Problems in China Weigh on Canadian Exports

This sentiment deteriorated further as Country Garden, China’s leading private property developer, endeavored to delay a payment on an onshore bond. Such moves compound challenges faced by policymakers in reviving investor confidence in the globe’s second-largest economy and prime consumer of oil and metals. Both are major components of Canada’s economy.

Short-Term Outlook:  Bullish Ahead of Canada Inflation Data

In the short term, the spotlight shifts to Canada’s impending inflation data. Market stakeholders are eager to discern the potential path of the Bank of Canada’s (BoC) monetary policy. With prevailing sentiments suggesting an anticipated decline in inflation, it appears the BoC may adopt a wait-and-see approach.

Technical Analysis

4-Hour USD to CADThe current price of 1.3480 has surpassed the previous 4-hour close of 1.3445, indicating an upward momentum. This bullish sentiment is further supported as the current price exceeds both the 200-4H moving average of 1.3272 and the 50-4H moving average of 1.3410. The 14-4H RSI reading is 63.09, suggesting a stronger momentum, as it’s above the neutral 50-mark but not yet in overbought territory.

Additionally, the USD to CAD has broken through the main resistance area, hovering just above it. With no evident near-term minor support or resistance areas, the market sentiment for USD to CAD is currently bullish.

Gold Prices Forecast: U.S. Dollar Surge, China’s Economy Pressure XAU/USD Prices

Gold Prices Forecast: U.S. Dollar Surge, China’s Economy Pressure XAU/USD Prices

Overview

Gold prices saw a downturn on Tuesday, primarily influenced by the U.S. dollar’s rise, bolstered by higher bond yields and concerns surrounding China’s economy. As investors anticipate U.S. retail sales data, they are keen to understand the possible effects of increased rates on consumer spending.

Gold Hovering Near 6-Week Low

Spot gold (XAU/USD), trading close to its lowest in a month and a half, declined 0.06% to touch $1,905.44 per ounce. Similarly, U.S. gold futures experienced a drop, settling 0.3% lower at $1,937.80. The dominant force pushing down gold prices was the strengthening U.S. dollar and a surge in Treasury yields. This upward trend in the dollar and yields has been attributed to investors’ speculations on how Chinese regulators might address the rising financial and property risks, as highlighted by NAB Commodities Research.

Trading Derivatives carries a high level of risk to your capital and you should only trade with money you can afford to lose. Trading Derivatives may not be suitable for all investors, so please ensure that you fully understand the risks involved, and seek independent advice if necessary. A Product Disclosure Statement (PDS) can be obtained either from this website or on request from our offices and should be considered before entering into a transaction with us. Raw Spread accounts offer spreads from 0.0 pips with a commission charge of USD $3.50 per 100k traded. Standard account offer spreads from 1 pips with no additional commission charges. Spreads on CFD indices start at 0.4 points. The information on this site is not directed at residents in any country or jurisdiction where such distribution or use would be contrary to local law or regulation.

China’s Economic Instability Lifts US Dollar

On the back of concerns regarding China’s economic stability, the U.S. dollar reached its pinnacle in over a month. This, paired with U.S. 10-year Treasury yields nearing their November highs, makes gold an expensive purchase for foreign investors. Compounding these concerns, China’s central bank took the market by surprise, reducing its key policy rates after witnessing lagging industrial output and retail sales growth.

Sights Set on US Retail Sales

All eyes are now set on the impending U.S. retail sales data and insights from the Federal Reserve’s July policy meeting due to be released shortly. Despite the recent rate increase in July 2023, market experts predict a shift to a softer stance only by 2024.

Short-Term Forecast:  Weak

In the near future, gold is likely to remain under pressure. With the U.S. dollar maintaining its strong position and ongoing worries about China’s economy, gold’s allure seems to be waning. This sentiment is further echoed by the SPDR Gold Trust, the world’s foremost gold-backed ETF, which reported a decline in its holdings to its lowest since the start of 2020.

Technical Analysis

4-Hour Gold (XAU/USD)Starting with the price dynamics, Gold (XAU/USD) is currently priced at 1905.03, showing a slight decline from the previous 4-hour mark of 1906.66.

When examining the 200-4H moving average (1940.50), the current price is trading below it, signaling a potential bearish sentiment. Additionally, the commodity’s price is also below the 50-4H moving average of 1963.27, further reinforcing the bearish outlook. The 14-4H RSI, sitting at 33.20, indicates that the market is nearing oversold conditions but still has room before hitting extreme levels.

With the price hovering just above the main support area of 1902.75 and well below the main resistance range of 1946.99 to 1954.88, this paints a bearish picture for the XAU/USD market in the near term.

Silver Prices Forecast: XAG/USD Faces Pressure from Strengthened Dollar, China’s Challenges

Silver Prices Forecast: XAG/USD Faces Pressure from Strengthened Dollar, China’s Challenges

Overview

Silver prices felt the squeeze on Tuesday, as a resurgent U.S. dollar, buoyed by elevated U.S. Treasury yields and economic concerns in China, reduced the appeal of the dollar-denominated metal. By 07:24 GMT, spot silver (XAG/USD) had dipped 0.44% to settle at $22.56 per ounce, mirroring levels not seen since late June. Concurrently, U.S. December Silver futures edged down 0.17% to $22.99.

China’s Stuttering Economy and U.S. Treasury Yields

Investors around the globe have their eyes set on China, the world’s second-largest economy, which showed signs of stalling. The People’s Bank of China responded by slashing key policy rates, the second cut in just three months. This move was necessitated as recent data on industrial output and retail sales failed to meet economists’ expectations. Meanwhile, the U.S. dollar, considered a safe-haven asset, strengthened against major currencies, especially after a series of lackluster Chinese economic indicators. This, combined with U.S. 10-year Treasury yields nearing their highest since November, has made silver a costly proposition for international investors.

Trading Derivatives carries a high level of risk to your capital and you should only trade with money you can afford to lose. Trading Derivatives may not be suitable for all investors, so please ensure that you fully understand the risks involved, and seek independent advice if necessary. A Product Disclosure Statement (PDS) can be obtained either from this website or on request from our offices and should be considered before entering into a transaction with us. Raw Spread accounts offer spreads from 0.0 pips with a commission charge of USD $3.50 per 100k traded. Standard account offer spreads from 1 pips with no additional commission charges. Spreads on CFD indices start at 0.4 points. The information on this site is not directed at residents in any country or jurisdiction where such distribution or use would be contrary to local law or regulation.

Anticipation Surrounding U.S. Retail Sales Data

With the backdrop of economic turbulence, market watchers eagerly await the U.S. retail sales data, which will provide insights into consumer spending patterns in the current rate environment. This data is crucial as it may sway the Federal Reserve’s future policy decisions. Recent comments from the U.S. Treasury Secretary, Janet Yellen, indicate optimism, citing President Joe Biden’s policies as a catalyst for notable job growth and enhanced competitiveness.

Short-term Forecast

As the Federal Reserve’s rate-hiking phase seems to have peaked in July 2023, experts predict a possible dovish turn only by 2024. With factors like the strengthening U.S. dollar and concerns about China’s economy in play, silver’s attractiveness might wane in the short term.

Technical Analysis

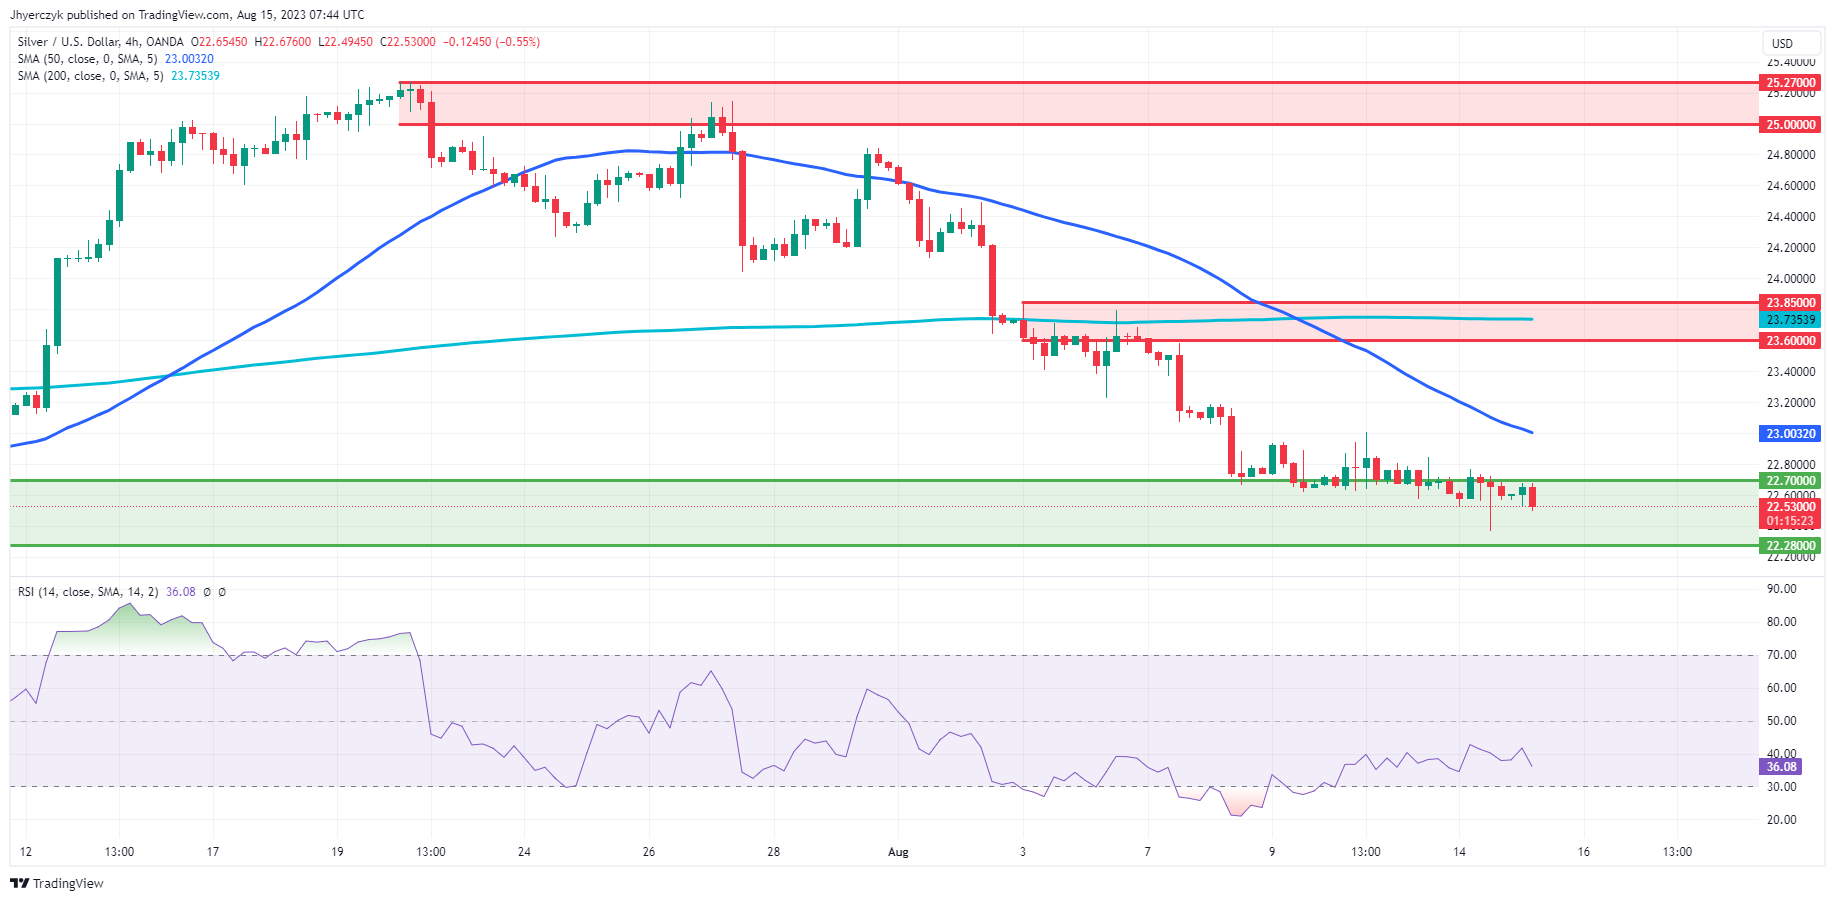
4-Hour Silver (XAG/USD)The current 4-hour price of Silver (XAG/USD) is $22.51, slightly below the previous 4-hour price of $22.65, suggesting a minor bearish movement. This price is below both the 200-4H moving average of $23.78 and the 50-4H moving average of $23.00, further emphasizing the bearish sentiment. The 14-4H RSI is at 35.28, which, being below the neutral mark of 50 but above 30, indicates a weakening momentum but not yet in the oversold territory.

The commodity is currently trading just above the main support area of $22.28, which may act as a cushion. However, with the price significantly below the main resistance range of $23.60 to $23.85, the overall short-term sentiment leans bearish.

UK Wage Surge Fuels Hawkish BoE Outlook Amid Rising Unemployment

UK Wage Surge Fuels Hawkish BoE Outlook Amid Rising Unemployment

It is a busy Tuesday on the UK economic calendar. This morning, the UK Labour Market Overview drew interest. Wage growth remained the focal point. A pickup in wage growth would support a more hawkish BoE policy outlook.

The UK unemployment rate unexpectedly rose from 4.0% to 4.2% in June. However, UK average earnings, including bonuses, increased by 8.2% year-over-year versus 7.2% in May. Economists forecast average earnings, including bonuses, to rise by 7.3% in June and for the unemployment rate to hold steady at 4.0%.

  • The one-off NHS bonus payments drove annual growth in regular pay, including bonuses, higher.
  • From April to June, the unemployment rate increased by 0.3 percentage points to 4.2%, driven by the unemployed for up to six months.
  • The UK employment rate was 75.7% (estimate) from April to June 2023, down 0.1 percentage points compared to January to March 2023.
  • According to the ONS, there was a large net movement from economic activity into unemployment.
  • From May to July 2023, estimated vacancies declined by 66,000, registering a thirteenth consecutive period decline.
  • Claimant counts increased by 29,000 in July versus a 16,200 rise in June. (Forecast: -7,300).

The jump in average earnings plus bonuses will fuel bets on a more hawkish BoE monetary policy outlook. However, the increase in the unemployment rate and the reasons behind the surge in average earnings plus bonuses could give the BoE reason to hold out for the July report.

GBP to USD Reaction to UK Wage Growth

Ahead of the UK Labour Market Overview Report, the GBP to USD rose to a pre-stat high of $1.26943 before falling to a low of $1.26753.

However, in response to the Labour Market Report, the GBP to USD fell to a low of $1.26798 before rising to a post-stat high of $1.27209.

At the time of writing, the GBP to USD was up 0.18% to $1.27090.

GBP to USD reacts to the UK wage growth surge.
Next UpUS retail sales and the NY Empire State Manufacturing Index will move the dial. We expect the retail sales figures to have more impact.

Economists forecast retail sales to increase by 0.4% in July versus +0.2% in June.

A jump in retail sales could force the Fed to hike rates to curb spending and eliminate the demand effect on consumer price inflation. However, with the manufacturing sector accounting for less than 30% of the US economy, the NY State numbers are unlikely to influence the Fed.

Gold Price Loses its Lustre as the US Dollar and Treasury Yields Climb. Lower XAU/USD?

Gold Price Loses its Lustre as the US Dollar and Treasury Yields Climb. Lower XAU/USD?

The gold price continues to languish going into Tuesday’s trading session as the US Dollar pursues higher ground, assisted by rising Treasury yields.

The metals complex is generally weaker across the board, impeded by the stronger Dollar and deteriorating appetite for risk and growth-orientated assets.

Industrial metals have been hit harder than the yellow metal with the outlook for China facing increased scrutiny.

Generally weaker economic data there last week has been compounded by property groups Country Garden and Ocean Sino missing debt payments.

Country Garden defaulted on US Dollar coupon payments last week and this week saw trading in its onshore debt suspended alongside Ocean Sino.

The market is awaiting concrete action from authorities to deal with the economic uncertainty.

A plethora of Chinese data will be closely inspected for further clues on the state of the world’s second-largest economy. The details can be viewed here.

The People’s Bank of China (PBOC) cut the 1-year medium-term lending facility rate to 2.50% from 2.65% today,.The Yuan is weaker, trading near 7.3000 per USD.

While that is unfolding, the benchmark 10-year Treasury note is surging above 4.20% for the first time since November last year after dipping to 3.73% a month ago.

The Treasury curve seems more firmly anchored with the market now viewing the Federal Reserve as near the end of its tightening cycle.

The 2-year bond is nearing 5.0%, still some way from the peak of 5.11% seen last month.

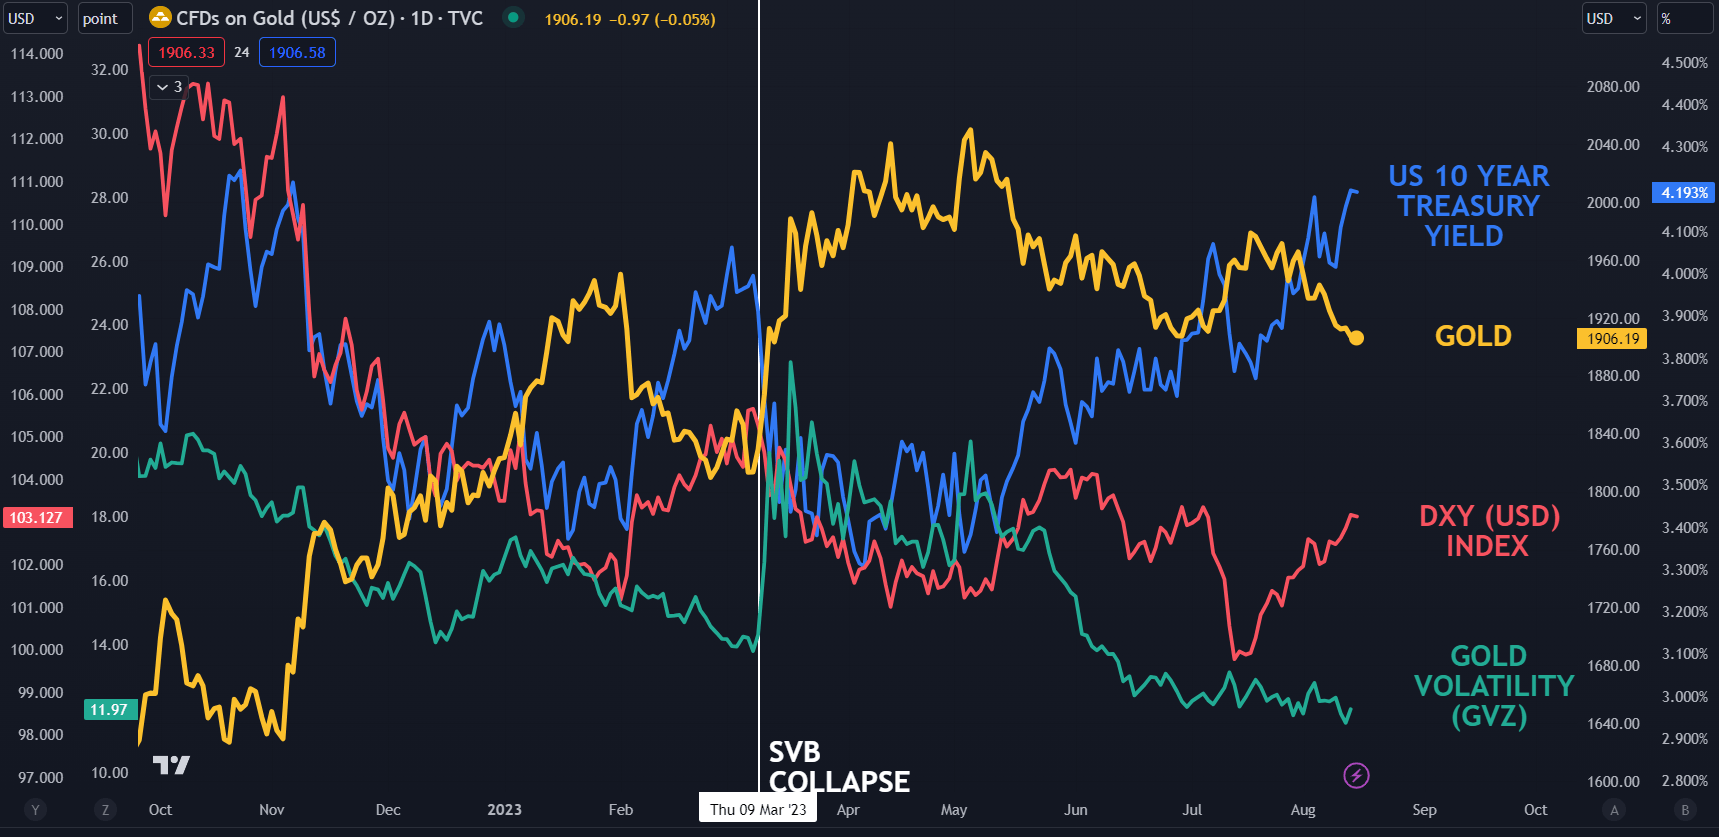
This appears to have underpinned the DXY (USD) index. At the same time, forward-looking gold volatility has been languishing of late, but it has inched up in the last few trading sessions. This may hint toward some uncertainty within the market and a significant move in price might be in the offing.

The GVZ index is a measure of implied volatility for gold that is calculated in a similar way to the VIX index’s interpretation of volatility for the S&P 500.

Looking ahead, the precious metal has held up reasonably well given the state of play, but if these headwinds persist it could be further undermined.

{{GUIDE|HOW_TO_TRADE_}}

SPOT GOLD AGAINST US 10-YEAR TREASURY YIELD, DXY (USD) INDEX AND GVZ INDEX

image1.png


Market relief in Wall Street amid China’s jitters: Russell 2000, Straits Times Index, AUD/USD

Market relief in Wall Street amid China’s jitters: Russell 2000, Straits Times Index, AUD/USD

Wall Street managed to start the week higher (DJIA +0.07%; S&P 500 +0.57%; Nasdaq +1.05%), tapping on some recovery in big tech and semiconductors to override earlier jitters around China’s property and financial sector risks. There was not much to note on the economic calendar overnight, with the relief potentially attributed to the positive view on Nvidia from Morgan Stanley, along with some attempt to stabilise after recent sell-off.

US Treasury yields continue its way higher, with the 10-year yields back at its year-to-date high around the 4.2% level. The two-year yields edged near its 5% level as well, largely a reflection for US rates to be kept high for longer. The US dollar index tapped on higher yields to gain 0.3%, but are now facing a crucial test of resistance at its 200-day moving average (MA), which it has not overcome since November 2022. Its weekly relative strength index (RSI) is hanging at its key 50 level as well, suggesting that its moves over the coming days may be critical in determining the trend ahead.

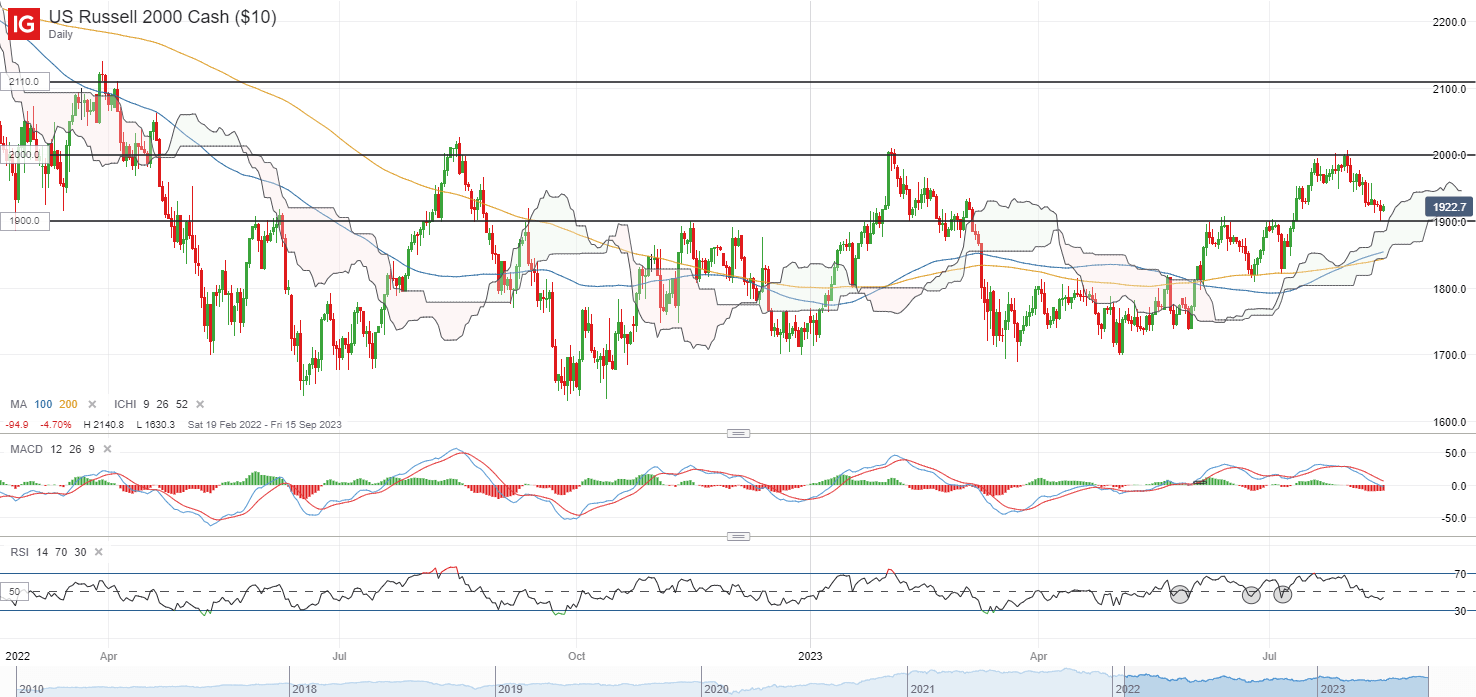
Perhaps one to watch may also be the Russell 2000 index, which is currently back at its previous horizontal resistance-turned-support at the 1,900 level, in coincidence with the upper edge of its Ichimoku cloud on the daily chart. A long-legged candle denotes some overnight dip-buying, but buyers may potentially find greater conviction from a move in the daily RSI back above its 50 level. For now, the 1,900 level will need to see some defending, failing which may pave the way towards the 1,820 level next.

image1.png

Asia Open

Asian stocks look set for a positive open, with Nikkei +0.70% and ASX +0.38% at the time of writing. South Korean markets are off-trading for Liberation Day. Despite the relief in Wall Street, Chinese equities are more subdued, with the Nasdaq Golden Dragon China Index down 0.5% overnight.

Economic releases this morning saw a pull-ahead in Japan’s 2Q GDP (annualised 6% vs 3.1% forecast), the strongest expansion since 4Q 2020. The data is likely to provide the Bank of Japan (BoJ) with more room for normalisation, although the initial short-lived bounce in the Japanese yen seems to reflect some market expectations that patience from the central bank is still the likely stance.

Ahead, focus will be on the Reserve Bank of Australia (RBA) minutes. At the previous meeting, the RBA has kept its tightening bias in place for some policy flexibility, so the minutes will be scrutinised on the factors to guide the RBA’s next decision. The China’s monthly economic data dump will be in focus as well. Industrial production is expected to stay unchanged, while retail sales are projected to recover to 4.5% from previous 3.1%. The downside surprises in economic data lately may leave room for disappointment and it may still have to take a trend of recovering economic data to convince markets that the worst is over.

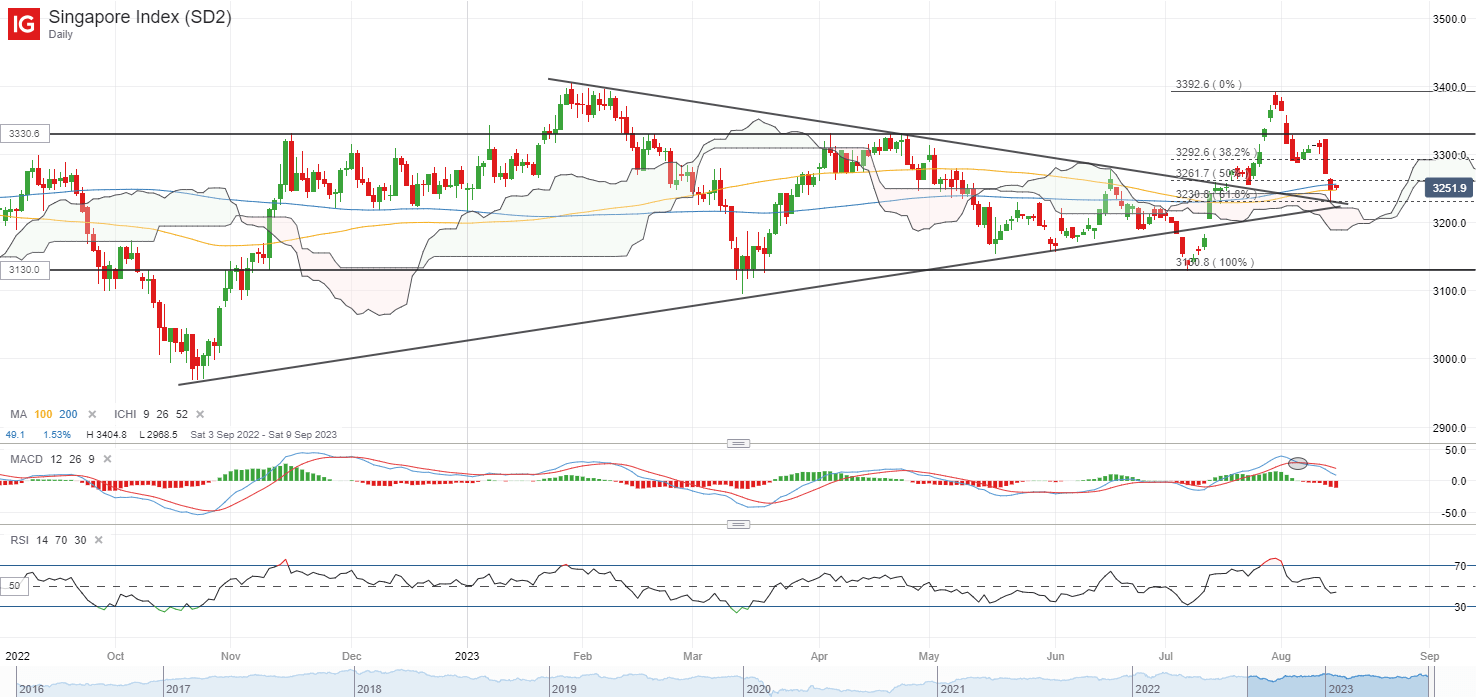
The Straits Times Index is attempting to defend its trendline support after unwinding all of its past month’s gains, alongside its 200-day MA at around the 3,245 level. Failure to defend the trendline support with a break below its 3,230 level may potentially support a move to retest its July 2023 bottom at the 3,130 level. On any upside, the 3,260 level will be an immediate resistance to overcome.

image2.png

On the watchlist: AUD/USD attempting to find support from year-to-date low

Ahead of the RBA meeting minutes and China’s economic data today, the AUD/USD is tapping on some relief in the risk environment overnight to hold its year-to-date bottom at the 0.645 level. The formation of a bullish pin bar on the daily chart reflects some near-term dip-buying, although one may watch for a confirmation close to potentially support a move to retest the 0.659 level.

Thus far, rate expectations remain firm that the RBA is nearing the end of its hiking cycle but the central bank’s data-dependent stance will still leave eyes on incoming data such as wage growth and inflation for confirmation. For now, while there is an attempt to stabilise after recent sell-off, the broader trend still seems to carry a sideway to downward bias, with the weekly RSI hanging below the 50 level. The year-to-date bottom at the 0.645 level may have to see some defending ahead for some near-term relief.

image3.png


USD Price Forecast: DXY Trades at Key Inflection Point, Retails Sales to Come

USD Price Forecast: DXY Trades at Key Inflection Point, Retails Sales to Come

DOLLAR INDEX FUNDAMENTAL FACTORS

The US dollar is trading marginally lower this morning but remains elevated as global uncertainties increase the demand for the greenback. Earlier this morning, China’s central bank surprisingly cut interest rates thus highlighting concerns around the economy while the Argentinian peso’s devaluation added more upside for the USD.

Barring external factors, the US will look ahead to retail sales data today that is expected to push higher (see economic calendar below). Should this come to fruition, the dollar could find some bids after which focus will shift to Fed speak for further guidance. From a DXY point of view, its largest constituent (euro) will face the ZEW economic sentiment index release shortly and could provide some short-term volatility for the index.

US ECONOMIC CALENDAR (GMT +02:00)

image1.png

Over the next few months, the dollar may remain well supported by investors unless economic conditions in the US start to truly show signs of significant weakness. As it stands, the gradual drop in inflationary pressures may not be enough for the Fed to start cutting rates. The stubborn labor market remains the key data point and will need to decline before we see some dollar weak vulnerability.

TECHNICAL ANALYSIS

U.S. DOLLAR INDEX (DXY) DAILY CHART

image2.png

Price action on the daily DXY chart above places the index at a key area of resistance in line with the 200-day moving average (blue). After breaking above trendline resistance (black) markets will be simultaneously monitoring the weekly chart as to whether the weekly candle closes below or above this trendline. Another close below could maintain the long-term downward trend while the opposite is true should prices close above. There is still room on the Relative Strength Index (RSI) for further upside, bringing caution to bears.

Resistance levels:

  • 104.00
  • 103.38
  • 200-day MA

Support levels:

  • 102.50
  • 50-day MA (yellow)
10 Trading Mistakes to Avoid in Forex Trading

10 Trading Mistakes to Avoid in Forex Trading

Mistake 1: No trading plan

Traders without a trading plan tend to be haphazard in their approach because there is no consistency in strategy. Trading strategies have predefined guidelines and approaches to every trade. This prevents traders from making irrational decisions due to adverse movements. Devoting to a trading strategy is key because veering away may lead to traders plunging themselves into unchartered territory with regards to trading style. This eventually results in trading mistakes due to unfamiliarity. Trading strategies should be tested on a demo account . Once traders are comfortable and understand the strategy, this can be translated to a live account.

Mistake 2: Over-leveraging

Margin/leverage refers to the use of loaned money to open forex positions. While this feature requires less personal capital per trade, the possibility of enhanced loss is real. The use of leverage magnifies gains and losses, so managing the amount of leverage is key. Learn more on what is leverage in the forex market.

Brokers play an important role in protecting their customers. Many brokers offer unnecessarily large leverage levels such as 1000:1 which puts novice and experienced traders at significant risk. Regulated brokers will cap leverage to appropriate levels guided by respected financial authorities. This should be taken into consideration when selecting a fitting broker.

Mistake 3: Lack of time horizon

Time investment works hand in hand with the trading strategy being implemented. Each trading approach aligns itself to varying time horizons, therefore understanding the strategy will lead to gauging the estimated time frame used per trade. For example, a scalper will target shorter time frames whilst positions traders favour the longer time frames. Explore the forex strategies for varying time horizons.

Mistake 4: Minimal research

Forex traders are required to invest in proper research to employ and execute a specific trading strategy. Studying the market as it should be, will bring light to market trends, timing of entry/exit points and fundamental influences as well. The more time dedicated to the market, the greater the understanding of the product itself. Within the forex market, there are subtle nuances between the different pairs and how they work. These differences need thorough examination to succeed in the market of choice.

Reacting to media and baseless advice should be avoided without verification from the employed strategy and analysis. This is a common occurrence with traders. This does not mean these tips and media releases should not be considered, but rather investigated systematically prior to acting on the information.

Mistake 5: Poor risk-to-reward ratios

Positive risk-to-reward ratios are often overlooked by traders which can result in poor risk management. A positive risk-to-reward ratio such as 1:2 refers to potential profit being double the potential loss on the trade. The chart below shows a long EUR/USD trade with a 1:2 risk-to-reward ratio. The trade was opened at a level of 1.12698 with a stop at 1.12598 (10 pips) and a limit of 1.12898 (20 pips). An effective indicator to help identify stop and limit levels in forex is the Average True Range (ATR) which uses market volatility to base entry and exit points.

Having a ratio in mind helps to manage expectations of traders, this is important because after much research by DailyFX, improper risk management has proven to be the number one mistake made by traders.

EUR/USD 1:2 risk-to-reward ratio:
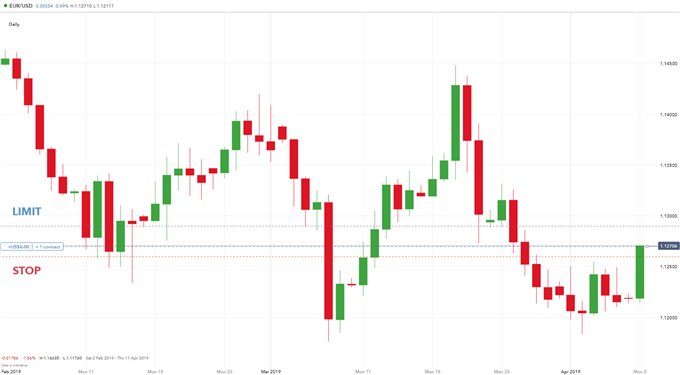
EUR/USD risk-t-reward ratio

Mistake 6: Emotion based trading

Emotional trading often leads to irrational and unsuccessful trading. Traders frequently open additional positions after losing trades to compensate for the previous loss. These trades usually have no educational backing either technically or fundamentally. Trading plans are there to avoid this type of trading therefore, it is imperative that the plan is followed closely.

Mistake 7: Inconsistent trading size

Trading size is crucial to every trading strategy. Many traders trade unsuitable sizes in relation to their account size. Risk then increases and could potentially erase account balances. DailyFX recommends risking a maximum of 2% of the total account size. For example, if the account contains $10,000 then a maximum of $200 of risk is suggested per trade. If traders observe this general rule, the pressure of overexposing the account will be removed. The inherent risk of overexposing the account on a particular market is extremely dangerous.

Mistake 8: Trading on numerous markets

Trading on a few markets lets traders gain the necessary experience to become proficient at these markets without scratching the surface of a few markets. Many novice forex traders look to trade on multiple markets without success due to lack of understanding. This is something that should be done on a demo account if need be. Noise trading (irrational trading) often leads traders to place trades without the proper fundamental/technical justification on varying markets. For example, the Bitcoin craze of 2018 sucked in a lot of noise traders at the wrong time. Unfortunately, many traders entered at the ‘FOMO or Euphoria’ stage of the market cycle which resulted in significant losses.

Mistake 9: Not reviewing trades

Frequent use of a trading journal will allow traders to identify possible strategic flaws along with successful facets. This will enhance the traders overall understanding of the market and strategy for future. Reviewing trades not only highlight errors, but beneficial aspects as well which must be reinforced on a constant basis.

Mistake 10: Selecting an unsuitable broker

There are numerous CFD brokers globally, so choosing the right one can be difficult. Financial stability and proper regulation are essential before opening an account with a broker. This information should be readily available on the brokers website. Many brokers are regulated in countries where guidelines are weak, to circumvent regulations in stricter jurisdictions such as the US (Commodity Exchange Act) and the UK (FCA).

Safety is the primary focus; however, a comfortable platform and ease of execution is also central to choosing a broker. Becoming accustomed with the platform and costing should be given ample time prior to trading with live funds.

Forex Trading Mistakes: A Summary

Having the correct foundational base to trade forex is important before undertaking any form of live trading. Taking the time to understand the do’s and don’ts of forex trading will benefit traders in future. All traders will eventually make mistakes but minimizing them as well as eliminating repeat offenses must be practiced and become expected behaviour. The primary focus of this article is to adhere to a trading plan with proper risk management, and a suitable reviewing system.

  • If you are new to forex be sure to get up to date with the basics of forex trading through our New to Forex guide.
  • Our research team analyzed over 30 million live trades to uncover the Traits of Successful Traders. Incorporate these traits to give yourself an edge in the markets.
  • Traders often look to retail client sentiment when trading popular forex markets. DailyFX provides such data, based on IG client sentiment.

Australian Dollar Defies Gravity with Action Out of China, the PBOC and Japan

Australian Dollar Defies Gravity with Action Out of China, the PBOC and Japan

The Australian Dollar scoped out yesterday’s 10-month earlier today before rebounding on a bunch of data domestically and from Japan and China.

The backdrop to today’s move in the Aussie, and broader markets, has been the rise of the US Dollar being fanned by higher Treasury yield tailwinds.

The benchmark 10-year Treasury note eclipsed 4.20% in early Asian trade today after having hurdled the level overnight for the first time since November last year.

That move coincided with AUD/USD dipping toward its low, assisted by a weaker-than-expected wage price index of 3.6% year-on-year to the end of July, missing estimates of 3.7%. The soft read led to speculation of a less hawkish RBA.

That data point was soon surpassed by Chinese numbers that revealed a weaker than forecast economy.

Year-on-year to the end of July saw industrial production at 3.7% rather than the 4.3% anticipated, retail sales were 2.5% instead of the 4.0% estimated and fixed asset investment ex-rural came in at 3.4%, below the 3.7% forecast.

The statistics showed why the Peoples Bank of China (PBOC) had cut the 1-year medium-term lending facility (MLF) just prior. The Yuan tumbled lower with USD/CNY rallying toward 7.3000.

Elsewhere today, Japanese GDP figures printed way above expectations at 6.0% annualised for 2Q to the end of July, above the 2.9% expected by economists.

There was little reaction in markets with most of the boost emanating from exports and thereby lacked the impetus to move the dial on speculation of a tilt to the Bank of Japan’s yield curve control (YCC) program.

USD/JPY continues to tread water above 145.50 and the Nikkei 225 modest gains along with Australian and Korean indices. Not surprisingly, Chinese and Hong Kong bourses are lower on the day.

Futures are pointing toward a steady start to markets across Europe and Wall Street.

Commodity markets have had a relatively subdued start to Tuesday although soft (grains) commodities are slightly weaker.

Natural gas is a little higher on concerns of strikes at Woodside and Chevron, some of the world’s largest producers. Spot gold has been unable to recover recent losses as it trades near US$ 1,900 an ounce.

Looking ahead, after UK jobs data and the German ZEW survey, Canada will see CPI figures while the US will also see job statistics.

AUD/USD TECHNICAL ANALYSIS SNAPSHOT

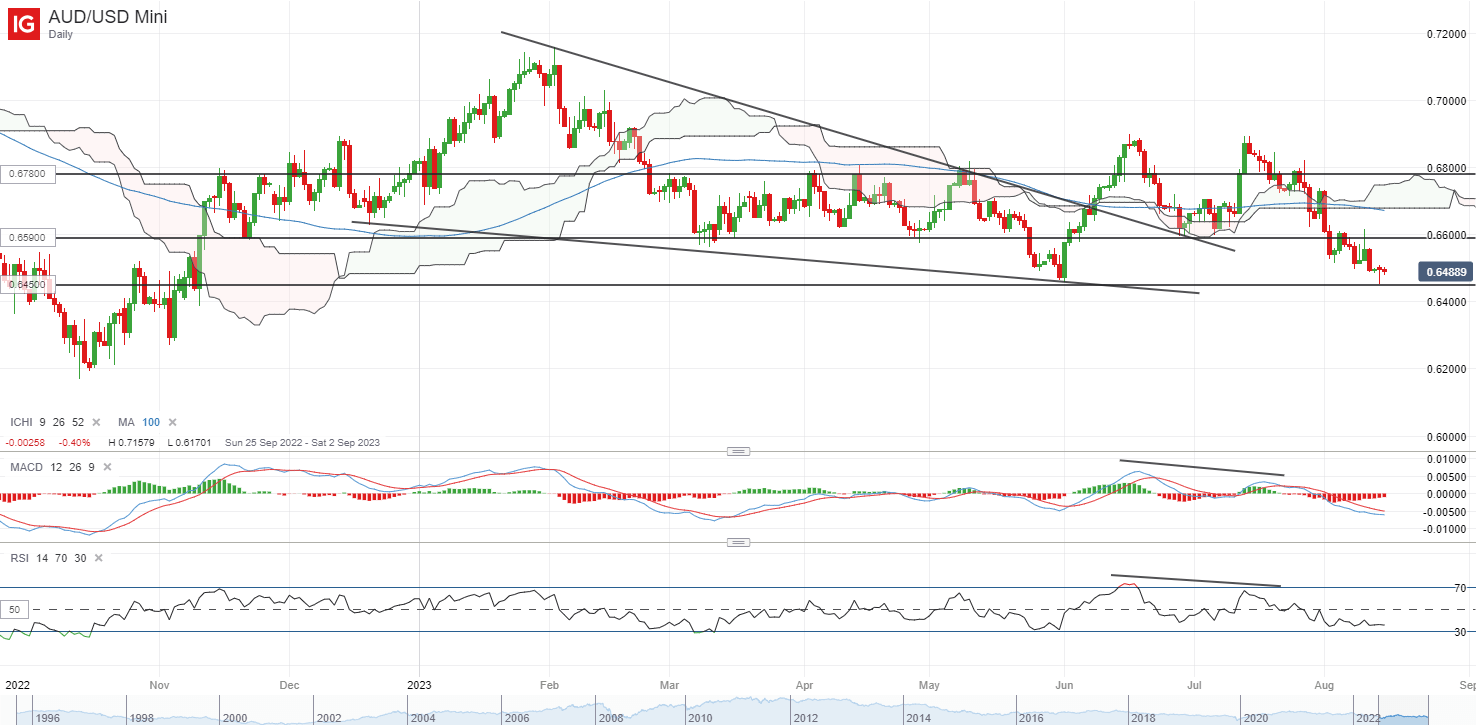
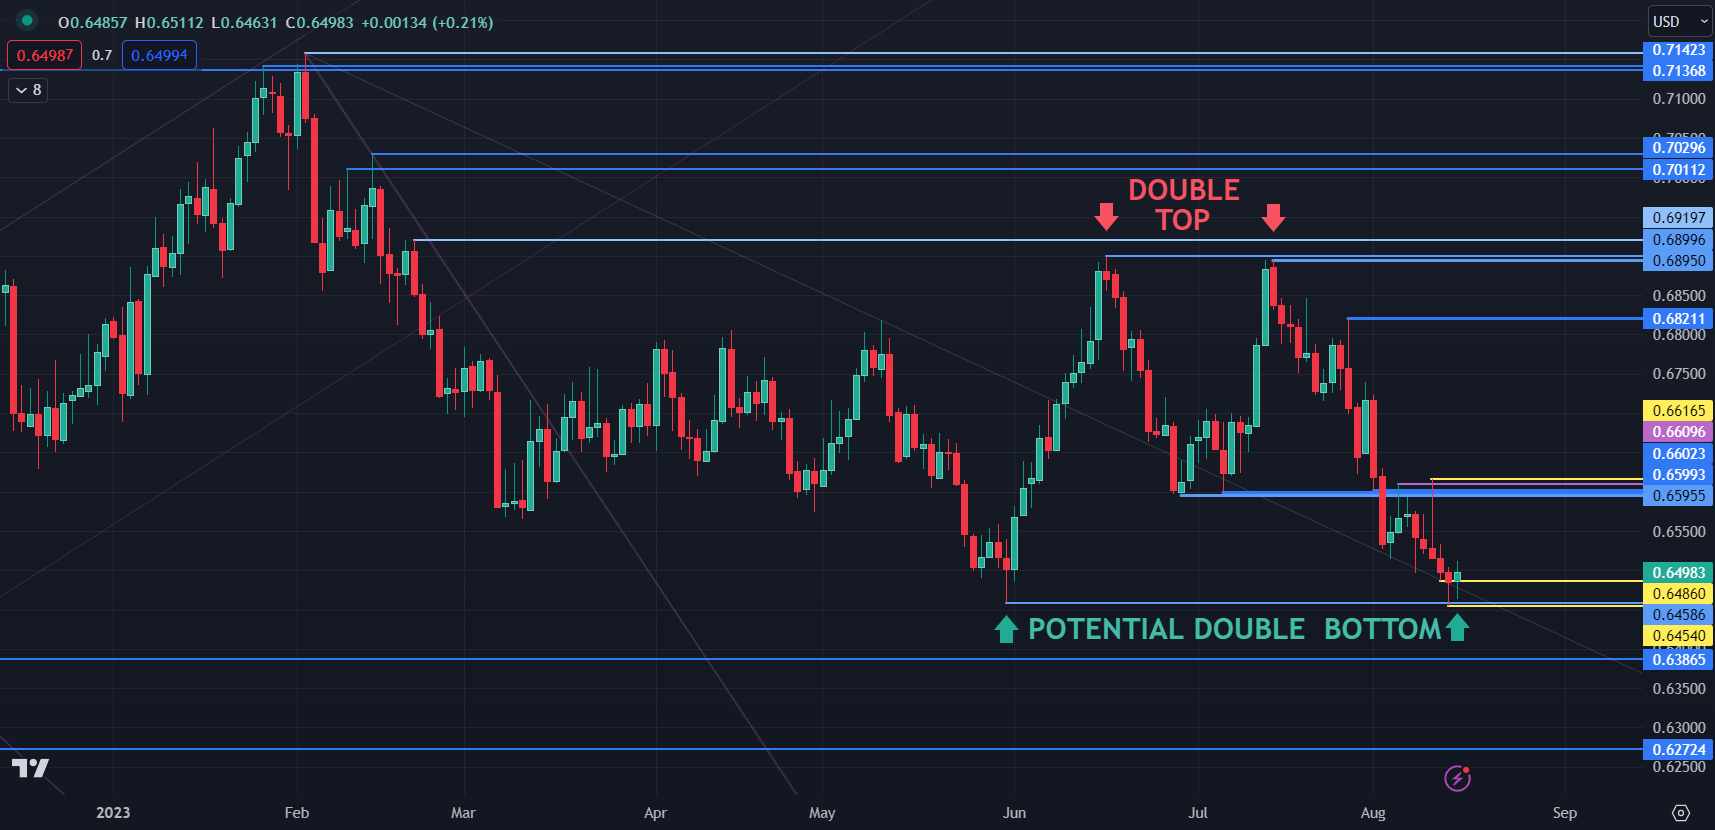
Overall, AUD/USD marginally broke the lower bound of the six-month trading range of 0.6459 – 0.6900 when it traded at 0.6554.

If the price fails to run lower in the next few sessions, it might be regarded as a false break. That scenario may also indicate that a Double Bottom could be in place.

For more information on range trading, click on the banner below.

Nearby resistance could be at a cluster of breakpoints and prior peaks in the 0.6595 – 0.6615 area. On the downside, support might be near the recent lows of 0.6486 and 0.6459.

image1.png


BoE Faces Pressure Following Average Earnings Spike as Unemployment Rises, GBP/USD Bid

BoE Faces Pressure Following Average Earnings Spike as Unemployment Rises, GBP/USD Bid

The latest data out from the UK showed a mixed bag for the UK labour market. Estimates for April through to June 2023 show decreases in the employment and economic inactivity rates compared with the previous quarter. The number of people in work fell fell by 66 thousand in the three months to June 2023, against market expectations of a 75 thousand rise and following a 102 thousand increase in the previous period. This is the first drop in job creation since August 2022 and could be a sign of some cooling in the labor market despite the increase in average earnings.

image1.png

The unemployment rate increased to 4.2% on the quarter above the forecasted figure of 4% and 0.2% above pre-coronavirus pandemic levels. The increase in unemployment was driven by people unemployed for up to 6 months. In the latest quarter, the number of people unemployed for up to 6 months increased, with the largest increase since August to October 2022. This suggests that it is taking longer for those leaving economic inactivity to find work than in recent periods.

In April to June 2023, annual growth in regular pay (excluding bonuses) was 7.8%; this is the highest regular annual growth rate since comparable records began in 2001. Average earnings incl. bonuses rose even faster coming in at 8.2% for the period April to June 2023; it is important to note that this total growth rate is affected by the NHS one-off bonus payments made in June 2023.

image2.png

UK OUTLOOK MOVING FORWARD

Looking ahead and the recent GDP data out of the UK showed promising signs once more. The Bank of England have remained firm in their belief that inflation will trickle down in Q3 and Q4 of 2023 with the most recent print showing a significant drop-off.

There is no denying the UK economy has remained resilience for the large part, however today’s data will give the Bank of England (BoE) a massive headache. We have seen a bigger than expected drop-off in unemployment, but the Central Bank had stressed prior to the release that the average earnings figure would be crucial. Given the massive beat in average earnings it is unlikely that the BoE will be able to take its foot of the pedal in terms of rate hikes, at least not yet.

The Bank of England did leave the door open to further interest rate hikes and I think it is something they will have to act on following today’s data releases. We obviously have CPI data tomorrow with any print above or in line forecast likely to cement another rate hike in September.

MARKET REACTION

The initial market reaction following the news has seen GBPUSD bounce around 40-pips from the key support area around the 1.2680 mark.

However, GBPUSD on a daily timeframe still remains within the range between the 50 and 100-day MAs resting around the 1.26100 and 1.2760 mark. Yesterday saw an attempt to break below support at the 1.26100 mark but was met with buying pressure which has been the case of late. Sustainable moves continue to elude market participants as risk on-risk off battle continues. For a more comprehensive breakdown and longer-term view click on the article EUR/GBP, GBP/USD Remain Rangebound as GBP Faces a Defining Week.

GBPUSD Daily Chart, August 15, 2023