Stock Indices Continue to Slide on China Growth Worries and Bank Downgrades

Stock Indices Continue to Slide on China Growth Worries and Bank Downgrades

FTSE 100 slips despite UK inflation diminishing

Following on from Tuesday’s sharp falls, the FTSE 100 continues to slide despite UK inflation dropping to levels last seen in February 2022 and matching market consensus at 6.8% in July, driven by falling gas and electricity prices.

The UK blue-chip index is now trading in one-month lows and is fast approaching its 7,228 July trough. En route minor support may be found around the 10 July high at 7,307.

Immediate resistance can be spotted at the 7,394 mid-July low and more significant resistance between the May and early August lows at 7,433 to 7,437.

Source: IG

DAX 40 remains under pressure

The DAX 40’s slide on China growth worries and possible downgrades of major banks by the ratings agency Fitch is ongoing with the index trading in one-month lows and flirting with the June trough at 15,710.

The next lower early and late May lows at 15,659 to 15,625 may soon be reached but could offer support. If not, the July trough at 15,455 would be back in the frame.

Minor resistance can be found around the 4 August low at 15,780 and more important resistance along the July-to-August downtrend line at 15,912. While the index remains below the next higher 16,062 high seen last week, overall downside pressure should dominate.

S&P 500 drops to new one-month low

Worries about lacklustre China growth and major US investment banks such as JPMorgan possibly being downgraded by Fitch have pushed the S&P 500 to a new one-month low.

The index also slipped through and closed below its March-to-August uptrend line at 4,450 and reached the 55-day simple moving average (SMA) at 4,439 which may offer short-term support.

If slipped through on a daily chart closing basis, however, the July low at 4,378 should be next in line.

Resistance above the breached six-month uptrend line, now because of inverse polarity a resistance line, can be spotted between the June to July highs at 4,447 to 4,458. While no rise above the next higher 4,526 high – seen last week – occurs, the S&P 500 should retain its short-term bearish bias.


The Crypto Market Starts Moving Down

The Crypto Market Starts Moving Down

Crypto Market Sees Minor Decline as Bitcoin Volatility Reaches Record Low

Crypto CapitalizationThe crypto market lost 1.2% over the past 24 hours to $1.156 trillion. This is a downward move, albeit small, after a long consolidation. Larger currencies have seen less pressure than smaller altcoins. Rising US Treasury yields put pressure on riskier assets and attracted some capital. Thus, Bitcoin lost 0.7% on the day, Ethereum – 1%, and altcoins lost from 6.3% (Solana) to 1.1% (Tron).

According to The Block, bitcoin volatility fell to a record low, with BTC’s 30-day volatility on an annualised basis dropping to 15.5% from 61.4% last year. Glassnode also notes the extreme level of apathy and exhaustion amid the drop in volatility.

Trading Derivatives carries a high level of risk to your capital and you should only trade with money you can afford to lose. Trading Derivatives may not be suitable for all investors, so please ensure that you fully understand the risks involved, and seek independent advice if necessary. A Product Disclosure Statement (PDS) can be obtained either from this website or on request from our offices and should be considered before entering into a transaction with us. Raw Spread accounts offer spreads from 0.0 pips with a commission charge of USD $3.50 per 100k traded. Standard account offer spreads from 1 pips with no additional commission charges. Spreads on CFD indices start at 0.4 points. The information on this site is not directed at residents in any country or jurisdiction where such distribution or use would be contrary to local law or regulation.

Bitcoin approached $29.0K after a prolonged consolidation of around $29.4K. Technically, the sell-off in Bitcoin could gain momentum on a break below $28.9K. In this case, the price could quickly fall to $28.0K or even $27.2K.

Crypto News

Kevin Kelly, Delphi Digital co-founder and head of research, sees signs of an early bull rally in the crypto market. He believes BTC could reach new all-time highs around the end of 2024, following its halving.

Crypto-related activity may pose new and complex risks to the US banking system that are difficult to assess fully. This is the conclusion of the US Federal Deposit Insurance Corporation’s (FDIC) annual review.

UK-based Jacobi Asset Management has launched Europe’s first spot bitcoin ETF. The instrument is listed on Euronext Amsterdam and includes a renewable energy certification solution.

New Zealand cryptocurrency exchange Dasset has closed customer access to assets and announced it will begin liquidation after six years of operation. According to media reports, users had been trying unsuccessfully to withdraw funds from the platform for months.

Oil Prices Forecast: China’s Economic Woes Weigh on Global Oil Prices

Oil Prices Forecast: China’s Economic Woes Weigh on Global Oil Prices

Overview

Crude oil prices are lower early Wednesday, largely influenced by China’s economic data. This downturn has overshadowed the notable decline in U.S. oil reserves.

China’s July Data Darkens Oil Outlook

China’s economic activity data for July has taken the spotlight, indicating potential trouble ahead for the oil market. Disappointing metrics in retail sales, industrial outputs, and investments suggest an impending slowdown in the nation’s economic growth. Such figures have raised concerns about China’s ability to meet its 5% growth target this year without significant fiscal intervention.

Trading Derivatives carries a high level of risk to your capital and you should only trade with money you can afford to lose. Trading Derivatives may not be suitable for all investors, so please ensure that you fully understand the risks involved, and seek independent advice if necessary. A Product Disclosure Statement (PDS) can be obtained either from this website or on request from our offices and should be considered before entering into a transaction with us. Raw Spread accounts offer spreads from 0.0 pips with a commission charge of USD $3.50 per 100k traded. Standard account offer spreads from 1 pips with no additional commission charges. Spreads on CFD indices start at 0.4 points. The information on this site is not directed at residents in any country or jurisdiction where such distribution or use would be contrary to local law or regulation.

As a result, Beijing has initiated key policy rate cuts, aiming to boost economic activities and potentially rejuvenate oil demand. If China opts for aggressive stimulus measures, the oil market might see an increase in commodity demand and a consequential rise in oil prices. The Q4 forecast heavily leans on China’s macroeconomic moves.

US Cushing Hub Inventories Plunge

Meanwhile, the U.S. is witnessing significant activity in the oil sector. Crude inventories, especially at the Cushing hub, have reached their lowest since April. This inventory decline implies that demand is robust or supply has decreased, a scenario which typically supports oil price increases. This trend is further underscored by Asian refineries swiftly securing available U.S. oil cargoes.

More OPEC+ Output Cuts Ahead?

Adding to the global dynamic, major countries like Saudi Arabia and Russia, part of the influential OPEC+ group, have implemented supply cuts, indirectly supporting oil prices in the recent past. With China’s uncertain economic trajectory, such countries might employ further strategic measures to ensure market stability.

Short-term Forecast

The present market sentiment is bearish, influenced heavily by China’s economic health. However, the reduction in U.S. stockpiles and potential interventions by OPEC+ might introduce bullish elements. The immediate future of oil prices largely depends on China’s next economic moves and strategies.

Technical Analysis


4-Hour Crude OilThe current 4-hour price of Crude Oil stands at $80.65, showing a slight decline from the previous 4-hour close at $80.98. When we analyze its position relative to the moving averages, the commodity trades above the 200-4H moving average of $77.66 but below the 50-4H moving average of $82.52. This suggests a neutral to slightly bearish sentiment. The 14-4H RSI, at 36.59, indicates weakened momentum and is nearing the oversold threshold.

The price is situated just above the main support zone of $78.29 to $79.05 and is below the main resistance area ranging from $81.73 to $83.63. Based on this analysis, the Crude Oil market on the 4-hour chart appears to be bearish, but caution is advised due to its proximity to the main support area.

Dax Index and Fed Fears: A Rocky Road Ahead for Dax Stocks

Dax Index and Fed Fears: A Rocky Road Ahead for Dax Stocks

Overview

It was a bearish Tuesday for the DAX. Reversing a 0.46% gain from Monday, the DAX fell by 0.86% to end the day at 15,767.

Economic indicators from China set the mood. Industrial production increased 3.7% year-over-year in July versus 4.4% in June, with retail sales up 2.5% versus 3.1% in June. Economists forecast increases of 4.5% and 4.8%, respectively.

Trading Derivatives carries a high level of risk to your capital and you should only trade with money you can afford to lose. Trading Derivatives may not be suitable for all investors, so please ensure that you fully understand the risks involved, and seek independent advice if necessary. A Product Disclosure Statement (PDS) can be obtained either from this website or on request from our offices and should be considered before entering into a transaction with us. Raw Spread accounts offer spreads from 0.0 pips with a commission charge of USD $3.50 per 100k traded. Standard account offer spreads from 1 pips with no additional commission charges. Spreads on CFD indices start at 0.4 points. The information on this site is not directed at residents in any country or jurisdiction where such distribution or use would be contrary to local law or regulation.

Other indicators were also bearish. The unemployment rate increased from 5.2% to 5.3%, with fixed asset investments rising by 3.4% versus 3.8% in June. Economists forecast fixed asset investments to be up 3.8%.

The PBoC responded to the stats by cutting key policy rates unexpectedly to boost growth. However, the move was not enough to prevent a DAX reversal. Investors expect more aggressive support from Beijing to deliver a reversal of economic fortunes.

Late in the European session, US retail sales figures supported the soft-landing theory but also reignited fears of a September Fed rate hike.

The S&P 500 fell by 1.16% on Tuesday. It was also a bearish session for the Dow and the NASDAQ Composite, which saw losses of 1.02% and 1.14%, respectively.  Fed rate hike jitters left the indexes in negative territory.

Daily Chart sends bearish near term price signals.
DAX 160823 Daily Chart
EUR/USD Forecast: Navigating Euro’s Path Amid Hawkish Fed Minutes

EUR/USD Forecast: Navigating Euro’s Path Amid Hawkish Fed Minutes

The EUR/USD slipped by 0.04% to $1.09014 on Tuesday. After a bullish morning session, the EUR/USD slid to a midday low of $1.08964 before striking an early afternoon high of $1.09524. However, hotter-than-expected US retail sales figures left the EUR/USD in negative territory.

Trading Derivatives carries a high level of risk to your capital and you should only trade with money you can afford to lose. Trading Derivatives may not be suitable for all investors, so please ensure that you fully understand the risks involved, and seek independent advice if necessary. A Product Disclosure Statement (PDS) can be obtained either from this website or on request from our offices and should be considered before entering into a transaction with us. Raw Spread accounts offer spreads from 0.0 pips with a commission charge of USD $3.50 per 100k traded. Standard account offer spreads from 1 pips with no additional commission charges. Spreads on CFD indices start at 0.4 points. The information on this site is not directed at residents in any country or jurisdiction where such distribution or use would be contrary to local law or regulation.

Eurozone employment change, second estimate GDP, and industrial production numbers will draw interest. While the ZEW Economic Sentiment Index showed an improving outlook, the jury is out on whether the Eurozone can avoid a further deterioration in the macroeconomic environment.

Economists forecast the Eurozone economy to expand by 0.3% quarter-on-quarter after stalling in the first quarter. Revisions to the first estimate figures will move the dial. However, industrial production will also need consideration, with the weak demand environment suggesting a more marked decline than forecasts. Economists forecast a 0.1% decline in July.

We expect the employment and GDP numbers to have more impact. Employment and consumption are important considerations for the ECB. Deteriorating labor market conditions would signal a slump in consumption and the euro area economy.

An increased contribution from the service sector to the economy has watered down the influence of industrial production numbers. Weak production numbers would align with the latest private sector PMIs.

With the European economic calendar on the busier side, investors should track ECB chatter. However, no ECB Executive Board Members are on the calendar to speak today, leaving commentary with the media to move the dial. Dovish speeches would further pressure the EUR/USD.

The US Session

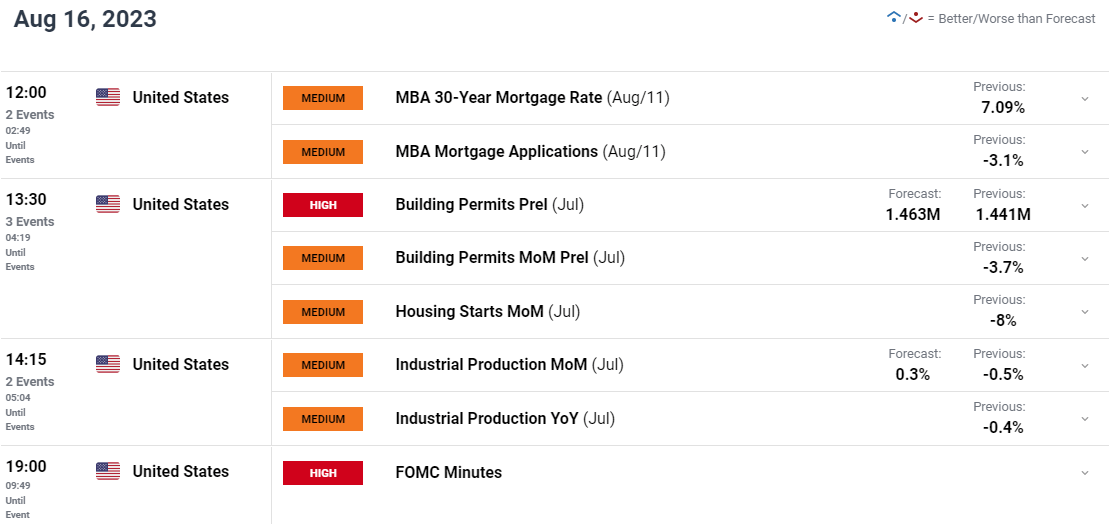
Housing sector data and industrial production figures for July will be in focus. While the housing sector is a litmus test for the US economy, industrial production numbers will garner interest.

Investors are looking for signs of a deviation from the soft-landing theory.

However, it is worth noting that the industrial production numbers are unlikely to influence the Fed. The manufacturing sector accounts for less than 30% of the US economy and is unlikely to dictate sentiment toward Fed monetary policy. In contrast, a marked deterioration in US housing sector conditions would raise eyebrows.

Later in the session, the FOMC meeting minutes will impact the EUR/USD. While the Fed raised rates by 25 basis points in July, Fed Chair Powell left the door ajar to further rate hikes. With recent economic indicators supporting further tightening, the minutes will reveal whether the Hawks or the Doves are in the driving seat.

Hawkish minutes will send the EUR/USD further south as economic indicators signal a hotter US economy.

EUR/USD Price Action

Daily Chart

The Daily Chart showed the EUR/USD hold at the upper level of the 1.0900 – $1.0850 support band. After the choppy Tuesday session, the EUR/USD remained below the 50-day EMA while holding above the 200-day EMA, sending bearish near-tern but bullish longer-term price signals.

A EUR/USD move through the 50-day EMA would give the bulls a run at the $1.1015 – $1.1060 resistance band. However, failure to move through the 50-day EMA would leave the $1.0900 – 1.0850 support band and sub-$1.08 in play.

Looking at the 14-Daily RSI, the 40.62 reading reflects bearish sentiment. The RSI aligns with the 50-day EMA, signaling a fall through the $1.0900 – 1.0850 support band to target $1.08.

EUR/USD Daily Chart sends bearish near-term price signals.
EURUSD 160823 Daily Chart

4-Hourly Chart

Looking at the 4-Hourly Chart, the EUR/USD sits at the upper level of the $1.0900 – $1.0850 support band. The EUR/USD remains below the 50-day and 200-day EMAs, sending bearish near and longer-term price signals.

The 14-4H RSI at 39.84 reflects bearish sentiment, with selling pressure outweighing buying pressure. Significantly, the RSI suggests further losses and a fall through the $1.0900 – $1.0850 support band to target $1.08.

Price action today hinges on the euro area and US economic indicators and, ultimately, the FOMC meeting minutes.

4-Hourly Chart affirms bearish near-term price signals.
EURUSD 160823 4 Hourly Chart
Silver Prices Forecast: Rising Yields, Hawkish Fed Concerns Weigh on XAG/USD

Silver Prices Forecast: Rising Yields, Hawkish Fed Concerns Weigh on XAG/USD

Overview

As the allure of U.S. Treasury yields surged, reaching nearly a 10-month high on Tuesday on the back of expectations surrounding the Federal Reserve’s monetary tightening, silver found itself caught in a turbulent financial storm. The non-yielding nature of silver, coupled with its susceptibility to external pressures, has seen its value tumble over the past month.

Silver’s Dwindling Appeal in a Rising Yield Environment

The strengthening of the U.S. dollar and an unprecedented increase in real yields has seen the appeal of XAG/USD diminish. The recent decline in silver prices, bouncing from a multi-month low, is a testament to the influence exerted by these macroeconomic factors. As investors seek refuge in assets with rising yields, silver faces the brunt of this shift in preference.

Trading Derivatives carries a high level of risk to your capital and you should only trade with money you can afford to lose. Trading Derivatives may not be suitable for all investors, so please ensure that you fully understand the risks involved, and seek independent advice if necessary. A Product Disclosure Statement (PDS) can be obtained either from this website or on request from our offices and should be considered before entering into a transaction with us. Raw Spread accounts offer spreads from 0.0 pips with a commission charge of USD $3.50 per 100k traded. Standard account offer spreads from 1 pips with no additional commission charges. Spreads on CFD indices start at 0.4 points. The information on this site is not directed at residents in any country or jurisdiction where such distribution or use would be contrary to local law or regulation.

Precious Metals & Waning Investor Sentiment

The decline in enthusiasm isn’t confined to silver alone. The world’s largest gold-backed exchange-traded fund, the SPDR Gold Trust, also experienced a significant drop in holdings, a nadir unseen since January 2020. The absence of inflows since late July further echoes the dwindling confidence in precious metals.

Impact of U.S. Economic Data on Silver

Encouraging retail sales data from the U.S. for July hinted at an economy holding its ground. A more resilient economy, coupled with the Federal Reserve’s aggressive interest rate policies, might further deter investors from viewing silver as a reliable safe haven, especially if these high rates are maintained.

China’s Stagnation and the Global Scene

The less-than-expected performance of China’s industrial production and retail sales for July adds another layer of complexity. Even with interest rate cuts by the People’s Bank of China, the growth concerns continue to loom, indirectly influencing the demand and appeal of silver on a global scale.

Short-term Forecast

Silver’s trajectory remains uncertain, influenced by multifaceted global factors and shifts in investor sentiment. With both U.S. and global economic indicators sending mixed signals, and the looming decisions of the Federal Reserve, silver’s position appears vulnerable, leaning towards a bearish sentiment in the immediate future.

Technical Analysis

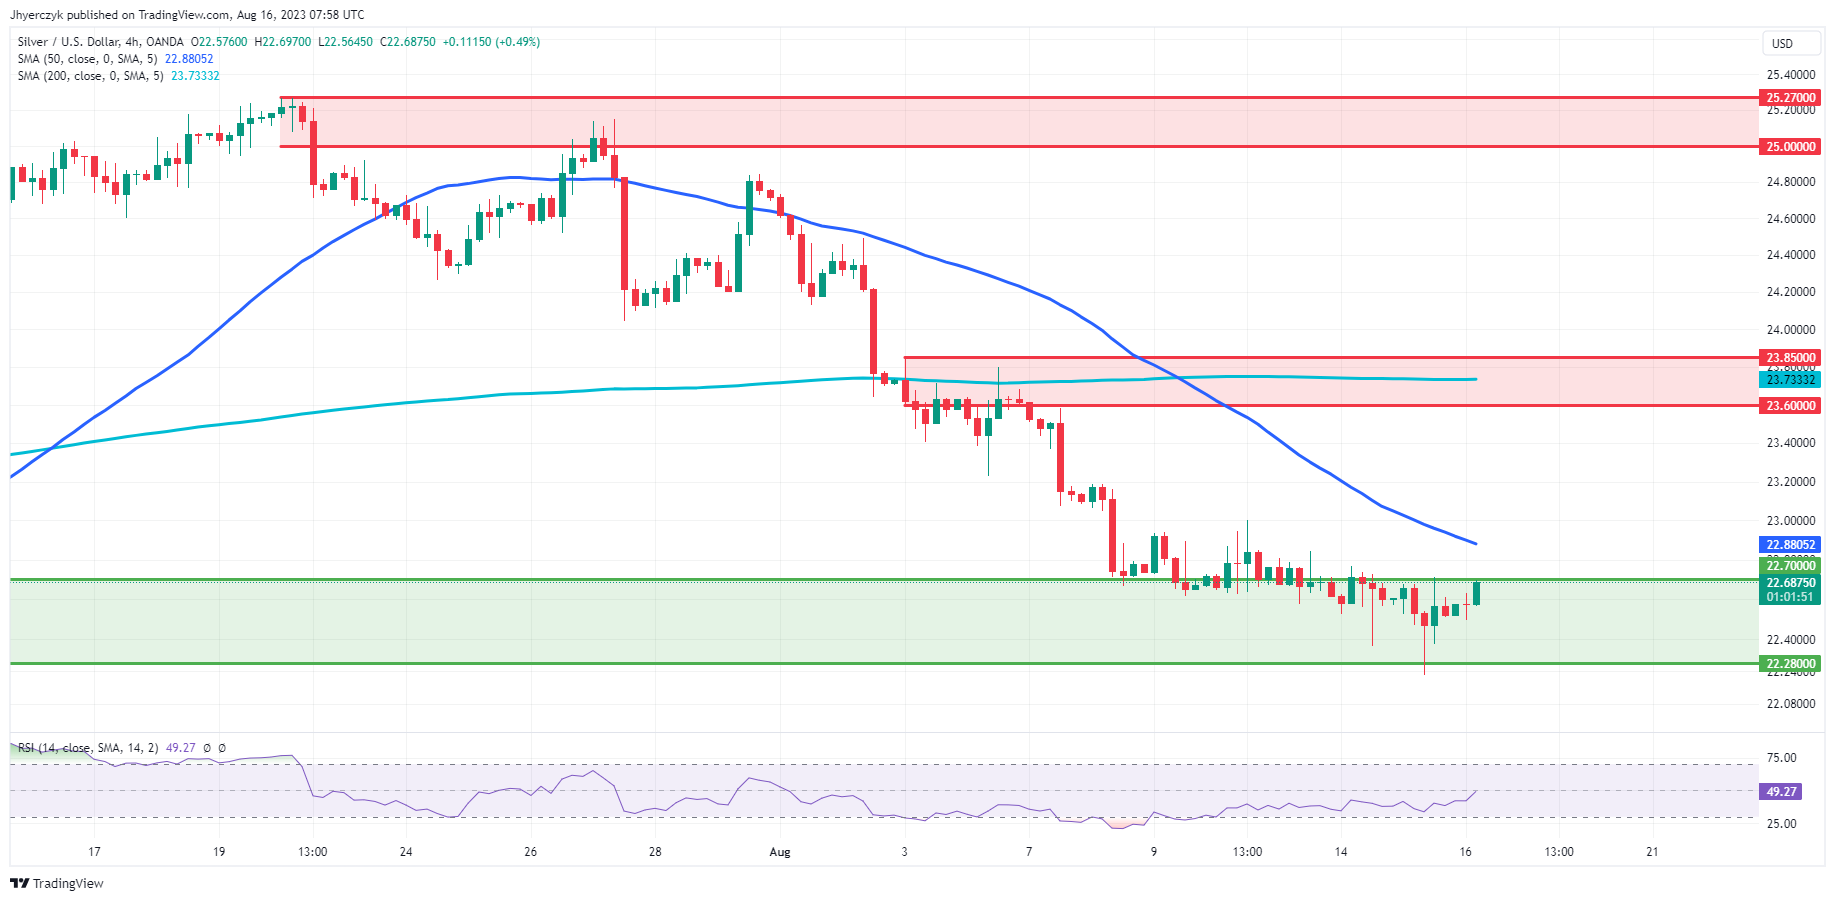
4-Hour Silver (XAG/USD)Silver (XAG/USD) is currently trading at 22.69, a slight uptick from its previous 4-hour price of 22.58. It’s positioned below both the 200-4H moving average of 23.73 and the 50-4H moving average of 22.88, hinting at a bearish sentiment in the short term. The 14-4H RSI reads 49.47, suggesting a nearly neutral momentum, but slightly on the weaker side.

Prices are hovering precariously close to the main support area at 22.28, which was successfully tested on Tuesday.  Sentiment is bearish with the only hope for bullish speculators is an upside breakout over the 50-4H moving average at 22.88.

Gold Prices Forecast: XAU/USD’s Vulnerability Evident Amidst Yield Rise, Fed Outlook

Gold Prices Forecast: XAU/USD’s Vulnerability Evident Amidst Yield Rise, Fed Outlook

Overview

Gold (XAU/USD)’s recent dip below the crucial $1,900 support highlights the metal’s vulnerability amidst rising U.S. Treasury yields and anticipation surrounding the Federal Reserve’s monetary strategy.

Yields and Gold Dynamics

On Tuesday, gold prices plunged to $1,895.50 an ounce, their lowest since late June. This decrease coincided with the 10-year U.S. Treasury yields reaching a nearly 10-month pinnacle. The allure of these yields seems to overshadow non-yielding bullion, especially with the persistent climb in real yields.

Investor Sentiment and Gold

Reflecting waning enthusiasm for gold, the SPDR Gold Trust, the world’s predominant gold-backed ETF, reported holdings at their lowest since January 2020. Astonishingly, there haven’t been inflows since the end of July. The robust U.S. retail sales data suggests resilience in the economy, potentially diminishing the appeal of gold as a safe haven.

Federal Reserve’s Outlook

While Minneapolis Fed President Neel Kashkari acknowledges progress in managing inflation, he hinted that interest rates might rise further. The Federal Reserve’s minutes from their July assembly will be pivotal in offering insights into their future rate direction. The varying narratives since the July meeting spotlight the Fed’s emphasis on data-driven decisions, as conveyed by Chief Jerome Powell.

Short-term Forecast

Given the current dynamics, gold seems bearish in the short term. Aided by the recent U.S. retail sales surge and the Fed’s ambiguity about rate hikes, investors might continue to favor yields over bullion.

Technical Analysis

4-Hour Gold (XAUUSD)Gold’s current 4-hour price at $1905.22 slightly surpasses the previous 4-hour price of $1904.03, indicating a marginal upward movement. The price is below both the 200-4H moving average of $1940.43 and the 50-4H moving average of $1921.02, suggesting a bearish trend. The 14-4H RSI stands at 37.50, indicating that the commodity is nearing oversold territory, hinting at potential buying interest soon.

While the current price is just above the main support area spanning from $1902.75 to $1893.07, it remains well below the main resistance area between $1946.99 to $1954.88. Collectively, the market sentiment appears bearish in the short term, but traders may attempt to consolidate inside the $1902.75 to $1893.07 support zone in an effort to relieve some of the downside pressure.

UK Inflation Inflation Rate Softens from 7.9% to 6.8% in July

UK Inflation Inflation Rate Softens from 7.9% to 6.8% in July

It was another busy morning on the UK economic calendar. The UK inflation report was in the spotlight. After the hotter-than-expected wage growth figures and UK GDP numbers, the CPI Report could have the final say on BoE monetary policy expectations.

The UK annual inflation rate softened from 7.9% to 6.8% in July. Consumer prices declined by 0.4% from June to July versus 0.1% in June. Economists forecast consumer prices to fall by 0.5% month-on-month and for an annual inflation rate of 6.8%. The UK annual inflation rate softened from 8.7% to 7.9% in June.

  • The consumer price index, including owner occupiers’ housing costs (CPIH), increased 6.4% in July year-over-year versus 7.3% in June.
  • Falling gas and electricity prices (Household and household services) were the largest downward contributors to the softer annual inflation rate, rising by 5.4% year-over-year compared with a 7.3% decline in June.
  • Importantly, food and non-alcoholic beverages also had a downward effect, with the CPIH monthly rate softening from 17.4% to 14.9%.
  • The Core CPIH (excluding energy, food, alcohol, and tobacco) rose 6.4% year-over-year, at the same rate as the June rate.

Today’s CPI Report should support less hawkish bets on peak interest rates but leave the BoE on track for further rate hikes, with inflation remaining elevated.

GBP to USD Reaction to UK Inflation Report

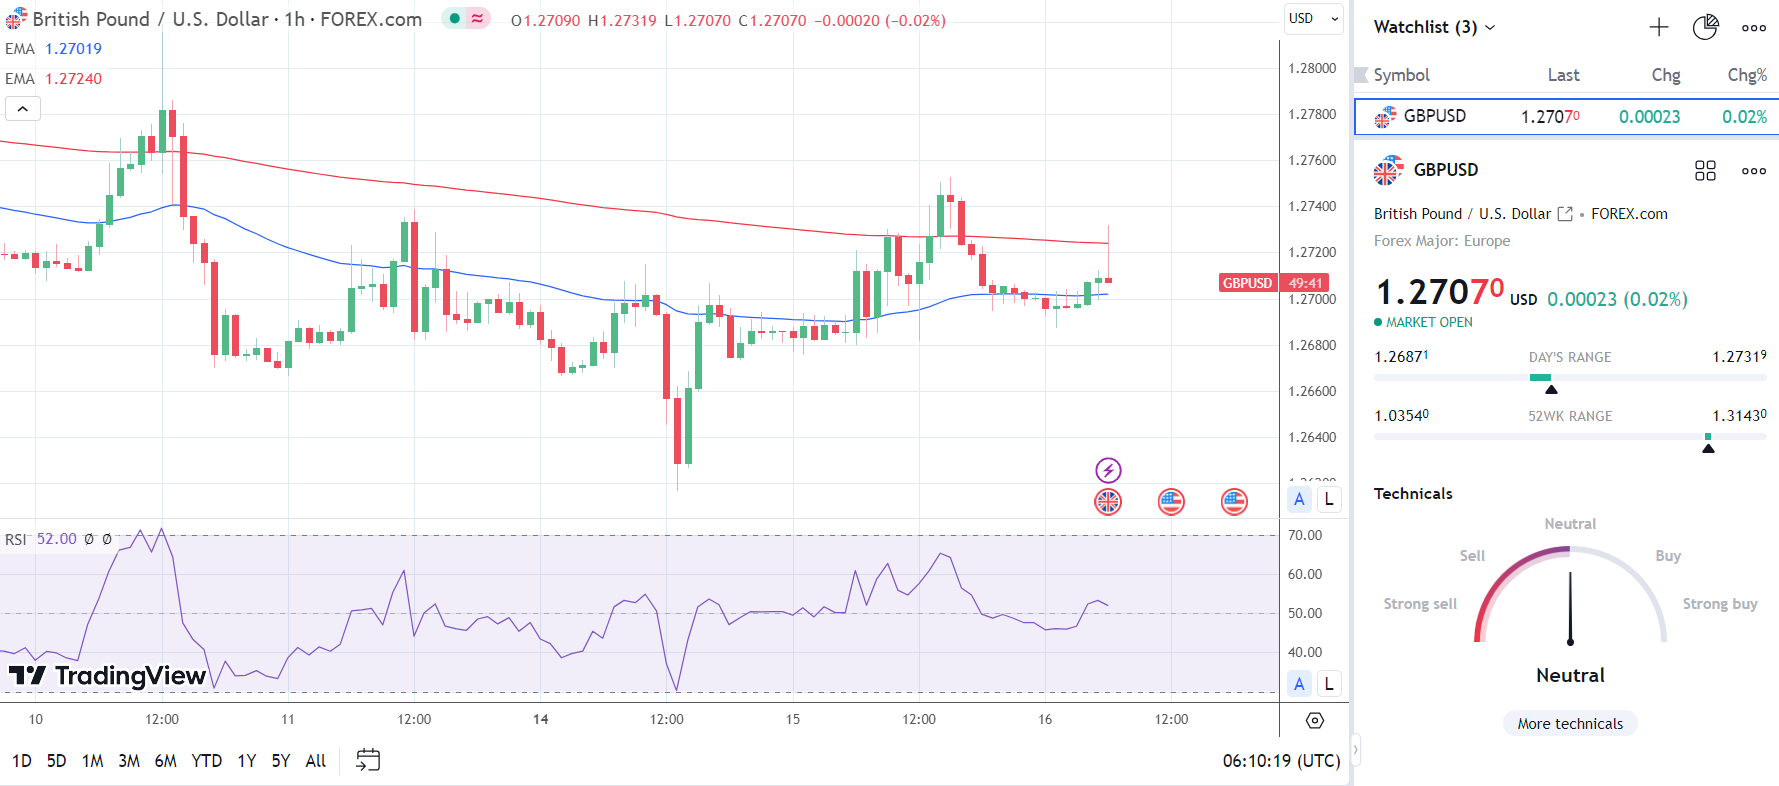
Ahead of the UK Inflation Report, the GBP to USD fell to an early low of $1.26871 before rising to a pre-stat high of $1.27123.

However, in response to the UK inflation report, the GBP to USD jumped to a high of $1.27319 before falling to a post-stat low of $1.27084.

This morning, the GBP to USD was up 0.02% to $1.27070.

GBP/USD responds to UK CPI Report
160823 GBPUSD Hourly Chart

Up Next

While the UK economic calendar was busy, no Bank of England Monetary Policy Committee Members are on the calendar to speak today, leaving chatter with the media to influence.

US housing sector data and industrial production figures for July will be in focus. While the housing sector is a litmus test for the US economy, industrial production numbers will garner interest.

Investors are looking for signs of a deviation from the soft-landing theory.

However, it is worth noting that the industrial production numbers are unlikely to influence the Fed. The manufacturing sector accounts for less than 30% of the US economy and is unlikely to dictate sentiment toward Fed monetary policy. In contrast, a marked deterioration in US housing sector conditions would raise eyebrows.

Later in the session, the FOMC meeting minutes will impact the GBP/USD. While the Fed raised rates by 25 basis points in July, Fed Chair Powell left the door ajar to further rate hikes. With recent economic indicators supporting further tightening, the minutes will reveal whether the Hawks or the Doves are in the driving seat.

Hawkish minutes will retest buyer appetite for the GBP/USD as economic indicators signal a hotter US economy.

Gold (XAU/USD) Flirts with $1900 Support as Fed Minutes Loom

Gold (XAU/USD) Flirts with $1900 Support as Fed Minutes Loom

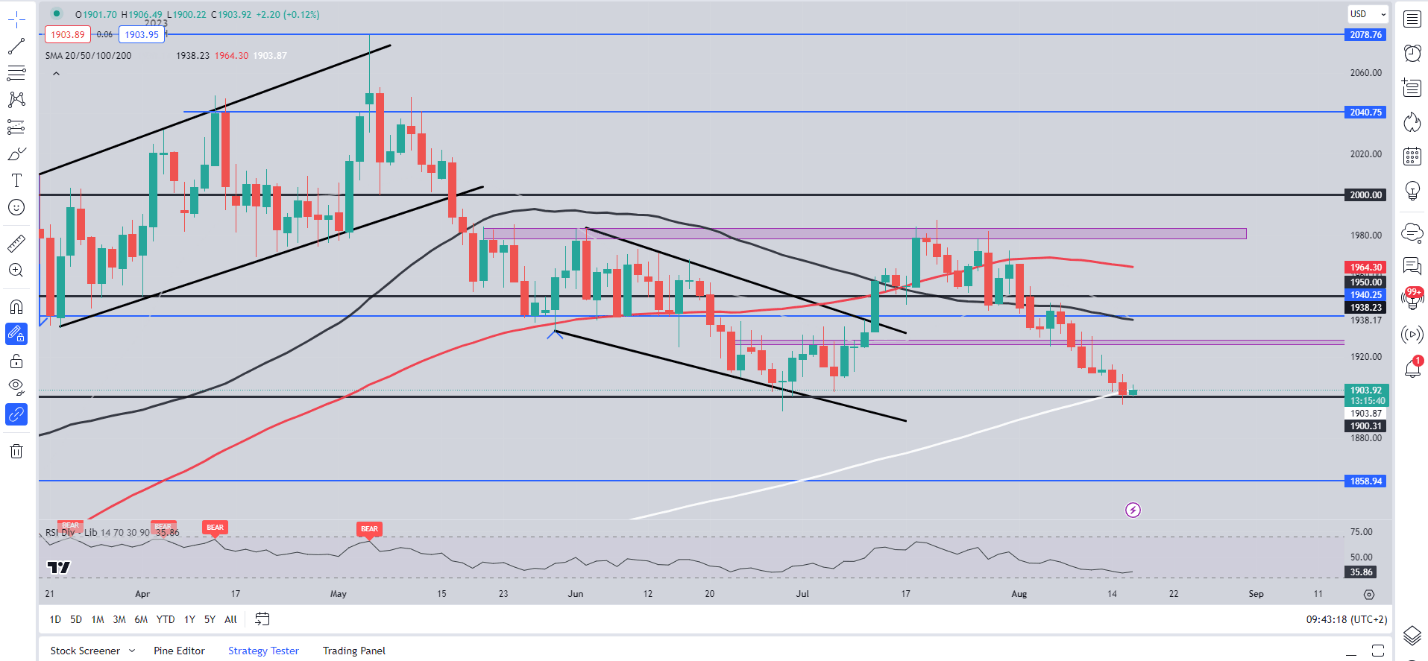
Gold prices continue to hover around the $1900 support handle following a brief push lower yesterday. Sellers were unable to maintain the momentum however, with the precious metal closing just above the $1900 mark but more importantly closing below the 200-day MA for the first time since December 2022.

DOLLAR INDEX AND FEDERAL RESERVE (FOMC) MINUTES

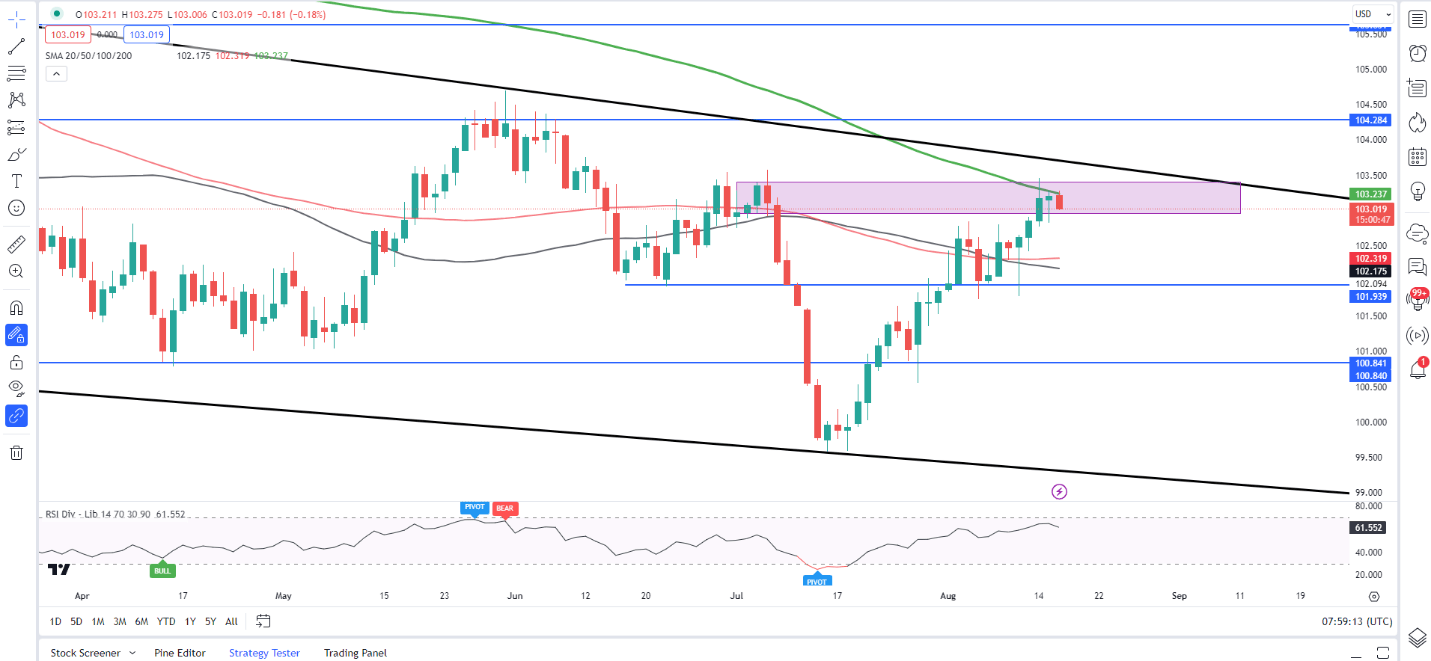
The Dollar Index which has had a huge say in Golds recent struggles finds itself at a key inflection point ahead of the Fed minutes later today. Upbeat retail sales data yesterday helped keep the Greenback supported just as it appeared to be on its way down from the confluence area around the 103.00 handle.

As global markets face renewed concerns around the economic recovery in China it is the Dollar which continues to attract the safe haven bids rather than Gold which is understandable given the current rates on offer.

The Dollar Index (DXY) remains at a key confluence around the 103.00 handle as it ran into the 200-day MA. I still think there is scope for Dollar downside after the Fed minutes with downside toward the 50 and 100-day MA. More uncertainty around China however, and a continued battle between risk-on and risk-off sentiment could see the Dollar remain supported due to its ongoing safe haven appeal with a break of the descending trendline coming into focus.

Dollar Index (DXY) Daily Chart – August 16, 2023

image1.png

Looking ahead to the rest of the day and we have quite a bit of data out of the US. I do not expect too much volatility from these events ahead of the FOMC meeting and we could be in for rangebound price action throughout the day as market participants reposition ahead of the Fed Minutes release.

TECHNICAL OUTLOOK AND FINAL THOUGHTS

Form a technical perspective, Gold prices have closed below the 200-day A on a daily timeframe for the first time since December 2022. This is a strong indication that the longer-term trend may be shifting as gold loses its shine with attractive yields also weighing on the precious metal.

Further downside definitely remains a possibility, however the RSI (14) is approaching overbought territory which s=means a short-term bounce may occur before the selloff continues. At this stage any bounce will need to a daily close above the $1925-$1930 (pink rectangle on the chart) for me to be convinced of a change in momentum.

Markets do appear to be largely driven by the fundamental and macro pictures at the moment and thus my initial thoughts are that any move will likely be dependent on the risk tone today as well as how market participants perceive the FOMC minutes later in the day.

Gold (XAU/USD) Daily Chart – August 16, 2023

A graph of stock market  Description automatically generated with medium confidence

Japanese Yen Losing Streak Showing Signs of Exhaustion, Will USD/JPY Cave?

Japanese Yen Losing Streak Showing Signs of Exhaustion, Will USD/JPY Cave?

The Japanese Yen continues to weaken against the US Dollar of late, but recent technical developments hint that perhaps the leg higher is showing signs of exhaustion. That said, even a mild pullback in USD/JPY will not be enough to overturn the current broader bullish technical bias. Still, let us take a closer look at the recent developments.

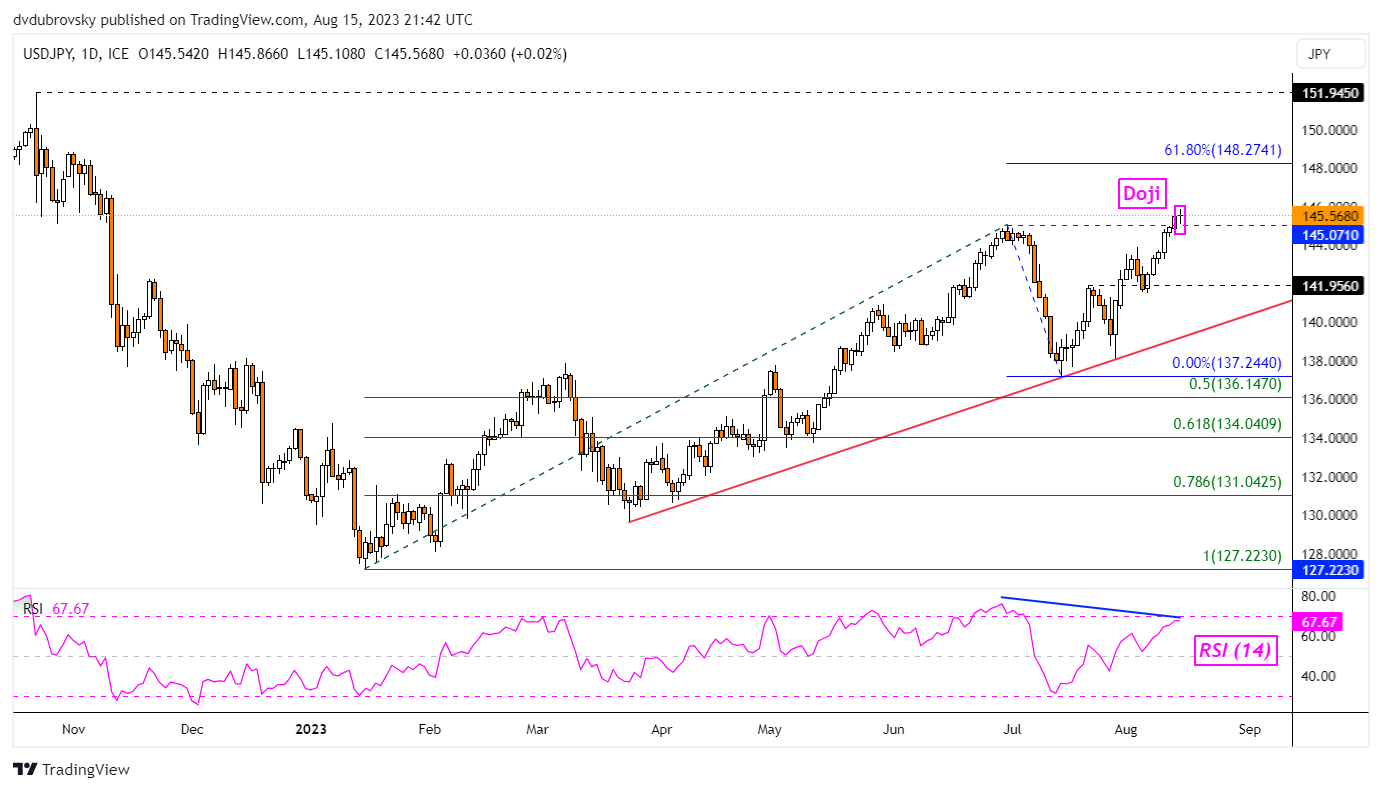
On the daily chart below, USD/JPY has left behind a Doji candlestick pattern. This is an early sign of indecision, especially within trending markets. Meanwhile, there is the presence of negative RSI divergence, a classic signal of fading upside momentum. This is as prices struggle to confirm a breakout above the June high of 145.07.

As such, there appears to be rising risk of a near-term reversal brewing. Still, a turn lower would place the focus on rising support from March which may reinstate the broader bullish bias. Otherwise, extending gains from here places the focus on the 61.8% Fibonacci extension level of 148.27.

image1.png

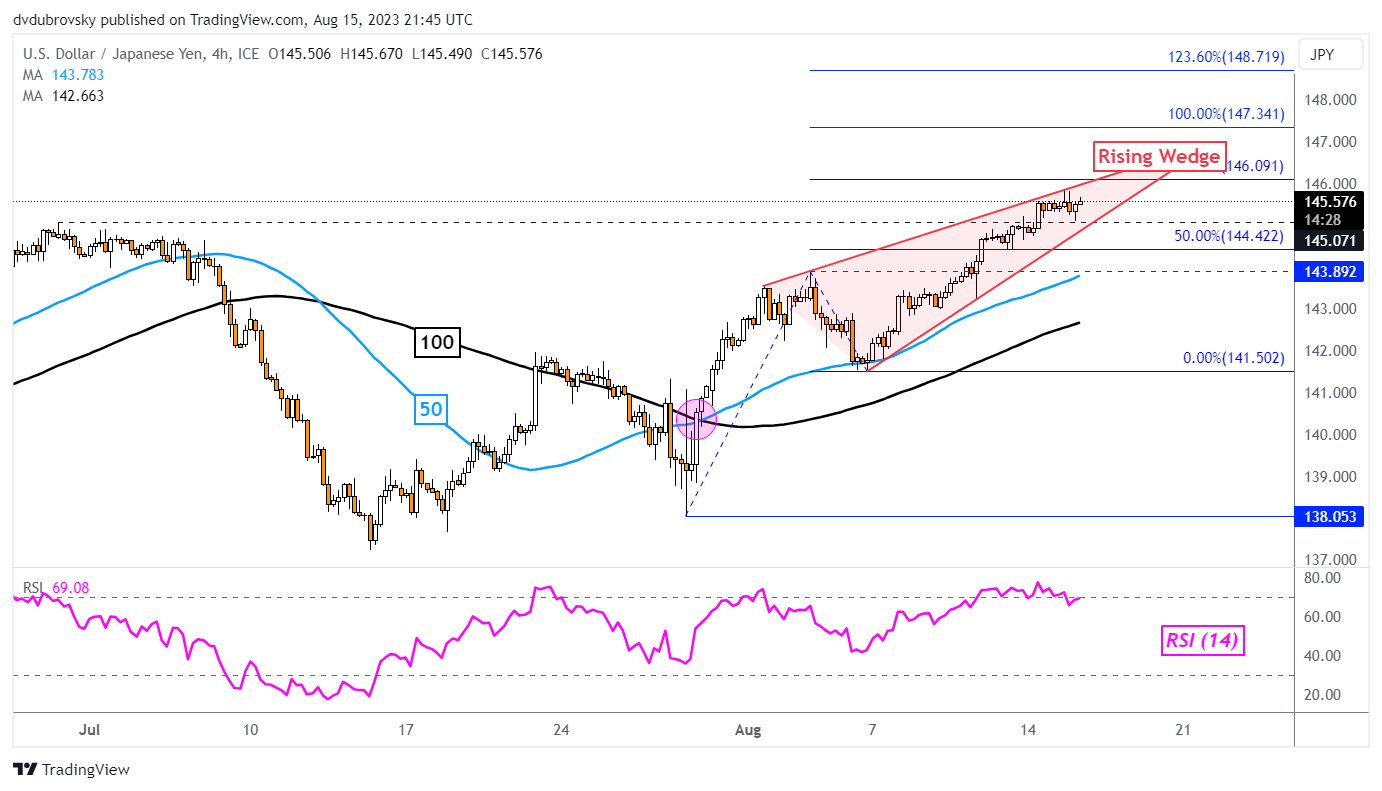
Zooming in on the 4-hour timeframe reveals further interesting technical developments. A bearish Rising Wedge chart formation appears to be brewing. While USD/JPY remains within the boundaries of this shape, the immediate technical bias is bullish. But, a breakout lower (coupled with the signals on the daily chart) could open the door to a near-term bearish reversal.

In this timeframe, in such an outcome, keep a close eye on the 50- and 100-period Moving Averages. A bullish Golden Cross formed in late July, extending the broader bullish bias. These lines could hold as support in the event of a turn lower.

As such, while there appear to be rising signs of exhaustion, it would take meaningful downside momentum to overturn the broader bullish technical bias.

image2.png