NASDAQ 100, Dow Jones, S&P 500 News: Earnings Drive US Stock Surge Amid Rate Hike Concerns

NASDAQ 100, Dow Jones, S&P 500 News: Earnings Drive US Stock Surge Amid Rate Hike Concerns

Overview

The major U.S. stock indices showcased an upward movement on the cash market opening Thursday, as investors disregarded  the Federal Reserve’s hints on possible future rate hikes. As the markets processed this information, certain key company earnings reports stood out, causing significant shifts in stock valuations.

By 14:33 GMT, the Dow Jones Industrial Average marked a rise of 0.28% at 34,864.04, followed by the S&P 500 Index at 0.30% increase, settling at 4,417.49. Nasdaq Composite also experienced a surge by 0.25%, hitting 13,508.25. Despite this positive trend, the market has seen some instability throughout August, with major indices diving into negative territory. This shift has forced valuations to retract from previously elevated levels.

Trading Derivatives carries a high level of risk to your capital and you should only trade with money you can afford to lose. Trading Derivatives may not be suitable for all investors, so please ensure that you fully understand the risks involved, and seek independent advice if necessary. A Product Disclosure Statement (PDS) can be obtained either from this website or on request from our offices and should be considered before entering into a transaction with us. Raw Spread accounts offer spreads from 0.0 pips with a commission charge of USD $3.50 per 100k traded. Standard account offer spreads from 1 pips with no additional commission charges. Spreads on CFD indices start at 0.4 points. The information on this site is not directed at residents in any country or jurisdiction where such distribution or use would be contrary to local law or regulation.

Key Earnings Highlights

Premarket trading was abuzz with Walmart’s promising financials as it reported surpassing earnings and revenue expectations for the fiscal second quarter. This retail behemoth also raised its yearly guidance, emphasizing a robust performance in grocery and online segments. Cisco Systems, a computer networking titan, observed a 2% growth due to its commendable quarterly earnings.

On the flip side, EV chip manufacturer, Wolfspeed, saw a sharp 17% decline, failing to meet bottom-line expectations. Meanwhile, investors are keenly awaiting earnings reports from Ross Stores, Applied Materials, and Keysight Technologies scheduled post-closing.

Economic Indicators and Corporate Shifts

Economic data, too, played its part. Jobless claims for the week concluding on August 12 were lower than the prior period, slightly undercutting Dow Jones’ forecast. Simultaneously, the Philadelphia Federal Reserve signaled a rise in its manufacturing index for August. The spotlight also caught the 10-year U.S. Treasury yield, soaring to its peak since October 2022 at 4.312%.

Short-Term Forecast

Given the mix of Federal Reserve’s stance, corporate earnings, and economic indicators, traders should anticipate short-term volatility. While positive earnings boost the market sentiment, looming concerns over rate hikes and inflation could keep traders on their toes. The market’s trajectory, in essence, appears cautiously bullish, but investors are advised to keep an eye on the upcoming earnings announcements and Federal Reserve’s future moves.


EIA Storage Data Meets Analyst Estimates

EIA Storage Data Meets Analyst Estimates

On August 17, EIA released the Weekly Natural Gas Storage report. The report indicated that working gas in storage increased by 35 Bcf from the previous week.

Analysts expected that working gas in storage would grow by 34 Bcf, so the report was mostly in line with analyst estimates.

At current levels, stocks are 549 Bcf higher than last year at this time and 299 Bcf above the five-year average of 2,766 Bcf.

The current demand for natural gas remains high. Hot weather is expected for August 20 – August 25 but the end of the month may be cooler, which is somewhat bearish for natural gas prices.

Natural gas prices did not show a strong reaction to the EIA report, which is not surprising as the report has mostly met analyst estimates. From the technical point of view, natural gas is trying to rebound after the recent sell-off, which was triggered by the bearish changes in weather forecasts.

The developments in global LNG markets may provide psychological support to U.S. natural gas markets as traders focus on the risks related to Australia LNG exports, which could be impacted by the potential strike shutdowns.

The price of natural gas remains near the important $2.65 level after the release of the EIA data. In case natural gas manages to settle above $2.65, it will have a good chance to gain additional upside momentum and move towards the resistance in the $2.80 – $2.85 area.

Gold Price Forecast – Gold Markets Bounced From the 200-Day EMA

Gold Price Forecast – Gold Markets Bounced From the 200-Day EMA

Gold Market Technical Analysis

Gold markets have rallied a bit during the trading session on Thursday, bouncing from the 200-Day EMA. Now that we are starting to show signs of life, the question is whether or not we can continue to go higher? The 50-Day EMA has a potential to be a significant resistance barrier, which is about $40 above where we are. We can break above there, then the market is likely to continue to go toward the $2000 level, which of course is a large, round, psychologically significant figure.

Trading Derivatives carries a high level of risk to your capital and you should only trade with money you can afford to lose. Trading Derivatives may not be suitable for all investors, so please ensure that you fully understand the risks involved, and seek independent advice if necessary. A Product Disclosure Statement (PDS) can be obtained either from this website or on request from our offices and should be considered before entering into a transaction with us. Raw Spread accounts offer spreads from 0.0 pips with a commission charge of USD $3.50 per 100k traded. Standard account offer spreads from 1 pips with no additional commission charges. Spreads on CFD indices start at 0.4 points. The information on this site is not directed at residents in any country or jurisdiction where such distribution or use would be contrary to local law or regulation.

Underneath, if we do break down below the $1900 level, it’s likely that the market is going to continue to drop down to the $1800 level. All things being equal, this is a market that I think continues to see a lot of volatility, and of course it will have the US dollar to think about at the same time. After all, the market is likely to continue to see a lot of questions asked about the Federal Reserve, and I do think that there’s a certain amount of safety when you look at the gold market, and therefore you can see this as a situation where we may have a strong negative correlation to the US dollar sometimes, but at the same time you have to ask whether or not there will be demand for safety.

At the same time, you also have to keep in mind that the market is highly sensitive to interest rates as well, and they are somewhat elevated in the United States. After all, it’s cheaper to own bonds than it is to pay storage for gold. On the other hand, if the market were to break down below that $1900 level, it could drop rather significantly, dropping all the way down to the $1800 level and probably rather quickly. In general, I think this is a scenario where you will continue to see a lot of volatility so make sure the keep your position size reasonable, as the moves could be rather rapid, and therefore you could rack up pretty big losses in this very choppy overall market.

Initial Jobless Claims Fall Slightly More than Expected;

Initial Jobless Claims Fall Slightly More than Expected;

Week Ending August 12 Overview

In a recent update, initial jobless claims for the week concluding on August 12 totaled 239,000, marking a decrease of 11,000 from the previous week. This is an improvement even though the previous week’s figures underwent an upward revision, moving from 248,000 to 250,000.

Insights from the 4-week Moving Average

The more stable 4-week moving average amounted to 234,250, indicating a slight uptick of 2,750. For context, the preceding week’s average was adjusted upward by 500, landing at 231,500 from the initial 231,000.

Insured Unemployment Figures

For the week ending August 5, the rate of advance seasonally adjusted insured unemployment was pegged at 1.2 percent, experiencing a 0.1 percentage point rise. This metric translates to 1,716,000 insured unemployed individuals, which is up by 32,000 from the prior week’s static figure of 1,684,000. Yet, when we look at the broader 4-week moving average for insured unemployment, there was a decrease by 8,250, positioning the total at 1,692,750.

Comparative Analysis with 2022

Drawing a year-over-year comparison, the total number of continuous benefit claims for all programs during the week ending July 29 was 1,834,497. This number represents a decline of 17,663 from the immediate previous week, but it’s notably higher than the 1,481,402 claims reported in the analogous week of 2022.

Philly Fed Manufacturing Survey Expands

Manufacturing activity in August saw a revival, with positive indicators for general activity, new orders, and shipments — the first such uptick since May 2022. The diffusion index for general activity rebounded to 12.0 from -13.5 the previous month, with 25% of firms reporting increases. New orders, previously negative for 14 months, jumped to 16.0. However, employment declined, with the employment index at -6.0. Although the price indexes hovered near long-run averages, the optimism for growth in the upcoming six months waned, signaling cautious industry expectations.

US Dollar Index News: DXY Hits Multi-Month High Amid Fed Rate Hike Tensions

US Dollar Index News: DXY Hits Multi-Month High Amid Fed Rate Hike Tensions

U.S. Dollar Strong Amid Interest Rate and Inflation Dynamics

The U.S. dollar demonstrated its strength, reaching a peak of 103.495 on Thursday, only to pull back later in the day. Driving this volatility were mixed U.S. Treasury yields and fresh insights from the latest Federal Reserve minutes that have ignited discussions about inflation and the future trajectory of interest rates.

Resilient U.S. Economy Poses Challenge for Interest Rates

Although the consensus in the money market tilts towards the Federal Reserve maintaining rates in September, buoyant U.S. economic indicators are making a strong case for continued restrictive interest rates. Data from Wednesday highlighted a surge in U.S. single-family homebuilding and a rebound in factory production in July. This resilience, despite the weight of high interest rates, indicates the robustness of the U.S. economic machinery.

Trading Derivatives carries a high level of risk to your capital and you should only trade with money you can afford to lose. Trading Derivatives may not be suitable for all investors, so please ensure that you fully understand the risks involved, and seek independent advice if necessary. A Product Disclosure Statement (PDS) can be obtained either from this website or on request from our offices and should be considered before entering into a transaction with us. Raw Spread accounts offer spreads from 0.0 pips with a commission charge of USD $3.50 per 100k traded. Standard account offer spreads from 1 pips with no additional commission charges. Spreads on CFD indices start at 0.4 points. The information on this site is not directed at residents in any country or jurisdiction where such distribution or use would be contrary to local law or regulation.

Federal Reserve’s Position on Inflation

Minutes from the Federal Reserve’s July meeting revealed concerns about inflation. Policymakers acknowledged its persistence above the 2% target but also recognized signs of easing price pressures. However, the sentiment leaned towards patience, indicating a potential for more interest rate hikes in the future. It’s clear that the battle against inflation isn’t over yet, with the Fed emphasizing the need to “win that last mile.”

The U.S.-Japan Rate Differentials Strain the Yen

On the global stage, the rate differentials between the U.S. and Japan have put significant pressure on the yen, driving it to its lowest levels since November. This devaluation has raised concerns about potential intervention by Japanese authorities, reminiscent of their actions last year to support their currency.

Short-Term Outlook: Bullish for the Dollar

The resilient U.S. economy, coupled with the Federal Reserve’s cautious stance on inflation, paints a bullish picture for the dollar in the near term. Meanwhile, the yen is poised for challenges given the prevailing U.S.-Japan interest rate dynamics. Eyes will also be on the UK as it grapples with inflation and potential economic slowdown.

Technical Analysis

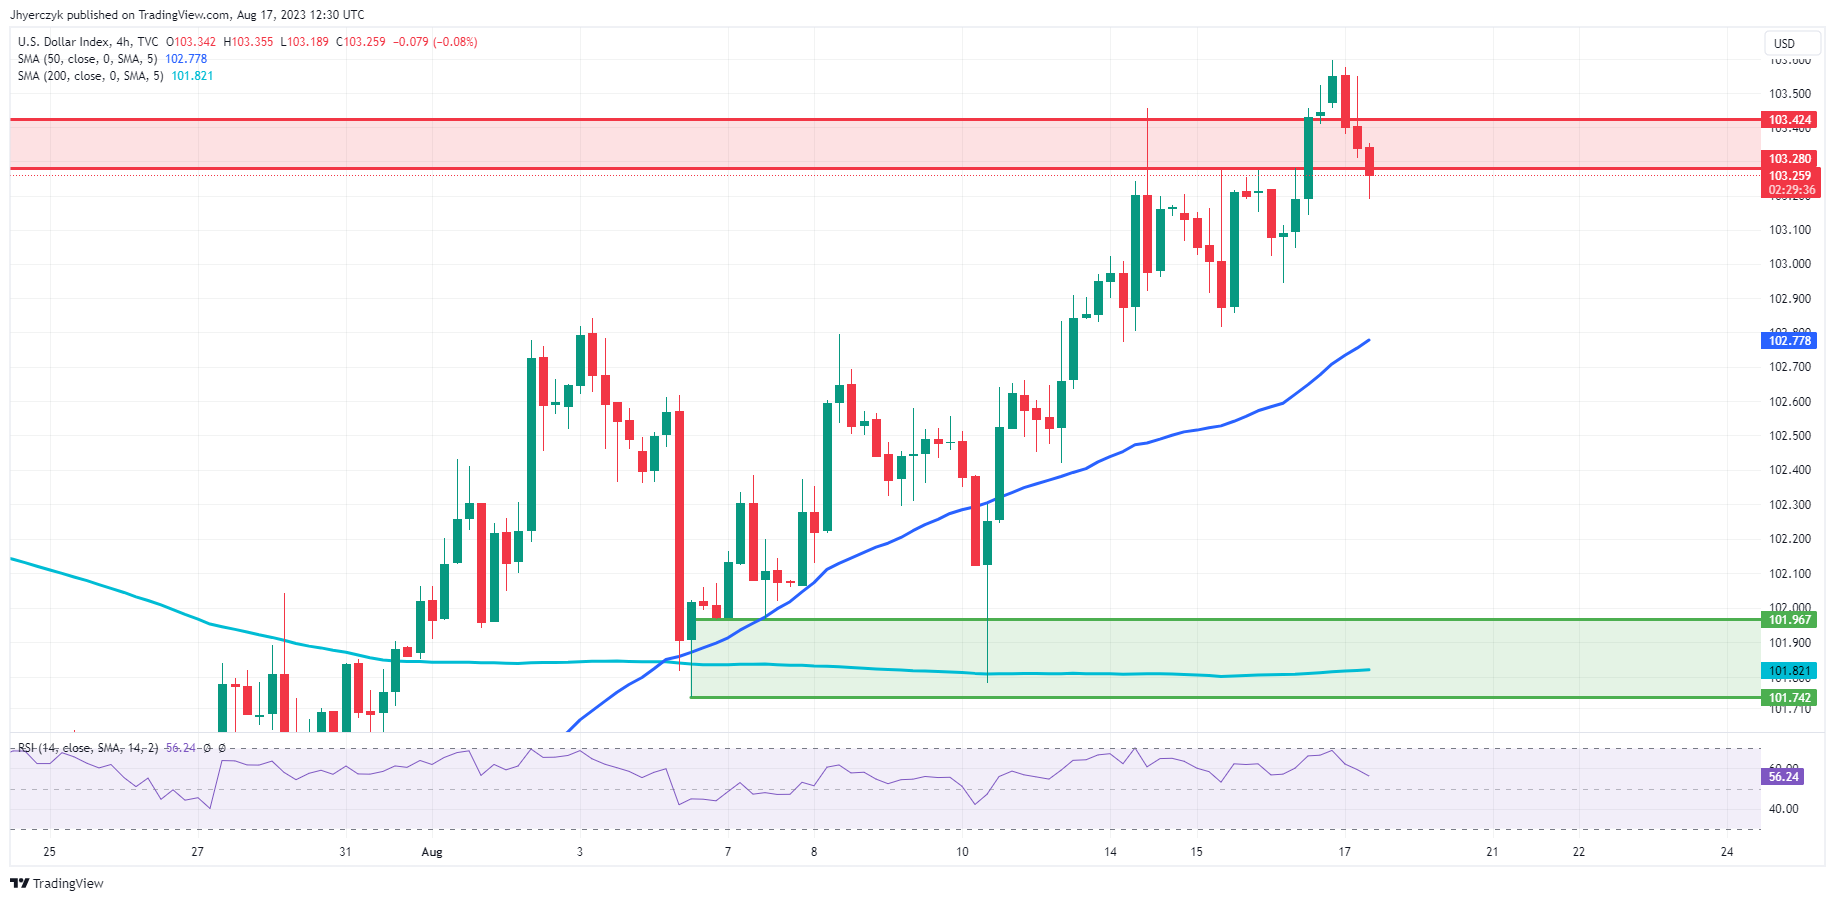
4-Hour US Dollar Index (DXY)The DXY’s current 4-hour price is marginally below its preceding 4-hour level, indicating a slight bearish sentiment in the short term. However, diving deeper into the moving averages, the DXY is positioned above both the 200-4H moving average of 101.821 and the 50-4H moving average of 102.777. This establishes a clear bullish trend in the mid to long term. The 14-4H RSI at 55.29, being above the neutral 50 mark, supports this bullish sentiment, showing a slightly enhanced momentum.

Moreover, with the DXY’s price nearing the main resistance zone of 103.280 to 103.424, there’s potential resistance ahead. Still, the overarching trend based on the given indicators points to a bullish sentiment for DXY.

XRP Adoption Expands: BitPay Goes Global With XRP Support

XRP Adoption Expands: BitPay Goes Global With XRP Support

a leading crypto payments service, announced earlier this month global support for Ripple’s XRP (XRP) token, marking a significant step toward widespread adoption of the fifth largest cryptocurrency by market capitalization. Users of BitPay’s services worldwide will now be able to seamlessly utilize XRP for purchases, buying gift cards, and swapping the digital asset. This will allow BitPay customers to leverage XRP’s ecosystem, offering a versatile and efficient payment method for processing and managing transactions.

Trading Derivatives carries a high level of risk to your capital and you should only trade with money you can afford to lose. Trading Derivatives may not be suitable for all investors, so please ensure that you fully understand the risks involved, and seek independent advice if necessary. A Product Disclosure Statement (PDS) can be obtained either from this website or on request from our offices and should be considered before entering into a transaction with us. Raw Spread accounts offer spreads from 0.0 pips with a commission charge of USD $3.50 per 100k traded. Standard account offer spreads from 1 pips with no additional commission charges. Spreads on CFD indices start at 0.4 points. The information on this site is not directed at residents in any country or jurisdiction where such distribution or use would be contrary to local law or regulation.

The move follows a favorable legal outcome last month between Ripple and the U.S. Securities and Exchange Commission (SEC), in which a New York judge ruled that XRP had not violated federal securities law by selling its XRP token on public exchanges and said that that the token was “not necessarily a security on its face.” However, the judge held that Ripple violated federal securities law by selling XRP directly to sophisticated investors.

XRP Adoption Accelerating

The payments provider joins over thirty other leading merchants in accepting XRP. Several other well-known names utilizing the token include AMC Theatres, Hublot, PacSun, CryptoTurismo, and the German precious metals dealer Auragentum. BitPay noted that XRP holders can use any compatible wallet for transactions through BitPay. However, the payments provider recommends opting for established XRP wallets to ensure a smooth payment experience. Smaller niche wallets might be prone to payment errors, potentially disrupting transaction processes, it cautioned.

BitPay’s support for XRP further accelerates the token’s adoption and utility, opening up new avenues for other leading cryptocurrencies, such as Bitcoin (BTC) and Ethereum (ETH) to increase their market share in global digital payments. Below, we take a closer look at the charts of all three cryptocurrencies.

Technical Analysis:  XRP, Bitcoin and Ethereum

XRP

XRP’s price trades toward the lower section of a falling wedge after encountering resistance from the pattern’s top trendline and 50 SMA. Additionally, the relative strength index (RSI) indicator sits near oversold levels, suggesting short-term bearish sentiment. However, a breakout above the triangle’s upper trendline could reignite bullish momentum and see bulls test overhead resistance at around the $0.72 level. Conversely, further selling could see a retest of longer-term support at $0.54.

Chart depicting the price of XRP.

Bitcoin

The king’s price has continued to weaken during Thursday’s Asian session, breaking down beneath the lower trending of a descending triangle. Additionally, the sell-off has occurred on lackluster volume, with the RSI now flashing a deep oversold reading. These indicators suggest that bears may be reaching a point of exhaustion. Ongoing selling could see a decline to major support around $28,000. Alternatively, a sudden upside reversal could trigger a short squeeze and test of crucial overhead resistance just above $31,000.

Chart depicting the price of BTC.

Ethereum

Like Bitcoin, Ethereum’s price has also broken down from a multi-week descending triangle on thin volumes. Moreover, an RSI reading below 25 indicates the intensity of the sell-odd but also increases the probability of a short-term upside retracement. A breakout back above the triangle pattern’s trendline could spark a rally to a key resistance trendline at $1,915. Alternatively, more selling pressure from the bears could lead a decline to major support at $1,755.

Chart depicting the price of ETH.
NASDAQ 100, Dow Jones, S&P 500 News: Walmart Beats Expectations, Boosts Forecast as Online Sales Skyrocket

NASDAQ 100, Dow Jones, S&P 500 News: Walmart Beats Expectations, Boosts Forecast as Online Sales Skyrocket

Overview

U.S. stock futures are edging higher shortly before the cash market opening on Thursday, influenced by the Federal Reserve’s hint at potential rate hikes.

At 11:00 GMT, Dow Jones futures show a 0.19% increase, S&P 500 futures climb 0.16%, and Nasdaq-100 futures gain 0.13%. After consecutive losses, S&P 500 dropped 0.76%, Dow fell 0.52%, and Nasdaq slipped 1.15%.

Trading Derivatives carries a high level of risk to your capital and you should only trade with money you can afford to lose. Trading Derivatives may not be suitable for all investors, so please ensure that you fully understand the risks involved, and seek independent advice if necessary. A Product Disclosure Statement (PDS) can be obtained either from this website or on request from our offices and should be considered before entering into a transaction with us. Raw Spread accounts offer spreads from 0.0 pips with a commission charge of USD $3.50 per 100k traded. Standard account offer spreads from 1 pips with no additional commission charges. Spreads on CFD indices start at 0.4 points. The information on this site is not directed at residents in any country or jurisdiction where such distribution or use would be contrary to local law or regulation.

Investor sentiment is being shaped by the Federal Reserve’s outlook on future rate hikes, which continues to impact market dynamics. This recent market reaction reflects the cautious stance of traders as they weigh the potential implications of changes in monetary policy.

Walmart Surpasses Estimates

Walmart, the retail giant, exceeded expectations by relying on its reputation for affordability to attract grocery shoppers and boost online spending. The company’s earnings report showed it outperformed Wall Street predictions for both sales and profits. Notably, Walmart U.S. experienced a 24% surge in e-commerce sales, underscoring the growing importance of its online presence.

The company’s positive performance prompted an upward revision of its full-year forecast. Walmart now anticipates consolidated net sales for the fiscal year to rise between 4% and 4.5%. Adjusted earnings per share are projected to range from $6.36 to $6.46, compared to the previous guidance of $6.10 to $6.20. This optimistic outlook is rooted in the retailer’s ability to capture consumer interest across various segments.

Daily Walmart IncChief Financial Officer John David Rainey noted a “modest improvement” in the quarter, particularly in sales of higher-priced and discretionary items such as electronics and home goods. These categories had faced challenges over the past year due to increased spending on essential items like food. Rainey emphasized that consumers are becoming more discerning in their choices, with key seasonal events like the Fourth of July and back-to-school promotions contributing to the sales boost.

Walmart’s quarterly performance surpassed analysts’ estimates by a significant margin. Adjusted earnings per share stood at $1.84, beating expectations of $1.71, while revenue reached $161.63 billion compared to the anticipated $160.27 billion. Notably, the company’s net income for the quarter soared by approximately 33%, reaching $7.89 billion, or $2.92 per share, in contrast to the previous year’s $5.15 billion, or $1.88 per share.

Driving this success, Walmart U.S. reported a remarkable 6.4% increase in same-store sales during the second quarter, excluding fuel sales, as compared to the same period last year. This robust performance indicates the company’s ability to navigate evolving consumer preferences and market dynamics effectively. As the retailer continues to showcase resilience and growth, the immediate outlook for Walmart appears bullish.

Bears Get the Upper Hand in Crypto

Bears Get the Upper Hand in Crypto

Bitcoin’s Morning Slide: Testing Key Support Levels After Dropping to $28.3K

Crypto market capitalisation fell a further 1.6% overnight to 1,137 trillion. A brief dip in the morning to 1,113 took the market to its lowest level in almost two months. Bitcoin is down 1.7%, Ethereum is down 1.2%, with the top altcoins losing between 0.8% (Cardano) and 7% (Bitcoin Cash).

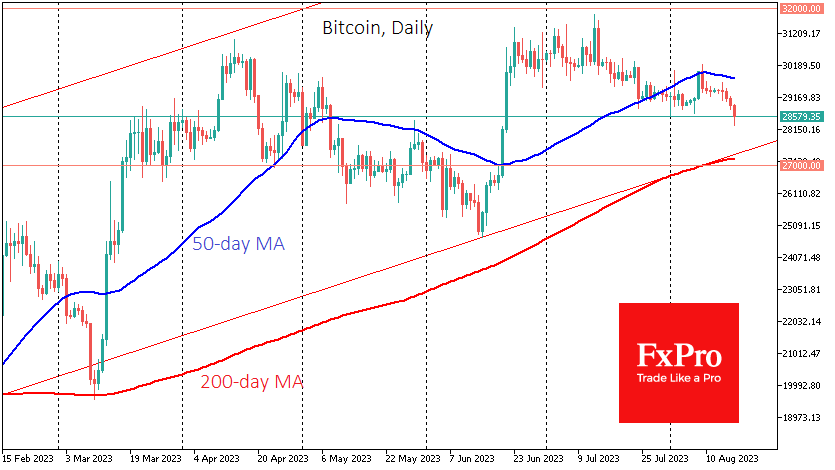
Bitcoin daily chartBitcoin slipped to $28.3K in light trading early Thursday morning before stabilising at $28.6K. The fall below $28.8K confirmed the local dominance of the bears. The following key support points are now at the next round level of $28K and then at the $27.2K area, where the 200-day moving average and uptrend support from last November are centred.

Trading Derivatives carries a high level of risk to your capital and you should only trade with money you can afford to lose. Trading Derivatives may not be suitable for all investors, so please ensure that you fully understand the risks involved, and seek independent advice if necessary. A Product Disclosure Statement (PDS) can be obtained either from this website or on request from our offices and should be considered before entering into a transaction with us. Raw Spread accounts offer spreads from 0.0 pips with a commission charge of USD $3.50 per 100k traded. Standard account offer spreads from 1 pips with no additional commission charges. Spreads on CFD indices start at 0.4 points. The information on this site is not directed at residents in any country or jurisdiction where such distribution or use would be contrary to local law or regulation.

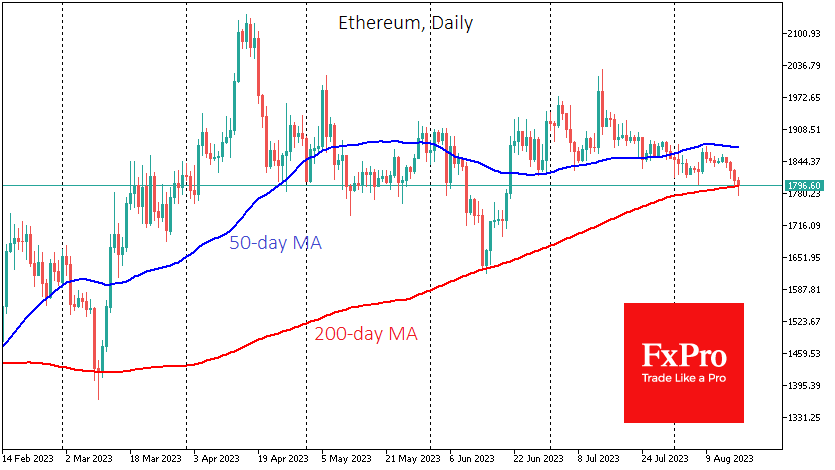
Ethereum daily chartEthereum pulled back below $1800 and tested its 200-day moving average. It bounced steadily from this level in March and June. Given the bearish sentiment in global markets and rising government bond yields, the chances of a drop to the previous lows of $1630 are increasing.

Crypto News

The new SEI crypto token surpassed $1.6 billion in trading volume overnight. The token beat major crypto assets such as XRP, BNB and Dogecoin (DOGE) in turnover. The SEI launched its Sei Network blockchain project on Tuesday. The developers are positioning it as a network for high-frequency trading applications with high transaction processing speeds.

Tron co-founder Justin Sun described himself as a “Bitcoin supporter” and said he owns more than 100,000 BTC.

According to an agency report, the Federal Bureau of Investigation seized $1.7 million in various digital assets between March and May 2023.

Coinbase Exchange received a CFTC’s Futures Commission Merchant licence allowing crypto-based futures trading access to select US customers.

Observers noticed the movement of 1,005 BTC from the sleeping 13-year-old wallet, and some cryptocurrency community members even thought Satoshi Nakamoto had moved the coins.

Oil Prices Forecast: China’s Slowdown, US Rates Shape Bearish Outlook

Oil Prices Forecast: China’s Slowdown, US Rates Shape Bearish Outlook

Overview

Oil prices are trading lower, continuing their volatile down slide, driven by a series of concerns that have cast a shadow over the market. Over the past three sessions, prices have faced declines amidst apprehensions surrounding China’s economic growth slowdown and potential U.S. interest rate hikes. These factors have raised alarms about weakening fuel demand in the world’s two largest economies.

A combination of factors has intensified the bearish undertone in the oil markets. Notably, China’s economic troubles and the broader risk-off sentiment on Wall Street have taken their toll. Concurrently, the strength of the U.S. dollar has further exacerbated the downward pressure on oil prices.

Trading Derivatives carries a high level of risk to your capital and you should only trade with money you can afford to lose. Trading Derivatives may not be suitable for all investors, so please ensure that you fully understand the risks involved, and seek independent advice if necessary. A Product Disclosure Statement (PDS) can be obtained either from this website or on request from our offices and should be considered before entering into a transaction with us. Raw Spread accounts offer spreads from 0.0 pips with a commission charge of USD $3.50 per 100k traded. Standard account offer spreads from 1 pips with no additional commission charges. Spreads on CFD indices start at 0.4 points. The information on this site is not directed at residents in any country or jurisdiction where such distribution or use would be contrary to local law or regulation.

Market participants are closely monitoring several key elements that could sway the oil landscape. These include Chinese economic indicators, government policy maneuvers, and U.S. oil inventory data. The latter is especially significant, as American oil producers might capitalize on production cuts by the OPEC+ alliance by ramping up their output to capture a larger market share.

Troubles in China’s property sector have fueled concerns about the economy’s vitality. Missed payments on investment products by a prominent Chinese trust firm and a dip in home prices have exacerbated worries about the country’s deepening property crisis and its potential to stifle economic momentum. Even China’s central bank, which unexpectedly slashed key policy rates for the second time in three months, faces skepticism about its ability to reverse the economic decline.

Meanwhile, U.S. crude oil inventories have undergone fluctuations. Despite a fall last week due to increased refinery runs and surging exports, crude production hit its highest level since the pandemic-induced fuel consumption decline. Refinery crude runs surged to their highest levels since January 2020, showcasing the struggle to meet domestic and global demand. Additionally, a surge in U.S. oil exports has significantly contributed to the depletion of stockpiles.

The situation in the oil market remains intricate. The production surge, despite a recent drop in the rig count, points to the industry’s resilience. However, the uncertainty stemming from the U.S. Federal Reserve’s stance on interest rates adds another layer of complexity. Minutes from their July meeting suggest a willingness to prioritize the battle against inflation over pausing rate hikes, a decision that could have profound implications for economic growth and, by extension, oil demand.

As oil prices continue to grapple with a litany of challenges, including China’s economic slowdown, potential U.S. interest rate hikes, and broader economic uncertainties, the sentiment in the market remains bearish. These collective concerns cast a cloud over the outlook for oil, prompting caution among traders and investors alike.

Technical Analysis

4-Hour Crude OilThe Crude Oil market displays a bearish sentiment as the 4-hour price of 79.13 is below the 200-4H moving average at 77.90 and the 50-4H moving average at 82.27. The 14-4H RSI of 29.94 indicates an oversold condition, suggesting weaker momentum.

Main support ranges from 79.05 to 78.29, with a main resistance zone of 81.73 to 83.63. Presently, the market remains bearish, as the current price aligns below both moving averages and the RSI signifies oversold conditions. Support and resistance areas further affirm this assessment.

Dax Index: Fed Minutes Stir, As Asian Woes Weigh on DAX

Dax Index: Fed Minutes Stir, As Asian Woes Weigh on DAX

Wednesday’s Session Overview

It was a bullish Wednesday for the DAX. Partially reversing a 0.86% loss from Tuesday, the DAX gained 0.14% on Wednesday to end the day at 15,790.

Economic indicators from the euro area distracted investors from the gloomy mood across the Asian markets.

Trading Derivatives carries a high level of risk to your capital and you should only trade with money you can afford to lose. Trading Derivatives may not be suitable for all investors, so please ensure that you fully understand the risks involved, and seek independent advice if necessary. A Product Disclosure Statement (PDS) can be obtained either from this website or on request from our offices and should be considered before entering into a transaction with us. Raw Spread accounts offer spreads from 0.0 pips with a commission charge of USD $3.50 per 100k traded. Standard account offer spreads from 1 pips with no additional commission charges. Spreads on CFD indices start at 0.4 points. The information on this site is not directed at residents in any country or jurisdiction where such distribution or use would be contrary to local law or regulation.

The Eurozone economy expanded by 0.3% in the second quarter after stalling in the first quarter. Year-over-year, the economy grew by 0.6% versus 1.1% in the first quarter, confirming the first estimates.

Industrial production numbers for June provided relief, rising by 0.5% versus forecasts of a 0.1% decline. In May, industrial production increased by 0.2%.

Later in the day, US industrial production figures also beat forecasts. US industrial production increased by 1.0% in July, reversing a 0.8% decline from June. Economists forecast a 0.3% gain.

However, the stats weren’t good enough for the US markets, which reacted to the post-European closing bell FOMC meeting minutes.

On Wednesday, the NASDAQ Composite fell by 1.15%. It was also a bearish session for the Dow and the S&P 500, which saw losses of 0.52% and 0.76%, respectively.

Daily Chat sends mixed price signals.

Wednesday’s Market Movers

It was a mixed session for the auto sector. Mercedes-Benz Group and BMW bucked a bearish trend, gaining 0.22% and 0.55%. However, Porsche fell by 0.64%, with Continental AG and Volkswagen ending the day with losses of 0.54% and 0.55%, respectively. Demand concerns remained a drag on the broader auto sector.

It was also a mixed session for the banks. Commerzbank rose by 0.20%, while Deutsche Bank fell by 0.53%. Fitch warnings of a suite of US bank rating downgrades, including JPMorgan (JPM), continued to weigh on bank stocks.

The Day Ahead for the DAX

Today, the Eurozone economy remains in the spotlight this morning. Eurozone trade data for July will draw interest amidst the weak global demand environment and China’s economic woes.

Economists forecast the Eurozone trade balance to rise from a €0.3 billion deficit to a €18.3 billion surplus. The devil will be the details, with a fall in exports being a bearish price scenario.

However, another bearish Asian session will influence investor sentiment. The Asian markets continued to respond to worsening economic indicators from China. The overnight FOMC meeting minutes added to the bearish mood and will move the DAX.

The FOMC Meeting Minutes highlight a divided Committee on the need for further rate hikes. Significantly, the focus remained on inflation rather than the macroeconomic backdrop, leaving rate hikes and a hard landing on the table.

Late in the European session, US economic indicators will also move the dial. Philly Fed Manufacturing Index numbers and US jobless claims will also provide direction. A fall in jobless claims would question the theory of a softer US labor market and support hawkish Fed bets.

We expect the jobless claims to trump the Philly Fed Manufacturing data.

DAX Technical Indicators

Looking at the EMAs and the 4-hourly chart, the EMAs sent bearish signals. The DAX sat below the 50-day and 200-day EMAs, sending bearish near and longer-term price signals. Significantly, the 50-day EMA converged on the 200-day EMA. A bearish cross would give the bears a run at the 15,600 – 15,525 support band.

The 14-4H RSI sits at 42.52, reflecting bearish sentiment, with selling pressure overweighing buying pressure. Significantly, the RSI aligns with the EMAs, supporting a return to 15,700 to target the 15,600 – 15,525 support band.

DAX 4-Hourly Chart affirms bearish near-term price signals.