S&P 500 Below 50-day MA, VIX up 11% as Market Caution Persists: S&P 500, NZD/USD, GBP/USD

S&P 500 Below 50-day MA, VIX up 11% as Market Caution Persists: S&P 500, NZD/USD, GBP/USD

The pull-ahead in US retail sales yesterday provided some validation for soft landing hopes but also left room for rates to be kept high for longer, with market sentiments seemingly placing their focus on the latter. The July retail sales figure increased 3.2% from the previous year, far outpacing the 1.5% forecast. Month-on-month, retail sales were up 0.7% versus the 0.4% consensus, reflecting the prevailing resilience in US consumer demand.

That said, market participants took the chance to de-risk further, sending all three major US indices lower by more than 1%. The VIX jumped 11% as a sign of increased market caution, especially with real-time inflation estimates suggesting that headline inflation is likely to pull further ahead in August. Moves in US Treasury yields were more measured overnight, with the 10-year yields defending its 4.20% level, while the US dollar index continues to challenge its 200-day moving average (MA).

The S&P 500 is down 1.2% overnight, bringing the index back below its key 50-day MA for the first time since March this year while its daily relative strength index (RSI) fell further below the 50 level. The 4,300 level could be on the radar, having marked the lower edge of its Ichimoku cloud on the daily chart, alongside its 100-day MA. On the broader trend, the upward trend in the index remains intact, which could still keep any formation of a higher low on watch.
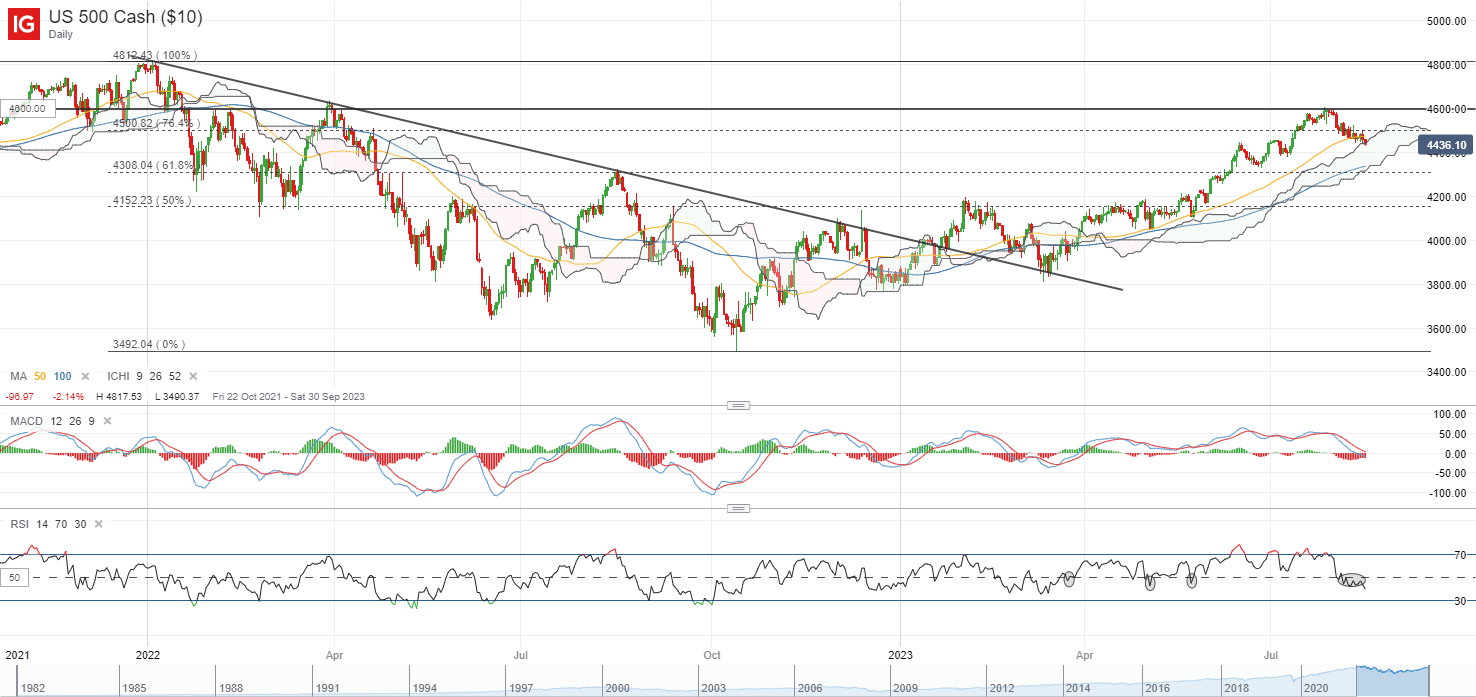
image1.png

Asian stocks look set for a negative open, with Nikkei -1.10%, ASX -1.27% and KOSPI -1.40% at the time of writing, tracking the downbeat performance in Wall Street overnight. A recent set of disappointing economic data out of China has not been encouraging for the region as well, with the aggressive 15 bp cuts to its one-year policy interest reflecting the severity of the economic weakness that authorities foresee to drag on for longer.

Ahead, the Reserve Bank of New Zealand (RBNZ) interest rate decision will be in focus. With inflation data drifting lower according to script, rate expectations are firmly priced for the central bank to keep rates on hold at the upcoming meeting. Any clues on New Zealand’s rate outlook will be sought in the RBNZ press conference, although sticking to its data-dependence stance for future rate decisions may still be the likely scenario.

For now, the NZD/USD continues to trade on a near-term downward bias, with a falling channel pattern firmly in place. On the weekly chart, its Ichimoku cloud resistance has been keeping a lid on upside, with the pair failing to overcome it on multiple attempts since the start of the year. Its weekly RSI heads further below the 50 level as a reflection of sellers in control. The 0.590 level may be on watch ahead, failing to defend the level may potentially pave the way to retest the 0.575 level next.
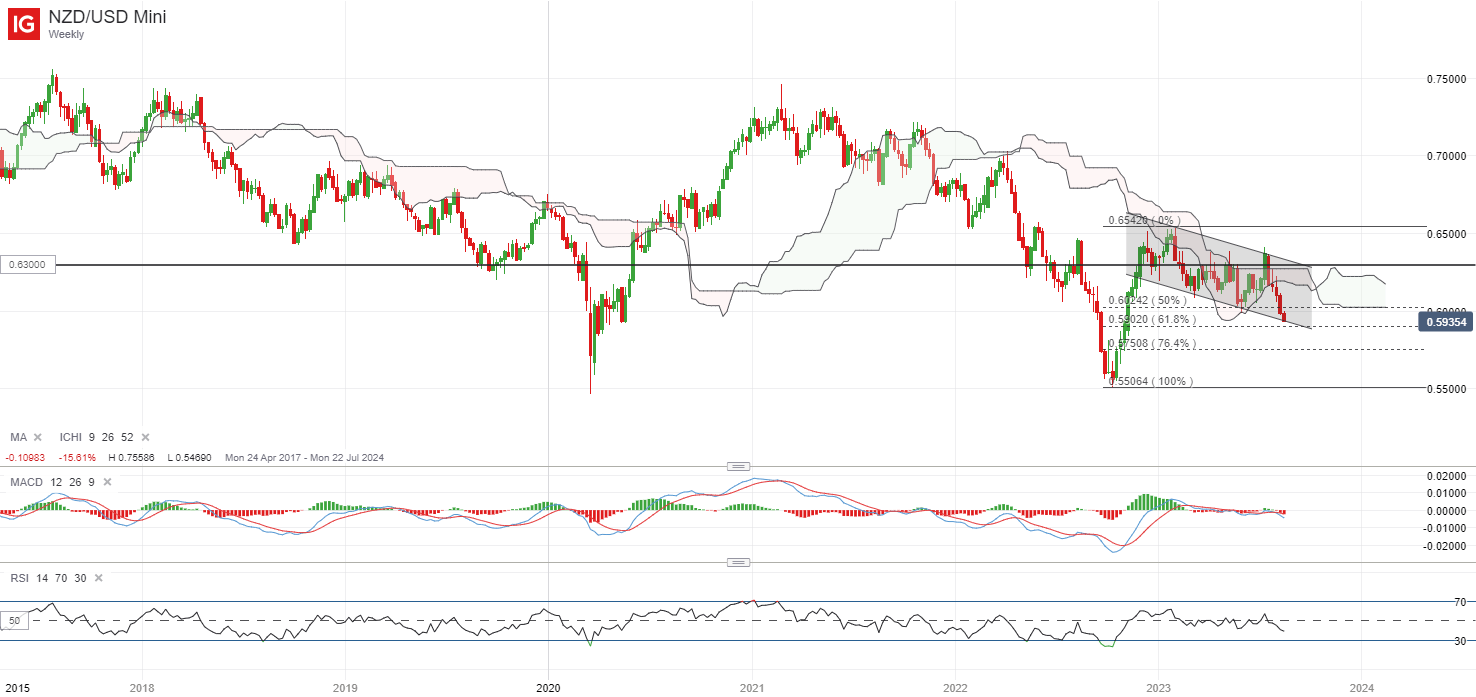
image2.png

On the watchlist: GBP/USD attempting to defend its 100-day MA ahead of UK inflation data

The GBP/USD has been stuck in a series of ranging moves over the past two weeks, attempting to defend its key 100-day MA lately, which stands alongside the Ichimoku cloud support on the daily chart. Thus far, the formation of long-legged bullish pin bars at the 100-day MA seems to reflect the line as a crucial support watched by the bulls. That leaves the 1.264 level in focus ahead, with any breakdown of the level potentially paving the way to retest the 1.239 level next, where its 200-day MA resides.

Expectations are for both UK headline and core figures to ease further to 6.8% for July, versus the previous 7.9% and 6.9% respectively. Given that inflation is still too high for comfort, particularly the limited progress in the core aspect, further rate hikes are firmly priced for the Bank of England (BoE) through the rest of the year. A more persistent showing in inflation data ahead will likely feed into hawkish bets and validates views of further tightening, which may aid to support the GBP/USD.
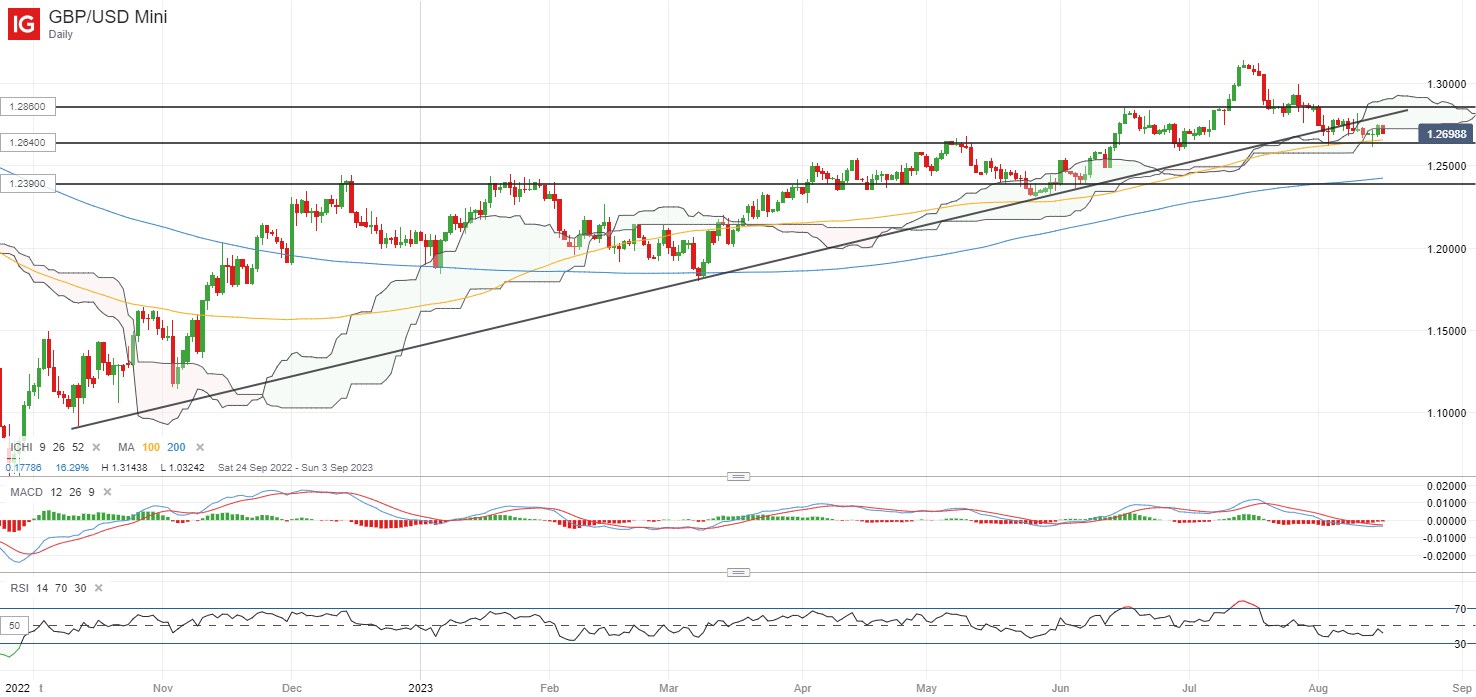
image3.png

New Zealand Dollar Spiked After the RBNZ Left its Cash Rate Alone at 5.50%. Higher NZD/USD?

New Zealand Dollar Spiked After the RBNZ Left its Cash Rate Alone at 5.50%. Higher NZD/USD?

The New Zealand Dollar sunk to 10-month low prior to the Reserve Bank of New Zealand (RBNZ) meeting then bounced after the bank left rates unchanged at 5.50% at its monetary policy committee meeting (MPC) today. New Zealand CPI is currently running at 6.0%, well above its target range of 1% to 3%.

US Dollar strength going into the meeting appears to have caught Kiwi bears off guard with the monetary policy statement (MPS) seen by the market as more hawkish than expected.

The official cash rate (OCR) remains at 525 basis points (bp) above the pandemic low and the overnight index swap (OIS) market is now pricing a 50/50 chance of a 25 bp hike in early 2024.

Before today’s gathering, they had not been pricing in any more hikes in this cycle. This tilt in the interest rate market may have underpinned the currency.

The RBNZ were widely anticipated to keep rates hold today. Prior to the pause in July, the bank had previously raised the overnight cash rate (OCR) 12 times since the first lift in October 2021.

New Zealand’s S&P/NZX 50 equity index made a 7-week low before today’s decision and has struggled to make headway in the aftermath.

Sentiment toward risk and growth-orientated assets had been already soured going into today’s APAC session following on from the North American session. Wall Street tumble over 1% on all the major indices.

The negative perspective emanated from strong US retail sales leading to fears of a more hawkish Fed than previously thought.

These notions were re-enforced by comments from Minneapolis Federal Reserve President Neel Kashkari. He questioned the prospect of whether or not the Fed had done enough to get inflation down to the target of 2%.

Concerns around China’s economic recovery have been swirling for some time. Recent data suggests that there could be further policy adjustments from the Peoples Bank of China after they cut its 1-year medium-term lending facility rate yesterday.

In the post-decision press conference, RBNZ Governor Adrian Orr appeared to join the global central bank chorus line. He intimated that the focus going forward will be on the data as it comes to hand, rather than giving the market-specific guidance.

He was referencing the market interpretation that the bank had raised its OCR track. The statement specifically says, “The current and expected OCR settings are contractionary, sitting above our estimates for the neutral OCR.”

The market may have got ahead of itself in looking for a rate rise.

Governor Orr will also appear in front of the Parliament Select Committee on Friday and will discuss today’s monetary policy statement (MPS). They like their acronyms in NZ!

Market expectations are that he is unlikely to deviate from the script that he delivered today.

The next RBNZ meeting will be held in early October ahead of a national election on October 14th. The full MPS can be read here.

NZD/USD REACTION TO RBNZ RATE PAUSE

image1.png


Euro Ahead of Euro Area GDP, FOMC Minutes: EUR/USD, EUR/AUD, EUR/GBP Price Setups

Euro Ahead of Euro Area GDP, FOMC Minutes: EUR/USD, EUR/AUD, EUR/GBP Price Setups

The euro is testing key levels against some of its peers ahead of the release of Euro area GDP data (due later today) and the FOMC minutes (due Thursday).

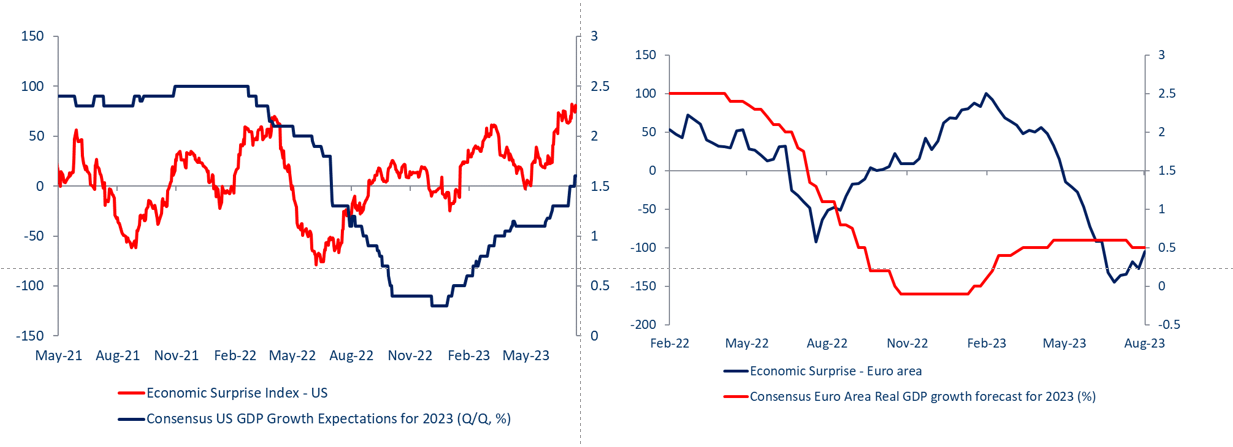
The Euro area economic growth likely slowed to 0.6% on-year in the April-June quarter from 1.1% in the previous quarter on tightened credit conditions as the effect of aggressive ECB rate hikes spills over. The underwhelming macro data is reflected in the Euro area Economic Surprise Index (ESI), which is just off 3-year lows.

Economic Surprise Index – Euro Area and US

A graph of a stock market  Description automatically generated with medium confidence

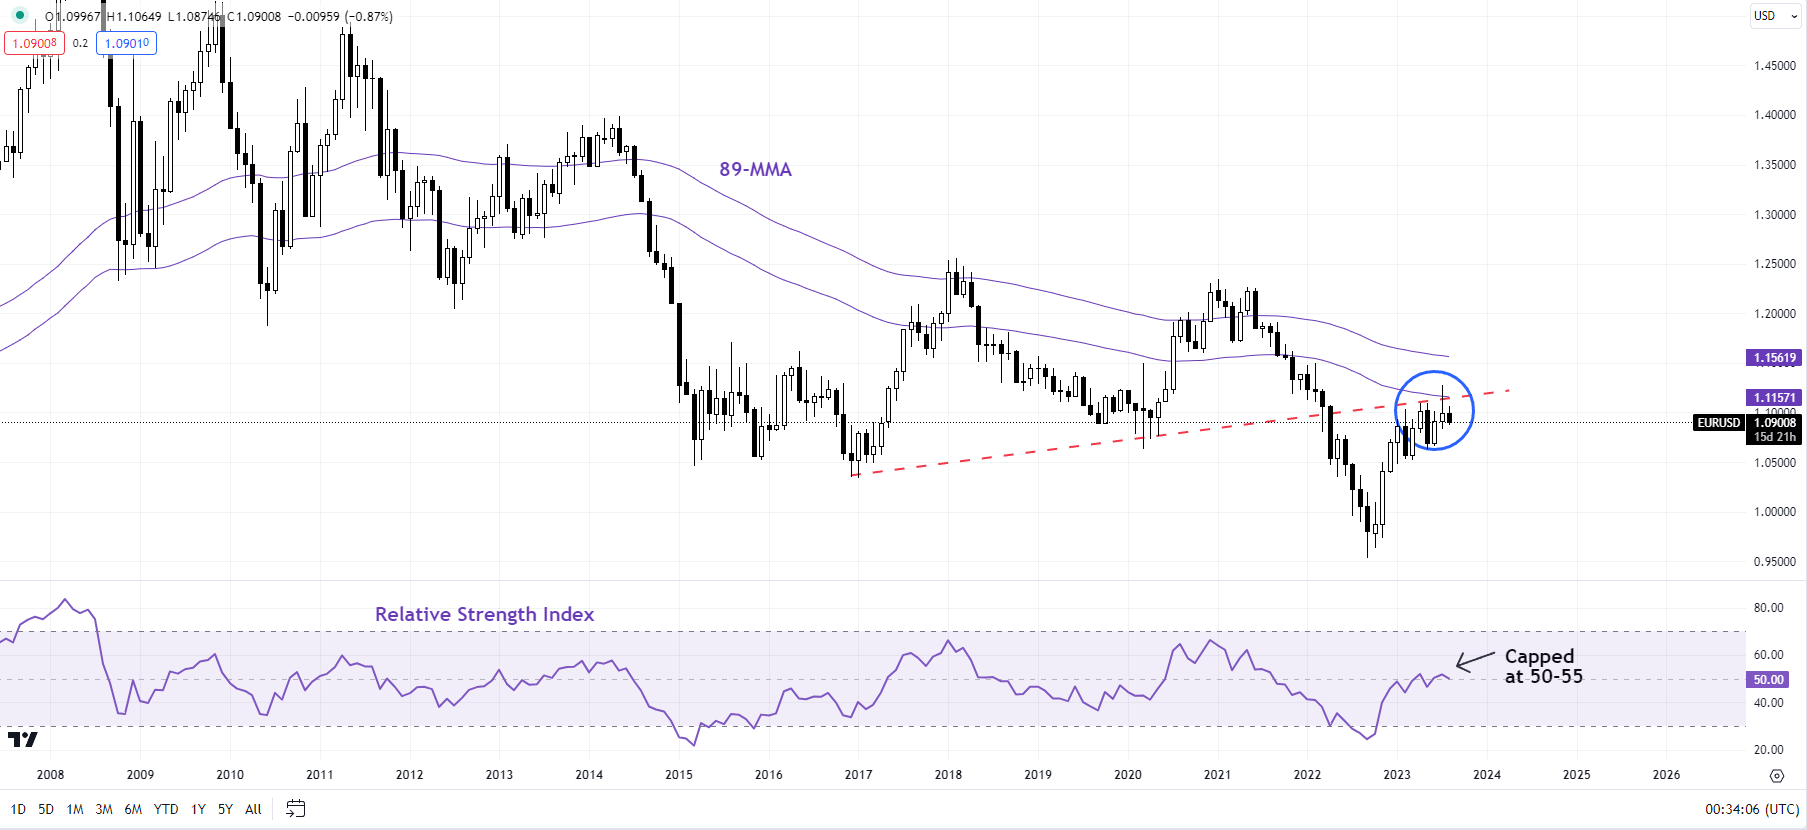
While the unexpected improvement in German investor morale in August is positive, the economic growth outlook needs to reverse for a sustained rebound in EUR, especially against the US. Against other currencies, EUR has been largely resilient, reflecting stable ECB rate expectations until mid-2024.

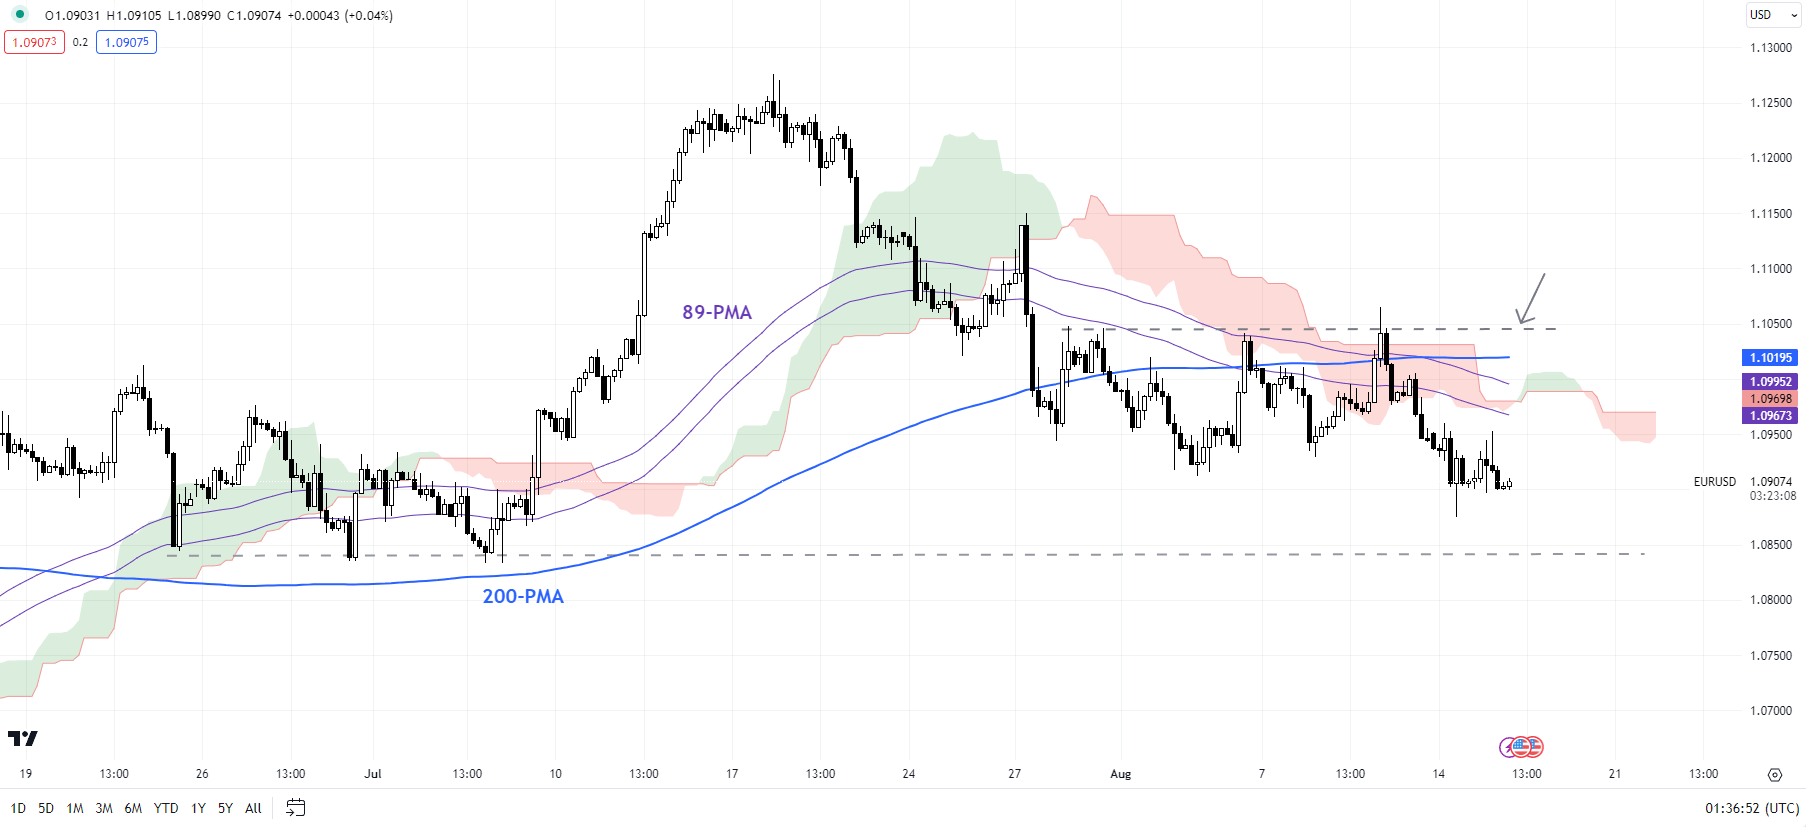
EUR/USD 240-Minutes Chart

image2.png

The US ESI is hovering around the highest level since early 2021. In addition, consensus has upgraded its US economic assessment for the current year. A data-dependent Fed is likely to keep the optimistic 2024 rate cut expectations in check. In this regard, the focus is on minutes of the June FOMC meeting due on Thursday, especially given a resilient US economy, a tight labour market, and market expectations that Fed rates may have peaked.

EUR/USD Monthly Chart

image3.png

EUR/USD: Approaching a vital cushion

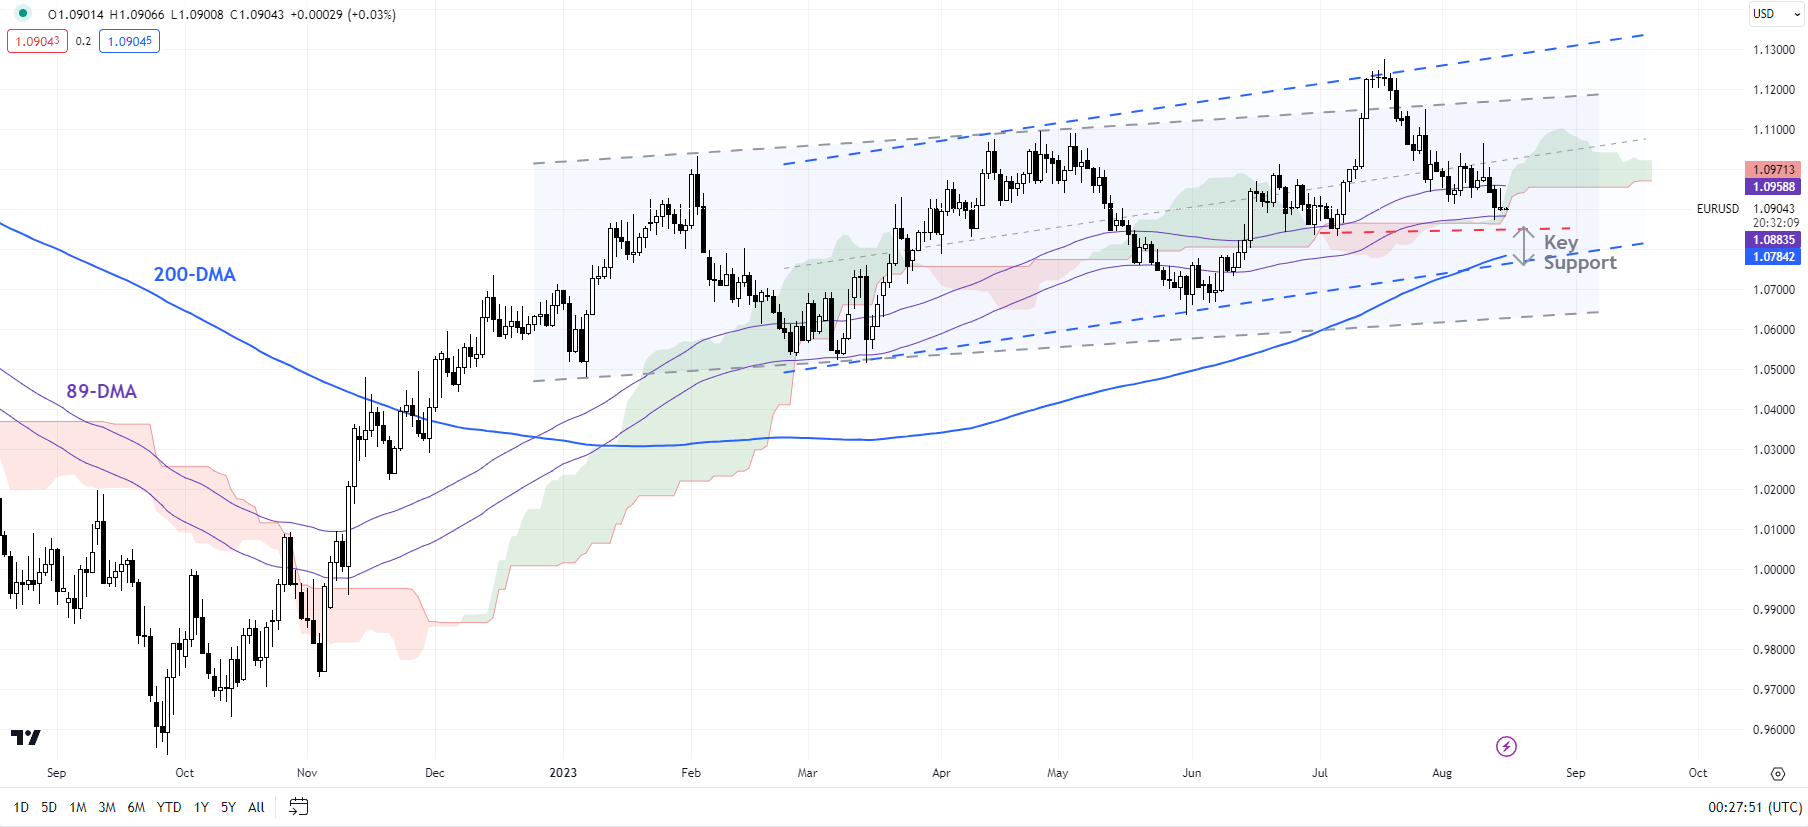
On technical charts,EUR/USD is now approaching a fairly strong cushion zone, including the July low of 1.0830, the 200-day moving average, and the 89-day moving average. This follows a failed attempt to rise above the July 31 high of 1.1045 – a risk pointed out in the previous update. See “Euro Lifted Slightly by US Downgrade, but Will it Last? EUR/USD, EUR/AUD, EUR/NZD Price Action,” published August 2.

EUR/USD Daily Chart

image4.png

Any break below could open the door toward the 1.0500-1.0600 area, including the early-2023 lows. This support area needs to hold for the broader uptrend to persist. On the upside, a break above last week’s high of 1.1065 is needed for the immediate weakness to fade.

EUR/AUD Weekly Chart

image5.png

EUR/AUD: Attempting to break higher

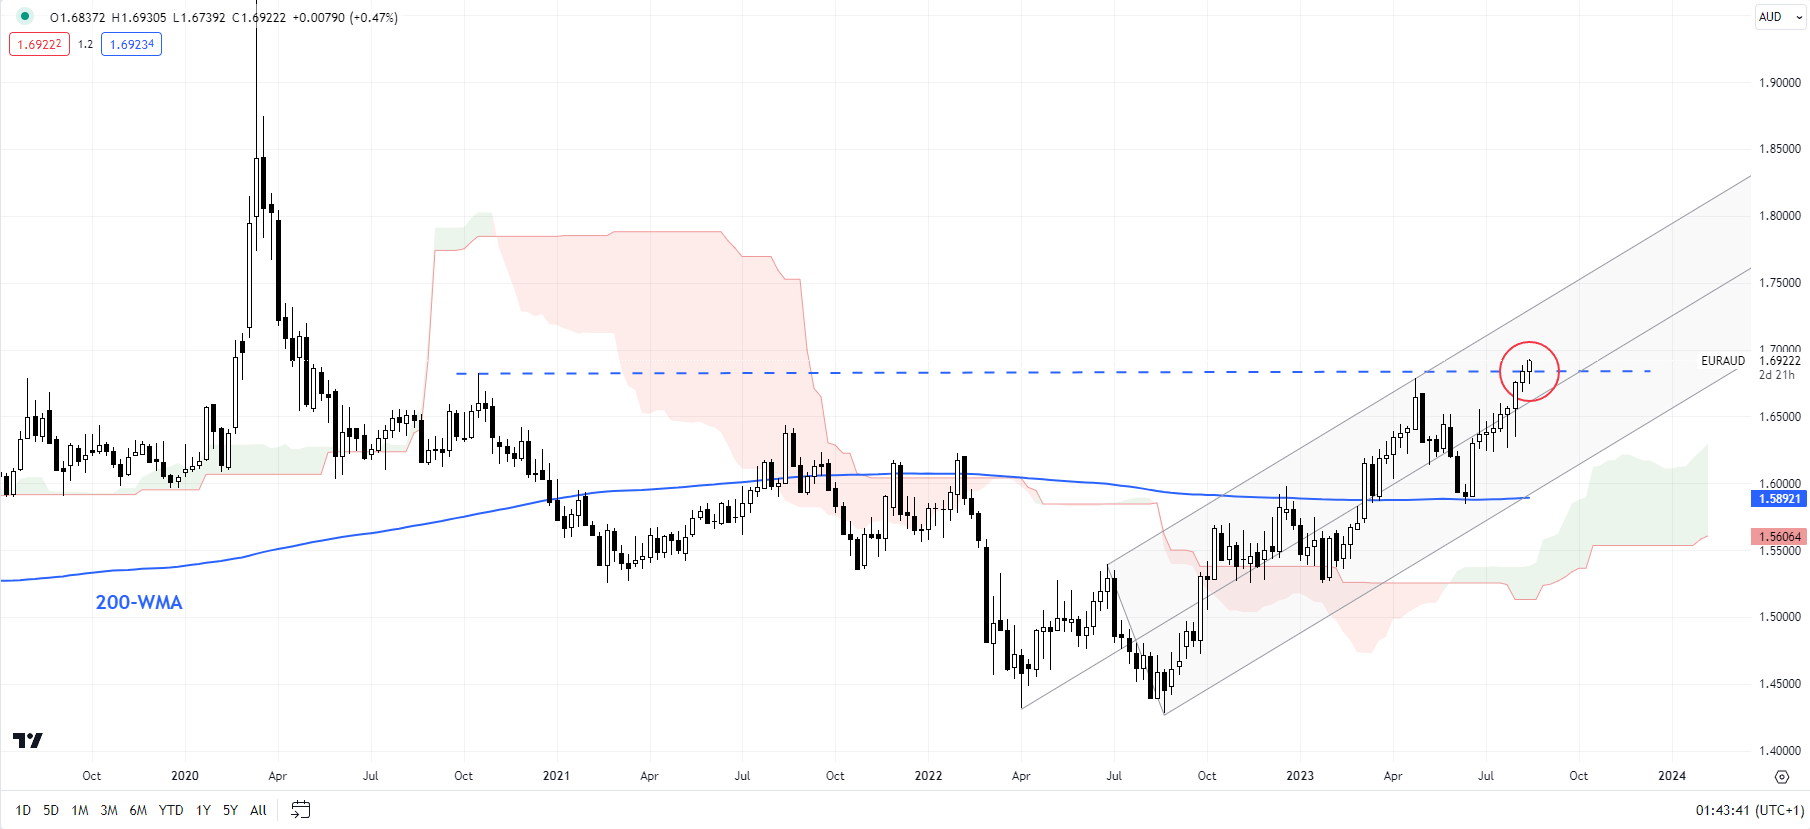
EUR/AUD is attempting to break above crucial resistance on a horizontal trendline from 2020, at about 1.6800. Any break above could open the way toward 1.7700 (the 61.8% retracement of the 2020-2022 slide). From a medium-term perspective, the trend is up given the higher-top-higher-bottom sequence since late 2022, as highlighted in the previous update.

EUR/GBP Daily Chart

image6.png

EUR/GBP: Upside capped

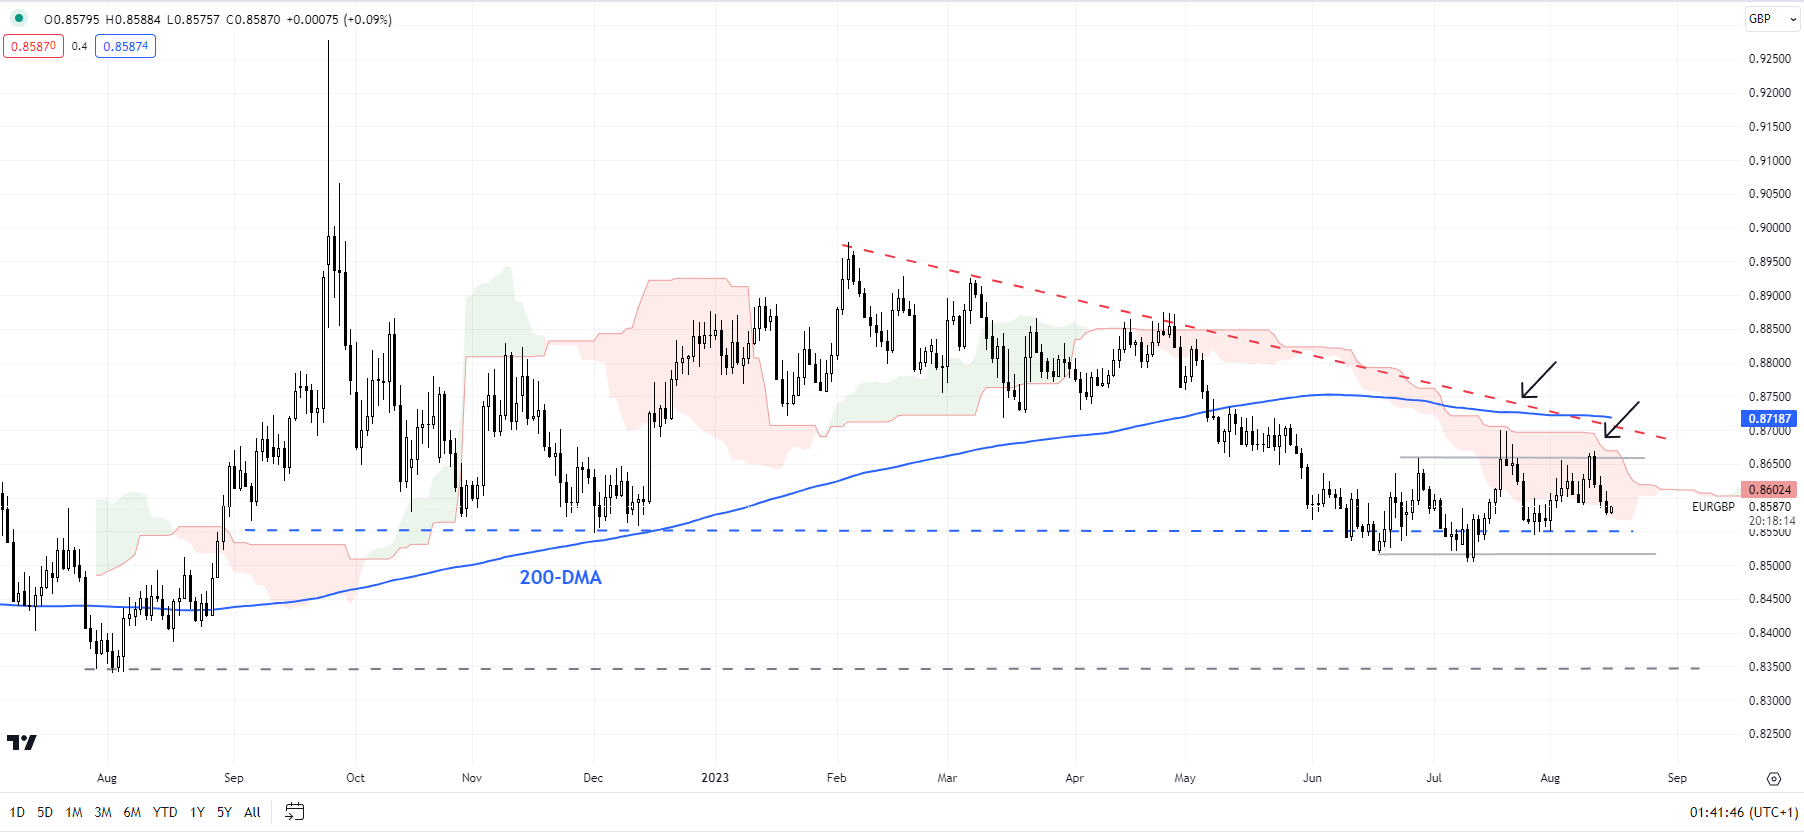
EUR/GBP continues to be weighed by a stiff converged hurdle, including the 200-day moving average, a downtrend line from early 2023, around the July high of 0.8700. Beyond any short-term sideways price action, the overall bias remains toward the downside while the resistance holds.

Crude Oil Collapses as China Woes and US Dollar Strength Take its Toll

Crude Oil Collapses as China Woes and US Dollar Strength Take its Toll

Crude oil slid lower again on Wednesday as it continues to retreat from the 10-month high seen last week.

A combination of China’s growth woes and a potentially hawkish-for-longer Fed supporting the US Dollar appears to have underpinned the energy commodity for now.

This is despite liquified natural gas (LNG) prices catching a bid yesterday on the prospect of industrial action in the gigantic gas fields in the northwest of Australia.

Woodside Petroleum (WDS.AU) and Chevron (CVX.US) are in negotiations with unions to avoid disruption to just over 10% of global LNG supply.

China’s new home prices were marginally softer in July but there is expanding concern that contagion emanating from property developers missing debt repayments could spread to other sectors.

Zhongrong International Trust Co., a major player in China’s trust sector, has missed several obligations to its clients over the past week.

The Peoples Bank of China set the Yuan at 7.1986 for the reference rate. A much stronger setting than had been anticipated by the market. It is being reported that State Banks have been directed to buy the Yuan.

Australian mining stocks are notably lower on the concerns that their exports could be impacted by a continual sluggish economic performance from their best customer.

Sentiment toward risk and growth-orientated assets had been already soured going into today’s APAC session following on from the North American session. Wall Street tumbled over 1% on all the major indices.

The negative perspective emanated from strong US retail sales leading to fears of a more hawkish Fed than previously thought.

These notions were reinforced by comments from Minneapolis Federal Reserve President Neel Kashkari. He questioned the prospect of whether or not the Fed had done enough to get inflation down to the target of 2%.

Treasury yields are slightly lower going into Wednesday’s trade after adding a few basis points across the curve yesterday. Spot gold is treading water above US$ 1,900.

The RBNZ left its cash rate on hold today at 5.50%, but the language in the accompanying statement was interpreted as hawkish by the market. The Kiwi rallied in the aftermath.

GBP/USD is steady near 1.2700 ahead of inflation data while EUR/USD traders will be eyeing Euro-wide GDP data.

The full economic calendar can be viewed here.

WTI CRUDE OIL TECHNICAL ANALYSIS SNAPSHOT

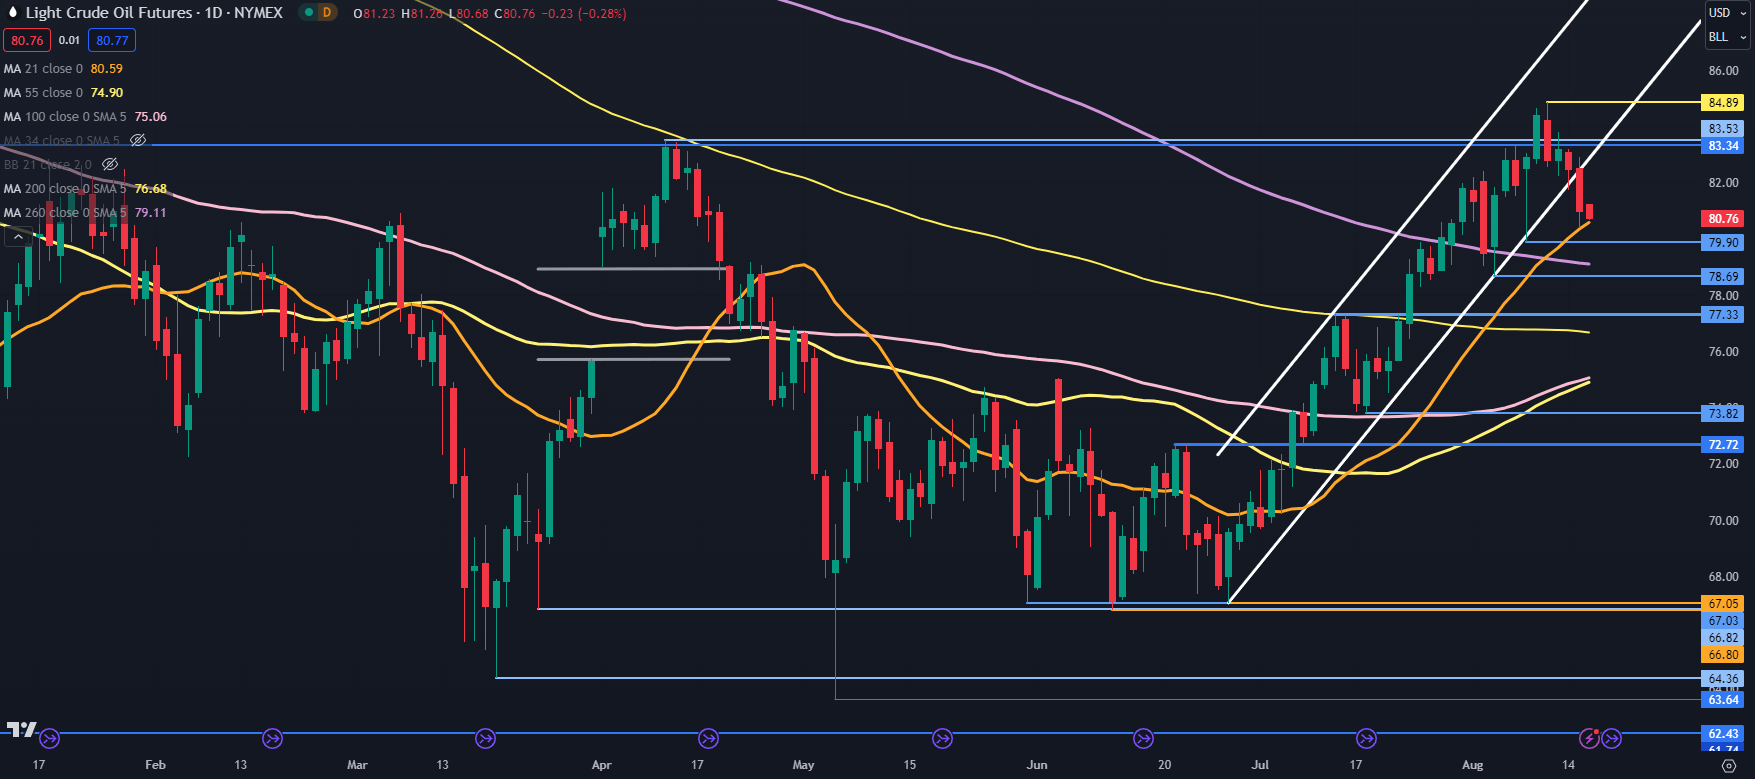
The WTI futures contract broke below the lower bound of an ascending trend channel yesterday. For more information on breakout trading, click on the banner below.

The selloff paused at the 21-day simple moving average (SMA) and it may provide support ahead of the 260-, 200-, 100- and 55-day SMAs at 79.11, 76.68, 75.06 and 74.90 respectively.

Support may also lie at the recent lows of 79.90 and 78.69. Further down, support could be at the breakpoint of 77.33 and the prior low at 73.82.

On the topside, resistance might be at the breakpoints near 83.40 ahead of the recent peak at 84.89.

image1.png


GBP Breaking News: UK Inflation Remains Sticky, September Hike Likely

GBP Breaking News: UK Inflation Remains Sticky, September Hike Likely

GBP FUNDAMENTAL BACKDROP

Before addressing the UK CPI report, lets cast our minds back to yesterday’s jobs data that revealed higher than expected average earnings figures despite moderating employment and unemployment readings. Services sector wage growth has been a major concern for the Bank of England (BoE) as a key contributor to core inflation.

Today’s CPI remained elevated on both core and headline inflation as well as various PPI metrics that could point to sustained inflationary pressures to come. According to the Office for National Statistics (ONS) report, the MoM CPI read fell by 0.4% relative to the 0.6% growth in the previous month with the highest upside contributor coming from Hotels and passenger transport by air.

GBP/USD ECONOMIC CALENDAR (GMT +02:00)

image1.png

What does this mean for the BoE and their interest rate cycle? Looking at implied rates shown in the table below, little has changed pre and post-announcement. Markets are expecting with an almost 92% probability that the BoE will hike by 25bps in September. Taking into account the recent upside inflation report, the central bank may look to maintain this rate in November or hike further depending on incoming economic data between now and then. For now, the British pound may find some support after a recent bout of weakness against the greenback.

Later today, EUR/GBP and GBP/USD crosses will look to eurozone GDP and US building permit data respectively and should provide some short-term volatility.

BANK OF ENGLAND INTEREST RATE PROBABILITIES

image2.png

TECHNICAL ANALYSIS

GBP/USD DAILY CHART

image3.png

Price action on the daily cable chart naturally pushed higher on additional interest rate hikes to come. The 1.2680 support handle has been tested several times of recent but has yet to be breached. That being said, the candlestick pattern being exposed seems to echo that of a descending triangle which traditionally points to subsequent downside (bearish continuation pattern). A confirmation close below 1.2680 could spark this move.

Silver Price Forecast – Silver Continues to Slide, Albeit in a Slow Manner

Silver Price Forecast – Silver Continues to Slide, Albeit in a Slow Manner

Silver Markets Technical Analysis

For silver, the path ahead appears fraught with obstacles, creating a bumpy journey for silver’s valuation. Amidst the current landscape of uncertainty, a shared consensus among experts suggests that silver holds promise for future growth. However, the realization of this potential growth might necessitate a period of stabilization, providing a more secure foundation for its upward journey.

Trading Derivatives carries a high level of risk to your capital and you should only trade with money you can afford to lose. Trading Derivatives may not be suitable for all investors, so please ensure that you fully understand the risks involved, and seek independent advice if necessary. A Product Disclosure Statement (PDS) can be obtained either from this website or on request from our offices and should be considered before entering into a transaction with us. Raw Spread accounts offer spreads from 0.0 pips with a commission charge of USD $3.50 per 100k traded. Standard account offer spreads from 1 pips with no additional commission charges. Spreads on CFD indices start at 0.4 points. The information on this site is not directed at residents in any country or jurisdiction where such distribution or use would be contrary to local law or regulation.

Of utmost significance is the intricate dance between silver prices and the fluctuations of the US dollar. This nuanced relationship plays a pivotal role in shaping market outcomes. It is widely observed that a stronger US dollar can hinder silver’s performance, while a weaker dollar can act as a catalyst for silver’s success. This dynamic adds a layer of complexity to silver’s market behavior, influencing its twists and turns. After all, it is not only negatively correlated with the greenback, but also has a major industrial usage component to pricing as well.

Drawing attention is the pivotal support level of $22, which currently commands significant focus. This level has historically demonstrated its importance on multiple occasions, standing at a critical crossroads. A dip beneath this threshold has the potential to trigger broader market implications, potentially propelling silver toward the notable $20 mark. Beyond their numerical significance, these levels carry profound implications for both traders and analysts alike.

Conversely, if market sentiment shifts and prices rally above the 200-Day Exponential Moving Average, a surge towards $24 could be in the cards. This point of interest coincides with the influential 50-Day EMA, possibly injecting renewed vigor into the market. The convergence of these indicators often ignites heightened trading activity, reflecting the shifts in market conditions.

In closing, the recent fluctuations in the silver market serve as a vivid illustration of its tumultuous nature. Its uphill battle, intensified by the existing challenges, mirrors the intricate dance it engages in with the US dollar. The battleground situated at $22 carries profound implications, while the interplay between the 200-Day EMA and the 50-Day EMA serves as navigational guides for potential trajectories. Amidst the prevailing uncertainties, the virtues of patience and calculated responses stand as guiding lights, steering investors and traders through the intricate realm of silver trading.

Ripple’s XRP Attracts Institutional Investors: Sees 127% Asset Growth

Ripple’s XRP Attracts Institutional Investors: Sees 127% Asset Growth

Ripple’s XRP (XRP) continues to attract buying interest from larger investors. The fifth largest cryptocurrency by market capitalization saw an inflow of funds for the 16th consecutive week, according to a report tabled by digital assets investment firm CoinShares. XRP products have seen assets under management (AUM) balloon by 127% since the start of 2023 the report noted, largely attributed to favorable developments in the drawn-out Ripple Labs vs. the U.S. Securities and Exchange Commission (SEC) legal battle.

Trading Derivatives carries a high level of risk to your capital and you should only trade with money you can afford to lose. Trading Derivatives may not be suitable for all investors, so please ensure that you fully understand the risks involved, and seek independent advice if necessary. A Product Disclosure Statement (PDS) can be obtained either from this website or on request from our offices and should be considered before entering into a transaction with us. Raw Spread accounts offer spreads from 0.0 pips with a commission charge of USD $3.50 per 100k traded. Standard account offer spreads from 1 pips with no additional commission charges. Spreads on CFD indices start at 0.4 points. The information on this site is not directed at residents in any country or jurisdiction where such distribution or use would be contrary to local law or regulation.

The SEC filed a $1.3 billion lawsuit against Ripple in December 2020, alleging the sale of unregistered securities through XRP. A federal district judge’s partial ruling indicated that XRP sales to retail investors were not classified as securities, providing optimism for both investors and Ripple. Although institutional sales contracts worth $728 million were considered unregistered securities sales, the market’s interpretation of the ruling remains positive.

This outcome underpinned confidence in XRP and the broader cryptocurrency market by helping to set a precedence that digital currencies offered to retail clients do not constitute securities. However, recent bullish sentiment suffered a setback last week after the SEC outlined plans to appeal the federal judge’s decision handed down in the case.

Below, we discuss important trading levels on the XRP chart and also use technical analysis to analyze recent price moves in Bitcoin (BTC) and Ethereum (ETH).

XRP

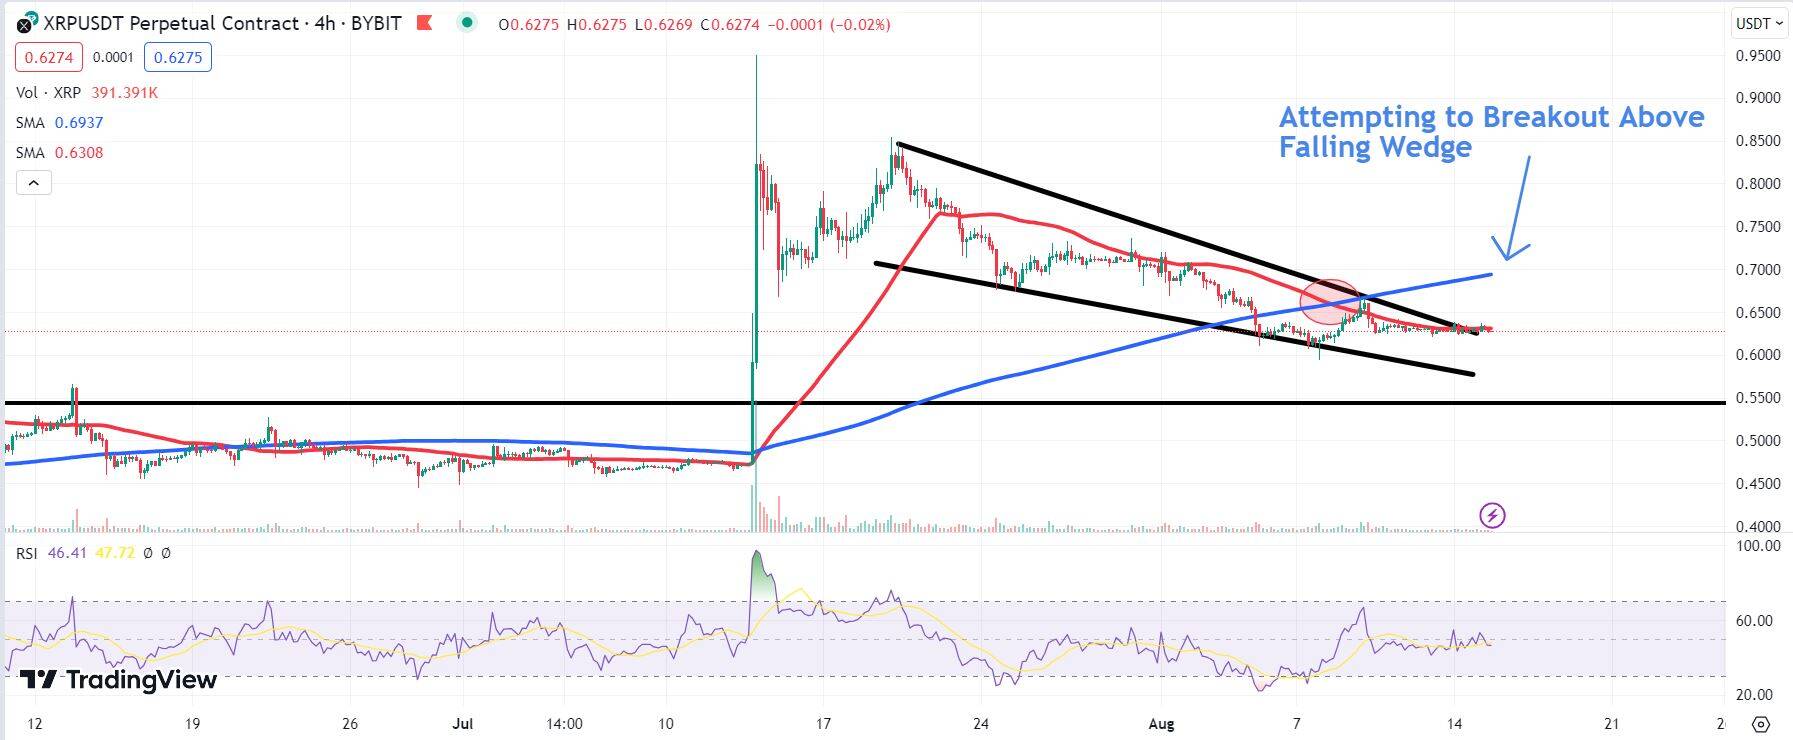
XRP’s price has oscillated within a falling wedge pattern for the past three weeks. In recent trading sessions, bulls have attempted to stage a breakout above the wedge’s top trendline, however, a lack a volume behind the move places doubts about further upside follow through. A convincing close above the 50-period SMA has the potential to improve the indecisive sentiment and trigger a rally back up to key resistance levels at $0.7285 and $0.83, respectively. Conversely, a failure to hold above the wedge’s top trendline and 50 SMA could see falls to longer-term support at $0.54.

Chart depicting the XRP price.

Technical Analysis: Bitcoin and Ethereum

Bitcoin

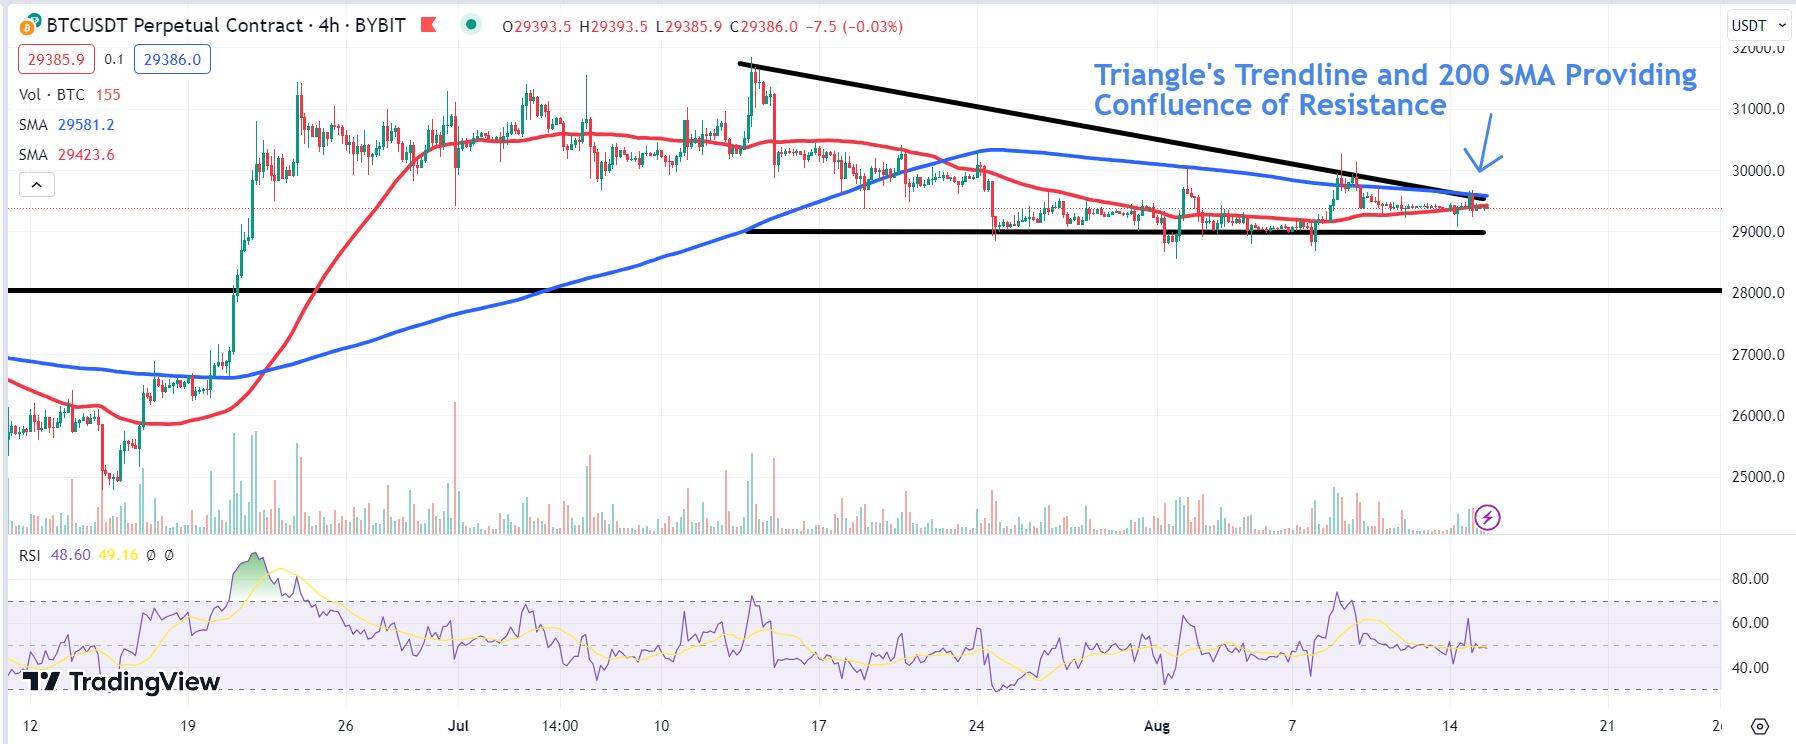
Bitcoin remains entrenched in a long-term descending triangle. More recently, the price finds a confluence of resistance from the triangle’s top trend line and 200 SMA. A volume-backed breakout could see bulls make another attempt at the $31,270 level. The price finds resistance in this area from the top of a previous trading range. Alternatively, a breakdown below the pattern’s lower trendline could see Bitcoin fall to crucial support around $28,000.

Chart depicting the BTC price.

Ethereum

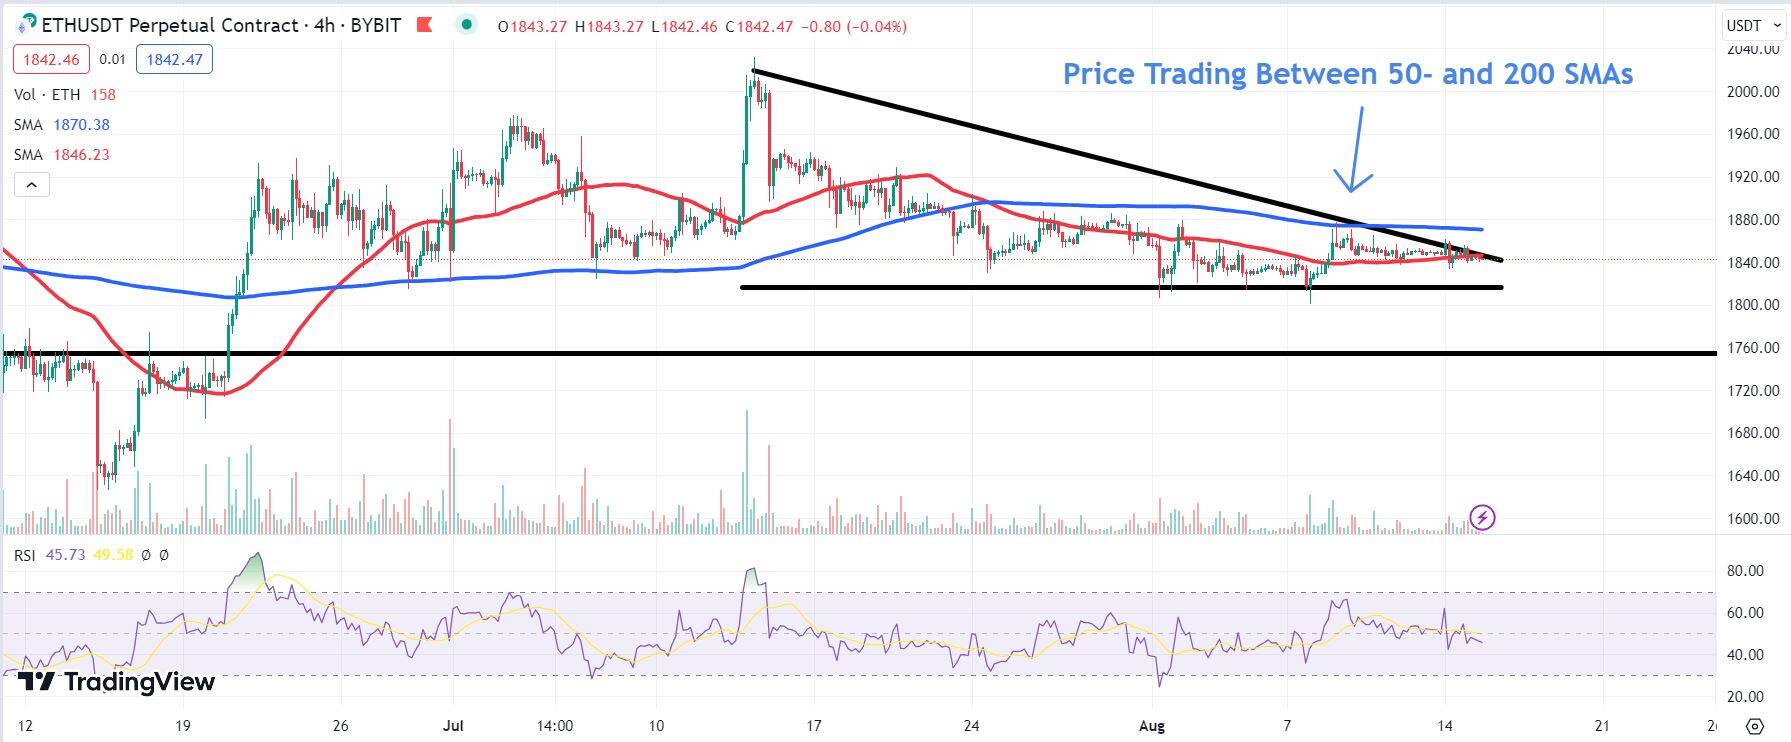
Like Bitcoin, Ethereum’s price remains stuck in a descending triangle. Moreover, it continues to trade within a tight range between the SMAs, providing little clues about future price direction. A close above the 200 SMA may see bulls retest prominent July swing high peaks at $1,970 and $2,010. On the flip side, failure to hold above the triangle pattern’s bottom trendline could see bears sell the price down to key support at the $1,755 level.

Chart depicting the ETH price.


NAHB Housing Market Index Declines As Mortgage Rates Rise

NAHB Housing Market Index Declines As Mortgage Rates Rise

On August 15, the National Association of Home Builders released NAHB Housing Market Index report for August. The report indicated that NAHB Housing Market Index declined from 56 in July to 50 in August, compared to analyst consensus of 56.

NAHB commented: “After steadily rising for seven consecutive months, builder confidence retreated in August as rising mortgage rates nearing 7% (per Freddie Mac) and stubbornly high shelter inflation have further eroded housing affordability and put a damper on consumer demand.”

Today, traders also had a chance to take a look at the Business Inventories report for June. The report showed that Business Inventories remained unchanged on a month-over-month basis, while analysts expected that they would grow by 0.1%.

U.S. Dollar Index settled near the 103.00 level after the release of the report. The U.S. dollar is under pressure against a broad basket of currencies as traders take some profits off the table near multi-week highs.

Gold traded near the $1905 level amid a broad pullback in commodity markets. The market sentiment for commodities is bearish today, and the housing market report did not have any material impact on gold price dynamics.

SP500 tested session lows near the 4450 level after the release of the weaker-than-expected housing data. Traders are worried that rising interest rates put too much pressure on the economy.


Oil Prices Forecast: Navigating China’s Policy Shifts, OPEC’s Output Strategy

Oil Prices Forecast: Navigating China’s Policy Shifts, OPEC’s Output Strategy

Overview

On Tuesday, oil prices exhibited a reserved response, despite an unexpected move by China to cut key policy rates for the second time in three months. This decision, aimed at boosting a waning economic recovery, saw the People’s Bank of China (PBOC) reduce the rate on 401 billion yuan ($55.25 billion) of one-year medium-term lending facility (MLF) loans to financial institutions.

The new rate stands at 2.50%, down 15 basis points from 2.65%. The PBOC stated this cash infusion aims to maintain “banking system liquidity reasonably ample,” especially in light of imminent tax payments. Market analysts had anticipated the PBOC would hold off on easing measures until September, suggesting growing concerns about China’s macroeconomic health.

Trading Derivatives carries a high level of risk to your capital and you should only trade with money you can afford to lose. Trading Derivatives may not be suitable for all investors, so please ensure that you fully understand the risks involved, and seek independent advice if necessary. A Product Disclosure Statement (PDS) can be obtained either from this website or on request from our offices and should be considered before entering into a transaction with us. Raw Spread accounts offer spreads from 0.0 pips with a commission charge of USD $3.50 per 100k traded. Standard account offer spreads from 1 pips with no additional commission charges. Spreads on CFD indices start at 0.4 points. The information on this site is not directed at residents in any country or jurisdiction where such distribution or use would be contrary to local law or regulation.

Despite the policy rate cut, recent economic data from China is not promising. Both industrial output and retail sales figures indicate a slowing economy. To counteract this, authorities made the aforementioned policy rate adjustments to invigorate economic activity. On a brighter note, China’s demand for oil remains robust. July saw the country’s refinery throughput increase by 17.4% year-on-year, driven by the domestic demand for summer travel and lucrative regional profit margins from fuel exports.

Internationally, other economies provide a mixed backdrop for oil prices. Japan’s economy outperformed expectations between April to June, with strong auto exports and increased tourist activity. In contrast, U.S. shale oil and natural gas outputs are predicted to drop in September, marking the second consecutive monthly decline. This decline could intensify the global oil supply squeeze, especially as the Organization of the Petroleum Exporting Countries (OPEC+) continues with production cuts.

In conclusion, while China’s aggressive rate cuts demonstrate proactive measures to stabilize its economy, the subsequent reaction in oil prices remains muted. Traders appear to be waiting, anticipating the time it will take for such stimuli to percolate through China’s vast economy and influence oil demand patterns.

Technical Analysis

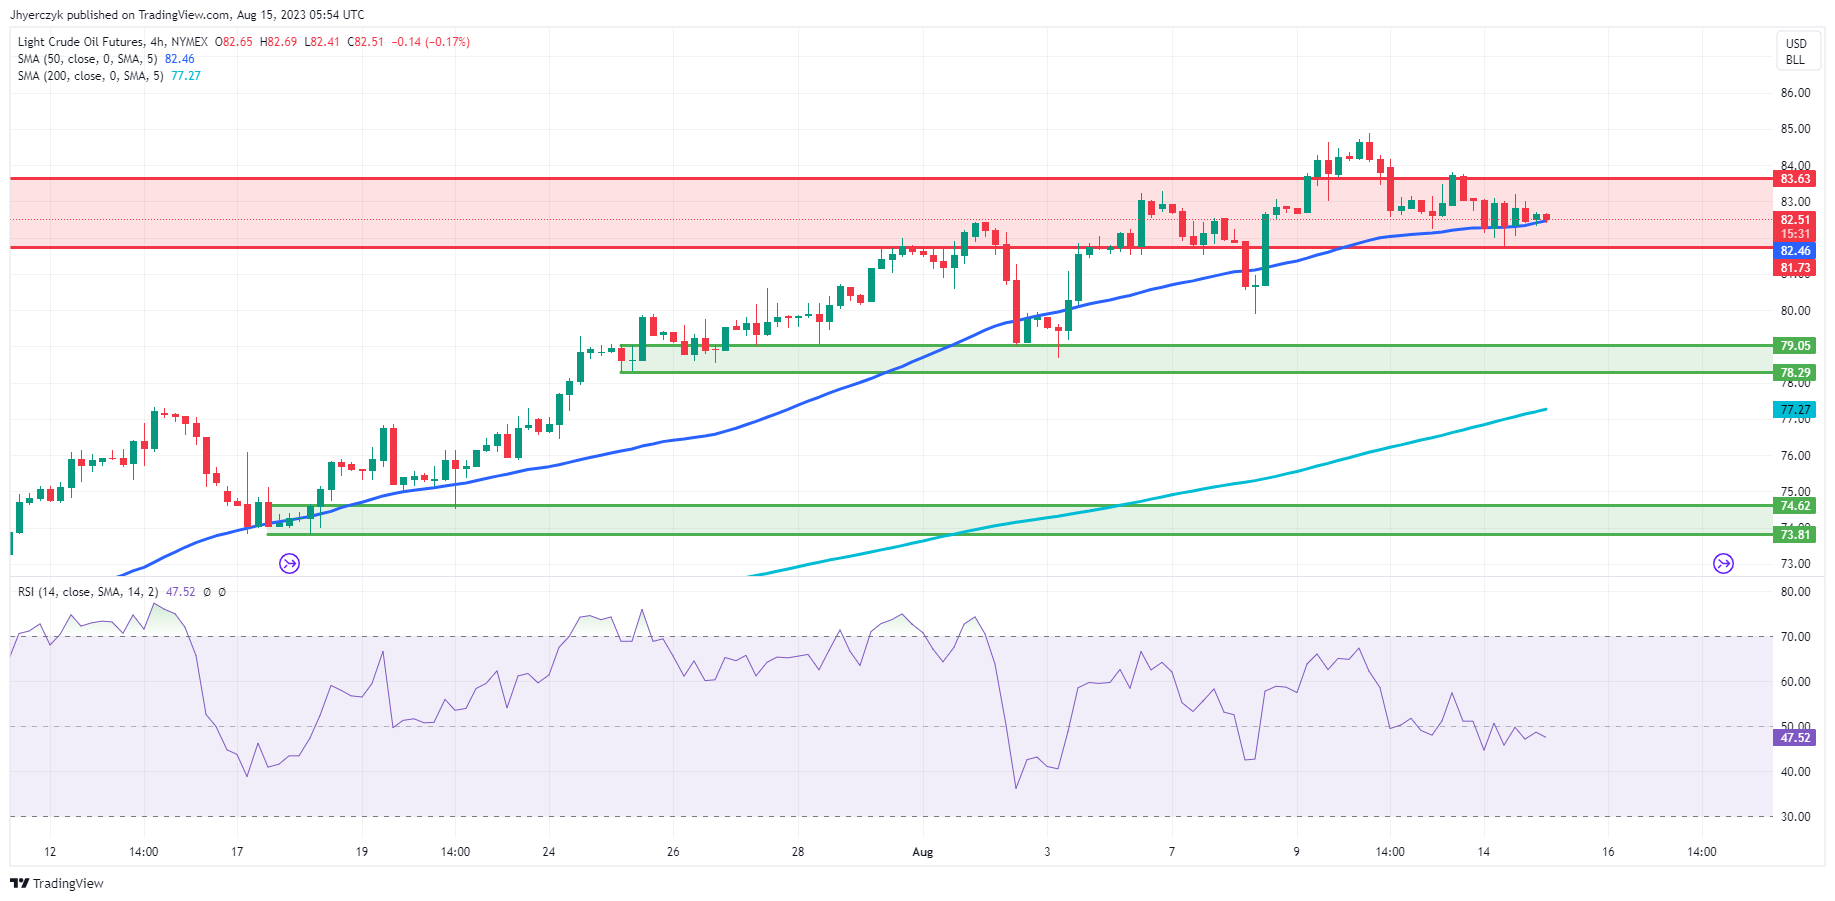
4-Hour Crude OilThe current 4-hour price of Crude Oil stands at $82.56, a minor decrease from the previous 4-hour price of $82.65. This price surpasses both the 200-4H moving average ($77.27) and the 50-4H moving average ($73.46), indicating a relatively bullish trend. The 14-4H RSI registers at 47.52, leaning slightly towards weaker momentum, but it’s still close to the neutral mark of 50.

The price is hovering inside the main resistance area while sitting on the 50-H moving average. Considering the positioning relative to moving averages and the support and resistance zones, the Crude Oil market sentiment appears to be cautiously bullish in the short term.

Dax Index and the Bearish Shift: Navigating Dax Stocks Amid Global Uncertainty

Dax Index and the Bearish Shift: Navigating Dax Stocks Amid Global Uncertainty

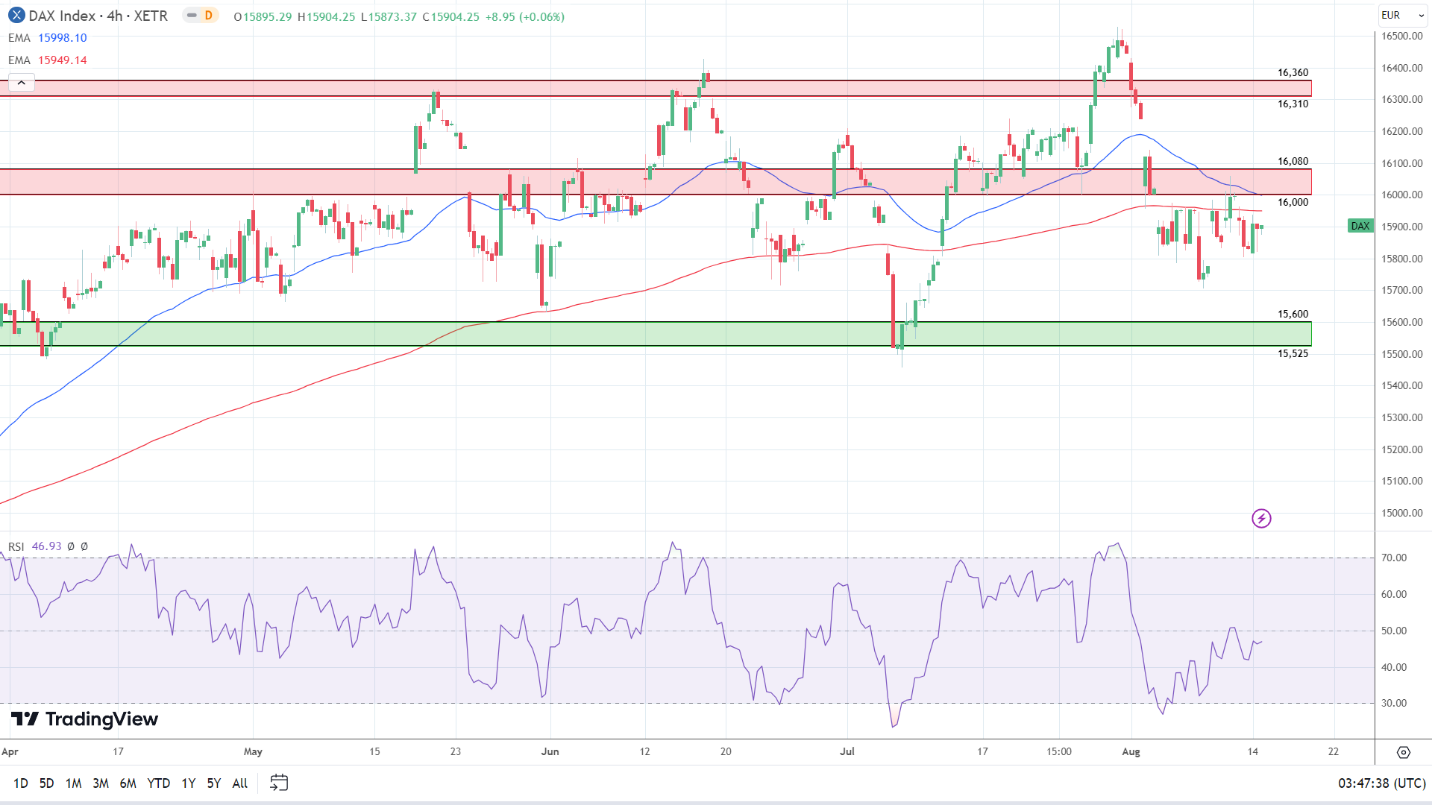
It was a choppy but bullish start to the week for the DAX. On Monday, the DAX gained 0.46%. Partially reversing a 1.03% loss from Friday, the DAX ended the day at 15,904.

There were no economic indicators from China or the US to influence investor sentiment. Investor angst over China’s troubles and German wholesale price numbers for July weighed on investor sentiment. However, news of ADNOC considering upping its bid to acquire Covestro (+3.8%) provided support.

Trading Derivatives carries a high level of risk to your capital and you should only trade with money you can afford to lose. Trading Derivatives may not be suitable for all investors, so please ensure that you fully understand the risks involved, and seek independent advice if necessary. A Product Disclosure Statement (PDS) can be obtained either from this website or on request from our offices and should be considered before entering into a transaction with us. Raw Spread accounts offer spreads from 0.0 pips with a commission charge of USD $3.50 per 100k traded. Standard account offer spreads from 1 pips with no additional commission charges. Spreads on CFD indices start at 0.4 points. The information on this site is not directed at residents in any country or jurisdiction where such distribution or use would be contrary to local law or regulation.

Late in the European session, the US equity markets made gains, contributing to the bullish session.

The NASDAQ Composite rose by 1.05% on Monday. It was also a bullish session for the Dow and the S&P 500, which saw gains of 0.07% and 0.57%, respectively.

Daily Chart sends bearish near-term price signals.
DAX 150823 Daily Chart

German Wholesale Prices Failed to Impress

German wholesale inflation figures provided little comfort. In July, the German wholesale price index fell by 2.8% year-over-year versus a forecasted 2.6% decline. Wholesale prices declined by 2.9% in June.

While the wholesale price index fell just 0.2% in July, month-on-month, the figures reflected a weak demand environment.

There were no US economic indicators for investors to consider.

The Market Movers

It was a mixed session for the auto sector. Continental AG and BMW saw gains of 0.54% and 0.11%, respectively. However, Porsche fell by 0.71%, with Mercedes-Benz Group and Volkswagen ending the day down 0.39% and 0.09%, respectively. Investor angst over China and the latest wholesale prices delivered a mixed session. Continental was among the worst performers.

Exposure to China will continue to pressure autos.

It was also a mixed session for the banks. Commerzbank declined by 1.36%, while Deutsche Bank gained 0.35%. There were news events to send Commerzbank south, with recessionary fears likely weighing as the bank struggles with bad loans.

The Day Ahead for the DAX

Economic data from China will set the tone.

Industrial production increased 3.7% year-over-year in July versus 4.4% in June, with retail sales up 2.5% versus 3.1% in June. Economists forecast increases of 4.5% and 4.8%, respectively.

Other indicators were also bearish. The unemployment rate increased from 5.2% to 5.3%, with fixed asset investments rising by 3.4% versus 3.8% in June. Economists forecast fixed asset investments to be up 3.8%.

Later today, ZEW Economic Sentiment figures for Germany and the Eurozone will draw interest. The macroeconomic environment has deteriorated, suggesting a sharp decline in sentiment. Economists forecast the German ZEW Economic Sentiment Indicator to fall from -14.7 to -16.0.

The ZEW Economic Sentiment Index reflects the level of optimism or pessimism that analysts have regarding the economic outlook over six months. Negative figures reflect a pessimistic view of the economic outlook and an increasing chance of a recession.

US retail sales and the NY Empire State Manufacturing Index will move the dial. We expect the retail sales figures to have more impact.

Economists forecast retail sales to increase by 0.4% in July versus +0.2% in June.

A jump in retail sales could force the Fed to hike rates to curb spending and eliminate the demand effect on consumer price inflation.

DAX Technical Indicators

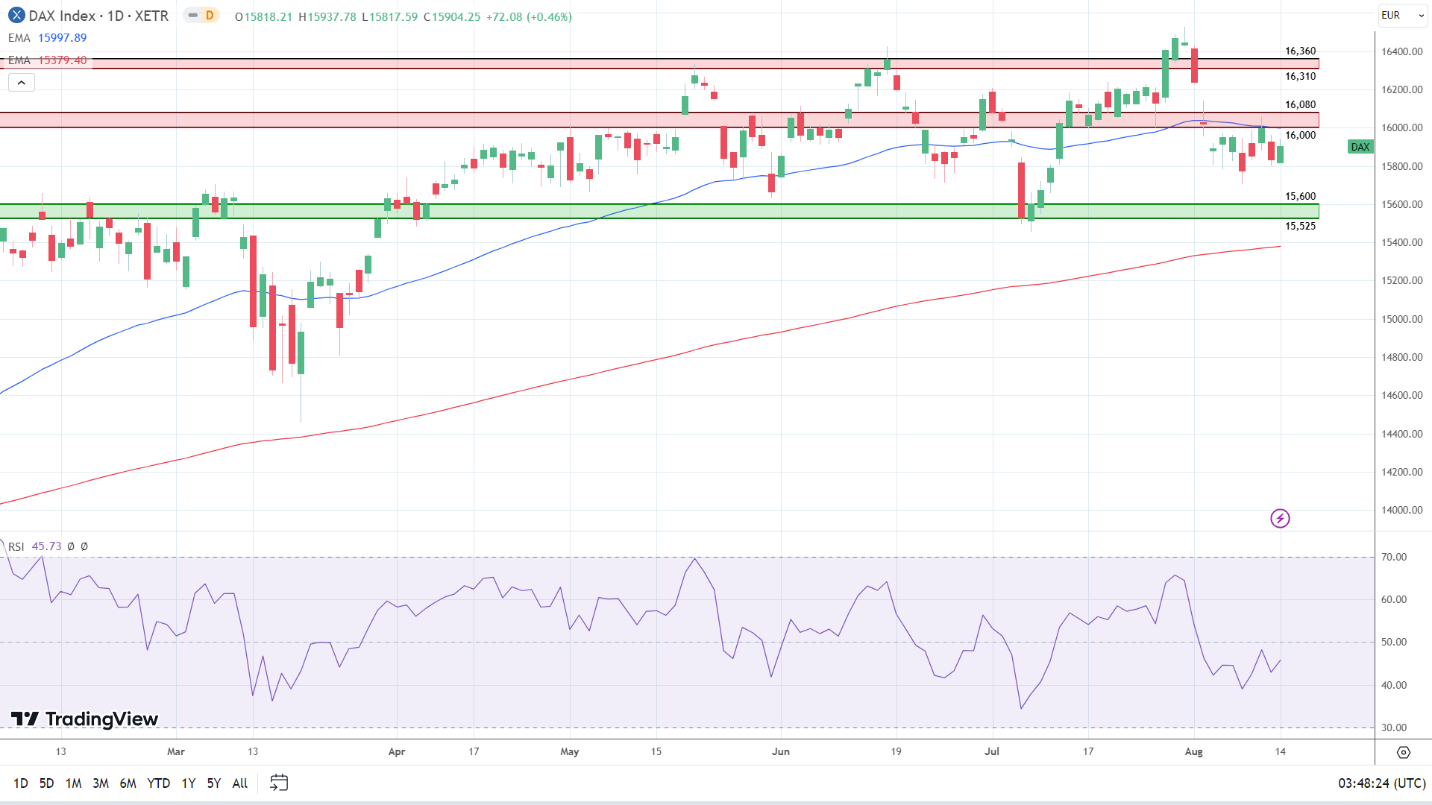
Looking at the EMAs and the 4-hourly chart, the EMAs sent bearish signals. The DAX sat below the 50-day and 200-day EMAs, sending bearish near and longer-term price signals.

The 14-4H RSI sits at 46.93, reflecting bearish sentiment, with selling pressure overweighing buying pressure. Significantly, the RSI aligns with the EMAs, supporting a return to 15,750 to target the 15,600 – 15,525 support band.

DAX Daily Chart affirms bearish near-term price signals.