Oil Price Forecast: Gains Limited by China’s Economic Woes ahead of CPI Report

Oil Price Forecast: Gains Limited by China’s Economic Woes ahead of CPI Report

Overview

Oil prices slid on Thursday, taking a breather from multi-month highs reached the day before. West Texas Intermediate crude (WTI) edged down by a mere 0.1%, settling at $84.34. This comes after reaching its highest level since November of 2022.

The U.S. Energy Information Administration (EIA) dropped a bombshell, revealing a sharp uptick in U.S. crude inventories, which swelled by 5.9 million barrels over the past week to stand at 445.6 million barrels. This overshadows analysts’ modest expectations of a 0.6 million-barrel rise. Additionally, a record drop in U.S. crude oil exports of 2.9 million barrels per day last week further intensified concerns. Nevertheless, some traders are expecting a rebound in crude exports given the ongoing Brent and U.S. crude futures spread.

Trading Derivatives carries a high level of risk to your capital and you should only trade with money you can afford to lose. Trading Derivatives may not be suitable for all investors, so please ensure that you fully understand the risks involved, and seek independent advice if necessary. A Product Disclosure Statement (PDS) can be obtained either from this website or on request from our offices and should be considered before entering into a transaction with us. Raw Spread accounts offer spreads from 0.0 pips with a commission charge of USD $3.50 per 100k traded. Standard account offer spreads from 1 pips with no additional commission charges. Spreads on CFD indices start at 0.4 points. The information on this site is not directed at residents in any country or jurisdiction where such distribution or use would be contrary to local law or regulation.

However, all eyes are now on China. As the world’s second-largest economy, its recent economic data is causing jitters in the market. Chinese consumer sectors are experiencing deflation, and there’s a continuous decline in factory-gate prices. Initially considered overly conservative, China’s 5% growth projection for 2023 now appears to be on the optimistic side, signaling challenges in their post-COVID economic recovery.

Bulls and Bears Weigh In

Market analysts are eagerly awaiting the U.S.’s Consumer Price Index (CPI) for July. The outcome of which is set to give an indication of the Federal Reserve’s future monetary stance. The consensus suggests a subtle year-over-year uptick, with monthly consumer prices predicted to rise by 0.2%, maintaining June’s momentum.

Meanwhile, potential strikes at gas facilities have spurred talks between giants Chevron and Woodside Energy Group. These facilities account for roughly 10% of the global LNG market, and concerns regarding their supply recently elevated European gas prices, bolstering the diesel demand outlook.

Despite China’s economic softness, oil prices stay resilient. Market forces are seemingly more tuned to supply constraints, particularly those stemming from Saudi Arabia’s extended production cuts and Russia’s commitment to curtail its September oil exports by 300,000 bpd. With geopolitics in the mix, notably tensions between Russia and Ukraine in the Black Sea, uncertainties around Russian oil shipments add another layer of complexity to the global oil forecast.

Technical Analysis

4-Hour Crude OilThe current 4-hour price of Crude Oil stands at $84.36, marking a slight increase from the previous value of $84.20, suggesting a mild uptick in momentum.

Notably, the price lies significantly above the 200-4H moving average of $76.01, underscoring a prevailing bullish trend. Conversely, the price surpasses the 50-4H moving average of $81.85, indicating a potential continuation of this upward trajectory. With the 14-4H RSI at 65.98, momentum is strong, yet not reaching overbought levels.

Positioned above the main support area ($79.05 to $78.29) and a former resistance area ($83.63 to $81.73) but still below the main resistance range ($88.68 to $90.10), the Crude Oil market leans towards a bullish sentiment in the 4-hour timeframe.

AUD to USD Forecast: Sub-$0.65 Hinged on US CPI Report

AUD to USD Forecast: Sub-$0.65 Hinged on US CPI Report

On Wednesday, the AUD/USD fell by 0.24% to end the day at $0.65280. Consumer price inflation and producer price index numbers from China provided early support. However, US inflation jitters led the Aussie into the red later in the day.

This morning, there are no economic indicators from Australia or China to influence. The lack of economic indicators will leave the Aussie dollar in the hands of market risk sentiment throughout the morning session. Disappointing economic indicators from China and the threat of an Australian economic recession will likely be considerations.

Trading Derivatives carries a high level of risk to your capital and you should only trade with money you can afford to lose. Trading Derivatives may not be suitable for all investors, so please ensure that you fully understand the risks involved, and seek independent advice if necessary. A Product Disclosure Statement (PDS) can be obtained either from this website or on request from our offices and should be considered before entering into a transaction with us. Raw Spread accounts offer spreads from 0.0 pips with a commission charge of USD $3.50 per 100k traded. Standard account offer spreads from 1 pips with no additional commission charges. Spreads on CFD indices start at 0.4 points. The information on this site is not directed at residents in any country or jurisdiction where such distribution or use would be contrary to local law or regulation.

S&P Global Ratings released an Economic Research piece on Wednesday noting,

“It is possible, but not certain, that the economy can manage a soft landing, with inflation decreasing to the Reserve Bank of Australia’s target range without a major downturn and sustainable rise in unemployment.”

It is worth noting the Australian economy is dependent upon trade. Notably, the Australian Trade to GDP ratio stood at 45.8% in 2019 before declining as global trade terms deteriorated. As an exporter of commodities, weak global demand would adversely affect the Australian trade balance, the economy, and the Aussie dollar. Importantly, trade provides circa 20% of Australian jobs, a material consideration for the RBA.

The US Session

It is a big day ahead, with the all-important US CPI Report in focus. Hotter-than-expected inflation numbers would reignite bets on a September Fed interest rate hike, which could refuel recessionary jitters.

Economists forecast the US annual inflation rate to accelerate from 3.0% to 3.3% in July and for core inflation to hold steady at 4.8%.

Jobless claims figures will also draw interest. However, we expect the numbers to play second fiddle to the CPI Report.

While the Fed considers the Core PCE Price Index numbers a leading inflation indicator, the CPI Report carries significant weight. The Fed is looking for inflationary pressures to ease significantly to take its foot off the gas. Wage growth and tight labor market conditions remain risks to the inflation puzzle.

AUD/USD Price Action

Daily Chart

The Daily Chart showed the AUD/USD hover at the lower level of the $0.6545 – $0.6526 support band. Significantly, the Aussie remained below the 50-day ($0.66736) and 200-day ($0.67349) EMAs, sending bearish near and longer-term price signals.

The 50-day EMA fell further from the 200-day EMA, sending bearish price signals.

Looking at the 14-Daily RSI, the 37.55 reading signals a bearish trend and supports a fall through the 0.6545 – 0.6526 support band to sub-$0.65. However, an AUD/USD move through the 0.6545 – 0.6526 support band would give the bulls a run at the 50-day EMA ($0.66736) and the $0.6600 – $0.6620 resistance band.

AUD/USD Daily Price Chart sends bearish price signals.
AUDUSD 100823 Daily Chart

4-Hourly Chart

Looking at the 4-Hourly Chart, the AUD/USD hovers at the lower level of the $0.6545 – $0.6526 support band. Significantly, the AUD/USD remains below the 50-day ($0.65875) and 200-day ($0.66704) EMAs, sending bearish near and longer-term price signals.

The 50-day EMA pulled back from the 200-day EMA, supporting a fall through the $0.6545 – $0.6526 support band to sub-$0.65. However, an AUD/USD move through the $0.6545 – $0.6526 support band and the 50-day EMA ($0.65875) would signal a breakout from the $0.6600 – $0.6620 resistance band to target $0.6650.

Looking at the 14-Daily RSI, the 43.88 reading signals a bearish trend and supports a fall through the 0.6545 – 0.6526 support band to sub-$0.65.

4-Hourly Chart affirms bearish price signals.
AUDUSD 100823 4-Hourly Chart
NASDAQ 100, Dow Jones, S&P 500: Gaining Momentum Ahead of Decisive Inflation Insights

NASDAQ 100, Dow Jones, S&P 500: Gaining Momentum Ahead of Decisive Inflation Insights

Wall Street Optimistic as Stock Futures Rise Ahead of Critical Inflation Report

Wall Street showed signs of optimism on Thursday morning, with stock futures trending upward. A substantial factor fueling this anticipation is the imminent release of pivotal inflation data, set to offer insights that could be instrumental in guiding the Federal Reserve’s upcoming decisions on interest rates.

Daily S&P 500

Recent Market Performance

Early indicators from the stock futures market are painting a picture of confidence. Dow futures have surged by 214 points, a 0.61% rise, standing at 35,416.00. The S&P 500 Index futures also climbed, posting a gain of 0.66% to reach 4,515.25. Meanwhile, the tech-focused Nasdaq-100 Index futures experienced a 0.72% increase, landing at 15,287.00. Despite a previous downward trend in Wall Street’s session—where the Dow Jones Industrial Average fell by 0.54%, the S&P 500 by 0.7%, and the Nasdaq Composite by 1.17%—there’s a renewed sense of anticipation.

Trading Derivatives carries a high level of risk to your capital and you should only trade with money you can afford to lose. Trading Derivatives may not be suitable for all investors, so please ensure that you fully understand the risks involved, and seek independent advice if necessary. A Product Disclosure Statement (PDS) can be obtained either from this website or on request from our offices and should be considered before entering into a transaction with us. Raw Spread accounts offer spreads from 0.0 pips with a commission charge of USD $3.50 per 100k traded. Standard account offer spreads from 1 pips with no additional commission charges. Spreads on CFD indices start at 0.4 points. The information on this site is not directed at residents in any country or jurisdiction where such distribution or use would be contrary to local law or regulation.

Daily Walt Disney Co

Entertainment and Resorts Sector Update

In the entertainment sector, Disney’s recent moves have drawn considerable attention. Even though Disney faced challenges like a significant decline in Disney+ subscribers, especially a 24% drop from the Disney+ Hotstar platform due to the lost rights to the IPL cricket matches, the company’s stock remained resilient.

This resilience was likely driven by the announcement of an upcoming price hike for its ad-free subscriptions, a move that mirrored a similar strategy by streaming rival Netflix earlier in the year. Disney’s shares subsequently soared by 4% in extended trading. Disney CEO Bob Iger underscored the importance of the company’s diverse ventures, notably film studios, parks, and streaming, in their forward-looking growth strategy.

On another positive note, Wynn Resorts witnessed a 1% stock price increase, buoyed by results that exceeded market expectations.

Crucial Inflation Data and Market Speculations

Arguably, the highlight for traders this week is the much-awaited July consumer price index (CPI) report. This document is set to unveil comprehensive details about U.S. inflation, insights that can profoundly influence fiscal decisions in the coming months. Economists currently project the CPI for July to grow by 0.2% and experience a 3.3% rise on an annualized basis. In addition to the CPI, core inflation elements, including factors like shelter, energy, health care, and food prices, will be closely examined by market analysts.

Short-term Market Forecast

Broadly speaking, Wall Street appears to be betting on the Federal Reserve maintaining rates in their upcoming September 20th meeting. But in the world of finance, certainties are rare. Some voices, most notably that of Federal Reserve Bank Governor Michelle Bowman, hint at the possibility that the rate-hike cycle isn’t quite done. Adding to the intricate financial tapestry are movements in the U.S. 10-year Treasury yield and corporate earnings reports from industry heavyweights, further emphasizing the dynamic nature of the current economic landscape.

USD to CAD Price Forecast: US CPI Report to Dictate Forex Pair’s Future Course

USD to CAD Price Forecast: US CPI Report to Dictate Forex Pair’s Future Course

Overview

The USD to CAD is lower on Thursday, as the market keenly awaits the unveiling of the U.S. Consumer Price Index (CPI) report, scheduled for 12:30 GMT. The greenback, in the meanwhile, maintained its position against the Canadian Dollar in anticipation of this pivotal inflation data which could reshape the Federal Reserve’s policies.

Earlier this week, the U.S. Dollar touched a two-month peak against the loonie. Market sentiment seemed to lean towards the Bank of Canada’s hesitance in hiking rates, while the majority opinion suggests that the Fed might have reached its limit in rate augmentations. This sentiment is further bolstered by the ongoing turbulence in China’s economic landscape, making the U.S. Dollar a preferred choice for safe-haven investments.

Trading Derivatives carries a high level of risk to your capital and you should only trade with money you can afford to lose. Trading Derivatives may not be suitable for all investors, so please ensure that you fully understand the risks involved, and seek independent advice if necessary. A Product Disclosure Statement (PDS) can be obtained either from this website or on request from our offices and should be considered before entering into a transaction with us. Raw Spread accounts offer spreads from 0.0 pips with a commission charge of USD $3.50 per 100k traded. Standard account offer spreads from 1 pips with no additional commission charges. Spreads on CFD indices start at 0.4 points. The information on this site is not directed at residents in any country or jurisdiction where such distribution or use would be contrary to local law or regulation.

Inflation Data and Forecasts

Forecasts from Wall Street hint at a steady core consumer price index, expected at 4.8% YoY for July. Additionally, the Dow Jones’ consensus predicts a 0.2% rate for the same month. The upcoming consumer price index report will be under intense scrutiny, with primary attention on core inflation aspects like energy, shelter, health care, and food.

Federal Reserve’s Future Direction

While the broader market consensus is that the Federal Reserve will likely maintain its rate during the September 20th meeting, there are contrasting opinions. Notably, Federal Reserve Bank Governor Michelle Bowman speculates that the current rate-hike cycle may not have concluded. Moreover, the rising crude oil prices, the highest since January, could introduce further complexities to the Fed’s decisions.

Short-term Forecast

Amidst a challenging period for the Canadian dollar, characterized by job losses and China’s economic slowdown, the currency witnessed a slight recovery influenced by surging oil prices. However, the U.S. inflation data, slated for Thursday, will be pivotal. Should the inflation rate surpass expectations, it might fortify the U.S. Dollar’s position against the Canadian Dollar. Conversely, a meeting or weakening of the forecasted inflation rate may propel the Canadian Dollar.

In conclusion, the market sentiment leans bullish for USD to CAD, particularly in light of external pressures from the Chinese economy and internal setbacks. The forthcoming U.S. inflation data will be crucial in setting the short-term trajectory for the USD to CAD pair.

Technical Analysis

4-Hour USD to CADThe USD to CAD currently trades at 1.3403, just a touch below its prior 4-hour mark of 1.3418. Positioned above the 200-4H moving average at 1.3249, it suggests a prevailing bullish momentum.

Contrarily, it trades marginally above the 50-4H moving average of 1.3345, further affirming this bullish trend. The 14-4H RSI, at 52.30, leans slightly above the neutral midpoint, pointing to a bit of strengthening momentum.

As the price stands inside the main resistance zone (1.3406-1.3450) and comfortably above the main support area (1.3142-1.3118), the short-term outlook for USD to CAD remains on the bullish side.

However, it also remains vulnerable to a pullback into the moving averages if the U.S. CPI report comes in softer-than-expected.

Silver Price Forecast: XAG’s Shine in the Balance Ahead of CPI Data

Silver Price Forecast: XAG’s Shine in the Balance Ahead of CPI Data

Overview

In the world of precious metals, Silver (XAG) is drawing investor attention as the forthcoming U.S. inflation data release nears. Currently trading at $22.70 (as of 05:36 GMT), the metal has seen fluctuations recently, with an earlier session dipping to near one-month lows. This upcoming data has the potential to significantly sway the Federal Reserve’s perspective on interest rates.

Potential Rate Hikes Concern Silver Enthusiasts

The crux of the anticipation is centered around the U.S. consumer price index (CPI). With the Dow Jones projecting a subtle 0.2% increase, contrasting with the Cleveland Federal Reserve’s more aggressive 0.4% prediction, investors are on the edge. The central concern revolves around U.S. headline core, where a pronounced downtrend could spur the disinflation trend. This could spell good news for silver, traditionally seen as a defense against inflation. But a looming cloud of potential rate hikes might offset its attraction.

Trading Derivatives carries a high level of risk to your capital and you should only trade with money you can afford to lose. Trading Derivatives may not be suitable for all investors, so please ensure that you fully understand the risks involved, and seek independent advice if necessary. A Product Disclosure Statement (PDS) can be obtained either from this website or on request from our offices and should be considered before entering into a transaction with us. Raw Spread accounts offer spreads from 0.0 pips with a commission charge of USD $3.50 per 100k traded. Standard account offer spreads from 1 pips with no additional commission charges. Spreads on CFD indices start at 0.4 points. The information on this site is not directed at residents in any country or jurisdiction where such distribution or use would be contrary to local law or regulation.

September’s Rate Decision: Fed’s Next Move

Broadening the lens to the market sentiment, there’s a prevailing belief that the Fed might abstain from rate hikes this September. Talk in financial circles suggests the next big move might be a rate cut, eyed for spring 2024. Should this occur, combined with an expected dip in the U.S. dollar, silver’s shine might very well return for investors.

Geopolitical Shifts Strengthen Silver’s Position

But silver’s journey isn’t isolated. Noteworthy is the dip in the SPDR Gold Trust, which recently hit a March low. However, a silver lining remains. Recent geopolitical events, underscored by President Biden’s order curbing U.S. investments in China, could cement silver’s pivotal position in the ever-evolving global economic tapestry.

Technical Analysis

4-Hour Silver (XAGUSD)Silver’s current 4-hour price of $22.68 exhibits a marginal rise from the prior 4-hour close at $22.66. While the price hovers just below the 50-4H moving average of $23.59, it’s further distanced from the 200-4H moving average set at $23.75, suggesting a bearish momentum. This sentiment is further validated by the 14-4H RSI standing at 30.99, indicating the metal is nearly in the oversold territory.

The current price lies precariously close to the main support zone, ranging from $22.70 to $22.28, reinforcing potential downside risks. However, the considerable gap between the current price and the primary resistance area (spanning $25.00 to $25.27) underscores a strong resistance level ahead. Given the proximity to the support area, combined with the RSI and moving average data, the short-term market sentiment leans bearish for Silver.

Gold Price Forecast: XAU Eyes CPI Data as Potential Catalyst for Fed Rate Moves

Gold Price Forecast: XAU Eyes CPI Data as Potential Catalyst for Fed Rate Moves

Overview

Gold (XAU) prices remain subdued as investors eagerly anticipate the forthcoming U.S. inflation data, which stands to greatly influence the Federal Reserve’s stance on interest rates.

Spot gold, as of early morning GMT, saw a minor dip of 0.045%, marking a continuity of its near one-month low trend. With U.S. gold futures pegged lower at $1949.20, the market’s attention is riveted to the release of the U.S. consumer price index (CPI) later today, with expectations hinting at a possible slight acceleration in inflation for July.

Trading Derivatives carries a high level of risk to your capital and you should only trade with money you can afford to lose. Trading Derivatives may not be suitable for all investors, so please ensure that you fully understand the risks involved, and seek independent advice if necessary. A Product Disclosure Statement (PDS) can be obtained either from this website or on request from our offices and should be considered before entering into a transaction with us. Raw Spread accounts offer spreads from 0.0 pips with a commission charge of USD $3.50 per 100k traded. Standard account offer spreads from 1 pips with no additional commission charges. Spreads on CFD indices start at 0.4 points. The information on this site is not directed at residents in any country or jurisdiction where such distribution or use would be contrary to local law or regulation.

Cleveland Fed Predicts Assertive CPI Rise

While the Dow Jones consensus estimate projects a modest 0.2% uptick in the CPI for July, the Cleveland Federal Reserve’s Inflation Nowcast model foresees a more assertive 0.4% increase. A primary concern for investors is the core of the U.S. headline. A greater-than-predicted downtrend could strengthen the disinflation trend, offering a much-needed boost for gold, conventionally viewed as an inflationary hedge. However, it’s worth noting that impending rate hikes could diminish the appeal of non-yielding bullion for potential investors.

Traders Not Expecting Fed Rate Hike in September

Current trader sentiment suggests a high probability against a rate hike in the upcoming Fed meeting scheduled for September. Instead, the prevalent expectation leans towards the next significant Fed move being a rate cut, potentially rolling out in the spring of 2023. This shift could rejuvenate gold’s market appeal, contingent on the solidity of the disinflation trend. This, combined with an anticipated U.S. dollar weakness, might restore gold’s allure for investors.

SPDR Gold Trust Holdings Dip

Conversely, SPDR Gold Trust, a major gold-backed exchange-traded fund, has reported a drop in its holdings, hitting its lowest since March. Yet, gold’s standing isn’t entirely bleak. The geopolitical landscape, especially the recent tensions exacerbated by U.S. President Joe Biden’s executive order limiting specific U.S. investments in China, serves as a foundational support for bullion in the volatile global economy.

Technical Analysis

4-Hour Gold (XAUUSD)Gold (XAU) is currently priced at 1917.98, a slight increment from the last 4-hour close of 1916.78. The metal is trading below both the 50-4H moving average of 1938.51 and the 200-4H moving average of 1941.03, suggesting a bearish sentiment in the short to medium term. The 14-4H RSI at 34.40 indicates weakening momentum and is nearing the oversold territory, suggesting potential buying opportunities ahead.

While the price resides just above the main support area of 1914.00 to 1902.75, it’s considerably below the main resistance zone between 1979.00 and 1987.53. Given these technical indicators, the immediate outlook for gold leans bearish, though potential rebounds could be in sight given the nearing oversold conditions.

Gold and Silver’s Response to CPI Scenarios Unveiled

Gold and Silver’s Response to CPI Scenarios Unveiled

Gold, Silver Gauge Market Sentiment

Inflationary pressures in the U.S. have relaxed significantly over the past year, with rates plummeting from an alarming 9% to a more manageable 3%. This development sets the stage for the keenly anticipated consumer price inflation (CPI) report. Particularly, gold and silver prices are in focus, as their performance in response to inflationary movements provides a telling gauge of broader market sentiment.
Scenario 1: CPI Meets Expectations

If the CPI data aligns with the anticipated 0.2% rise, it will consolidate the current trajectory of decelerating inflation, without major shocks to the labor market. Historically viewed as buffers against economic uncertainties, gold and silver could witness an upward rally. This expected data would diminish prospects of an imminent September Fed rate hike, a sentiment further bolstered by potential declines in Treasury yields and the U.S. Dollar. Given their recent retreats, this could instigate a potent short-covering rally in both metals.
Scenario 2: CPI Exceeds Expectations

Should the CPI overshoot its projected rise, this could unsettle the market landscape. Heightened figures might amplify concerns of lingering inflation, potentially prompting the Federal Reserve to reevaluate its interest rate strategy. A more pronounced CPI would enhance the probability of a September Fed rate hike, possibly signaling a November hike as well. Moreover, it might delay any Fed pauses or rate cuts further into 2024, spelling bearish prospects for gold and silver.
Scenario 3: CPI Falls Below Expectations

On the other hand, a CPI that trails predictions can alleviate immediate inflationary apprehensions. Such data could be read as an indication of the economy’s trajectory towards a ‘soft landing’—curbing inflation without jeopardizing economic expansion. This narrative could induce the Fed to halt its rate hikes momentarily and might even foster anticipation of an early 2024 rate reduction. With gold and silver prices hovering at one-month lows, they present appealing entry points, potentially triggering robust short-covering rallies and attracting new buyers.
Core Inflation Rate Demands Vigilance

Yet, amid these scenarios, the “core” inflation rate remains a sticking point. Despite being marginally above the overall inflation rate, its anticipated slow decline calls for attention. By eliminating volatile sectors like food and energy, this metric offers a steadier view of the inflationary milieu, and is bound to keep the Federal Reserve vigilant.
Gold, Silver Fairly Reflect Economic State

Navigating these waters teeming with unpredictability is challenging. While certain Federal Reserve members hint at a cessation to the rate hikes, others postulate the necessity of more hikes to curb inflation. As all eyes turn to the imminent CPI revelation, gold and silver stand sentinel, mirroring the market’s faith, or the lack thereof, in the robustness of the economy.

Japanese Yen Losing Ground to US Dollar, Will USD/JPY Hold at Resistance?

Japanese Yen Losing Ground to US Dollar, Will USD/JPY Hold at Resistance?

The Japanese Yen recently closed at its weakest point against the US Dollar in over a month. In fact, on the daily chart below USD/JPY can be seen reversing the abrupt and short-lived drop that occurred early last month. A closer look shows that the rising trendline from March has been maintaining the broader upside technical focus.

From here, further gains would place the focus on the June high of 145.07. Clearing this price with a confirmatory upside push opens the door to extending the upside focus. That expose the 61.8% Fibonacci retracement level at 148.27 before the October high of 151.94 kicks into focus. Otherwise, in the event of a turn lower, the rising trendline may maintain the upside focus.

image1.png

Zooming in on the 4-hour timeframe can give us a better idea of how short-term price action is setting up. The bullish Golden Cross between the 50- and 100-day Moving Averages (MA) remains in play and has since seen confirmatory upside follow-through. Now, prices are once again testing a push above the 78.6% Fibonacci retracement level of 143.39.

But, just like before, it could be a struggle. Negative RSI divergence shows that upside momentum is fading. This can at times precede a turn lower. Such an outcome would reinforce near-term resistance, undermining the price action seen on the daily chart. In the event of a turn lower, the 50- and 100-period Mas may hold as support, reinstating the upside focus.

image2.png

Euro Technical Outlook – Different Set-Ups for EUR/USD and EUR/JPY

Euro Technical Outlook – Different Set-Ups for EUR/USD and EUR/JPY

EUR/USD TECHNICAL ANALYSIS

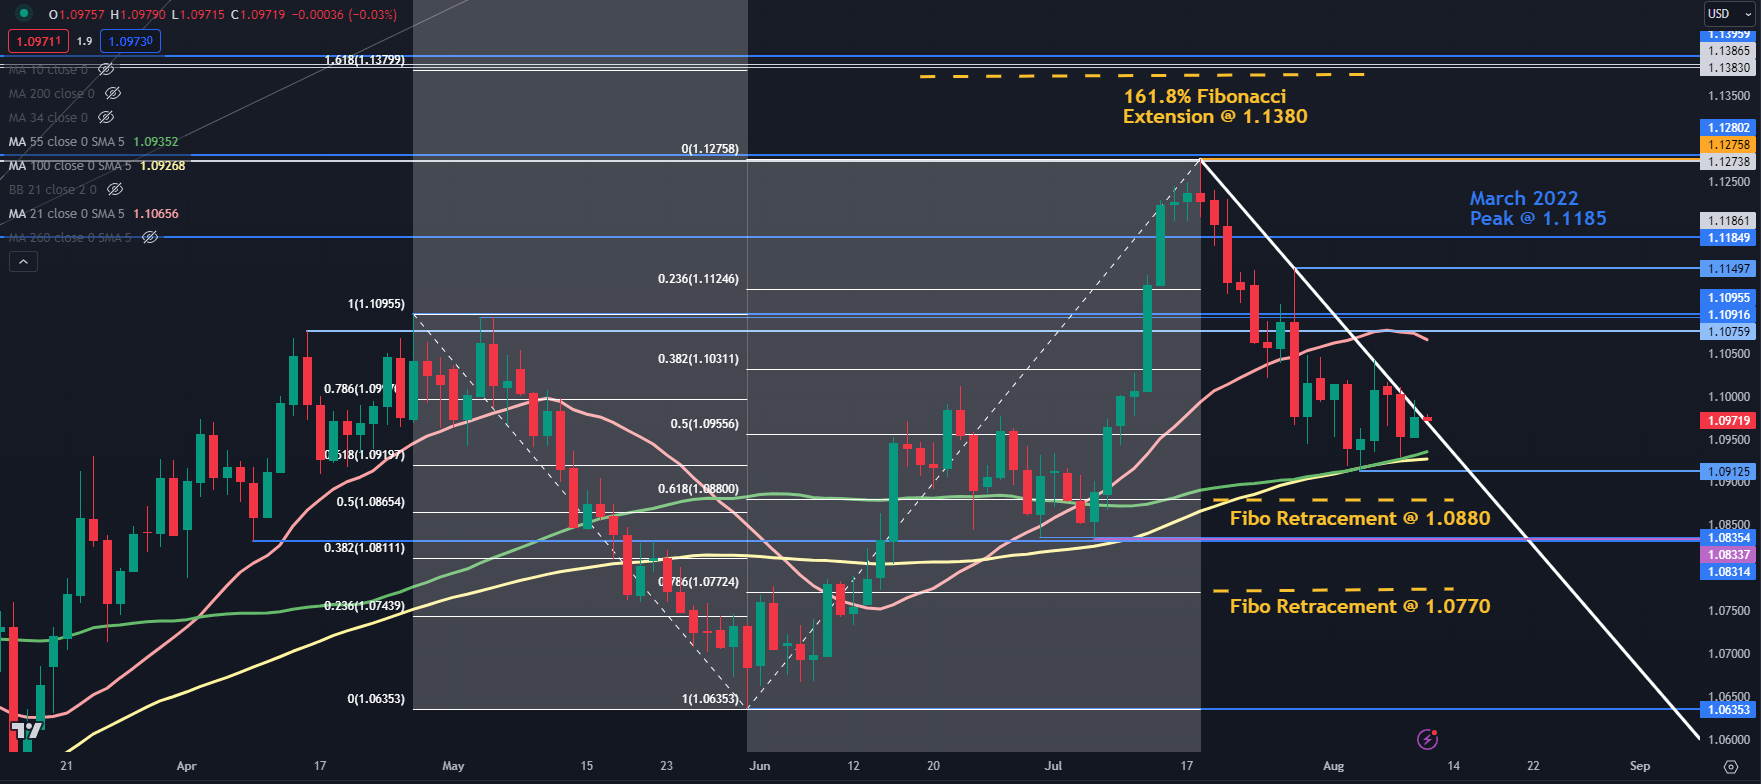
EUR/USD has been testing a descending trend line in the last few sessions, but it is just holding on for now as it continues to trade in a range this week.

Being below the trend line may suggest that near-term bearishness is intact for now, but a close above it could suggest a pause in the trend.

If it was to break above that trend line, it may see a test of potential resistance in the 1.1075 – 1.1095 area where several historical breakpoints reside along with the 21-day simple moving average (SMA) and just ahead of the psychological level at 1.1100.

Further up, resistance could be at the breakpoint from the March 2022 high at 1.1185 or the recent peak at 1.1275, which coincides with two historical breakpoints.

Above those levels, resistance might be at the Fibonacci Extension of the move from 1.1095 to 1.0635 at 1.1380. Just above there are some more breakpoints in the 1.1385 – 95 area.

On the downside, support may lie near the recent low at 1.1010. Just above there the 55- and 100-day SMAs are near 1.1030 and may lend support.

Support could also be near the 61.8% and 78.6% Fibonacci Retracement levels at 1.0880 and 1.0770 respectively.

Between those Fibonacci levels, some prior lows and the breakpoint in the 10830- 1.0835 area may provide support.

EUR/USD DAILY CHART

image1.png

EUR/JPY TECHNICAL ANALYSIS

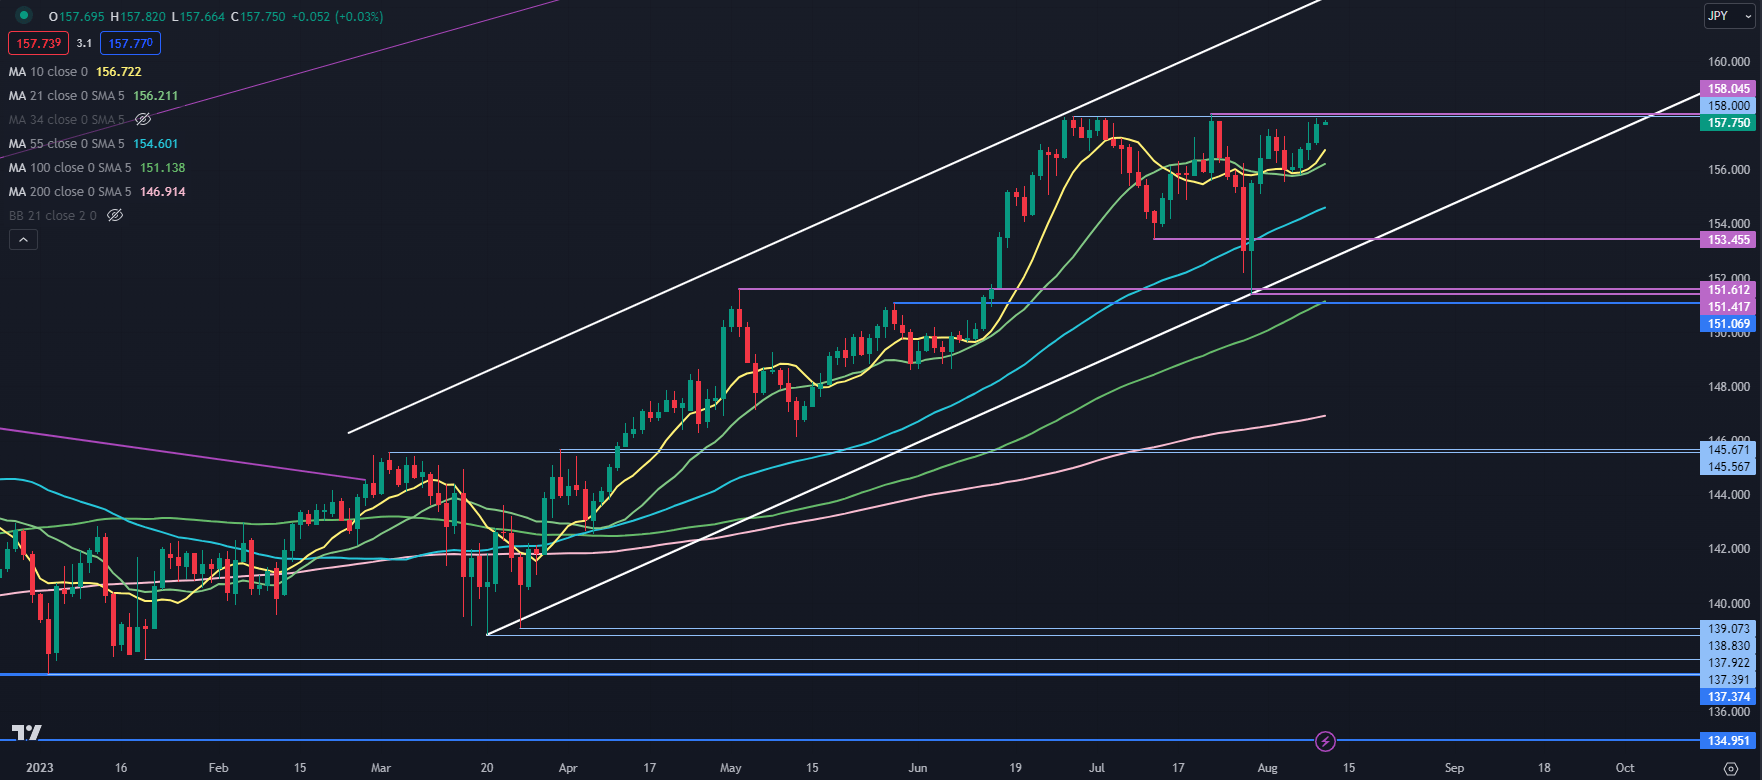
EUR/JPY is within striking distance of last month’s peak at 158.05, which was the highest level seen since September 2008. A month that rattled markets with the onset of the global financial crisis.

EUR/JPY remains within an ascending channel and the bullish trend might be intact for now. To learn more about trend trading, click on the banner below.

A bullish triple moving average (TMA) formation requires the price to be above the short-term simple moving average (SMA), the latter to be above the medium-term SMA and the medium-term SMA to be above the long-term SMA. All SMAs also need to have a positive gradient.

Looking at the 10-, 21-, 55-, 100- and 200-day SMAs, any combination of these will meet the criteria for a TMA, which could suggest that bullish momentum is evolving.

Support may lie at the breakpoint at 153.45 which is near the ascending trend line. A break below there might imply that the bullish run could be ending.

Below there, the 151.40 – 151.60 is a potential support zone with a breakpoint and a prior in the vicinity.

EUR/JPY DAILY CHART

image2.png


Lead-up to US CPI Release Keeps Sentiments in Check: US dollar, Hang Seng Index, Brent Crude

Lead-up to US CPI Release Keeps Sentiments in Check: US dollar, Hang Seng Index, Brent Crude

Market Recap

Wall Street continued its decline for the second straight day (DJIA -0.54%; S&P 500 -0.70%; Nasdaq -1.17%) with growth sectors bearing the brunt of the sell-off once more, as market participants de-risk in the lead-up to the upcoming US Consumer Price Index (CPI) release. Over the past week, the Nasdaq is down 1.2% versus the S&P 500’s -0.6%. Treasury yields were more mixed overnight, with the two-year yields up 5 basis-point (bp), while the 10-year yields settled close to 4% at its latest issuance.

With the US earnings season winding down, the upcoming US CPI data could dictate the trend over coming weeks, largely seen as a key in determining if a September rate hike is needed. The latest consensus suggests that headline inflation is expected to see a pick-up to 3.3% from previous 3%, while the core aspect may remain unchanged at 4.8%. This will be the first time since August 2022, whereby headline inflation moves higher, with abating base effects to kick in over coming months as well. Month-on-month, both headline and core inflation is expected to rise 0.2%.

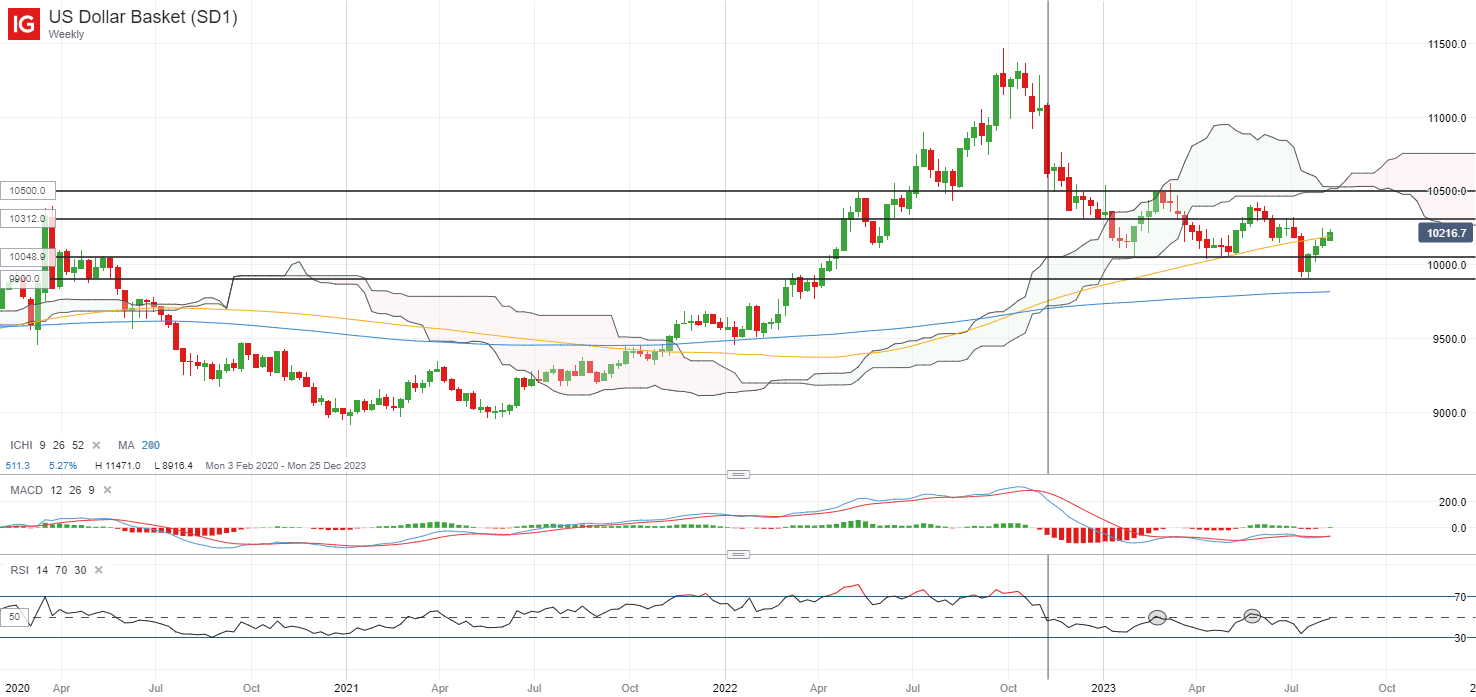
While more data may still be needed to shift policymakers’ views of further tightening needed, any hawkish build-up in rate expectations from any upside inflation surprise may provide an uplift for the US dollar in the near term, while keeping risk sentiments in check. The US dollar will be on watch, having firmed up lately with a 0.5% gain since the start of the week. That said, one to watch may be its weekly RSI, which has failed to cross above its key 50 level since November last year. Failure to overcome the 50 level may still point to the current bounce being a corrective move on its prevailing downward trend. On the upside, the 103.12 level will be a resistance level to watch.

image1.png

Asia Open

Asian stocks look set for a subdued start, with Nikkei -0.13%, ASX -0.06% and KOSPI -0.55% at the time of writing. Sentiments continue to reel in from China’s deflationary story, which largely validates a low-for-longer growth outlook, while recent US orders to ban certain tech investments in China did not offer sentiments much of a break. Nevertheless, downside in Chinese equities seems more contained lately, as market participants seem to be more accustomed to weak China’s economic data over the past months, while focusing on keeping a lookout for any worst-is-over.

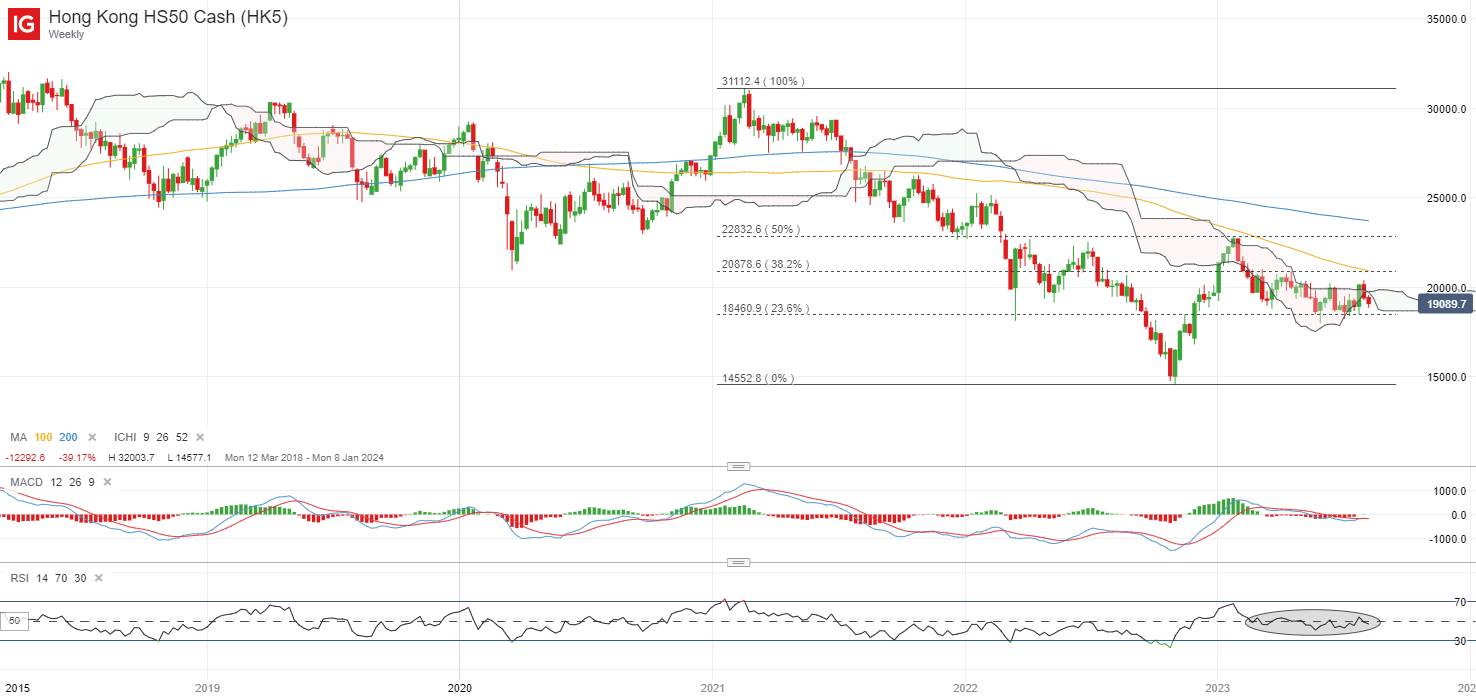
Nevertheless, on the weekly chart, the Ichimoku cloud resistance has once again kept a lid on the Hang Seng Index, with the index briefly crossing its key psychological 20,000 level but failed to find much of a follow-through for now. The weekly RSI continues to hover around the 50 level, potentially denoting some wider indecision in place. On the downside, the 18,460 level will serve as near-term support for the bulls to defend while on the other hand, the 20,000 level is back on the radar as a key resistance to overcome.

image2.png

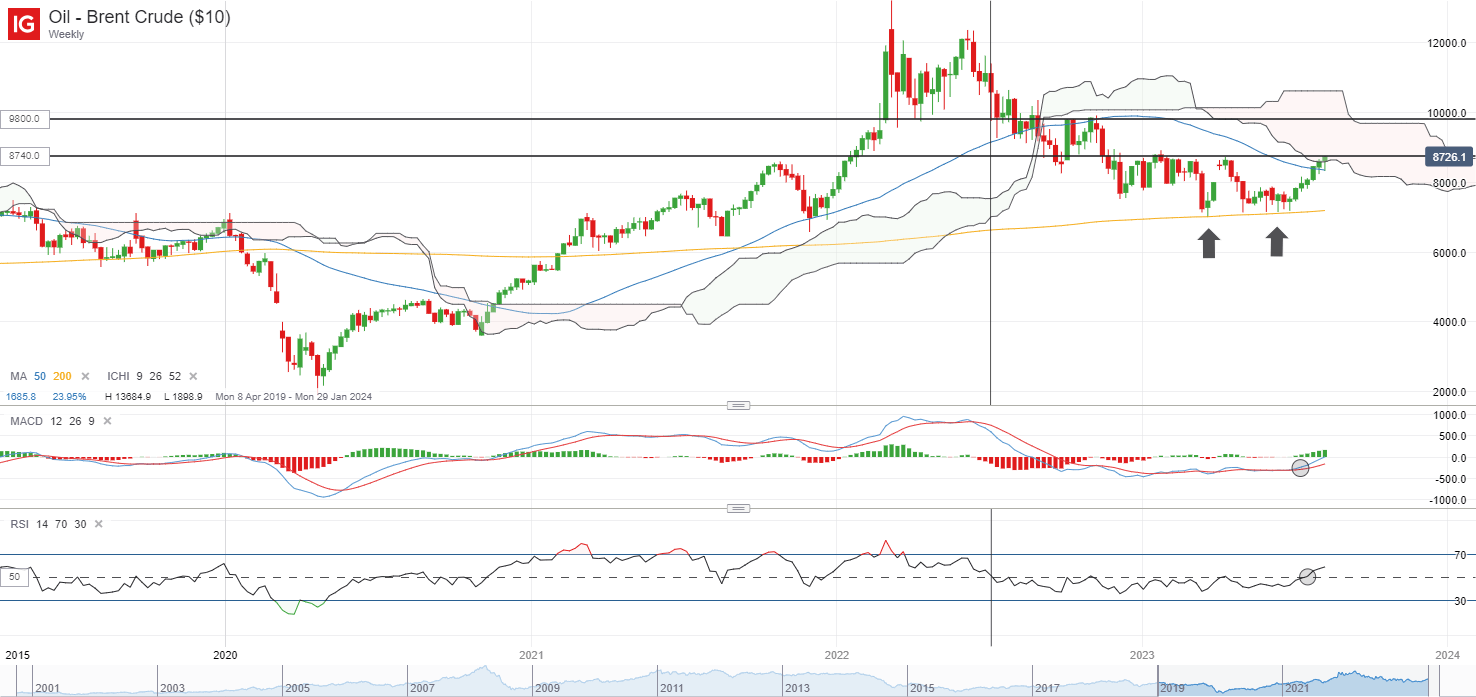
On the watchlist: Brent crude prices above 50 level on weekly RSI for first time since July 2022

Oil prices have been resilient to a weak economic showing out of China in recent weeks, with market participants choosing to place their focus on the tighter supplies conditions from Saudi Arabia and Russia’s output cuts to continue its unwind from previous bearish positioning. Recent tensions in the Black Sea just adds to the list of catalysts for bulls to tap on, coupled with views that a more moderate cooling in economic conditions in other parts of the world may continue to support demand.

With the 15.7% gain since July this year, Brent crude prices are now placing its sight for a retest of its year-to-date high around the US$88.40 level. Having traded in a wide consolidation pattern since November last year, the US$88.40 level also marked the upper bound of the range, with any break higher potentially paving the way to retest the US$98.00 level next. More notably, this also marked the first time since July 2022, where its weekly relative strength index (RSI) has crossed above the key 50 level, which may support hopes of a potential trend reversal to the upside.

image3.png