US Dollar Climbs as Risks Swirl and Sterling Struggles for Traction. Lower GBP/USD?

US Dollar Climbs as Risks Swirl and Sterling Struggles for Traction. Lower GBP/USD?

The US Dollar shot higher going into Wednesday’s session despite Treasury yields dipping as markets appear to be seeking havens in an uncertain environment for global growth.

The demand for US government debt saw the return on the 10-year Treasury note sink below 4.0% before recovering back above it but some way from the 4.20% seen last Friday.

Yesterday saw China’s trade surplus come in larger than anticipated in monetary terms. However, both imports and exports volume dropped significantly, shedding -12.4% and -14.5% respectively year-on-year to the end of July.

Evidence of less economic activity in the world’s second-largest compounded concerns emanating from Moody’s downgrading several US small banks on Monday.

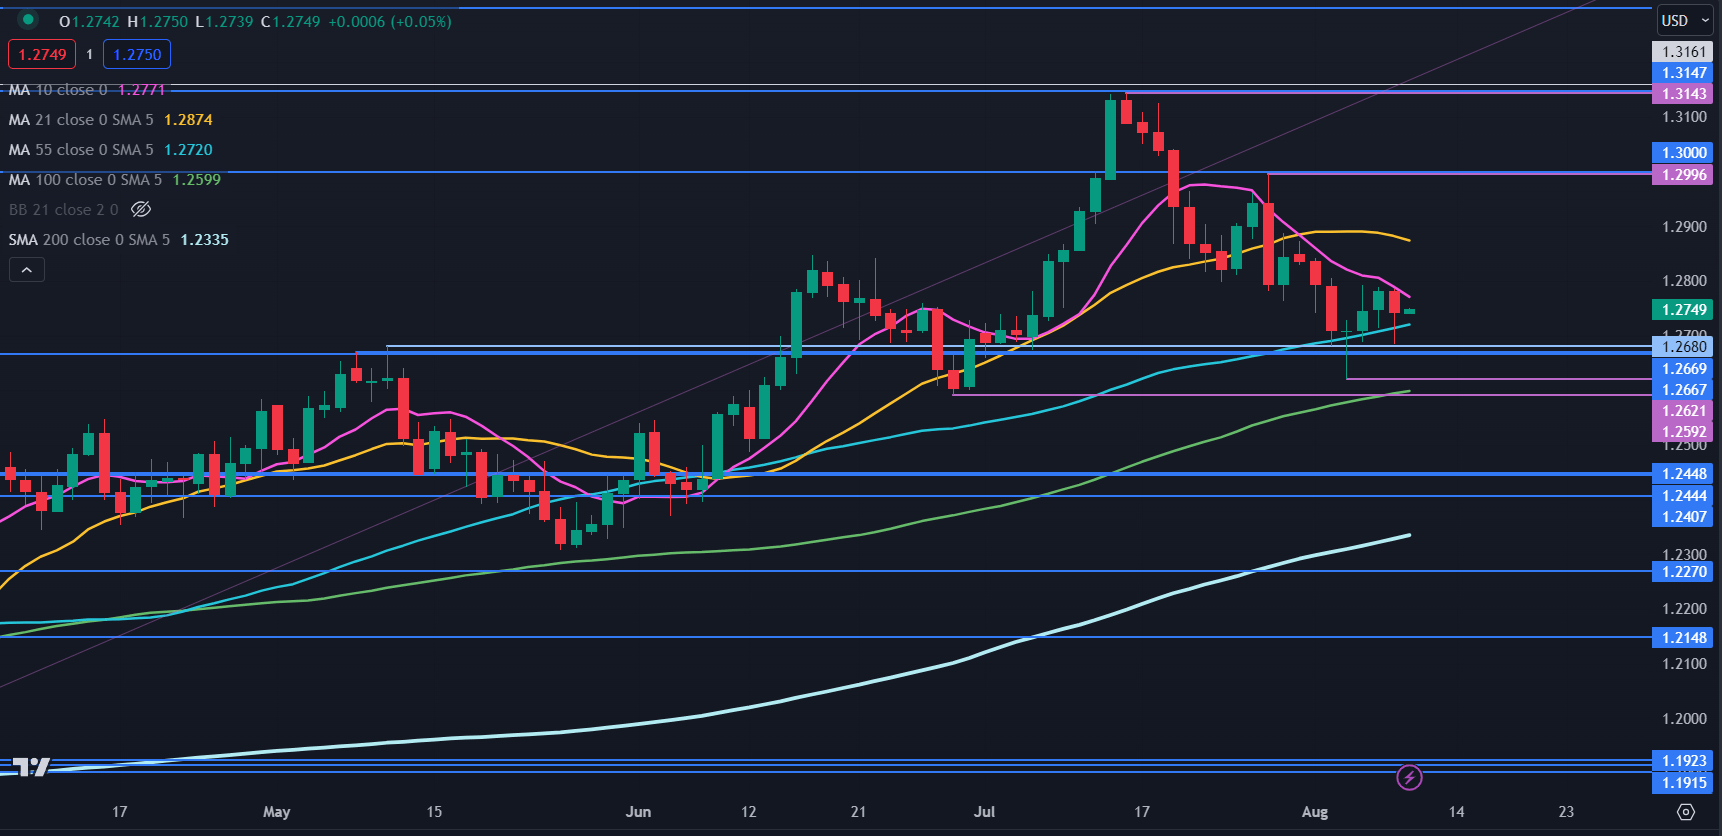
In the melee to buy US Dollars, Sterling threatened to break lower but caught a bid near some support at 1.2680.

A feature of both the Treasury and Gilts markets is the inversion of the 10-year against the 2-year notes. The US is trading near -75 basis points (bp) while the UK is around -50 bp.

When bond markets demand less yield at the back end of the curve, the implication is that difficult economic circumstances could be coming at some stage further down the track.

On the flipside of the negativity, equity markets remain within striking distance of all-time highs, although they have been sliding in August after a stellar rally through July.

For currencies, if perceived risks to global output continue to grow, the US Dollar could see more upside. That could have the potential for GBP/USD to test support levels again.

GBP/USD TECHNICAL ANALYSIS SNAPSHOT

GBP/USD made a low at 1.2685 yesterday, which was just above the historical breakpoints in the 1.2670 – 1.2680 area and those levels may continue to provide support.

Below there, the recent lows near 1.2620 and 1.2590 might provide support. The latter currently coincides with the 100-day simple moving averages (SMA) that could add impetus.

Looking at the SMAs, the price is above the 55-, 100- and 200-day SMAs that all have positive gradients, while it is below the 10- and 21-day SMAs that have negative slopes.

This might suggest that near-term bearish momentum is unfolding but that medium and long-term bullish momentum remains intact for now.

On the topside, resistance could be near the recent peak at the psychological level of 1.3000, which concurs with a historical breakpoint.

Further up, the 16-month high of 1.3142 is also just below some breakpoints in the 1.3150 – 1.3160 area and may offer a resistance zone.

Overall, GBP/USD appears to be caught in a wide range. Click on the banner for more information on range trading.

image1.png


How Do the US Dollar, Gold, S&P 500, and More Trade at the Onset of Recessions?

How Do the US Dollar, Gold, S&P 500, and More Trade at the Onset of Recessions?

The onset of recessions in the United States typically results in reoccurring financial market trading patterns. While not all of them will be the same, we can look back and see how key assets have performed. This is a special report that analyzes how the US Dollar, gold, S&P 500, Australian Dollar and 10-year Treasury yield traded during the first 3 months of economic downturns.

The length and severity of each recession will vary. This means the usual reaction you might expect from an asset during the onset of a downturn will not always repeat perfectly. For example, during the 2000s housing crash, the US entered a recession in Q4 of 2007. While the stock market declined during these 3 months as one might have expected, peak market volatility occurred much later towards the end of 2008.

Before diving into this topic, I need to set the ground rules, starting with the definition of a recession. In this study, I will be using a GDP-based recession indicator, which attempts to assign dates to downturns based on a mathematical model. This is as opposed to the NBER’s Business Cycle Dating Committee playbook, which can at times be subjective. You can learn more about the indicator I am referencing here.

This definition is also different from the widely referenced two consecutive quarters of negative growth, which is unofficial and often too simplistic, failing to capture other economic trends. For example, in 2022, the economy experienced 2 quarters of negative growth in Q1 and Q2. But, the labor market outperformed.

For analyzing the US and Australian Dollars, I will be using a correlation-weighted currency index instead of an exchange rate. This helps us capture the broader direction of a currency against the world rather than any individual unit. Otherwise, comparing AUD/USD with the DXY Dollar Index runs the risk of placing too much emphasis on the greenback.

Average Snapshot

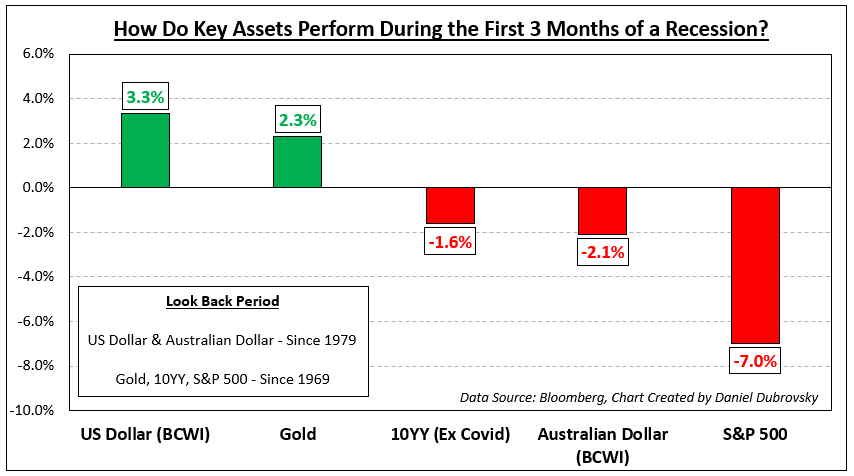
The chart below is a snapshot of how these assets performed during the onset of recessions ordered from best performing to the worst. The sequence is as follows: US Dollar, gold, 10-year Treasury yield, Australian Dollar and S&P 500. The availability of currency data meant I could only look back to 1979. For the rest of the assets, I was able to look back to 1969. The remainder of this article breaks down the individual performance beginning with the US Dollar.
Average Snapshot

US Dollar

Looking back to recessions since 1979, which adds up to 6, the Bloomberg Correlation-Weighted US Dollar Index rose 3.3% on average in the first 3 months of economic downturns. That is not to say each time it climbed. The up/down ratio is 50%. But, as you can see in the chart below, when the dollar rallies, it tends to do so strongly. During periods when the currency fell, the downside reaction was much weaker. This should come as little surprise. In the currency spectrum, the US Dollar functions as a haven given its status as the world’s reserve currency.

US Dollar

Gold

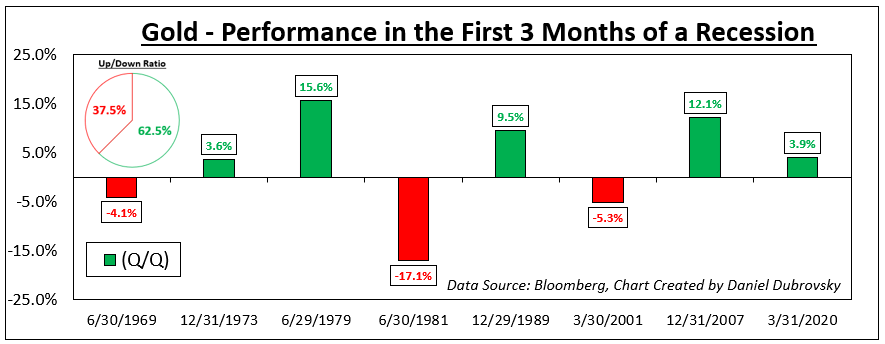
Meanwhile, gold also tends to perform decently at the onset of recessions going back to 1969. On average, the yellow metal returned +2.3% with a win/loss ratio of about 62.5%. Like the US Dollar, the wins were stronger than your average losses, excluding the early 1980s recession (-17.1%). Does this make gold a haven? Remember that gold is not as liquid as a currency. XAU/USD tends to function as an anti-fiat instrument. When the return on cash dwindles, which is what usually happens during recessions, gold becomes relatively more attractive and vice versa.
Gold

10-Year Treasury Yield

From this point forward, we are moving on to assets that underperform. Since 1969, the 10-year Treasury yield has declined by -1.6% on average during the onset of recessions (excluding Covid, which was a major negative outlier that skews the mean). Factoring in Covid though, the up/down ratio is about 29%. Bonds tend to receive a high amount of demand during economic uncertainty due to perceived safety, pushing up the price at the cost of yields.

10-Year Treasury Yield

Australian Dollar

Looking at the Bloomberg Correlation-Weighted Australian Dollar Index, the Aussie returned on average -2.1% during the first 3 months of a US recession since 1979. AUD also has a depressingly low win/loss rate of 16.7%. In currency markets, the Aussie is known for its sentiment-linked status, often closely following equities. Australia’s economy is closely tied to the global business cycle due to commodity exports, making it important to watch growth in the United States. When the latter sneezes, the world can catch a cold, driving up market volatility and negatively impacting the Australian Dollar.

Australian Dollar

S&P 500

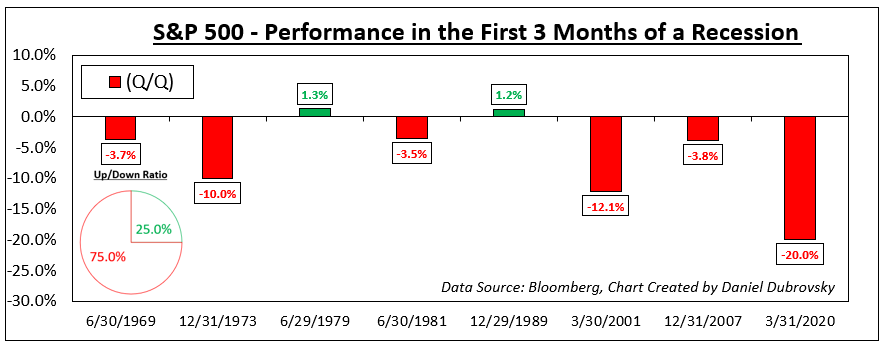
Finally, we arrive at the S&P 500, which is one of the key US benchmark stock indices. Unsurprisingly, the S&P 500 has returned on average -7.0% at the onset of recessions since 1969. But, unlike the Australian Dollar, the win/loss ratio is slightly better at 25%. This is unsurprising. Depending on the severity of the recession, uncertainty plays a key role in how much the stock market declines and how fast it does.

Recessions raise the risk that companies can go out of business and/or lay off workers, resulting in stock market crashes. Often, a bubble popping can lead to a recession, such as the dotcom bust in the early 2000s and the housing market leading in 2008. There are also leading indicators of a recession that you might be interested to learn about.

S&P 500

Australian Dollar Finds Footing Despite Evolving China Concerns. Is AUD/USD Range Bound?

Australian Dollar Finds Footing Despite Evolving China Concerns. Is AUD/USD Range Bound?

The Australian Dollar steadied today after making a two-month low yesterday on a stronger US Dollar and amid growing concerns for the outlook of its major trading partner, China.

Year on year Chinese CPI turned negative for the first time since early 2021, coming in at -0.3%. At the same time, PPI printed below forecasts at -4.4% year on year to the end of July.

Today’s data comes on the back of disappointing trade data yesterday that saw both imports and exports shrink dramatically.

Compounding matters undermining market sentiment, one of China’s larger companies, Country Garden, defaulted on US Dollar bond coupon payments. They were due over the weekend and have not been paid as of Tuesday, although there is a 30-day grace period.

Last month’s Politburo gathering inspired some hope toward Beijing implementing measures to stoke the flames of growth.

There appears to be a degree of anticipation toward action from the Central Government before markets can be convinced that a turnaround for the world’s second-largest economy will materialise.

In any case, APAC equities have had a benign day with most indices slightly lower although Korea’s Kospi index was the only bright spot, gaining over 1%.

Futures are pointing toward Wall Street starting their cash session at levels close to where they left it yesterday.

In a similar vein, currency markets have been somewhat subdued to start Wednesday. The US Dollar has mostly held onto overnight gains.

At the time of going to print, gold has nudged slightly higher while crude oil has slipped a touch. Live prices can be found here.

Treasury yields are little changed today after dipping in the North American trading day, particularly from 5 years and beyond.

Later today the US will see some data on mortgage applications.

The full economic calendar can be viewed here.

AUD/USD TECHNICAL ANALYSIS

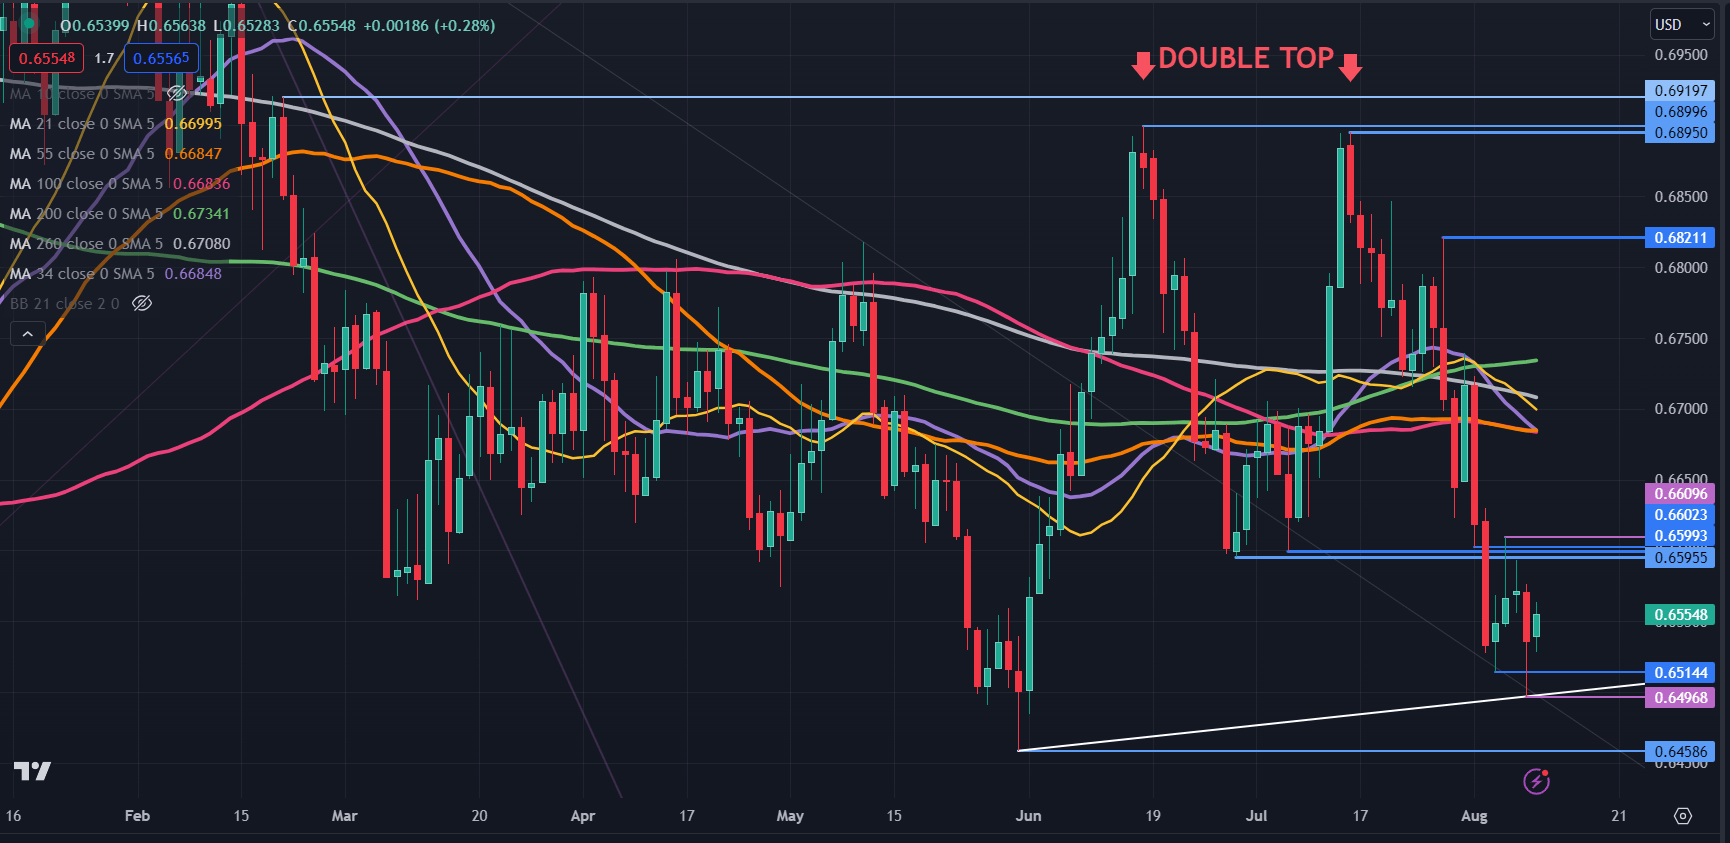
Overall, AUD/USD remains in the six-month trading range of 0.6459 – 0.6900.

Nearby resistance could be at a cluster of breakpoints in the 0.6595 – 0.6600 area ahead of the SMAs.

On the downside, support might be near the recent lows of 0.6514 and 0.6459.

The price remains below 21-, 34-, 55-, 100-, 200- and 260-day simple moving averages (SMA).

Technicians would typically note this as potentially bearish. However, they all lie between 0.6683 and 0.6734, a historically narrow range of around 50 tics.

The price action seems to have been gravitationally pulled toward them recently and if the range holds, they might cross the SMAs yet again.

image1.png


British Pound (GBP) Latest: EUR/GBP and GBP/NZD Outlooks

British Pound (GBP) Latest: EUR/GBP and GBP/NZD Outlooks

Sterling pairs have been quiet of late after the recent BoE meeting. On Friday the latest UK GDP figures are released, while next week heavyweight employment, inflation, and retail sales data will need to be closely followed.

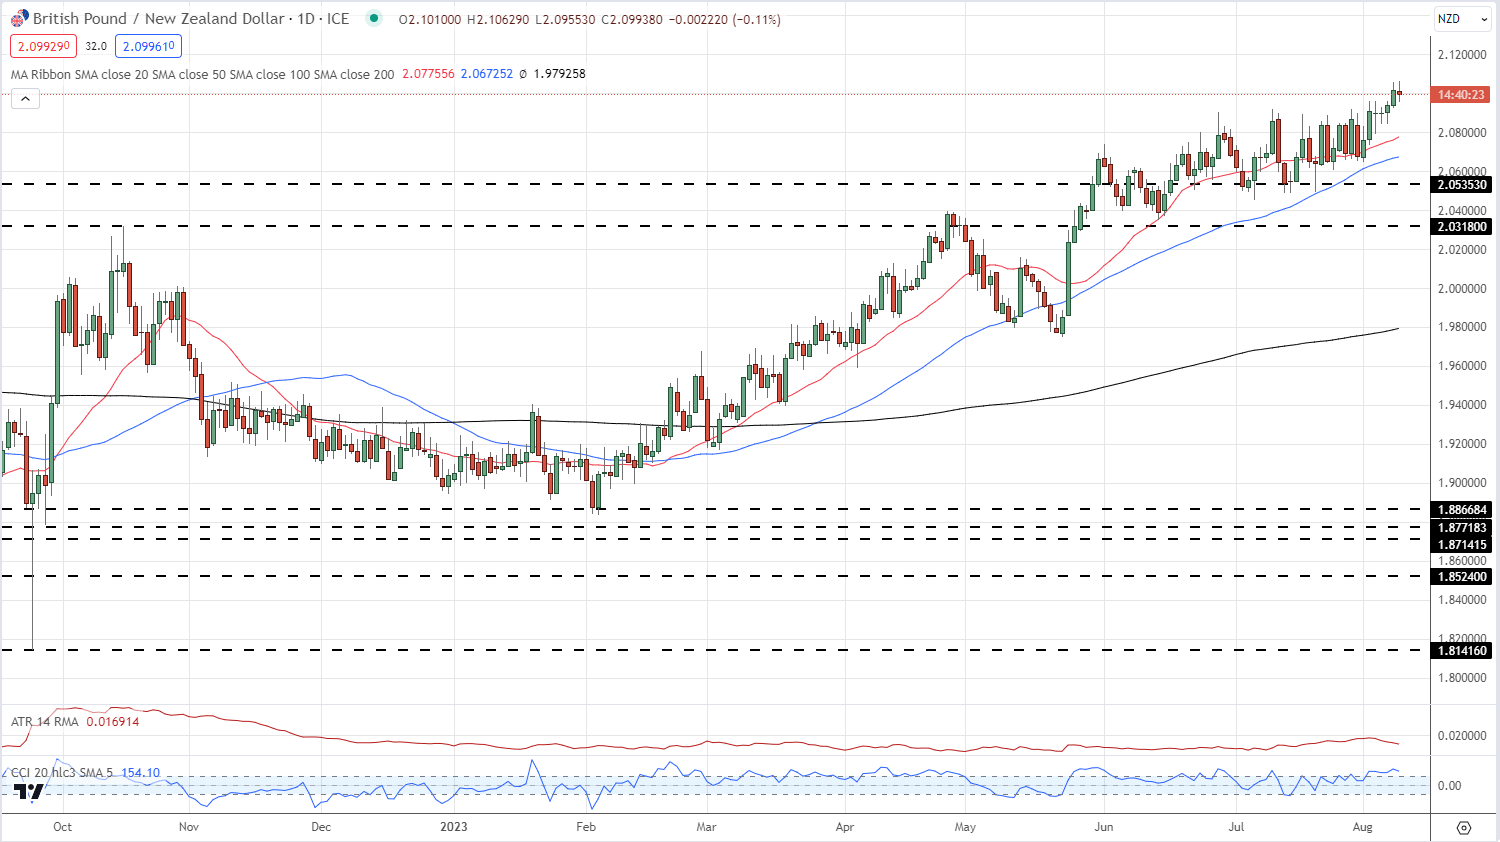
GBP/NZD continues to grind higher and is touching highs last seen back in March 2020. The pair have moved higher since February this year on diverging central bank policy and while one technical indicator (CCI) suggests that the pair are overbought, the short- and medium-term term outlook remains positive.

Looking at the daily chart, GBP/NZD continues to print a series of higher lows and higher highs, while the 20- and 50-day moving averages are seen propping up the move higher. A 50-day/200-day golden cross made in late March has added to the positive sentiment in the pair. Any pullback in the pair should be relatively minor with a block of recent highs and lows in July acting as a support zone. With little in the way of resistance, the pair may continue to nudge higher.

GBP/NZD Daily Price Chart – August 9, 2023

image1.png

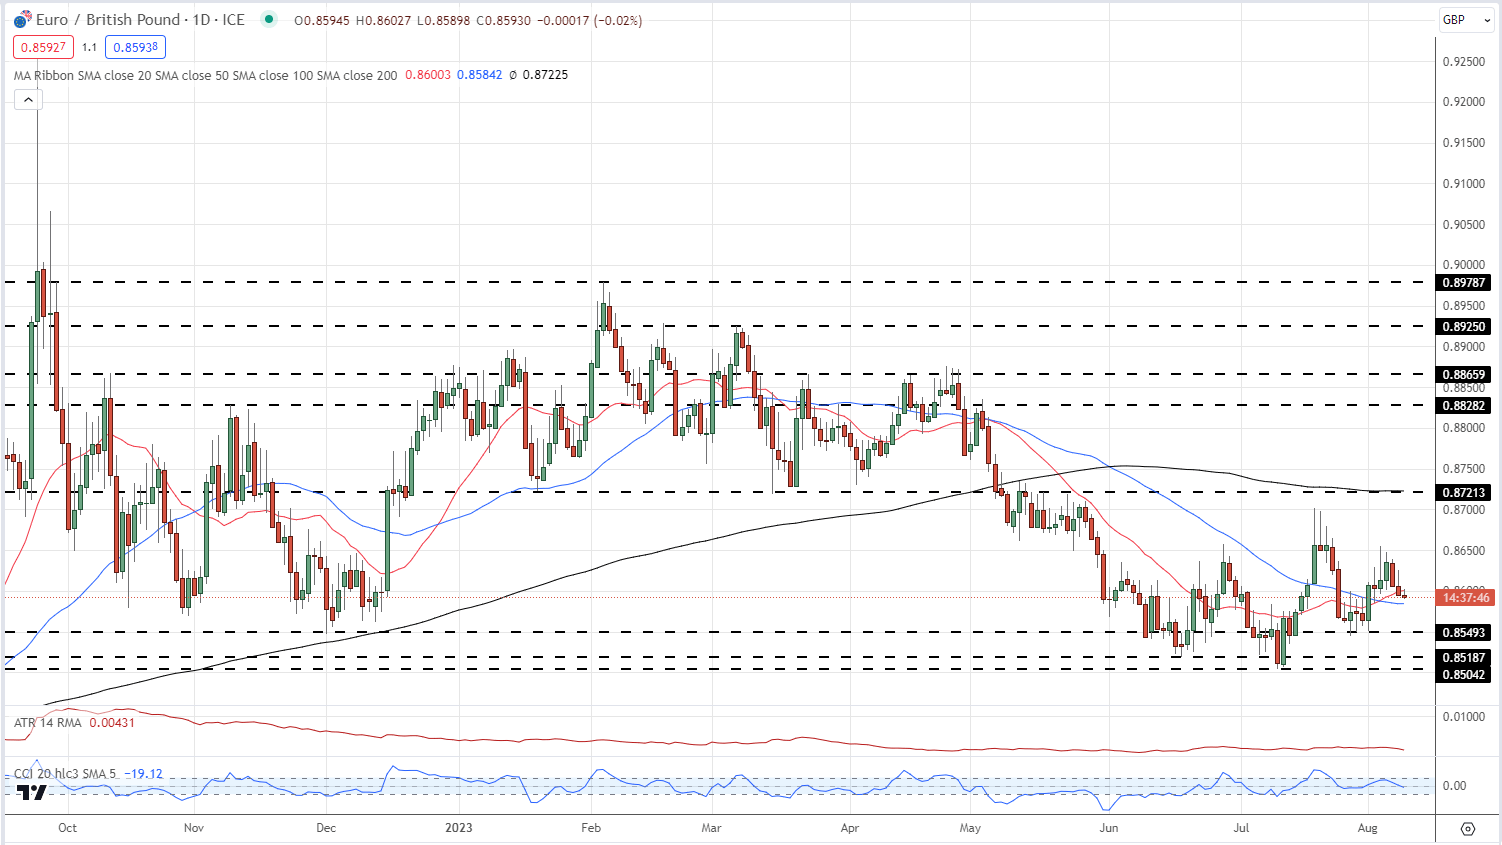
In contrast to GBP/NZD, another British Pound pair, EUR/GBP, remains locked in a range with little reason at the moment to attempt a breakout. The range between 0.8504 and 0.8721 has held for nearly three months, while the pair have started to narrow this range recently. Resistance at 0.8721, originally formed off a prior level of support, is strengthened by the 200-day simple moving average that currently sits just above at 0.8722. The daily charts outlook is not helped by the recent 20-day and 50-day crossover, while the CCI indicator shows that the pair is neither overbought nor oversold. The current range is likely to persist unless a fundamental driver appears.

Learn More About Range Trading by Downloading the Range Trading Guide Below

EUR/GBP Daily Price Chart – August 9, 2023

image2.png

Retail trader data shows 59.44% of traders are net-long with the ratio of traders long to short at 1.47 to 1.

For a More Detailed Look at Daily and Weekly Changes in EUR/GBP and What it Means for Sentiment, Download the Free IG Client Sentiment Guide


Gold Prices Now are Now Sitting at Pivotal Support Following Steady Losses

Gold Prices Now are Now Sitting at Pivotal Support Following Steady Losses

Daily Chart

Following cautious losses since the middle of July, gold now finds itself sitting right on the rising trendline from February – see chart below. Clearing this line could open the door to an increasingly bearish technical bias. That exposes the 38.2% Fibonacci retracement level at 1903, which is also closely aligned with lows from June.

Furthermore, a bullish Golden Cross between the 20- and 50-day Moving Averages (MA) is being undermined by recent price action. If losses continue, this would have turned out as a false signal. As such, the yellow metal could soon be on the verge of a broader reversal when looking back to upside progress made between November through early May.

With that in mind, let us take a closer look at the 4-hour time frame to see how the near-term technical landscape is shaping up.

Daily Chart

4-Hour Chart

On the 4-hour chart below, the near-term downtrend can be seen better. A descending trendline seems to be holding as support, offering a steady descent. Meanwhile, a bearish Death Cross between the 50- and 100-period Mas formed towards the beginning of this month, hinting at downside price action to come.

Positive RSI divergence does appear to be showing that downside momentum is fading. This is as XAU/USD tests the 61.8% Fibonacci retracement level in this timeframe. But, it would likely take breaching above the 50- and 100-period MAs to reinstate a near-term bullish technical perspective. Such a case places the focus on the 23.6% level at 1965 before the July high of 1987 kicks in.

image2.png

Crypto Encouraged Again by Banks’ Woes

Crypto Encouraged Again by Banks’ Woes

Crypto Gains Amid Banking Concerns

The crypto market has added 1.4% in the past 24 hours to $1.18 trillion. The positive momentum can be tied to a new wave of concerns about banks following Moody’s downgrade of ten mid-sized US banks and an unexpected Italian windfall tax. Investors are piling into the largest cryptocurrencies to preserve large amounts of capital to stay far from the banks, where deposit guarantees apply to not-so-large sums.

Bitcoin 4 hour chartBitcoin added over 3% throughout Tuesday with a mini short-squeeze in low-liquidity morning trading briefly taking the price above $30K before pulling back to $29.7K by the time of writing. Bitcoin could maintain a negative correlation with bank stocks’ performance, benefiting from their downturn. However, without actual industry bankruptcies, this is akin to a knee-jerk reflex with a short-lived impact.

Trading Derivatives carries a high level of risk to your capital and you should only trade with money you can afford to lose. Trading Derivatives may not be suitable for all investors, so please ensure that you fully understand the risks involved, and seek independent advice if necessary. A Product Disclosure Statement (PDS) can be obtained either from this website or on request from our offices and should be considered before entering into a transaction with us. Raw Spread accounts offer spreads from 0.0 pips with a commission charge of USD $3.50 per 100k traded. Standard account offer spreads from 1 pips with no additional commission charges. Spreads on CFD indices start at 0.4 points. The information on this site is not directed at residents in any country or jurisdiction where such distribution or use would be contrary to local law or regulation.


Technically, the market made its second failed attempt this month to get back above the 50-day average. The ability to consolidate above $30K will be a milestone, cementing the breaking of the downtrend of the last four weeks.

Crypto News

Kaiko is talking about the return of the “Stablecoin Wars” amid massive USDT selling. Consequently, the USDT exchange rate has fallen below its target peg to the dollar for the past few days.

According to DEXTools, at least 66 fake PayPal USD (PYUSD) stablecoins have appeared online, launched on Monday by the payment system PayPal. Some crypto enthusiasts have taken a negative view of PayPal’s initiative. Others are positive about the new coin’s impact on the Ethereum blockchain in the context of its wider adoption.

So far this year, 97 out of 700 cryptocurrency funds have closed, according to a report by 21e6 Capital. In the first half of the year, the average return of such organisations was just 15.2%, while Bitcoin rose 83.3% over the same period.

According to CoinGecko, MetaMask was the most popular non-custodial wallet, with over 22.66 million installations in 2023. This is followed by Coinbase Wallet, Trust Wallet and Blockchain.com Wallet, with at least 10 million installations each.

Oil Price Forecast: China’s Sluggish Recovery Dampens Oil Price Optimism

Oil Price Forecast: China’s Sluggish Recovery Dampens Oil Price Optimism

Overview

Oil prices are lower in the Asian markets on Wednesday, primarily due to growing concerns over China’s decreased demand – the world’s top crude importer. The descent in demand is being attributed to the disheartening trade and inflation data from China, which seems to overshadow the market optimism around tightened supplies following production cuts from major exporters such as Saudi Arabia and Russia.

At 05:17 GMT, Light Crude Oil futures are trading $79.46, down $0.07 or -0.09%. The U.S. benchmark posted an approximate $1 gain the previous session.

Advertisement
Know where WTI Crude Oil is headed? Take advantage now with

Trading Derivatives carries a high level of risk to your capital and you should only trade with money you can afford to lose. Trading Derivatives may not be suitable for all investors, so please ensure that you fully understand the risks involved, and seek independent advice if necessary. A Product Disclosure Statement (PDS) can be obtained either from this website or on request from our offices and should be considered before entering into a transaction with us. Raw Spread accounts offer spreads from 0.0 pips with a commission charge of USD $3.50 per 100k traded. Standard account offer spreads from 1 pips with no additional commission charges. Spreads on CFD indices start at 0.4 points. The information on this site is not directed at residents in any country or jurisdiction where such distribution or use would be contrary to local law or regulation.

Market Facing Headwinds

However, the trading action so far this week suggests that oil prices might find it challenging to ascend further. This sentiment stems from worries regarding a slow-paced recovery in China’s economy combined with looming concerns about decelerated demand in the U.S. and Europe due to prospective interest rate hikes. Forecasts suggest that WTI might oscillate between $75 to $85 a barrel in the upcoming weeks.

Signs of a Slowdown in China

Backing these concerns, recent Chinese data indicated a drop in the consumer price index for July, the first annual decline since February 2021. This suggests China’s tentative economic recovery post-pandemic is slowing down. Further amplifying these concerns is data that portrays an 18.8% monthly decrease in China’s crude oil imports for July. This marks the lowest daily rate since January, attributable to significant export reductions and rising domestic stocks.

Mixed Future Supply/Demand Situation

In contrast to the bearish trends, the benchmarks marked their sixth consecutive weekly gains last week. This was propelled by reduced OPEC+ supplies and anticipated Chinese economic stimulus aimed at enhancing oil demand recovery. Additionally, the U.S. Energy Information Administration’s (EIA) report highlighted an anticipated rise in U.S. crude oil production to a record 12.76 million bpd by 2023.

Short-term Outlook:  Slowing Momentum

Despite the extended production cuts by major players like Saudi Arabia and a general uptick in global demand, oil markets seem bearish. The primary influencing factor remains China’s slowing demand, casting a shadow over the optimistic supply cut measures. The immediate future might witness steady or slightly declining oil prices.

Technical Analysis

4-Hour Crude OilThe current 4-hour price of Crude Oil stands at $82.74, a slight decrease from the previous 4-hour close of $82.82. When analyzing the moving averages, the current price is above the 200-4H moving average of $75.55, indicating bullish momentum. Conversely, the price is slightly above the 50-4H moving average of $81.36, reinforcing the bullish sentiment. The 14-4H RSI registers at 57.95, suggesting a moderately strong momentum.

In terms of support and resistance levels, the market is well above support at $79.05 to $78.29, while testing the main resistance area at $81.73 to $83.63.

Although the market has been struggle with the resistance area this week, the sentiment is still bullish on the 4-hour chart.  This scenario could change, however, if the 50-4H moving average fails as support.

AUD to USD Forecast: Sub-$0.65 in Play on China PPI Numbers

AUD to USD Forecast: Sub-$0.65 in Play on China PPI Numbers

On Tuesday, the AUD/USD fell by 0.45% to end the day at $0.65437. A larger-than-expected slide in China imports and exports sent the AUD/USD south.

This morning, there are no economic indicators from Australia to influence. However, consumer price inflation and producer price index numbers from China will impact the appetite for the Aussie dollar.

Trading Derivatives carries a high level of risk to your capital and you should only trade with money you can afford to lose. Trading Derivatives may not be suitable for all investors, so please ensure that you fully understand the risks involved, and seek independent advice if necessary. A Product Disclosure Statement (PDS) can be obtained either from this website or on request from our offices and should be considered before entering into a transaction with us. Raw Spread accounts offer spreads from 0.0 pips with a commission charge of USD $3.50 per 100k traded. Standard account offer spreads from 1 pips with no additional commission charges. Spreads on CFD indices start at 0.4 points. The information on this site is not directed at residents in any country or jurisdiction where such distribution or use would be contrary to local law or regulation.

Softer consumer price inflation and a less marked decline in the producer price index should provide price support. Economists forecast consumer prices to fall by 0.5% in July year-over-year after stalling in June. However, economists expect the producer price index to fall by 4.0% year-over-year versus a 5.4% decline in June.

On Tuesday, trade data from China highlighted the weak demand environment suggesting further downward pressure on producer prices and a decline in consumer prices.

Inflation figures from China are a barometer for inflation in developed and developing economies. However, disinflation reflects weak demand as goods producers compete for fewer business opportunities. The impact of economic data on the Aussie dollar is significant. Falling prices stemming from increased competition for new business reflects a deterioration in the macroeconomic environment.

The Australian economy is dependent upon China for trade. Notably, the Australian trade – GDP ratio stood at 45.8% in 2019 before declining as global trade terms deteriorated. As an exporter of commodities, weak global demand would adversely affect the Australian trade balance, the economy, and the Aussie dollar. Importantly, trade provides circa 20% of Australian jobs, a material consideration for the RBA.

The US Session

There are no US economic indicators to move the dial this afternoon. However, investors should monitor the news wires for Fed chatter with the media ahead of the US CPI Report out on Thursday.

AUD/USD Price Action

Daily Chart

The Daily Chart showed the AUD/USD hover at the upper level of the $0.6545 – $0.6526 support band. Significantly, the Aussie remained below the 50-day ($0.66797) and 200-day ($0.67370) EMAs, sending bearish near and longer-term price signals.

The 50-day EMA fell further from the 200-day EMA, sending bearish price signals.

Looking at the 14-Daily RSI, the 37.47 reading signals a bearish trend and supports a fall through the 0.6545 – 0.6526 support band to sub-$0.65. However, an AUD/USD move through the $0.6600 – $0.6620 resistance band would give the bulls a run at the $0.6680 – $0.6700 resistance band and the 50-day EMA ($0.66797).

AUD to USD Daily Chart sends bearish price signals.
AUDUSD 090823 Daily Chart

4-Hourly Chart

Looking at the 4-Hourly Chart, the AUD/USD hovers at the upper level of the $0.6545 – $0.6526 support band. Significantly, the AUD/USD remains below the 50-day ($0.66011) and 200-day ($0.66786) EMAs, sending bearish near and longer-term price signals.

The 50-day EMA pulled back from the 200-day EMA, supporting a fall through the $0.6545 – $0.6526 support band. However, an AUD/USD move through the lower level of the $0.6600 – $0.6620 resistance band and the 50-day EMA ($0.66011) would give the bulls a run at $0.6650.

Looking at the 14-4H RSI, the 42.89 reading reflects the bearish trend, with selling pressure outweighing buying pressure. The RSI aligns with the EMAs, signaling a fall through the $0.6545 – $0.6526 support band to sub-$0.65.

4-Hourly Chart affirms bearish trends.
AUDUSD 090823 4-Hourly Chart
EUR/USD Remains at Risk of Sub-$1.09 with the US CPI Report in Focus

EUR/USD Remains at Risk of Sub-$1.09 with the US CPI Report in Focus

On Tuesday, the EUR/USD fell by 0.42% to wrap up the day at $1.09563. Trade data from China and softer inflation figures from Germany left the EUR/USD in negative territory.

Today, there are no euro area economic indicators to draw interest. The lack of economic indicators will leave the EUR/USD in the hands of market risk sentiment and central bank chatter.

Trading Derivatives carries a high level of risk to your capital and you should only trade with money you can afford to lose. Trading Derivatives may not be suitable for all investors, so please ensure that you fully understand the risks involved, and seek independent advice if necessary. A Product Disclosure Statement (PDS) can be obtained either from this website or on request from our offices and should be considered before entering into a transaction with us. Raw Spread accounts offer spreads from 0.0 pips with a commission charge of USD $3.50 per 100k traded. Standard account offer spreads from 1 pips with no additional commission charges. Spreads on CFD indices start at 0.4 points. The information on this site is not directed at residents in any country or jurisdiction where such distribution or use would be contrary to local law or regulation.

While the economic calendar is on the light side, no ECB Executive Board Members are on the calendar to speak today. However, investors should monitor the news wires for ECB chatter with the media.

Before the European opening bell, consumer price inflation and producer price index numbers from China set the tone.

Inflation figures from China set the tone ahead of the European opening bell.

Consumer prices fell by 0.3% year-over-year in July after stalling in June. Economists forecast a 0.4% decline, signaling weak consumer demand. However, consumer prices increased by 0.2% in July, reversing a 0.2% decline in June. Economists forecast a 0.1% increase.

However, the producer price index fell by 4.4% year-over-year, following a 5.4% decline in June. Economists forecast a 4.1% decline.

While the producer price index declined at a less marked pace in July, the 4.4% fall reflected the ongoing weakness in global demand, aligned with the July Caixin manufacturing PMI and the latest import and export figures. Nonetheless, a possible bottoming out and a pickup in consumer prices should provide some comfort.

The US Session

There are no US economic indicators to move the dial this afternoon. However, investors should monitor the news wires for Fed chatter with the media ahead of the US CPI Report out on Thursday.

EUR/USD Price Action

Daily Chart

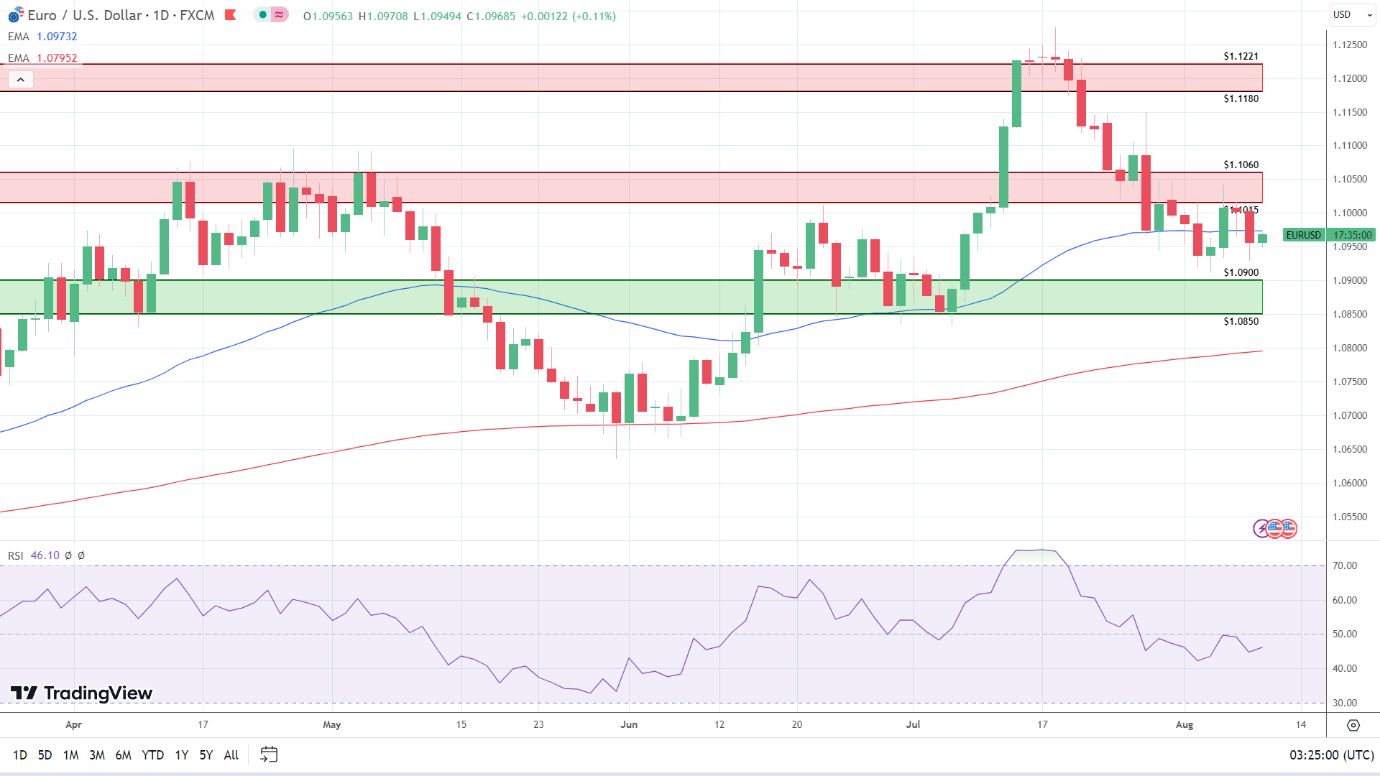
The Daily Chart showed the EUR/USD remained below the $1.1015 – $1.1060 resistance band and the 50-day EMA ($1.09732). However, the EUR/USD held above the 200-day EMA ($1.07952), sending bearish near-term but bullish longer-term price signals.

A EUR/USD move through the 50-day EMA ($1.09732) would give the bulls a run at the $1.1015 – $1.1060 resistance band. However, failure to move through the 50-day EMA would leave the $1.0900 – 1.0850 support band in play.

Looking at the 14-Daily RSI, the 46.10 reading sends moderately bearish price signals. The RSI suggests a fall through the upper level of the $1.0900 – 1.0850 support band.

EUR/USD Daily Chart sends bearish near-term price signals.
EURUSD 090823 Daily Chart

4-Hourly Chart

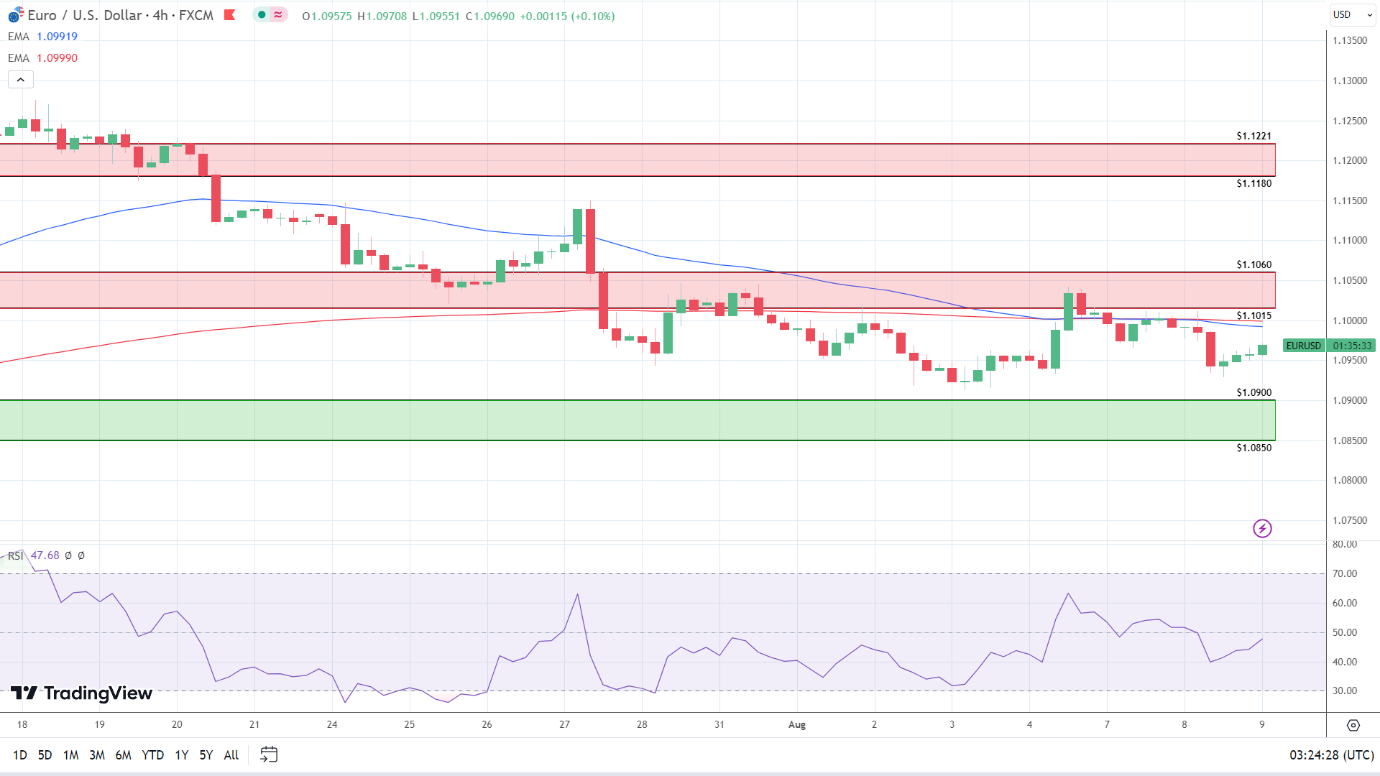
Looking at the 4-Hourly Chart, the EUR/USD sits below the $1.1015 – $1.1060 resistance band. The EUR/USD remains below the 50-day ($1.09919) and 200-day ($1.09990) EMAs, sending bearish near and longer-term price signals.

The 50-day EMA pulled back from the 200-day EMA this morning, a bearish price signal. Failure to move through the EMAs would bring sub-$1.0950 and the $1.0900 – 1.0850 support band into play. However, a EUR/USD move through the EMAs would support a breakout from the $1.1015 – $1.1060 resistance band to target $1.11.

The 14-4H RSI at 47.68 sends bearish EUR/USD price signals, with selling pressure outweighing buying pressure. Significantly, the RSI aligns with the EMAs, signaling a return to sub-$1.0950 to bring the $1.0900 – 1.0850 support band into play.

4-Hourly Chart affirms bearish near-term price signals.
Silver Price Forecast: CPI Expected to Drive Near-Term Volatility

Silver Price Forecast: CPI Expected to Drive Near-Term Volatility

Overview

Silver (XAG) prices, having taken a hit and plummeted to a one-month low due to unsteady Chinese trade data and a strong dollar appeal on Tuesday, are now experiencing a slight uptick. The precious metal’s rebound is primarily driven by two factors. Firstly, opportunistic traders, sensing an undervaluation, are diving in. Secondly, many are hedging and adjusting their positions in anticipation of Thursday’s U.S. Consumer Price Index (CPI) report, which will provide insights into the inflation scenario.

Yields, Dollar Controlling Silver Prices

With bond yields and the dollar retracting, the market mood appears to favor silver. This is further compounded by Moody’s recent decision to downgrade the credit ratings of several U.S. banks, impacting the dollar index and longer-dated U.S. Treasury yields.

Trading Derivatives carries a high level of risk to your capital and you should only trade with money you can afford to lose. Trading Derivatives may not be suitable for all investors, so please ensure that you fully understand the risks involved, and seek independent advice if necessary. A Product Disclosure Statement (PDS) can be obtained either from this website or on request from our offices and should be considered before entering into a transaction with us. Raw Spread accounts offer spreads from 0.0 pips with a commission charge of USD $3.50 per 100k traded. Standard account offer spreads from 1 pips with no additional commission charges. Spreads on CFD indices start at 0.4 points. The information on this site is not directed at residents in any country or jurisdiction where such distribution or use would be contrary to local law or regulation.

The Federal Reserve’s stance is becoming increasingly pivotal in this context. Richmond Fed President, Thomas Barkin, and Philadelphia Fed President, Patrick Harker, both signal a wait-and-watch approach to interest rate adjustments. Yet, contrasting views from other Fed officials hint at possible fluctuations in the interest rate landscape in the coming months.

Silver’s Value Faces Rate Uncertainty

The overarching sentiment is one of uncertainty. While Silver (XAG) is vulnerable to U.S. interest rate fluctuations, its intrinsic value remains undisputed. This sensitivity stems from the fact that increased rates up the ante for holding non-yielding assets. As global growth prospects appear shaky, the dollar’s appeal as a safe haven strengthens, further influencing silver prices.

CPI-Driven Silver Volatility Anticipated

In the short term, silver’s trajectory seems to be in the balance. As analysts and traders await the U.S. CPI data, with projections hinting at an acceleration, it’s clear that while this month’s report is significant, next month’s data might be the real game-changer. For now, the market should brace for potential volatility in silver’s price movements, indicating a somewhat bearish near-term forecast.

Technical Analysis

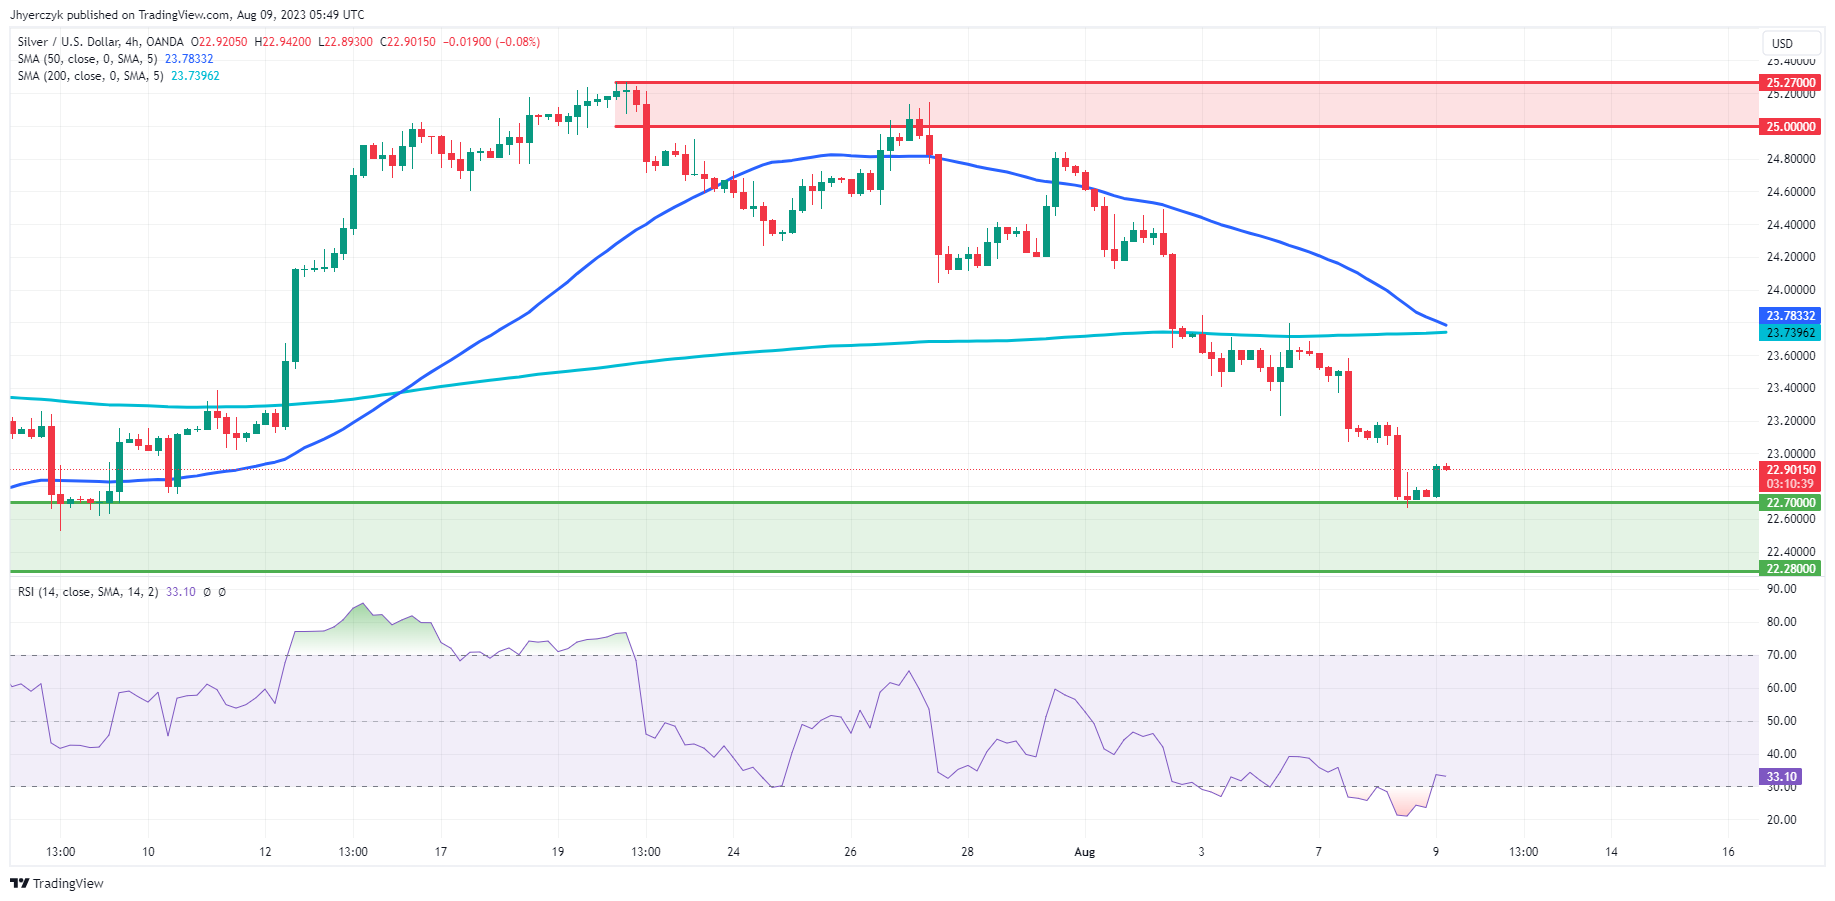
4-Hour Silver (XAG)Silver’s current 4-hour price stands at $22.91, marginally below the previous 4-hour close of $22.92. Interestingly, the commodity is currently trading below both the 200-4H and 50-4H moving averages, priced at $23.74 and $23.78, respectively. This positioning suggests a bearish sentiment in the short term. The 14-4H RSI is at 33.24, indicating that Silver is approaching oversold territory, suggesting potential buying interest could emerge soon.

However, the current price sits above the main support zone of $22.70 to $22.28, after a successful test of this area, but considerably below the main resistance area of $25.00 to $25.27. Based on these indicators, the market sentiment for Silver (XAG) appears bearish in the near term.