Gold Price Forecast: XAU Fate Hangs on Impending US Jobs Data Release

Gold Price Forecast: XAU Fate Hangs on Impending US Jobs Data Release

Overview

The imminent release of the US Non-Farm Payrolls report at 12:30 GMT is holding gold prices at bay. A bullish report could put pressure on gold, with potential hikes in treasury yields and confidence in labor market growth. A bearish report, conversely, could stimulate gold prices as the economic health falls under question. Investors are eagerly anticipating these figures to decide their next moves in the gold market.

Gold Teeters Amid Non-Farm Payroll Anticipation

Gold (XAU) finds itself in a precarious situation as the world waits for the release of the US Non-Farm Payrolls report. With investors bracing for the results, gold prices have stagnated, teetering on the edge of their worst week in six months. The buoyancy of this week’s robust economic data, which pushed Treasury yields to nine-month highs, has pressured the gold market.

Trading Derivatives carries a high level of risk to your capital and you should only trade with money you can afford to lose. Trading Derivatives may not be suitable for all investors, so please ensure that you fully understand the risks involved, and seek independent advice if necessary. A Product Disclosure Statement (PDS) can be obtained either from this website or on request from our offices and should be considered before entering into a transaction with us. Raw Spread accounts offer spreads from 0.0 pips with a commission charge of USD $3.50 per 100k traded. Standard account offer spreads from 1 pips with no additional commission charges. Spreads on CFD indices start at 0.4 points. The information on this site is not directed at residents in any country or jurisdiction where such distribution or use would be contrary to local law or regulation.

Yields on the 10-year and 2-year Treasury notes experienced significant changes this week, largely propelled by fresh economic data and the fallout from Fitch’s US downgrade. The US long-term foreign currency issuer default rating suffered a blow, dropping from AAA to AA+, a decision taken in light of concerns over “fiscal deterioration,” questionable governance standards, and escalating general debt.

Market sentiment, pivoting on these developments, will now heavily hinge on the Non-Farm Payrolls data for July. This report could illuminate the state of the labor market and economy and dictate the Federal Reserve’s next move.

Bullish Payrolls Report May Depress Gold

A bullish Non-Farm Payrolls report could result in a dip in gold prices. Increased confidence in the economy’s health could lead to more considerable interest rate hikes by the Federal Reserve, further pushing Treasury yields up, and pushing gold, often considered a safe-haven asset, down.

Bearish Payrolls Report Could Boost Gold

In contrast, a bearish Non-Farm Payrolls report may stimulate gold prices. If the report shows signs of a weakening labor market or economic downturn, gold might witness increased demand as investors seek safer investment avenues amidst the uncertainty.

Short-Term Outlook:  Data Dependent

As the world of finance holds its breath, all eyes are firmly fixed on the forthcoming jobs data. The outcome will not only shape the future of gold prices but also influence the Federal Reserve’s strategy in its ongoing battle against inflation.

Technical Analysis

4-Hour Gold (XAU)Gold’s (XAU) current 4-hour price is below both the 200-4H and 50-4H moving averages, indicating a bearish sentiment in the short to medium term. With a 14-4H RSI of 37.4, momentum is weakening, but not yet oversold. The price is nearing the main support area (1902.75 to 1914.00), suggesting a potential further drop before a potential reversal. As such, the market for Gold appears bearish in the short to medium term, although this may change with market dynamics or new labor market data.

Silver Price Forecast: XAG Tone Determined by Non-Farm Payrolls Numbers

Silver Price Forecast: XAG Tone Determined by Non-Farm Payrolls Numbers

Overview

Silver (XAG) currently finds itself in a precarious situation as the world anticipates the US Non-Farm Payrolls report. With the results looming, silver prices have remained relatively stagnant, teetering on the edge of their worst week in six months. This week’s robust economic data, which pushed Treasury yields to nine-month highs, has added pressure to the silver market.

Traders Brace for US Non-Farm Payrolls

The imminent release of the US Non-Farm Payrolls report at 12:30 GMT is creating tension in the silver market. Should the report turn out to be bullish, it may put downward pressure on silver prices, due to potential hikes in treasury yields and a boost in labor market confidence. Conversely, a bearish report might stimulate an increase in silver prices as concerns over the economic health arise. Investors are waiting with bated breath for these figures, eager to plan their next moves in the silver market.

Trading Derivatives carries a high level of risk to your capital and you should only trade with money you can afford to lose. Trading Derivatives may not be suitable for all investors, so please ensure that you fully understand the risks involved, and seek independent advice if necessary. A Product Disclosure Statement (PDS) can be obtained either from this website or on request from our offices and should be considered before entering into a transaction with us. Raw Spread accounts offer spreads from 0.0 pips with a commission charge of USD $3.50 per 100k traded. Standard account offer spreads from 1 pips with no additional commission charges. Spreads on CFD indices start at 0.4 points. The information on this site is not directed at residents in any country or jurisdiction where such distribution or use would be contrary to local law or regulation.

Yields, Silver Impacted by Fitch Downgrade

Significant changes in yields on the 10-year and 2-year Treasury notes have been noted this week, largely driven by new economic data and the consequences of Fitch’s US downgrade. The US long-term foreign currency issuer default rating was downgraded from AAA to AA+. This decision was motivated by concerns over “fiscal deterioration,” questionable governance standards, and rising general debt.

NFP Report to Influence Fed Rate Decision

Market sentiment, now pivoting on these events, is highly contingent on the forthcoming Non-Farm Payrolls data for July. This report could shed light on the state of the labor market and the broader economy, influencing the Federal Reserve’s subsequent actions.

Bullish NFP Data to Weigh on Silver

In the event of a bullish Non-Farm Payrolls report, silver prices could take a hit. With a renewed confidence in the health of the economy, the Federal Reserve may implement more aggressive interest rate hikes. This, in turn, could further push up Treasury yields and push down silver, which is often viewed as a safe-haven asset.

Bearish NFP Report Could Bolsterr Prices

On the other hand, a bearish Non-Farm Payrolls report could stimulate an uptick in silver prices. If the report indicates a faltering labor market or signs of an economic downturn, silver may see a surge in demand. Investors would likely view it as a safer investment route amidst the prevailing uncertainty.

Short-Term Outlook:  Data Dependent

As the financial world waits in suspense, all eyes are trained on the imminent jobs data. The results will not only determine the trajectory of silver prices but also influence the Federal Reserve’s approach in its ongoing fight against inflation.

Technical Analysis

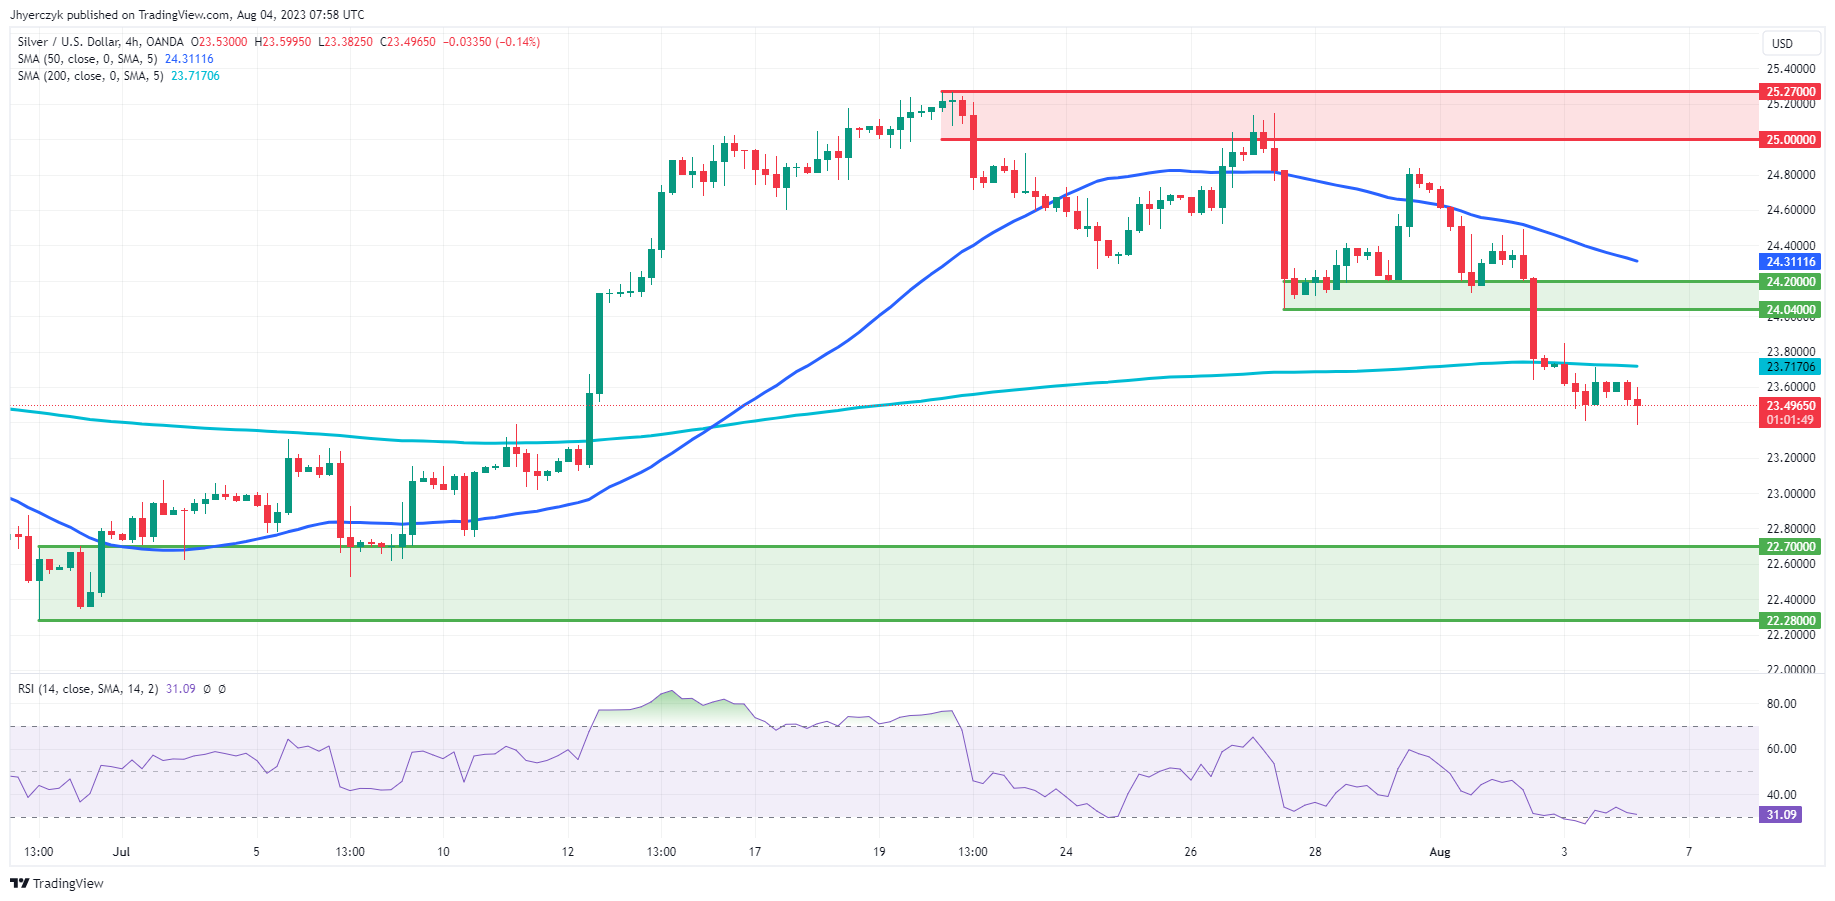
4-Hour Silver (XAG)The Silver (XAG) market’s short-term sentiment appears bearish, with the current 4-hour price at 23.47, slightly below the 200-4H (23.71) and 50-4H (23.72) moving averages. The 14-4H RSI at 30.76 suggests an oversold market, possibly indicating an upcoming price rebound. The 4-hour price is above the main support area (22.28 – 22.70), yet below the main resistance area (25.00 – 25.27), further signaling bearish sentiment. However, the oversold RSI might imply potential for an upward price correction.

Oil Price Forecast: Saudi Arabia, Russia Production Cuts Fuel Price Rise

Oil Price Forecast: Saudi Arabia, Russia Production Cuts Fuel Price Rise

Overview

As we approach the weekend, oil prices are on the rise for a second consecutive day, marking a six-week streak of gains. This surge is primarily fueled by announcements from Saudi Arabia and Russia, the world’s second and third-largest crude producers, committing to continued output cuts through the coming month.

Saudi, Russia Pledge Extended Oil Cuts

Saudi Arabia has voluntarily pledged to extend its oil production cut of 1 million barrels per day (bpd) until the end of September, while Russia has also promised to reduce its oil exports by 300,000 bpd in the same period. This move by these two oil giants, announced ahead of a critical OPEC+ meeting, has ignited concerns about supply shortage, thereby pushing oil prices higher.

Trading Derivatives carries a high level of risk to your capital and you should only trade with money you can afford to lose. Trading Derivatives may not be suitable for all investors, so please ensure that you fully understand the risks involved, and seek independent advice if necessary. A Product Disclosure Statement (PDS) can be obtained either from this website or on request from our offices and should be considered before entering into a transaction with us. Raw Spread accounts offer spreads from 0.0 pips with a commission charge of USD $3.50 per 100k traded. Standard account offer spreads from 1 pips with no additional commission charges. Spreads on CFD indices start at 0.4 points. The information on this site is not directed at residents in any country or jurisdiction where such distribution or use would be contrary to local law or regulation.

Economic Factors Threaten to Curb Oil Demand

Despite this, there are economic factors that might curb the demand for oil, thereby applying downward pressure on prices. Fresh U.S. data points to a tightening labor market and a slowing service sector, implying a potential economic slowdown. Similarly, the strengthening dollar could suppress oil prices as market participants speculate whether a heated labor market will impel the Federal Reserve to tighten its monetary policy.

Europe’s Economic Slump May Lower Oil Demand

In Europe, economic activity seems to be slowing, with the downturn in Eurozone business activity in July being more severe than initially projected. Moreover, the Bank of England’s decision to increase its interest rate to a 15-year peak could dampen economic growth by increasing borrowing costs, which might consequently decrease oil demand.

Short-term Forecast

However, despite these potential headwinds, an improved demand outlook and a constrained supply could continue to support the oil markets. A key piece of data to watch out for will be Friday’s U.S. non-farm payroll figures, which will likely guide market sentiment. In the short-term, we could expect a bullish outlook for oil prices, given the ongoing production cuts from major oil-producing countries. Yet, it’s crucial to note that any changes in economic conditions or monetary policy could shift this forecast.

Technical Analysis

4-Hour Crude OilCurrent sentiment for Crude Oil points towards robust, bullish momentum. The slight rise in the 4-hour price confirms this momentum. The current price sits above both the 200-4H and 50-4H moving averages, indicating strong bullish market sentiment in both the short and long term. The 14-4H RSI reads at 59.95, reinforcing the stronger momentum.

The current 4-hour price is within the main resistance area, a critical factor to consider for potential pullbacks. All in all, the market is decidedly bullish, warranting careful watch for any signs of resistance level breakouts or a potentially bearish closing price reversal top.

Italian service sector growth continues to slide in July

Italian service sector growth continues to slide in July

Italy’s service sector experienced a rise in business activity during July, but growth softened to a half-year low as sales broadly stagnated. Price pressures remained prevalent, whilst for the first time since April 2021 there was a drop in employment. Confidence in the future was again positive but concerns over higher interest rates and the elevated cost of living ensured that optimism was muted when compared to its historical trend. The headline index from the report, the HCOB Italy Services PMI® Business Activity Index registered 51.5 in July. That compared to 52.2 in June, and marked a seventh successive

French services economy deteriorates at faster pace in July amid worsening demand and persistent inflationary pressures

French services economy deteriorates at faster pace in July amid worsening demand and persistent inflationary pressures

The French service sector started the third quarter with a contraction in activity, according to the latest HCOB PMI® survey conducted by S&P Global, indicating a further weakening of the economy after June’s first decline in services output for five months. Overall, the contraction in business activity was the fastest for almost two-and-a-half years. The deterioration in activity during July was accompanied by a slowdown in jobs growth, as well as a further reduction in the level of incoming new work. However, business confidence improved after a marked slump in June. Meanwhile, the slowdown of inflation

German service sector shows a substantial loss of momentum at start of third quarter, while price pressures remain stubbornly high

German service sector shows a substantial loss of momentum at start of third quarter, while price pressures remain stubbornly high

The German service sector saw a further loss of momentum at the start of the third quarter as business activity growth slowed notably for a second straight month, the latest HCOB PMI® survey compiled by S&P Global showed. The slowdown stemmed from a drop in demand, with inflows of new business falling for the first time in six months. Business expectations meanwhile deteriorated, which in turn contributed to a marked slowdown in job creation. On the price front, there was a pause in the recent easing trend in service sector inflationary pressures. Driven by growing wage demands, firms’ input cost rose at a sharp rate

UK: Weakest service sector performance for six months

UK: Weakest service sector performance for six months

UK service providers experienced another period of subdued business conditions during July, with activity levels and new work expanding at much slower rates than in the previous month. Pressure on operating capacity subsequently showed signs of easing as backlogs of work declined at the fastest pace for nearly two-and-a-half years. Strong rises in input costs persisted during July, largely driven by higher wages. Moreover, the overall rate of input price inflation edged up since June and remained historically elevated. Prices charged inflation nonetheless eased to its lowest since March, with some firms citing

USD/CAD IG Client Sentiment: Our data shows traders are now net-short USD/CAD for the first time since Jun 01, 2023 when USD/CAD traded near 1.34.

USD/CAD IG Client Sentiment: Our data shows traders are now net-short USD/CAD for the first time since Jun 01, 2023 when USD/CAD traded near 1.34.

USD/CAD: Retail trader data shows 49.94% of traders are net-long with the ratio of traders short to long at 1.00 to 1. In fact, traders have remained net-short since Jun 01 when USD/CAD traded near 1.34, price has moved 0.68% lower since then. The number of traders net-long is 1.43% lower than yesterday and 13.93% lower from last week, while the number of traders net-short is 3.75% higher than yesterday and 25.38% higher from last week.

We typically take a contrarian view to crowd sentiment, and the fact traders are net-short suggests USD/CAD prices may continue to rise.

Our data shows traders are now net-short USD/CAD for the first time since Jun 01, 2023 when USD/CAD traded near 1.34. Traders are further net-short than yesterday and last week, and the combination of current sentiment and recent changes gives us a stronger USD/CAD-bullish contrarian trading bias.

USD/CAD Client Positioning

Number of traders net-short has increased by 25.38% from last week.

SYMBOL TRADING BIAS NET-LONG% NET-SHORT% CHANGE IN LONGS CHANGE IN SHORTS CHANGE IN OI
USD/CAD BULLISH 49.94% 50.06% -1.43% Daily

-13.93% Weekly

3.75% Daily

25.38% Weekly

1.10% Daily

2.09% Weekly

USD/CAD Bullish

Data provided by of clients are net short.
Change in Longs Shorts OI
Daily -4% 11% 3%
Weekly -13% 34% 5%
What could changes and extremes in retail trading signal for the market?
Get My Guide
Euro Technical Update: EUR/USD Might be Readying to Extend Lower

Euro Technical Update: EUR/USD Might be Readying to Extend Lower

The Euro might be on the verge of confirming a critical bearish breakout against the US Dollar. On the daily chart below, EUR/USD has closed under rising support from late May. Further downside from here would underscore the change in trend, increasingly offering a bearish technical bias for the single currency. That would place the focus on the July low of 1.0834.

Just below that is the 100-day Moving Average (MA). This may hold as key support, maintaining the broader upside bias. Otherwise, extending lower places the focus on the May low of 1.0635. Confirming a push below that opens the door to revisiting the lowest that the Euro has not seen since March. Let us take a closer look at the 4-hour chart to gauge how the near-term trend is shaping up.

image1.png

The trendline breakout can be seen better on the 4-hour chart below where support can be made out more accurately as a zone. That said, it is imperative to confirm the breakout from the perspective of the daily chart. In the 4-hour timeframe, we can see that positive RSI divergence is brewing. This is a sign of fading downside momentum which can at times precede a turn higher.

In the event of a false breakout, keep a close eye on the falling trendline from July. This may hold as resistance, maintaining the near-term downside bias. Otherwise, clearing higher exposes the 23.6% Fibonacci retracement level at 1.1124. Clearing the latter may open the door to revisiting the July high of 1.1275.

image2.png