DAX Index: Rising Inflation and Recessionary Fears Put DAX 30 to Test

DAX Index: Rising Inflation and Recessionary Fears Put DAX 30 to Test

DAX Ends Three-Day Winning Streak

The DAX fell by 0.24% on Wednesday. Partially reversing a 0.88% gain from Tuesday, the DAX ended the day at 15,892.

German Inflation Comes in Hotter to Spook Investors

German inflation figures spooked investors on Wednesday. The German annual inflation rate softened from 6.2% to 6.1%, with core inflation easing from 6.5% to 6.4%. Economists forecast inflation rates of 6.0% and 6.3%, respectively.

Trading Derivatives carries a high level of risk to your capital and you should only trade with money you can afford to lose. Trading Derivatives may not be suitable for all investors, so please ensure that you fully understand the risks involved, and seek independent advice if necessary. A Product Disclosure Statement (PDS) can be obtained either from this website or on request from our offices and should be considered before entering into a transaction with us. Raw Spread accounts offer spreads from 0.0 pips with a commission charge of USD $3.50 per 100k traded. Standard account offer spreads from 1 pips with no additional commission charges. Spreads on CFD indices start at 0.4 points. The information on this site is not directed at residents in any country or jurisdiction where such distribution or use would be contrary to local law or regulation.

Sticky core inflation will leave the ECB under pressure to deliver more rate hikes to tame inflation. However, the deteriorating macroeconomic backdrop may test the theory of rate hikes to tackle inflation.

Business sentiment across the euro area deteriorated in August. The Business and Consumer Survey fell from 94.5 to 93.3 versus a forecast of 93.7. Alarmingly, consumer inflation expectations spiked in August, surging from 4.9 to 9.0.

US Economic Indicators Support a Fed Hold on Interest Rates

In stark contrast to the numbers from Europe, US ADP nonfarm employment figures gave the Fed more reason to hit the brakes. The ADP reported a 177k increase in nonfarm employment in August versus 371k in July. Economists forecast a 195k rise.

Considering the latest JOLTs job opening numbers and the slide in consumer confidence, the labor market is experiencing the effects of aggressive rate hikes to tame inflation. However, the latest numbers from the US were not enough to provide support. Investor angst over the German economic outlook remained a bugbear.

The US equity markets reacted favorably to the Wednesday numbers. On Wednesday, the NASDAQ gained 0.54%, with the Dow and S&P 500 rising by 0.11% and 0.38%, respectively.

The Wednesday Market Movers

Expectations of a September ECB rate hike and news of Orsted (ORSTED) expecting $2.3 billion in US impairments weighed on the utility sector.

RWE AG and Siemens Energy led the way down, sliding by 4.71% and 3.34%, respectively, with Siemens AG falling by 1.27%. However, autos and banks also struggled. Deutsche Bank and Continental AG led their respective sectors into negative territory, with losses of 0.78% and 0.87%, respectively.

Today’s Session

Economic indicators from China will set the tone this morning. NBS private sector PMIs for August sent mixed signals. While the NBS Manufacturing PMI increased from 49.3 to 49.7, the Non-Manufacturing PMI fell from 51.5 to 51.0.

The continued contraction across the manufacturing sector and slowing growth across the services sector paint a grim picture. Significantly, the PMI numbers signal the need for more action from Beijing.

Despite the gloomier numbers, the Asian equity markets made modest gains through the morning. Bets on the Fed hitting the brakes on interest rate hikes limited the impact of the PMI numbers.

The DAX Futures was up 12 points this morning. However, economic indicators from Germany, the Eurozone, and the US will likely deliver a choppy session. On the one hand, easing bets on further Fed rate hikes is bullish. On the other hand, euro area recessionary fears and hawkish ECB sentiment are bearish.

German retail sales and unemployment figures will move the dial this morning. The German GfK Consumer Climate Survey revealed consumer jitters over unemployment and income expectations. An increase in the German unemployment rate would fuel recessionary jitters. A pullback in consumer spending would adversely affect the German economy further.

Economists forecast retail sales to rise by 0.3% in July and the unemployment rate to remain at 5.6%.

However, Eurozone inflation figures also need consideration. After the German inflation numbers, sticky inflation could cement a September ECB rate hike.

Economists forecast the Eurozone inflation rate to soften from 5.3% to 5.1% and core inflation to ease from 5.5% to 5.3%.

With inflation fueling hawkish ECB bets, the ECB monetary policy meeting minutes need digesting. A divided camp on further rate hikes should provide modest DAX comfort.

US Inflation, Income, Spending, and Labor Market Numbers in Focus

The US Personal Income and Outlays Report will garner interest this afternoon. As investors price out a September Fed rate hike, the numbers could refuel Fed rate hike bets. Significantly, investors would also raise the chances of a Fed-fueled hard landing.

Forecasts favor a more hawkish Fed outlook. Economists forecast the Core PCE Price Index to increase 4.2% year-over-year in July versus 4.1% in June. Personal spending and income figures support a pickup in spending. Economists expect personal income to increase by 0.3% (June: +0.3%) and spending by 0.6% (June: 0.5%).

However, US jobless claims need to avoid a spike. Steady jobless claims would leave the Personal Income and Outlays Report to influence Fed policy goals.

Short-Term Forecast: Precarious Moment for the DAX

Considering the latest euro area and US economic indicators, Germany appears to be heading into a recession. Market conditions could deteriorate further as inflation numbers raise the chances of a September ECB rate hike. Cracks in the US labor market are also forming. While investors ease bets on a Fed rate hike, the tables can turn quickly.

DAX Technical Indicators

Daily Chart

The 16,000 – 16,080 resistance band capped the upside on Wednesday. Sticky German inflation numbers led to a fall through the 50-day EMA, a bearish price signal. Today, economic indicators from China and inflation jitters will likely test buyer appetite.

However, rising German retail sales, steady unemployment, and softer Eurozone inflation numbers would deliver support. A DAX move through the lower level of the 16,000 – 16,080 resistance band would bring 16,100 into view.

Considering the 14-Daily RSI at 51.55, the DAX has room to run before hitting overbought territory. However, US economic indicators would need to support a Fed pause but avoid reigniting recessionary jitters.

DAX Daily Chart sends mixed price signals.
DAX 310823 Daily Chart

4-Hourly Chart

The DAX sits below the 16,000 – 16,080 resistance band. Hawkish ECB rate hike bets weighed while easing expectations of a Fed rate hike limited the damage.

Softer-than-expected Euro area inflation numbers and rising bets on a Fed pause would be bullish. Favorable numbers would give the bulls a run at the 16,000 – 16,080 resistance band.

However, hotter-than-expected economic indicators from the euro area and the US would fuel a flight to safety. A fall through the 50-day EMA would support a fall to sub-15,750.


4-Hourly Chart sends bullish near-term price signals.
DAX 310823 4-Hourly Chart
EUR/USD Analysis: ECB Minutes and Inflation Figures to Drive Euro

EUR/USD Analysis: ECB Minutes and Inflation Figures to Drive Euro

Wednesday Overview

The EUR/USD gained 0.40% on Wednesday. Following a 0.56% rise on Tuesday, the EUR/USD ended the day at $1.09231. The EUR/USD fell to a low of $1.08551 before rising to a high of $1.09454.

Eurozone Inflation and ECB Minutes to Cement a September Hike

This morning, German retail sales and unemployment figures will draw interest. However, we expect the numbers to have a limited lasting impact on the EUR/USD. The German GfK Consumer Climate Survey revealed negative sentiment toward income, the economy, and unemployment. A steady unemployment rate and a modest rise in retail sales are unlikely to shift investor sentiment toward the German economy.

Trading Derivatives carries a high level of risk to your capital and you should only trade with money you can afford to lose. Trading Derivatives may not be suitable for all investors, so please ensure that you fully understand the risks involved, and seek independent advice if necessary. A Product Disclosure Statement (PDS) can be obtained either from this website or on request from our offices and should be considered before entering into a transaction with us. Raw Spread accounts offer spreads from 0.0 pips with a commission charge of USD $3.50 per 100k traded. Standard account offer spreads from 1 pips with no additional commission charges. Spreads on CFD indices start at 0.4 points. The information on this site is not directed at residents in any country or jurisdiction where such distribution or use would be contrary to local law or regulation.

However, Eurozone inflation figures will move the dial. The markets are betting on a September ECB interest rate hike. German inflation numbers from Wednesday softened but not enough to take pressure off the ECB.

Sticky Eurozone inflation figures would likely ensure a September ECB rate hike. Economists forecast the annual core inflation rate to soften from 5.5% to 5.3% and the inflation rate to ease from 5.3% to 5.1%.

Later in the session, the ECB monetary policy meeting minutes also need consideration. However, the minutes are unlikely to reveal any surprises with the ECB committed to taming inflation.

With inflation in focus, investors should monitor ECB Executive Board member commentary throughout the session. ECB Executive Board members Isabel Schnabel and Luis de Guindos are on the calendar to speak today.

US Personal Income and Outlays Report to Test the Theory of a Pause

US Core PCE Price Index and personal income figures for July will move the dial. Weaker-than-expected labor market numbers have eased bets on further Fed rate hikes. However, a pickup in spending and a more marked increase in the Core PCE Price Index could refuel bets on a more hawkish Fed.

Economists forecast the Core PCE Price Index to rise by 4.2% year-over-year in July versus 4.1% in June. Economists expect a pickup in personal spending, up 0.6% in July versus 0.5% in June.

An upward trend in personal spending fuels demand-driven inflationary pressure. The Fed would need to lift rates higher to impact disposable incomes and curb spending.

Better-than-expected US numbers would give the dollar the upper hand. While the ECB looks set for a September rate hike, the economic outlook for the euro area looks precarious. In contrast, the US economy remains resilient.

EUR/USD Price Action

Daily Chart

On Wednesday, the EUR/USD broke out from the upper level of the $1.0850 – $1.0900 resistance band. However, recessionary jitters left the EUR/USD below the 50-day EMA. Hotter-than-expected Eurozone inflation and weaker US stats would support a breakout from the 50-day EMA to target $1.10.

In contrast, a Eurozone annual inflation rate below 5% would bring sub-$1.0850 and the 200-day EMA into view.

Considering the 14-Daily RSI at 50.66, investors are sitting on the fence. With the markets betting on a Fed pause, it may come down to the US stats to drag the EUR/USD through the $1.0900 – $1.0850 support band.

EUR/USD Daily Chart sends bullish price signals.
EURUSD 310823 Daily Chart

4-Hourly Chart

The EUR/USD holds above the $1.0850 – $1.0900 support band this morning. Investor caution ahead of a busy euro area and US economic calendar left the 200-day EMA to cap the upside.

Hotter-than-expected Eurozone core inflation numbers would bring $1.10 and the $1.1015 – $1.1060 resistance band into view. However, bets on Fed monetary policy could shift today.

A larger-than-expected rise in the Core PCE Price Index could reignite bets on a September Fed rate hike. Hawkish sentiment would bring the $1.0900 – $1.0850 support band into play.

With hawkish ECB bets returning the EUR/USD to $1.09, the 14-4H RSI at 64.97 gives the EUR/USD room to target $1.10 before entering the overbought territory.

4-Hourly Chart affirms bullish near-term price signals.
EURUSD 310823 4 Hourly Chart
Silver Prices Forecast: US Job,Inflation Data to Determine XAG/USD’s Direction

Silver Prices Forecast: US Job,Inflation Data to Determine XAG/USD’s Direction

Silver prices (XAG/USD) are wavering close to one-month peaks, reflecting the recent downturn in U.S. economic metrics. The upcoming inflation figures could change the prevailing sentiment, hinting at the Federal Reserve’s possible decision on rate hikes.

Market Indicators & U.S. Data

The U.S. Treasury yields have seen a decline as recent reports signal a deceleration in the nation’s economic growth. August’s ADP data showcased a job addition of 177,000, failing to meet Dow Jones’ expectation of 200,000, and trailing significantly behind July’s amended figure of 371,000.

Trading Derivatives carries a high level of risk to your capital and you should only trade with money you can afford to lose. Trading Derivatives may not be suitable for all investors, so please ensure that you fully understand the risks involved, and seek independent advice if necessary. A Product Disclosure Statement (PDS) can be obtained either from this website or on request from our offices and should be considered before entering into a transaction with us. Raw Spread accounts offer spreads from 0.0 pips with a commission charge of USD $3.50 per 100k traded. Standard account offer spreads from 1 pips with no additional commission charges. Spreads on CFD indices start at 0.4 points. The information on this site is not directed at residents in any country or jurisdiction where such distribution or use would be contrary to local law or regulation.

In addition, the Q2 GDP growth rate was revised downward to 2.1%, indicating a potential economic slowdown, though the overall pace remains strong. This makes the upcoming non-farm payroll data a central focus for Wall Street to glean insights into the economy’s potential path.

Consumer Sentiment and Inflation

The consumer confidence index, currently at 106.1, didn’t reach the Dow Jones estimate of 116, painting a picture of waning consumer enthusiasm. Rising inflation expectations for the coming year have also been highlighted. JOLTs job data also portrayed a shrinkage in job vacancies to 8.8 million in July, the lowest since March of the previous year.

Federal Reserve’s Anticipated Move

With these new figures coming to the forefront, they are likely to significantly influence the Federal Reserve’s imminent interest rate policy decision. Post its rate hike in July, the market remains in suspense about the Fed’s future moves. There’s an overarching uncertainty as to whether the cycle of rate hikes initiated in early 2022 will see further increments.

Forecast for Silver Prices

Despite the recent uptrend, XAG/USD is projected to face nearly a 1% monthly dip. Concurrently, the U.S. dollar is preparing for its initial monthly ascent in three cycles, with Treasury yields set for their fourth successive monthly surge.

As investors await detailed insights into inflation, the Personal Consumption Expenditures (PCE) and upcoming monthly non-farm payrolls stats are anticipated to give hints on possible shifts in U.S. interest rates.

Given the current economic indicators and the potential halt in Fed’s rate hikes, silver’s appeal is heightened. The recent increase in holdings by the SPDR Gold Trust further solidifies this notion, rendering a bullish forecast for silver in the foreseeable future.

Technical Analysis

4-Hour Silver (XAG/USD)The current 4-hour price of Silver (XAG/USD) at $24.58 is slightly above its previous close of $24.57, indicating minimal volatility. Compared to its 200-4H moving average of $23.86, silver exhibits a bullish position, further supported by its stand above the 50-4H moving average of $24.05. The 14-4H RSI reading of 59.06 indicates growing momentum.

The asset is trading well above its main support ($22.70 to $22.28), while bumping up against its resistance ($25.00 to $25.27) zone. In summation, given its position relative to key moving averages and RSI, the market sentiment for Silver currently leans bullish.

Gold Prices Forecast: XAU/USD Rises Amid US Economic Slowdown

Gold Prices Forecast: XAU/USD Rises Amid US Economic Slowdown

Gold Prices and U.S. Data

Gold (XAU/USD) prices hovered near one-month highs on Thursday, influenced by recent soft U.S. economic figures. These numbers have led many to believe that the Federal Reserve might halt its rate hikes soon. However, forthcoming inflation readings could shift this perspective.

Market Indicators

U.S. Treasury yields dropped as reports indicated slowing economic growth. Recent ADP data revealed job additions of 177,000 in August, missing the Dow Jones prediction of 200,000, and considerably below July’s revised figure of 371,000.

Trading Derivatives carries a high level of risk to your capital and you should only trade with money you can afford to lose. Trading Derivatives may not be suitable for all investors, so please ensure that you fully understand the risks involved, and seek independent advice if necessary. A Product Disclosure Statement (PDS) can be obtained either from this website or on request from our offices and should be considered before entering into a transaction with us. Raw Spread accounts offer spreads from 0.0 pips with a commission charge of USD $3.50 per 100k traded. Standard account offer spreads from 1 pips with no additional commission charges. Spreads on CFD indices start at 0.4 points. The information on this site is not directed at residents in any country or jurisdiction where such distribution or use would be contrary to local law or regulation.

Moreover, there was a downward adjustment of the Q2 GDP growth to 2.1%, suggesting a deceleration in economic activity, albeit still at a robust pace. Wall Street is now focused on the upcoming non-farm payroll data for insights into the economy’s trajectory and job market direction.

Consumer Confidence and Inflation

Recent data, such as the consumer confidence index, which registered at 106.1, missed the Dow Jones estimate of 116. This suggests reduced consumer optimism. The report also highlighted rising inflation expectations over the next year. Furthermore, JOLTs job data indicated a decrease in available jobs to 8.8 million in July, the smallest since March 2021.

Federal Reserve’s Decision

The new figures will play a pivotal role in the Federal Reserve’s upcoming interest rate policy decision. The market is currently uncertain whether the Fed will continue its rate hikes, especially after its July increase, concluding a series of hikes that began early in 2022.

Bullion and Economic Outlook

Despite the week’s uptick, gold is set for almost a 1% monthly drop. Simultaneously, the U.S. dollar is gearing up for its first monthly surge in three months, and Treasury yields anticipate their fourth consecutive monthly rise, hitting 2007 peaks last week. Investors are eagerly awaiting comprehensive insights into inflationary trends.

Meanwhile, the Personal Consumption Expenditures (PCE) and monthly job statistics will offer clues about potential shifts in U.S. interest rates. Reports this week have shown the U.S. economy’s slower-than-anticipated Q2 growth, with job openings hitting a low not seen in over two years.

Forecast

The slowing economic and job market indicators, coupled with the possibility of the Federal Reserve ending its interest rate hikes, generally bode well for gold. Historically, lower interest rates or the anticipation of them tend to increase the appeal of non-yielding assets like gold.

The uptick in holdings by SPDR Gold Trust, the world’s largest gold-backed exchange-traded fund, suggests increased investor interest in the metal. Additionally, China’s contracting manufacturing could potentially lead to economic headwinds globally, further bolstering gold’s appeal as a safe-haven asset.

Given these factors, the outlook for gold prices is bullish in the short to medium term.

Technical Analysis

4-Hour Gold (XAU/USD)The current 4-hour price of 1944.88 is slightly below the previous at 1945.83. The price is above both the 200-4H moving average of 1933.96 and the 50-4H moving average of 1916.66, indicating bullish momentum. The 14-4H RSI stands at 70.26, signaling an overbought condition which could suggest a potential pullback or consolidation.

The commodity is hovering near the main resistance area of 1946.99 to 1954.88. Considering these factors, the current market sentiment leans bullish, but caution is warranted due to the overbought RSI reading.

German Retail Sales Slide by 0.8% to Fan Recessionary Fears

German Retail Sales Slide by 0.8% to Fan Recessionary Fears

German Retail Sales Stumble for a Second Consecutive Month

After stickier-than-expected German inflation numbers from Wednesday, retail sales were in focus this morning. A sharp pickup in retail sales would support a September ECB rate hike.

However, German retail sales tumbled by 0.8% in July, following a 0.8% slide in June. Economists forecast an increase of 0.3%. Retail sales were down 2.2% year-over-year versus -1.6% in June. Economists forecast retail sales to fall by 1.0% year-over-year.

The retail sales numbers aligned with the German GfK Consumer Climate Survey. On Wednesday, the August survey revealed negative sentiment toward income, the economy, and unemployment. Negative consumer sentiment toward unemployment and income weighs on consumer spending and eases demand-driven inflationary pressures.

EUR/USD Reaction to German Retail Sales

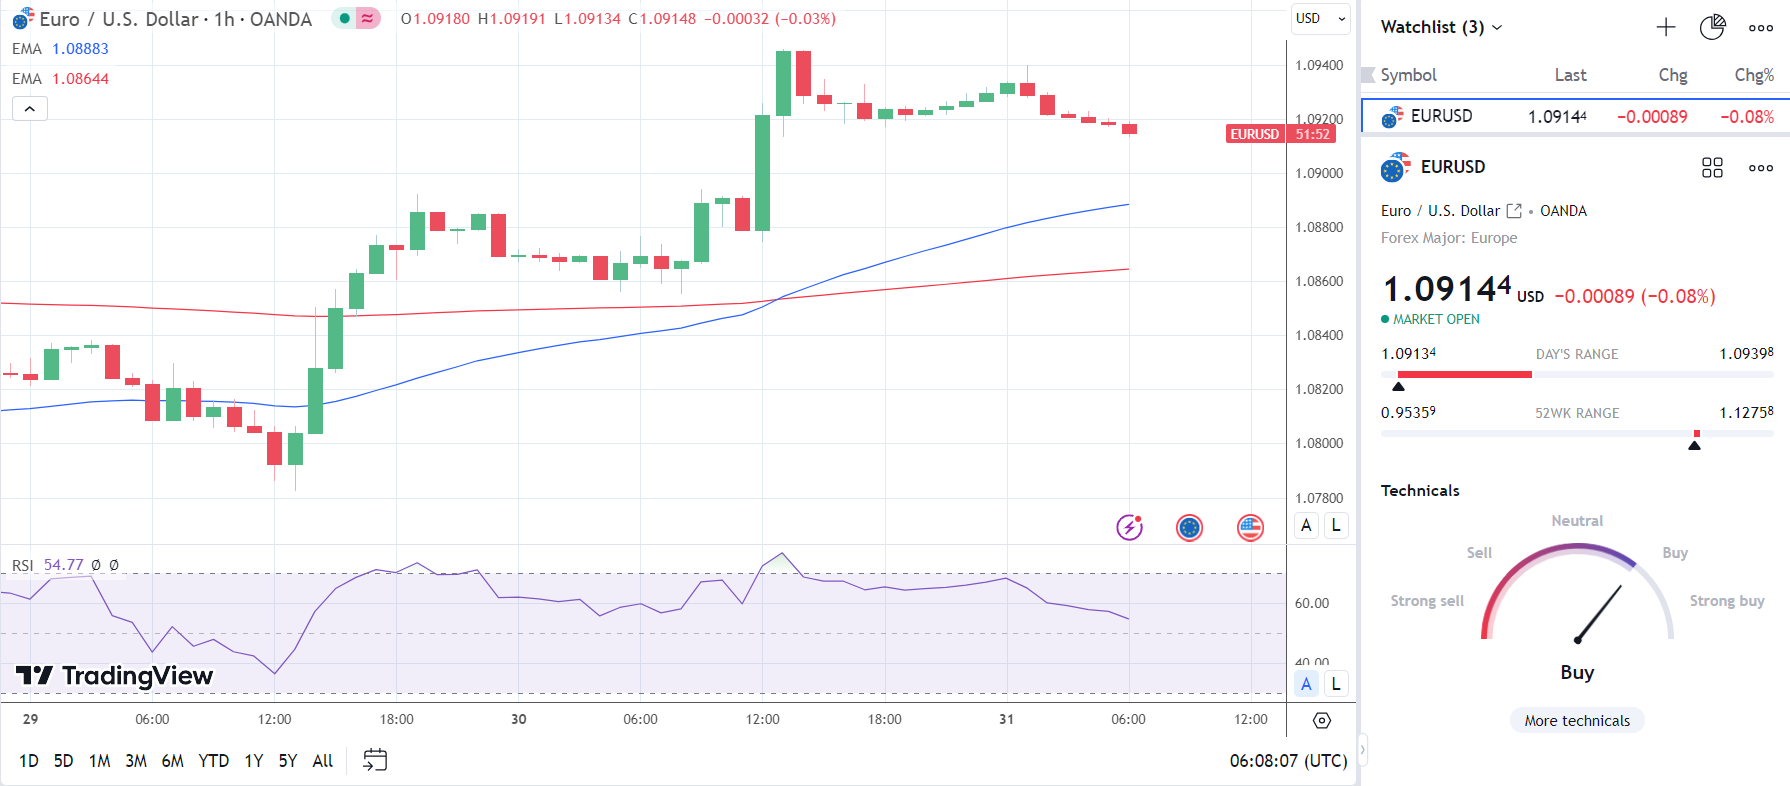
Before the retail sales figures, the EUR/USD rose to a pre-stat high of $1.09398 before falling to a low of $1.09168.

However, in response to the retail sales figures, the EUR/USD rose to a post-stat high of $1.09190 before falling to a low of $1.09134.

This morning, the EUR/USD was down 0.08% to $1.09144.

EUR/USD responds to weak German retail sales figures.
Up NextThe French economy will be in the spotlight ahead of the all-important Eurozone inflation numbers. We expect investor focus to remain on inflation, with hotter-than-expected inflation figures for France and the Eurozone likely to add pressure on the ECB.

However, investors need to consider US economic indicators later in the session. US Core PCE Price Index and personal spending figures will influence investor sentiment toward the Fed. A more marked increase in the Core PCE Price Index and better-than-expected US personal spending figures would refuel bets on further Fed rate hikes.

Beyond the numbers, the ECB will be in the spotlight. The ECB monetary policy meeting minutes and ECB member commentary will draw interest. ECB Executive Board members Isabel Schnabel and Luis de Guindos are on the calendar to speak today.

Crude Oil Price Outlook: WTI May Extend Push Higher as Retail Traders Turn Bearish

Crude Oil Price Outlook: WTI May Extend Push Higher as Retail Traders Turn Bearish

Crude oil prices extended higher over the past 24 hours, continuing a near-term winning streak since last week. In response, retail traders have been cautiously increasing downside exposure. This can be seen by taking a look at IG Client Sentiment (IGCS), which can at times function as a contrarian indicator. With that in mind, could WTI continue rising from here?

Crude Oil Sentiment Outlook – Bullish

According to IGCS, about 50% of retail traders are net-long crude oil. With the overall balance of exposure almost perfectly split between upside and downside bets, the near-term changes in positioning could offer a better outlook of how sentiment could inspire price action. In this regard, downside exposure has increased by almost +3% compared to yesterday and +6% versus last week. With that in mind, recent changes in positioning hint that the price trend may soon reverse higher.

Crude Oil Sentiment Outlook - Bullish

On the daily chart below, WTI has climbed to the 81.56 resistance zone established earlier in August. Clearing this point, as positioning is hinting at, could open the door to revisiting the August peak of 84.84. That would also undermine the breakout under the rising trendline from late June.

Meanwhile, a bullish Golden Cross remains in play between the 50- and 100-day Moving Averages. This has been offering an upside technical bias. In the event of extended losses, keep a close eye on the 38.2% Fibonacci retracement level of 77.96. Clearing this line would place the focus on the moving averages, which may reinstate the upside technical bias.

Crude Oil Daily Chart

Crude Oil Daily Chart


Euro Jumps as US Dollar Pauses and Japanese Yen Sinks. Higher EUR/USD and EUR/JPY?

Euro Jumps as US Dollar Pauses and Japanese Yen Sinks. Higher EUR/USD and EUR/JPY?

EUR/USD MACRO VIEW

The Euro continues to gain ground going into the Thursday session after 3-days of rallying off the 2-month low seen last Friday against the US Dollar.

Against the Japanese Yen, the Euro traded at its highest level since 2008 overnight and the acute disparity in monetary policy appears to be playing out.

USD/JPY made a 10-month high on Tuesday with no sign of the Bank of Japan in currency markets at this stage.

At the recent Jackson Hole economic symposium, European Central Bank (ECB) President Christine Lagarde raised her concerns about inflation but was less prescriptive about the rate path.

Nonetheless, she made it clear that rates will stay high for as long it takes to get inflation down.

Later today the market will get the latest Euro-wide CPI read with a Bloomberg survey of economists estimating the headline number to be 5.1% year-on-year against 5.3% prior. The core CPI forecast is looking at 5.3%, below the 5.5% previously.

Yesterday saw Spanish and German CPI come in a touch higher than anticipated and a notable miss in expectations may lead to volatility in the Euro.

EUR/USD DAILY TECHNICAL ANALYSIS SNAPSHOT

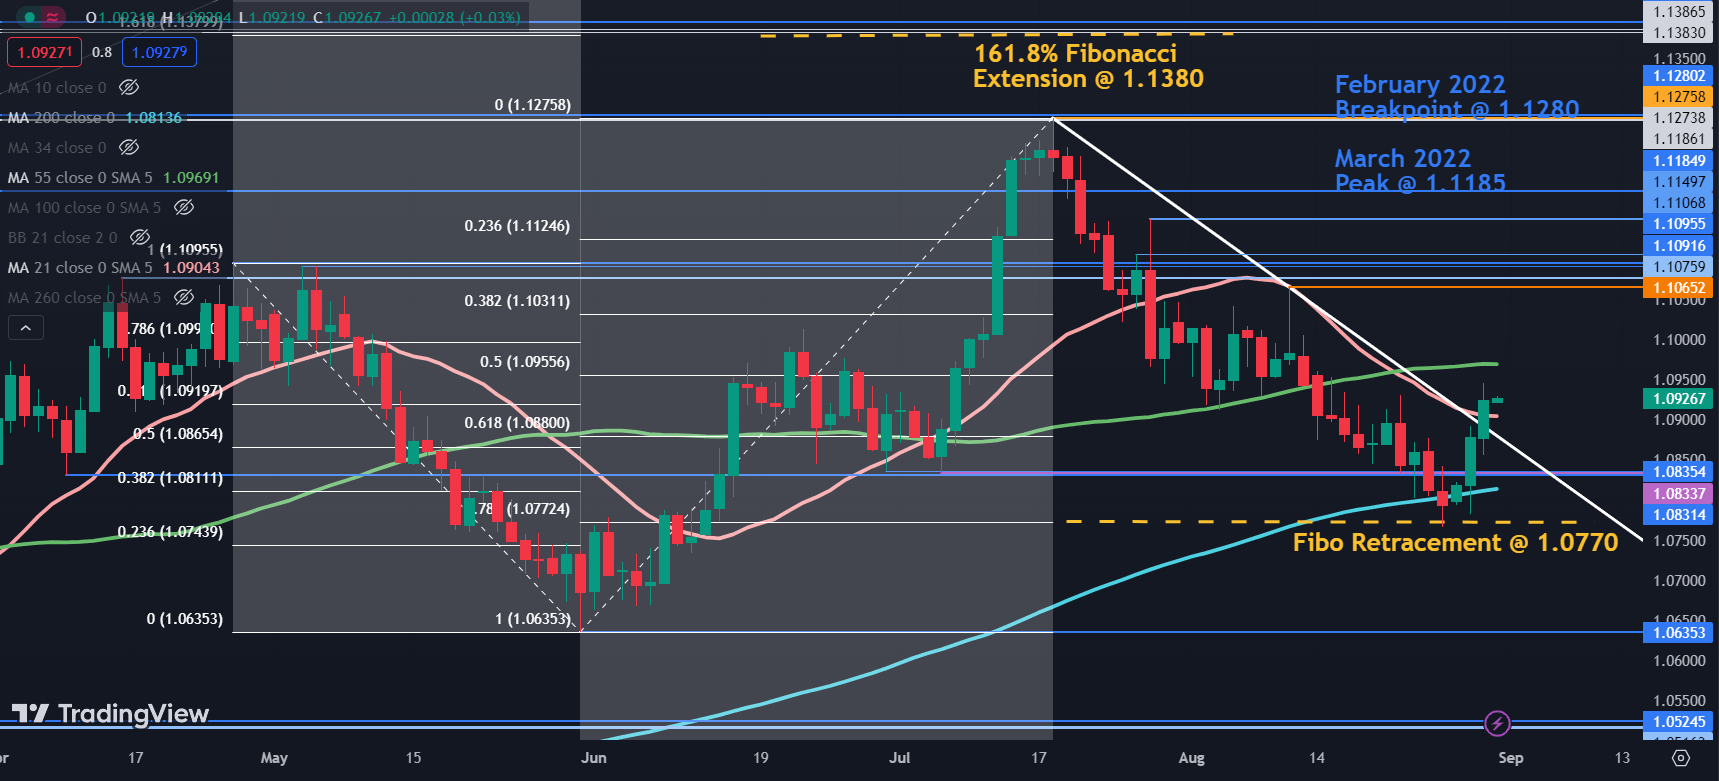
EUR/USD broke above a descending trend line overnight on the back of 3-days of solid gains so far this week.

In doing so, it cleared 21- and 200-day simple moving averages (SMA) and a series of breakpoints.

These indicators might now provide support with the 21-day SMA at 1.0904, the breakpoints in the 1.0830 – 1.0835 area and the 200-day SMA currently at 1.0814.

Support could also be near the 78.6% Fibonacci Retracement level at 1.0770. This level held last week and saw a bounce after it was tested.

If it were to rally, nearby resistance could be at the 55-day SMA near 1.0970.

Potential resistance might also be offered in the 1.1065 – 1.1095 area where several historical breakpoints reside along with a recent high and just ahead of the psychological level at 1.1100.

Further up, resistance could be at the breakpoint from the March 2022 high at 1.1185 or the recent peak at 1.1275, which coincides with two historical breakpoints.

Above those levels, resistance might be at the Fibonacci Extension of the move from 1.1095 to 1.0635 at 1.1380. Just above there are some more breakpoints in the 1.1385 – 95 area.

To learn more about Fibonacci technical analysis, click on the banner below.

image1.png


XAU/USD Price Forecast: Gold Extends on US Jobs Data

XAU/USD Price Forecast: Gold Extends on US Jobs Data

XAU/USD FUNDAMENTAL FORECAST

Gold prices remain buoyant after yesterday ADP employment change data supported job openings (JOLTs) earlier in the week by way of weaker than expected numbers. Coupled with US GDP missing estimates, the dollar weakened as markets anticipated an earlier interest rate cut by the Federal Reserve that has now been brought forward to May 2024 from June/July pre-announcement (refer to table below).

IMPLIED FED FUNDS FUTURES

image1.png

Later today, the focus will be on PCE price index data as well as jobless claims. Although jobless claims and the aforementioned labor reports are seen as inferior to the Non-Farm Payroll (NFP), markets tend to react but in a less significant manner.

GOLD ECONOMIC CALENDAR

image2.png

Market participants are aware that the NFP release often opposes prior labor statistics which is why there has not been any major fluctuations just yet. If NFPs follow the prior reports, gold may rally in a notable manner. Real yields have consequently fallen thus reducing the opportunity cost of holding bullion as it is a non-interest bearing asset.

US 10-YEAR REAL YIELDS

image3.png

TECHNICAL ANALYSIS

GOLD PRICE DAILY CHART

image4.png

Daily XAU/USD price action above now trades above the medium-term trendline resistance level (black) but is yet to confidently break above. There has been rejection by bears around the 1950.00 psychological handle while the Relative Strength Index (RSI) heads towards overbought territory. As mentioned above, upcoming US economic data will be crucial to set the directional tone for the rest of the month.

Australian Dollar Spikes After China PMI Beat; Can AUD/USD Rise Toward 0.66?

Australian Dollar Spikes After China PMI Beat; Can AUD/USD Rise Toward 0.66?

The Australian dollar rose briefly against the US dollar on tentative signs that China’s manufacturing activity could be reviving. China NBS manufacturing PMI rose slightly to 49.7 in August vs. 49.4 expected, and 49.3 in July. NBS non-manufacturing PMI slowed to 51.0 vs. 51.1 expected and 51.5 in July. While the manufacturing sector is still in contraction territory, the improvement provides comfort that the recent stimulus measures are spilling over the economy.

Thursday’s data is in line with the recent less-worse-than-expected China macro data which broadly have been underwhelming, as the Economic Surprise Index shows. The China Economic Surprise Index has rebounded slightly recently, but it is not too far from mid-2020 lows (Covid levels) which has prompted analysts to downgrade growth estimates for the current year. China is Australia’s largest export destination and changes in the world’s second-largest economy tend to have implications for the Australian economy.

AUD/USD 5-minute Chart

image1.png

Chart Created by Manish Jaradi Using TradingView

Chinese policymakers have responded with a spate of targeted stimulus measures in recent weeks in an attempt to revive the faltering post-Covid recovery and a struggling property sector. However, with a massive stimulus seemingly off the table (given the associated risks of creating imbalances within the economy), broader risk sentiment is likely to drive AUD in the interim.

AUD/USD Weekly Chart

image2.png

Chart Created by Manish Jaradi Using TradingView

Risk appetite has been contained for now as recent soft data doesn’t suggest a resurgence in US economic growth, capping US yields and weighing on the US dollar globally. The stabilization in risk sentiment has overshadowed the moderation in Australian inflation, lessening the need for further rate hikes by the Reserve Bank of Australia. See “Australian Dollar Falls After CPI Miss; Which Way for AUD/USD, AUD/JPY?” published August 30.

AUD/USD 240-Minute Chart

image3.png

Chart Created by Manish Jaradi Using TradingView

AUD/USD: Beginning to flex muscles

On technical charts, AUD/USD is attempting to break above a vital ceiling at last week’s high of around 0.6500. A decisive break above could pave the way toward the 200-period moving average on the 240-minute charts (now at about 0.6600).

Bearish pressure on AUD/USD has eased recently – a possibility highlighted in the previous update. See “US Dollar Flirts with Resistance After Powell; EUR/USD, GBP/USD, AUD/USD Price Action,” published August 28, and “Australian Dollar Looks to Recoup Losses Ahead of CPI; AUD/USD, AUD/NZD, AUD/JPY,” August 29.

Wait-and-See Ahead of US PCE Data, China’s PMI Mixed: SPDR Semiconductor ETF, China A50, Brent Crude

Wait-and-See Ahead of US PCE Data, China’s PMI Mixed: SPDR Semiconductor ETF, China A50, Brent Crude

Wall Street headed higher for the fourth straight day, but this time with more measured gains as some reservations kicked in ahead of the US core Personal Consumption Expenditures (PCE) data release later today. Current consensus are for a stronger growth in the headline figure to 3.3% year-on-year (YoY) from previous 3%, along with the core aspect to 4.2% YoY from previous 4.1%. Therefore, while the broader trend for US inflation is still to the downside, there may be concerns that any persistence in pricing pressures reflected may feed into a high-for-longer rate outlook.

Aside, economic softness was the takeaway from US macro data overnight. The US Q2 Gross Domestic Product (GDP) growth rate was revised lower to 2.1% from its preliminary 2.4%, while private payrolls growth slowed more than expected (177,000 versus 195,000 forecast) – its first downside surprise in five months. US Treasury yields pared initial losses on some indecision, more notably with the two-year yields attempting to defend its 50-day moving average (MA) for now.

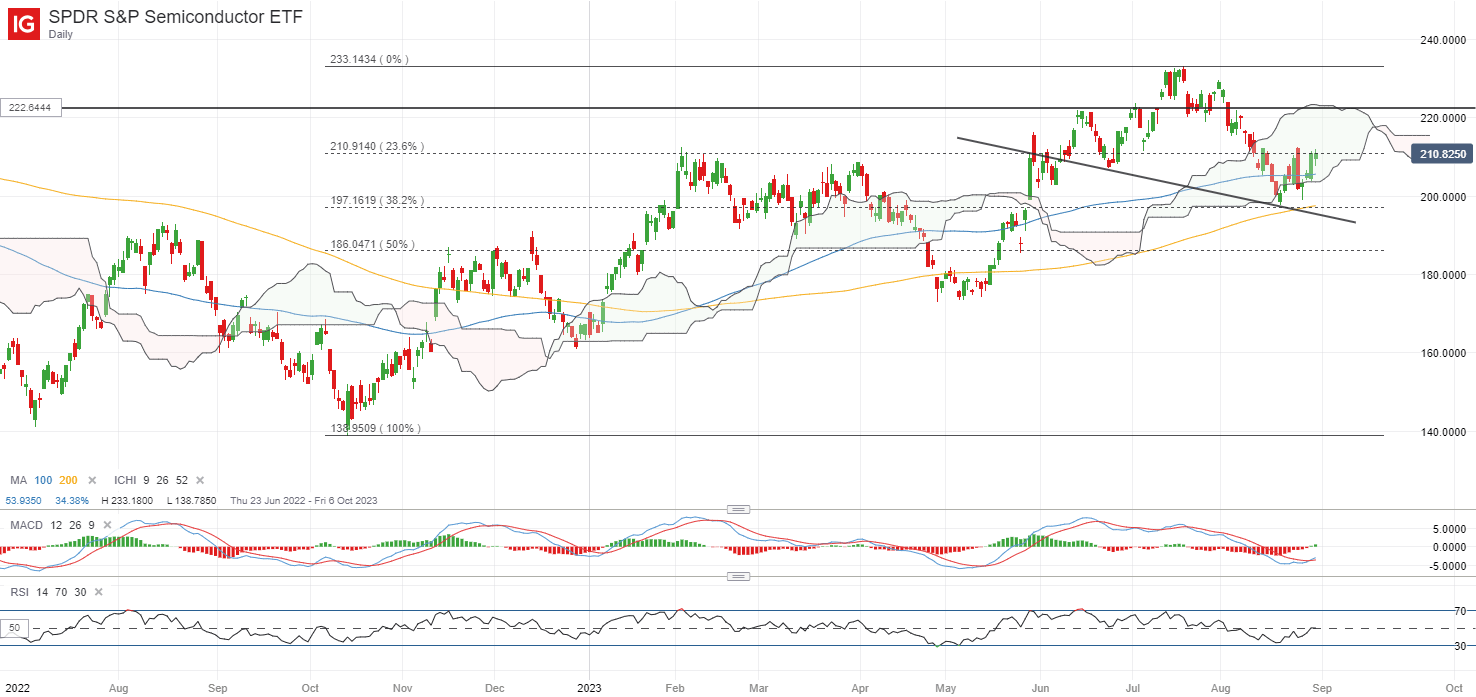
One to put on the radar may be the SPDR S&P Semiconductor ETF, which is back at a key level of resistance at the 210.91 level. This level marked the peak of last Thursday’s sell-off, along with heavy resistance back in February 2023. Reclaiming this level may pave the way to retest the 222.64 level next, while on the downside, the Ichimoku cloud on the daily chart seems to serve as a strong support to hold.

image1.png

Source: IG charts

Asia Open

Asian stocks look set for a subdued open, with Nikkei +0.29%, ASX +0.05% and KOSPI -0.10% at the time of writing, displaying some wait-and-see in the lead-up to the US inflation data ahead. A slew of economic data in the region will be on watch today, with the morning starting off with a mixed showing from Japan, which could see the Bank of Japan (BoJ) retain its ultra-loose monetary policies. External global demand remains a pressure point for Japan’s July factory output (-2.0% versus -1.4% forecast), but reopening momentum continues to provide some economic cushion, with retail sales crushing expectations in July (6.8% versus 5.4% forecast).

On another front, China’s purchasing managers index (PMI) data delivered another set of subdued read, with manufacturing activities remaining in contractionary territory for the fifth straight month (49.7 versus 49.2 consensus) while reopening momentum for its services sector continue to taper (51.0 versus 51.2 consensus). Overall, it may seem that ongoing policy support has not translated to a significant turnaround in economic conditions just yet, which may call for more to be done through the rest of the year, although more measured responses will likely be the stance from authorities.

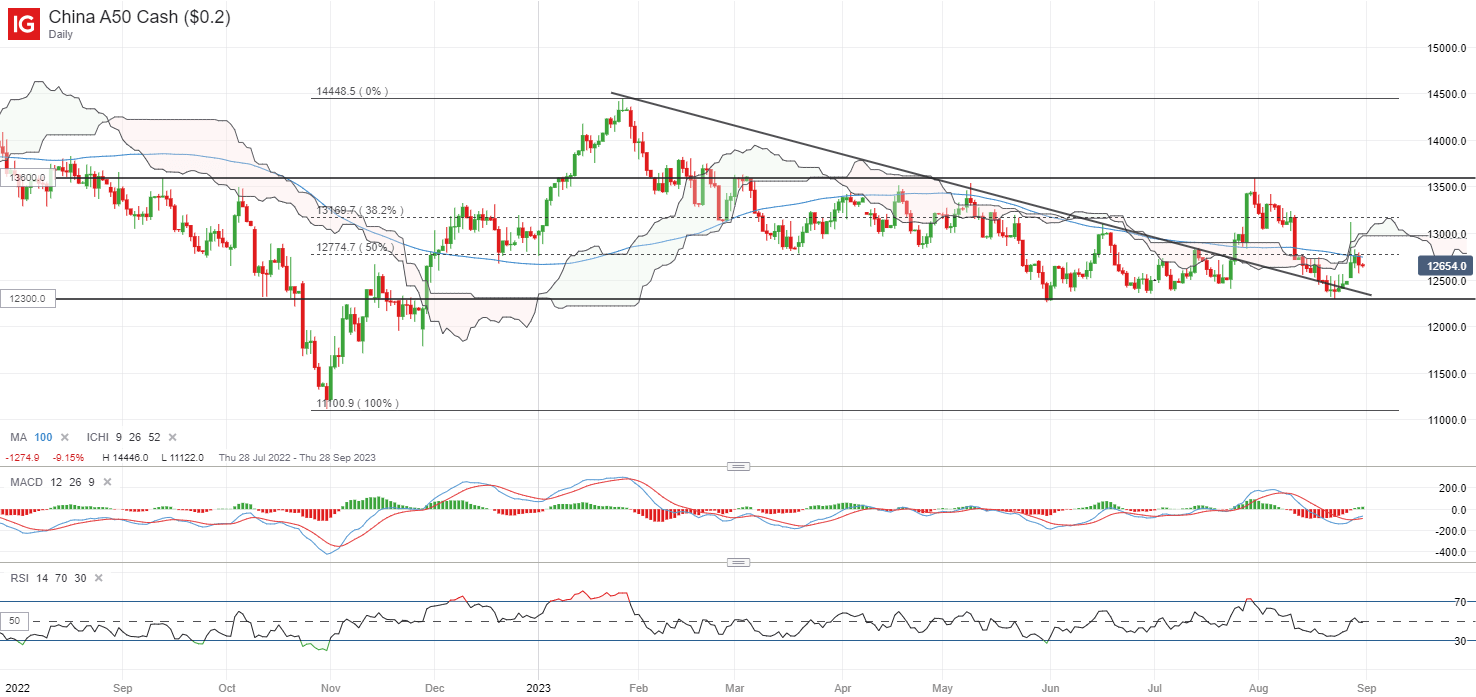
The China A50 index continues to trade on a wider consolidation pattern, reflecting some indecision as the success of policy support has not been validated thus far. The 12,300 level continues to be a key level for buyers to defend, having supported the index on at least three previous occasions. On the upside, immediate resistance may be at the 12,800 level, where an earlier rally attempt fizzles this week. Ultimately, a break above its current ranging pattern may be warranted to provide conviction of buyers in control, leaving the 13,600 level on watch over the medium term.

image2.png

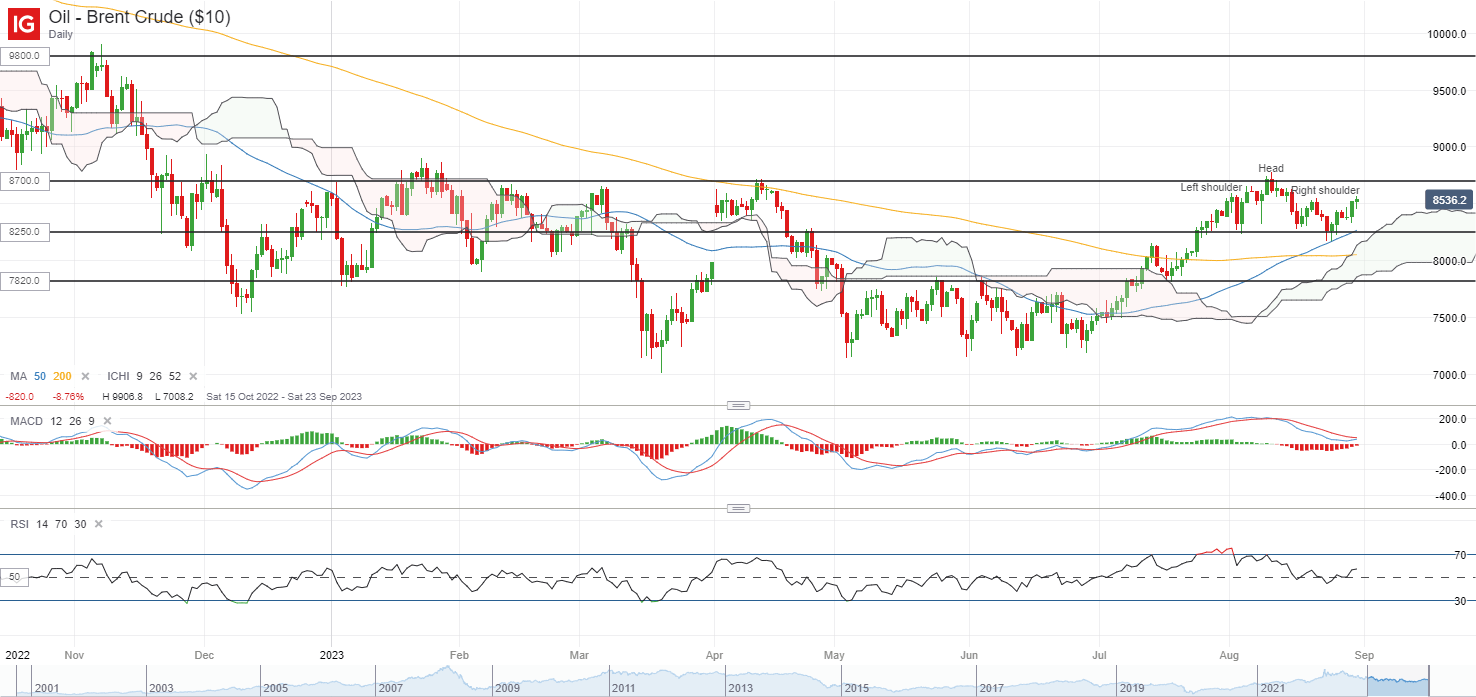
On the watchlist: Will Brent crude prices find its way to retest its year-to-date high?

Brent crude prices have pared almost all of its last week’s losses thus far, with another more-than-expected drawdown in US inventories, tensions in Gabon and concerns over a hurricane off the US gulf coast supporting a tighter-supplies outlook. That said, these are pitted against some headwinds in demand conditions, questioned by the weaker-than-expected US GDP data overnight and another set of subdued PMI read from China – the world’s second-largest oil consumer.

On the technical side, prices have manged to defend a head-and-shoulder neckline on its daily chart thus far and continues to trade above both its 50-day and 200-day MA, which may still place buyers in control. One to watch if prices will be able to reclaim its year-to-date high at the US$87.00 level, which also marked the upper bound of its wide ranging pattern since November 2022. A move above this level may potentially leave its November 2022 high at the US$98.00 level in sight.

image3.png