Bitcoin Soars on Grayscale’s Legal Victory over SEC. What’s Next for BTC/USD?

Bitcoin Soars on Grayscale’s Legal Victory over SEC. What’s Next for BTC/USD?

Bitcoin staged a remarkable and vigorous rally on Tuesday, jumping more than 7% and breaking above its 200-day simple moving average handily, propelled by a pivotal and game-changing legal development in the U.S. legal system that promises to reshape the landscape of digital tokens.

In a significant turn of events, the U.S. Court of Appeals for the DC Circuit ruled that the Securities and Exchange Commission (SEC) was wrong in denying investment giant Grayscale’s request to convert its popular bitcoin trust GBTC into an Exchange-Traded Fund (ETF), asserting that the decision was “arbitrary and capricious”.

The legal saga had its origins in 2022 when the SEC, under the leadership of Gary Gensler, was sued for blocking Grayscale’s application to list an ETF that tracks the price of bitcoin on the basis that spot transactions in this asset were unregulated and subject to market manipulation.

While the SEC may explore avenues to overturn the judgment, such as appealing to the Supreme Court or seeking a rehearing, it is unclear if it will do so. For now, the ultimate outcome remains uncertain, but should Grayscale prevail, the federal regulator may be forced to revisit its earlier verdict and possibly greenlight the original petition, paving the way for the first crypto ETF.

We will have more information soon to better assess the outlook for the cryptocurrency realm. In the meantime, it would not be surprising to see a growing wave of positive sentiment fostered by speculation that the court system would curtail stringent government regulations within the space. This could amplify BTC/USD’s upside, boosting its recovery heading into September.

Navigate crypto trends with confidence. Download Bitcoin’s third-quarter trading guide for free!

 BITCOIN TECHNICAL ANALYSIS

After Tuesday’s powerful rally, Bitcoin recaptured its 200-day simple moving average and cleared a key ceiling at $27,500. If this bullish breakout is sustained, buying interest could gather pace upcoming trading sessions, setting the stage for a move to $28,500, followed by $29,000. On further strength, a retest of the $30,000 becomes likely.

On the flip side, if sellers return to the market and spark a bearish reversal, initial support appears at $27,500 and $25,800 thereafter. Further down the line, attention shifts to the August lows, situated just a touch above the psychological $25,000 level.

Elevate your cryptocurrency trading skills today with our comprehensive guide packed with essential insights and effective strategies for navigating the world of digital tokens

BITCOIN TECHNICAL CHART

A screenshot of a computer screen  Description automatically generated


Gold Price Forecast: XAU/USD May Rise After US Job Openings Data Fuel Bearish Exposure

Gold Price Forecast: XAU/USD May Rise After US Job Openings Data Fuel Bearish Exposure

Gold prices soared nearly 1% over the past 24 hours after an unexpected miss in US job openings increased expectations of a more dovish Federal Reserve in the long run. Retail traders have responded immediately, increasing bearish XAU/USD exposure. This can be seen by looking at IG Client Sentiment (IGCS), which often functions as a contrarian indicator. With that in mind, will gold make further upside progress?
Gold Sentiment Outlook – Bullish

The IGCS gauge shows that about 71% of retail traders are net-long gold. Since most are still biased to the upside, this suggests prices may fall down the road. But, downside exposure has increased by 16.35% and 45.24% compared to yesterday and last week, respectively. With that in mind, recent changes in exposure warn that the current price trend may extend higher.
Recent gains in gold prices have pushed the yellow metal back to the key falling trendline from April. It is also sitting on the intersection of a former rising trendline from November. The pink circle in the chart below highlights this potential key zone of resistance that could prove too formidable to break through. But, an upside breakout would offer a stronger bullish technical conviction.

That would place the focus on the 23.6% Fibonacci retracement level of 1971 followed by the minor 14.6% point at 2013.65. Otherwise, holding at resistance and turning lower would be in line with the broader downtrend since earlier this year. Key support is the 38.2% level at 1903.46 followed by the August swing low of 1884.
Chart Created in Trading View

Australian Dollar Falls After CPI Miss; Which Way for AUD/USD, AUD/JPY?

Australian Dollar Falls After CPI Miss; Which Way for AUD/USD, AUD/JPY?

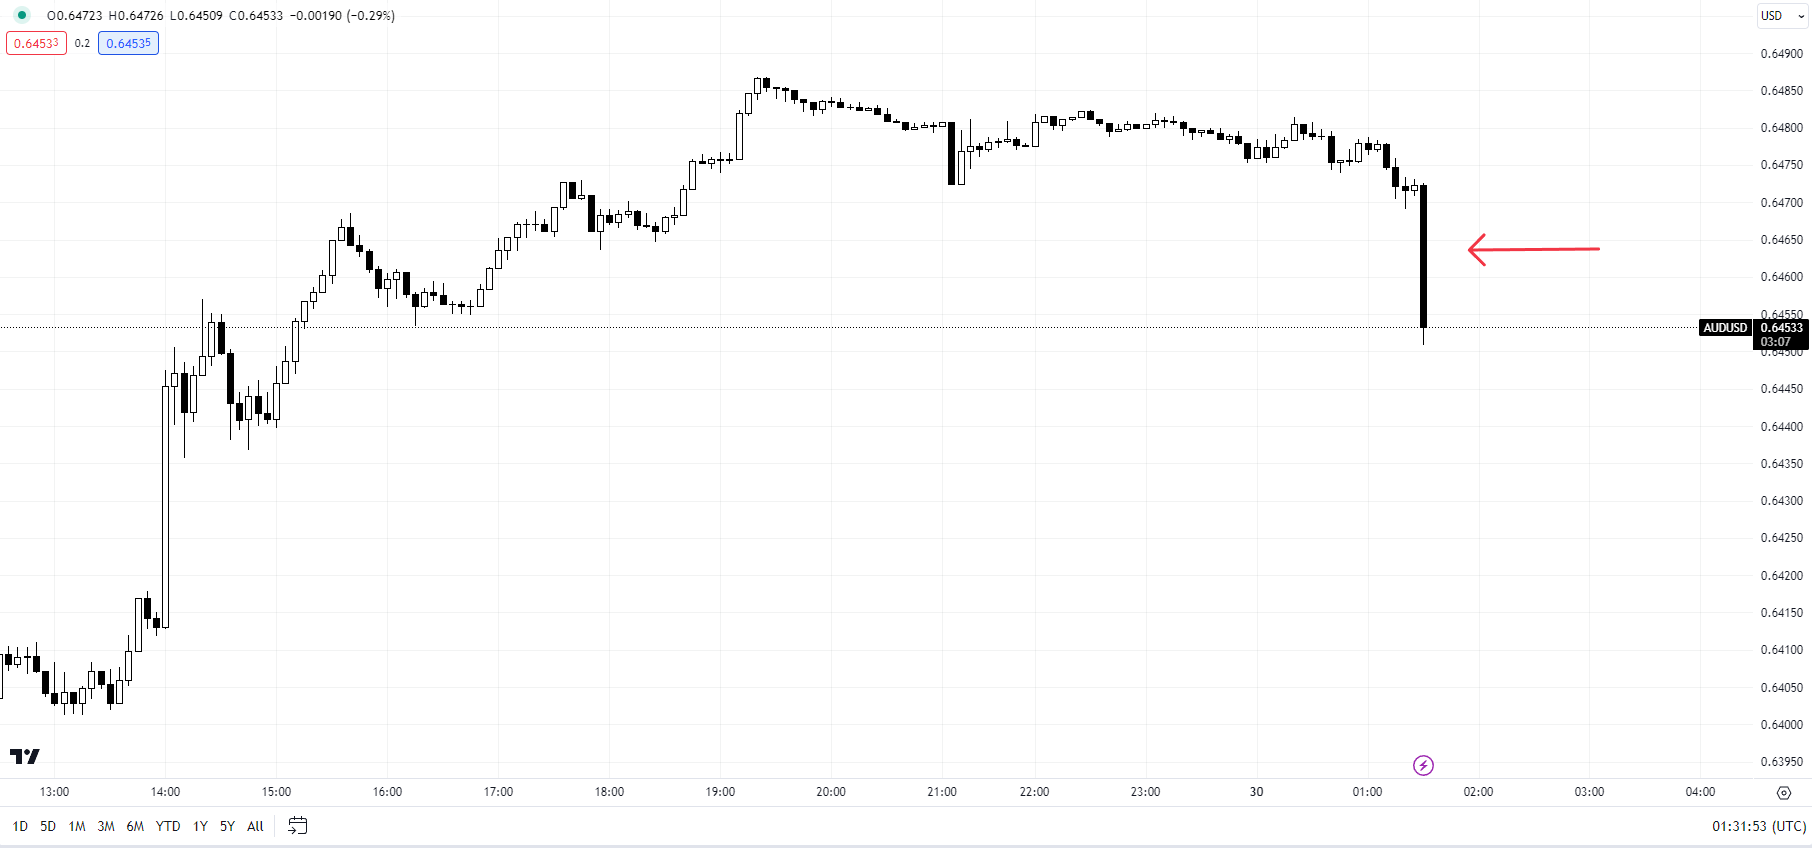
The Australian dollar fell after consumer price inflation moderated more than expected last month, reinforcing the view that the Reserve Bank of Australia (RBA) will keep interest rates on hold in the foreseeable future.

Australia’s CPI eased to 4.9% on-year in July vs. 5.2% expected, and down materially from 5.4% in June. The softening in price pressures is a welcoming sign, coinciding with the RBAs view that the worst is probably over for inflation. Having said that, the monthly CPI figures tend to be volatile and not necessarily a good predictor of the quarterly CPI, which holds more relevance from RBA’s perspective.

AUD/USD 5-minute Chart

image1.png

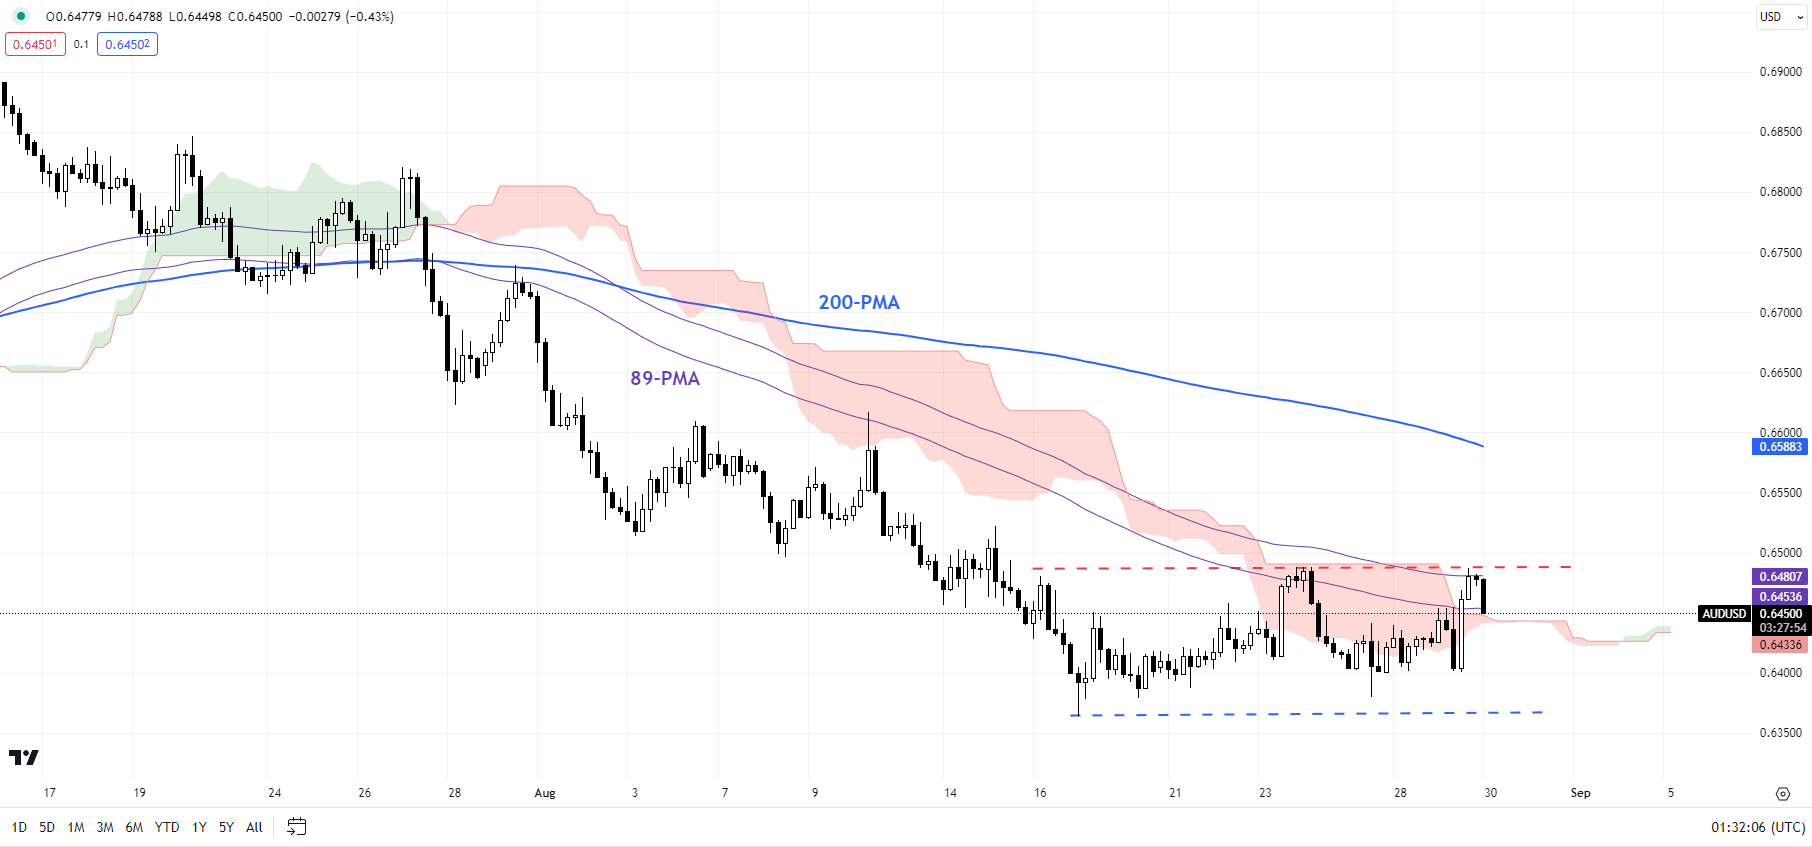
Nevertheless, the disinflation trend is likely to give comfort to RBA as it seeks to engineer a soft landing. The Australian central bank held rates steady at 4.1% at its previous two meetings, and markets are pricing in a high chance that the central bank will stay pat when it meets next week amid worsening growth prospects, early signs of cooling of the labour market and a deteriorating growth outlook in China. In a sign that consumer demand is softening, Australian retail sales rebounded last month, but the annual rate slowed further.

AUD/USD 240-Minute Chart

image2.png

Notwithstanding last week’s weak US activity data, broadly the US economy appears to be outperforming some of its peers, especially China and Europe. The resilience of the US economy has boosted the US dollar. Powell’s remarks at Jackson Hole last week were largely balanced, but with a slightly hawkish tilt, further offering some support to the greenback. Moreover, the perception that RBA is done hiking rates has weighed on AUD.

However, risk appetite appears to have stabilized for now, thanks to the retreat in US yields, recent support measures from Chinese policymakers, and stretched bearish sentiment.

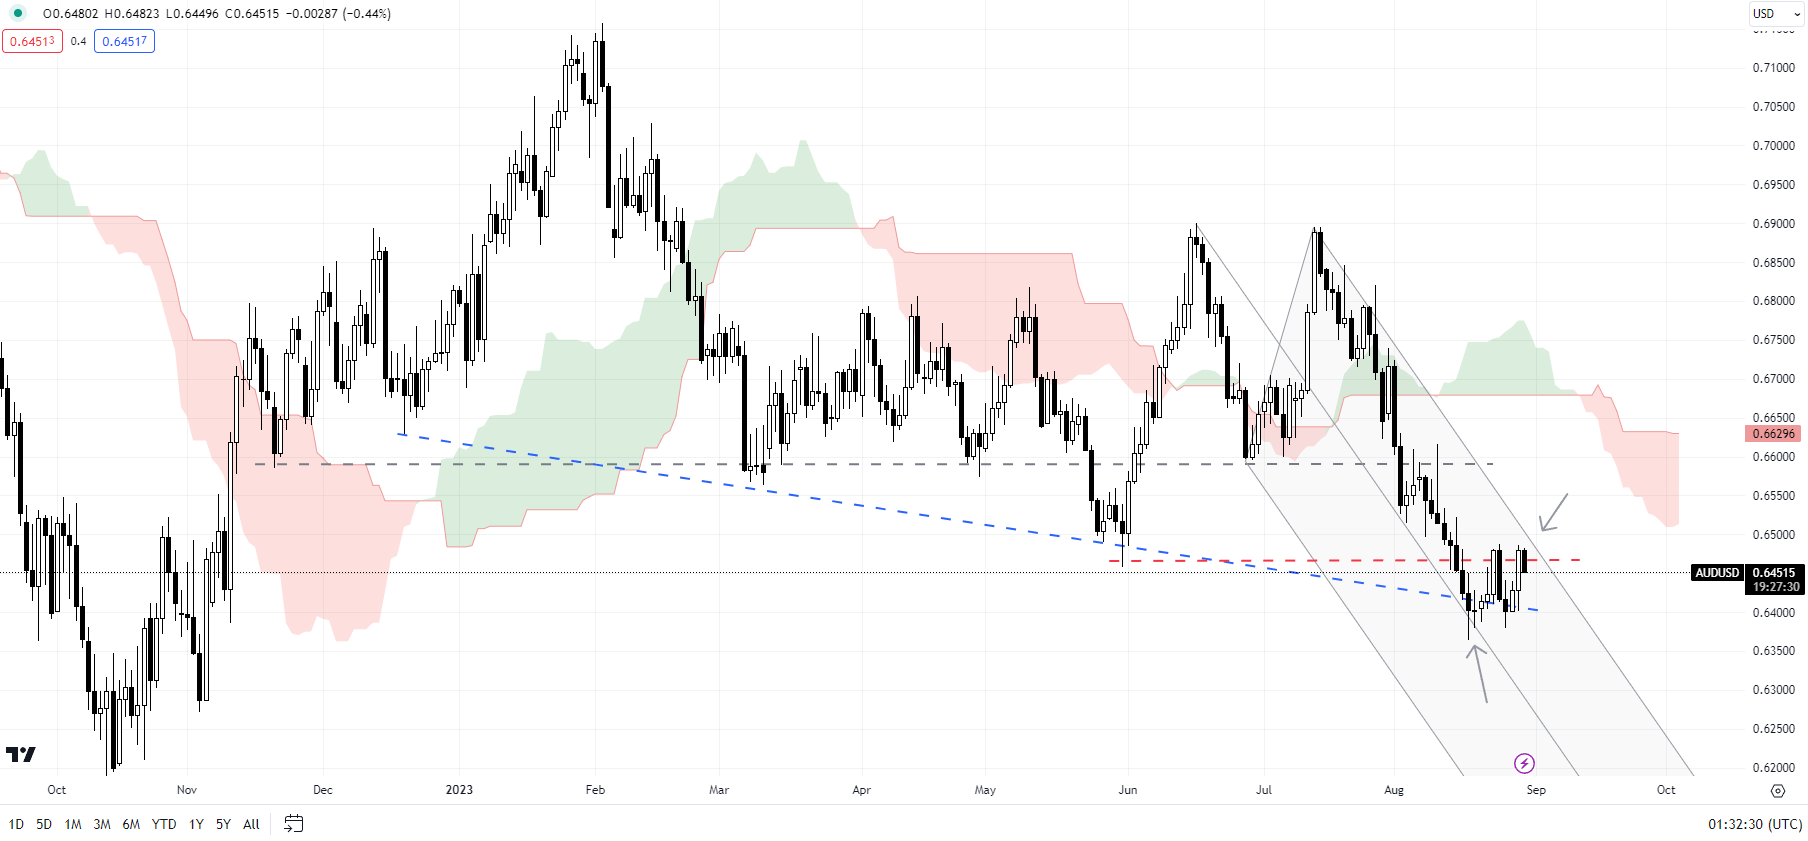
AUD/USD Daily Chart

image3.png

AUD/USD: Not out of the woods yet

On technical charts, the bearish pressure on AUD/USD has eased somewhat – a possibility highlighted in the previous update. See “US Dollar Flirts with Resistance After Powell; EUR/USD, GBP/USD, AUD/USD Price Action,” published August 28, and “Australian Dollar Looks to Recoup Losses Ahead of CPI; AUD/USD, AUD/NZD, AUD/JPY,” August 29. However, for the downward pressure to fade meaningfully, AUD/USD needs to break above last week’s high of around 0.6500. Such a break could pave the way initially toward the 200-period moving average on the 240-minute charts (now at about 0.6600).

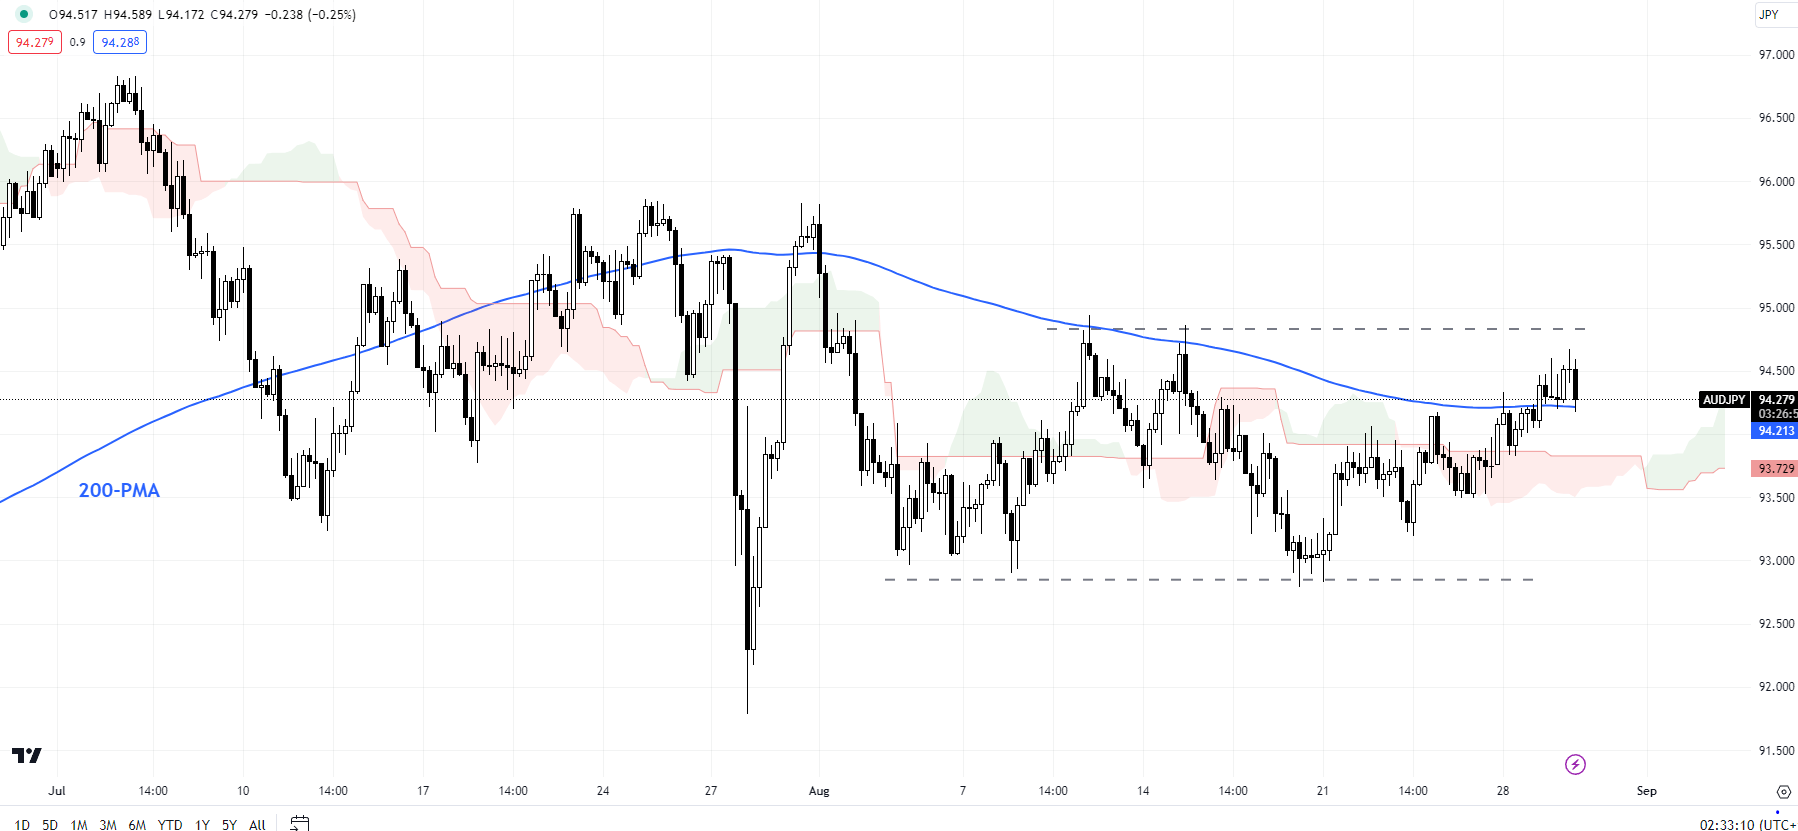
AUD/JPY 240-Minute Chart

image4.png

AUD/JPY: Attempting to break above key resistance

AUD/JPY is re-attempting to break above the key resistance area on the 200-period moving average on the 240-minute charts, roughly coinciding with the August 10 high of 95.00. Previous attempts since mid-July haven’t been fruitful, so a break above would be significant from a trend perspective. Such a break could be a strong sign that the bearish pressure is fading – a point highlighted in the previous update. See “Australian Dollar Looks to Recoup Losses Ahead of CPI; AUD/USD, AUD/NZD, AUD/JPY,” August 29.

Asia Day Ahead: Weak US Data Cooled Rate Bets; Australia inflation Below Expected

Asia Day Ahead: Weak US Data Cooled Rate Bets; Australia inflation Below Expected

Wall Street took comfort from several downside surprises in US macro data overnight, with the data taming some rate hike bets and saw US Treasury yields decline. The US two-year yields were down 11 basis-point (bp), reversing all of last week’s gains, while the 10-year yields were down 8 bp to deliver a two-week low. The US dollar reverses further (-0.3%), allowing major US indices to secure its third straight day of gains.

Both the US job openings and consumer confidence data overnight were lower than expected, which point towards a weaker consumer spending outlook and some cooling in labour demand. US consumer confidence fell by the most in two years, while job openings touched its lowest level since March 2021. The weaker data may aid to tame the upside in pricing pressures ahead and provided room for the Fed to consider keeping rates on hold, as compared to additional tightening.

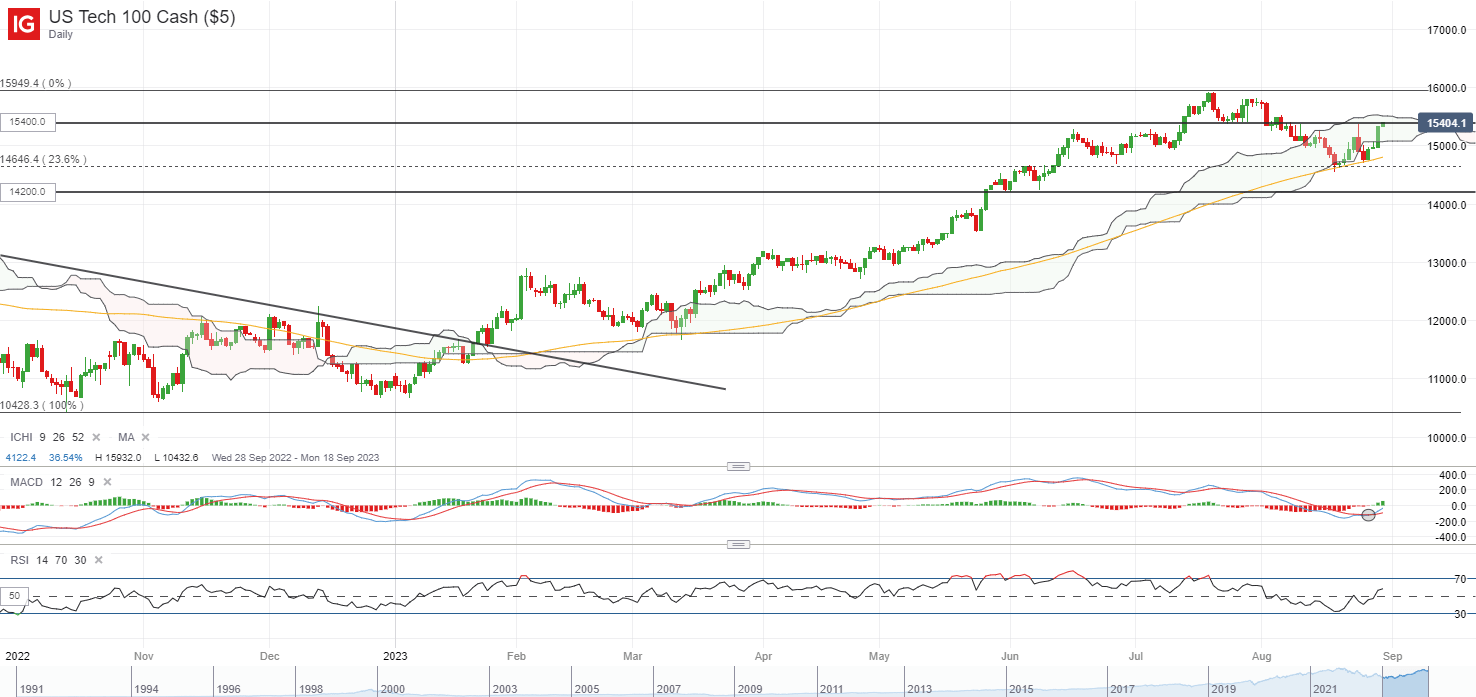
The overnight risk rally has allowed the Nasdaq 100 index to overcome its last Thursday’s sell-off, reflecting some control from buyers. This follows after finding support off the 14,630 level, where its 100-day moving average (MA) stands alongside the lower edge of its Ichimoku cloud on the daily chart. A bullish crossover is formed on its moving average convergence/divergence (MACD), with any move above the 15,400 level potentially paving the way to retest its year-to-date high at the 15,900 level next.

image1.png

Asia Open

Asian stocks look set for a positive open, with Nikkei +0.47%, ASX +0.85% and KOSPI +0.66% at the time of writing. The Nasdaq Golden Dragon China Index is up 3.7% overnight, with Chinese equities riding on the improved risk environment for a turnaround from Monday’s whiplash. Earlier stamp duty cuts on stock trades provided some lingering optimism, although its upcoming purchasing managers index (PMI) releases tomorrow will provide another reckoning for its still-weak economic conditions.

This morning saw a significant downside surprise in Australia’s monthly Consumer Price Index (CPI) read, coming in at 4.9% versus the 5.2% expected, which validates current rate expectations for the Reserve Bank of Australia (RBA) to keep rates on hold into next year. This marked the first time since February 2022, where the monthly CPI indicator falls below the 5% level. But given that it is still a distance away from the RBA’s 2-3% target, the central bank may continue to maintain its hawkish-pause stance for some policy flexibility, although we are likely seeing the end of its tightening process.

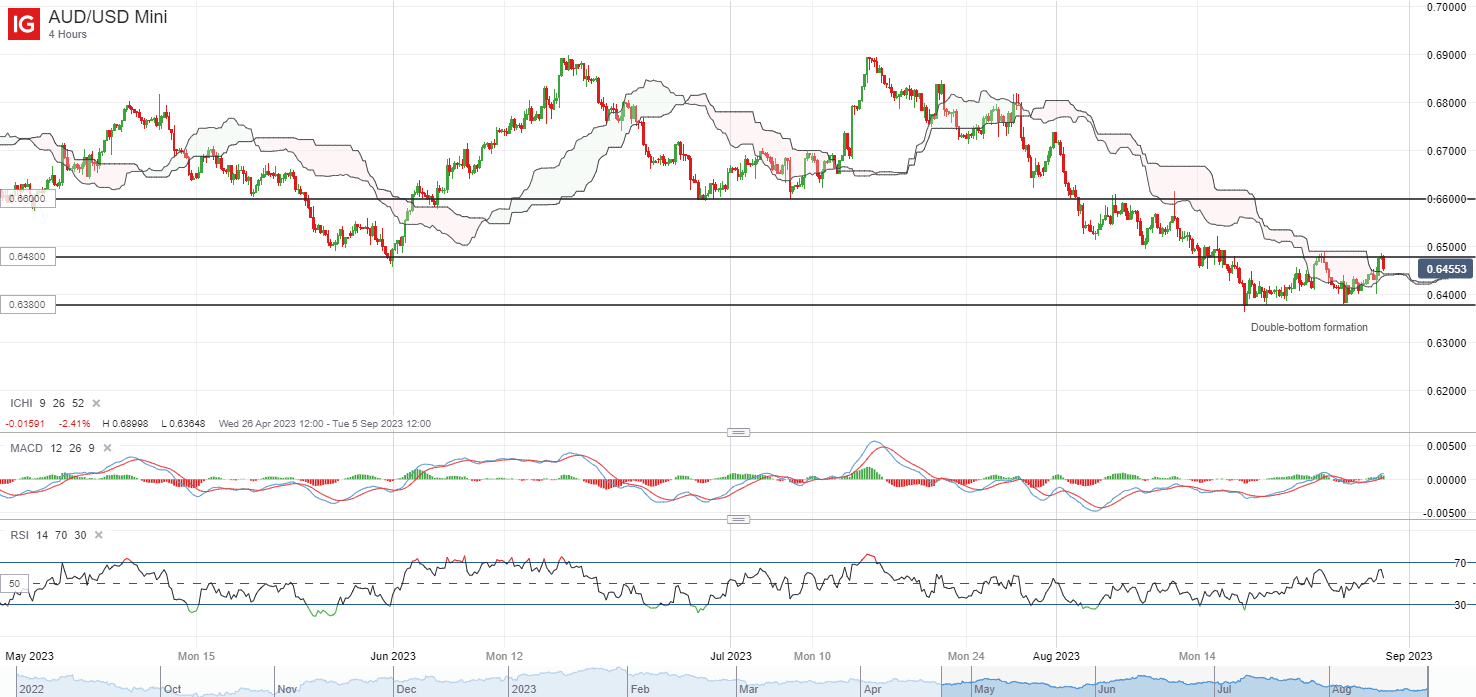
Improved risk sentiments and some near-term relief on the China’s front have allowed room for some recovery in the AUD/USD this week, but upside has been challenged into today’s session with the lower-than-expected Australia’s inflation number. The pair has been displaying a near-term double-bottom pattern on its four-hour chart, but resistance are currently found at its neckline at the 0.648 level, which also marked the peak of last Thursday’s sell-off. A move above this level will be much needed to support further recovery to retest the 0.660 level next, while on the other hand, further downside may leave its 0.638 level on watch.

image2.png

Source: IG charts

On the watchlist: Paring rate hike bets brought some cooling in US dollar rally

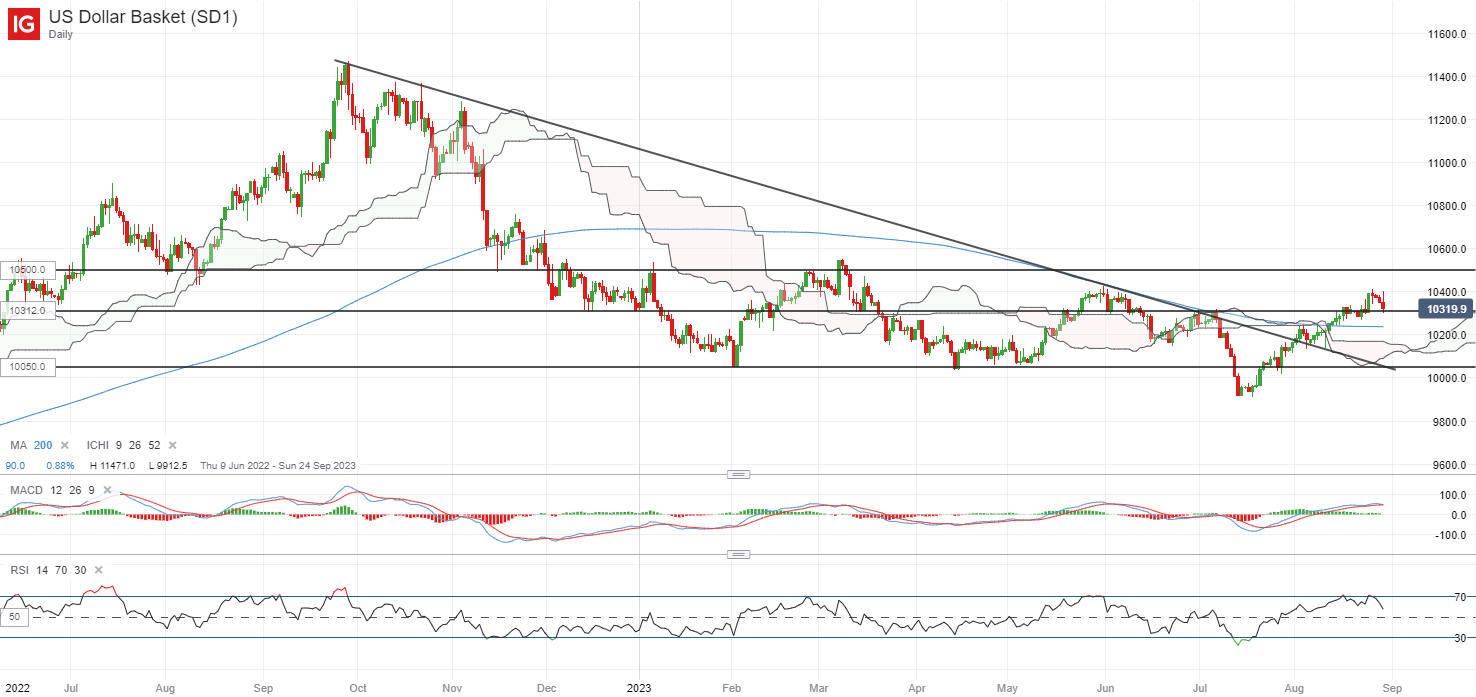
Rate expectations for the November Fed meeting have leaned back towards a rate-pause scenario, following yesterday’s weaker-than-expected US macro data. The odds for rates to be kept on hold in November currently stands at 51%, versus the 38% probability priced at the start of the week. With paring rate hike bets, the US dollar rally cooled for the third straight day, finding its way back to the 103.12 level.

Its 200-day MA will be one to watch next, with the US dollar having reclaimed the MA line previously for the first time since November 2022. Any failure for the 200-day MA to hold may validate sellers in greater control and potentially pave the way back towards the 100.50 level next.

image3.png

Source: IG charts

British Pound Price Action Setups: GBP/USD, EUR/GBP Nearing Key Pivot Points?

British Pound Price Action Setups: GBP/USD, EUR/GBP Nearing Key Pivot Points?

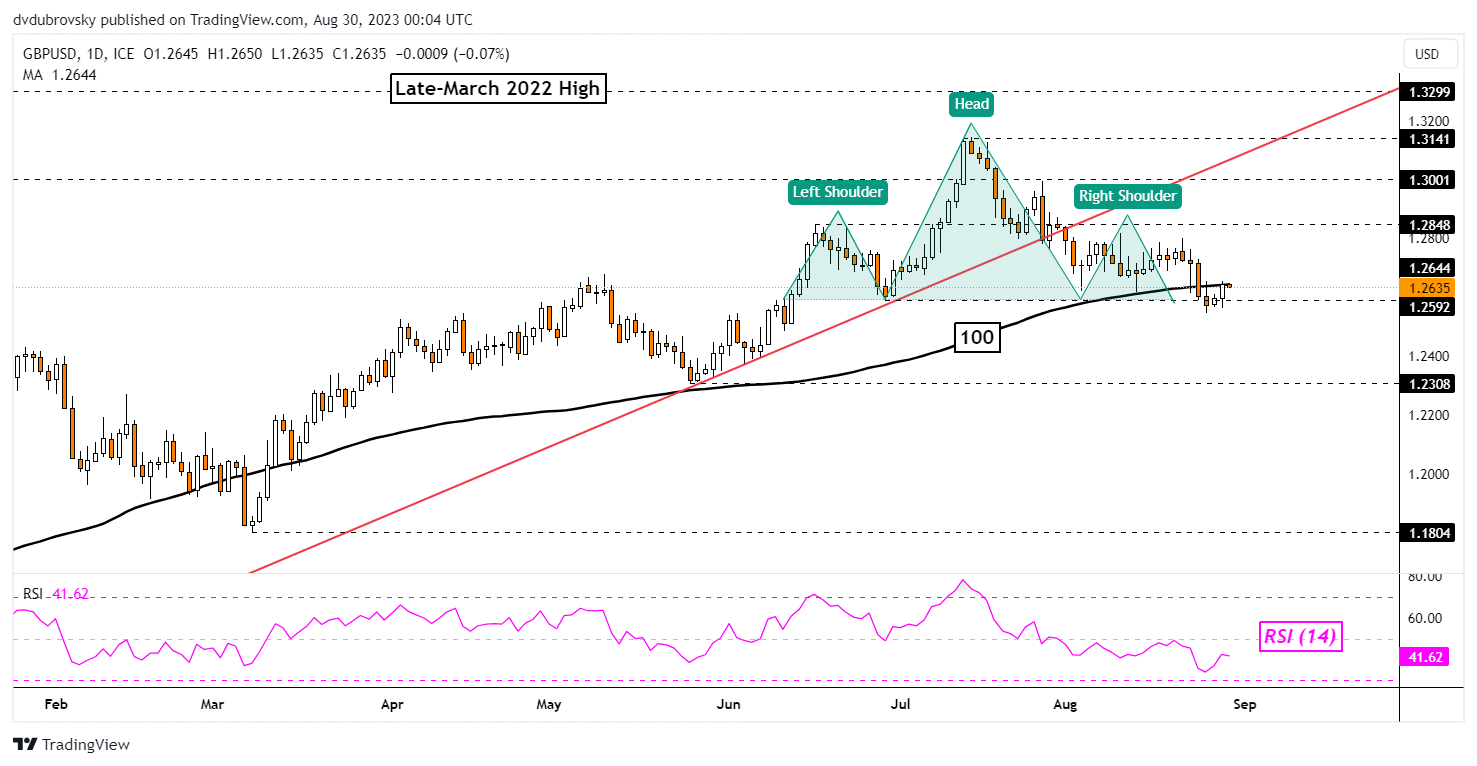
The British Pound continues to be overshadowed by a brewing bearish Head & Shoulders chart formation against the US Dollar. On the daily chart below, GBP/USD can be seen struggling to clear the neckline around 1.2592. Furthermore, prices are struggling to find follow-through after breaking under the 100-day Moving Average (MA).

Confirming a drop through 1.2592 opens the door to extending lower, placing Sterling at risk. That exposes the May low of 1.2308 as key support below. Otherwise, turning higher places the focus on the left shoulder inflection point of 1.2848. Extending gains beyond that may open the door to revisiting the July high of 1.3299.

image1.png

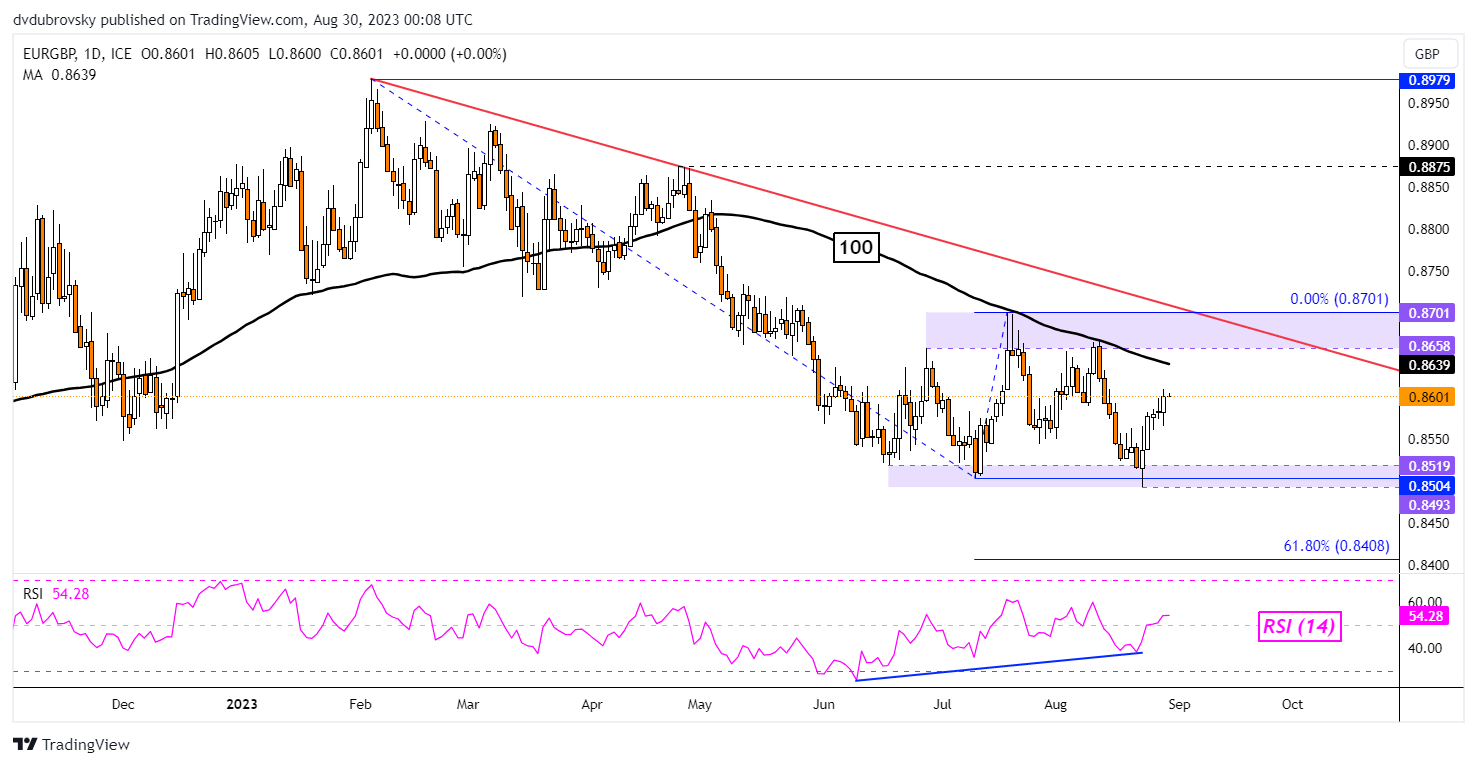
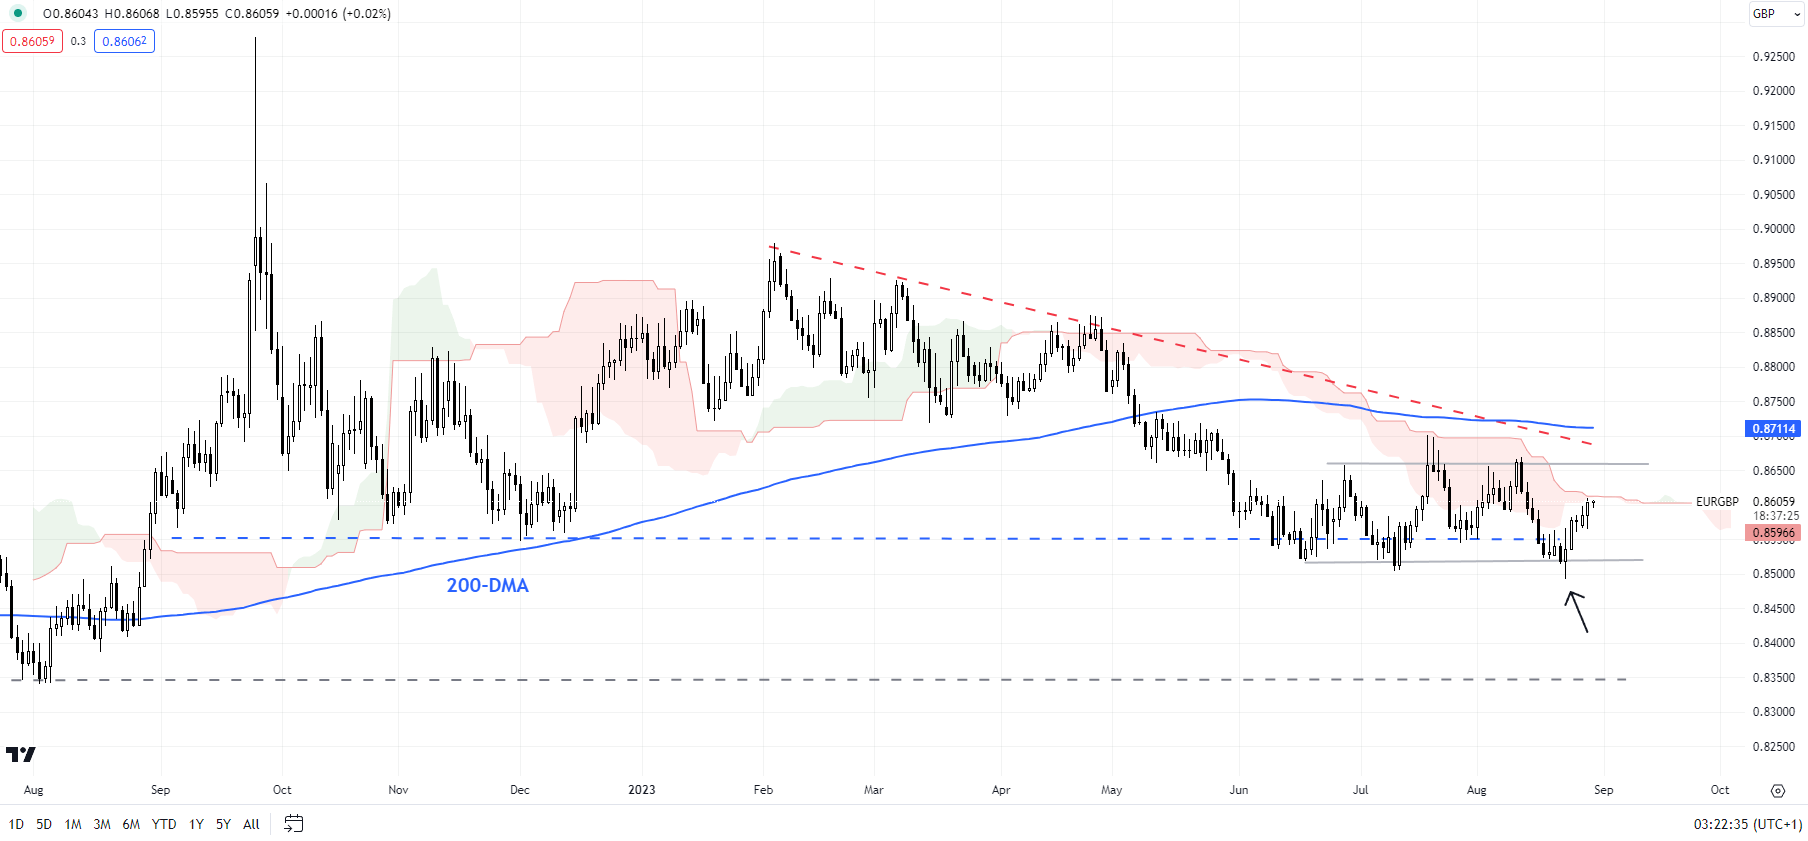
Meanwhile, it is a different story against the Euro. Here, the British Pound is in a fairly neutral setting. EUR/GBP can be seen consolidating between 2 key ranges of support and resistance. The former seems to be around the 0.8493 – 0.8519 area while the latter is between 0.8652 – 0.8701. The recent bounce off support followed persistent positive RSI divergence.

This is typically a sign of fading downside momentum which can at times precede reversals. Now, the focus is shifting to the 100-day Moving Average. This line has held as resistance earlier this year, maintaining the broader downside focus. Another rejection could open the door to turning lower, placing the focus on the August swing lower. Otherwise, pushing higher places the focus on the zone of resistance.

image2.png


Euro’s Downside Cushioned Ahead of Euro Area CPI, US PCE: EUR/USD, EUR/GBP Action

Euro’s Downside Cushioned Ahead of Euro Area CPI, US PCE: EUR/USD, EUR/GBP Action

The euro is attempting to recover some lost ground against its peers ahead of Euro area inflation data and US core PCE price index data due Thursday.

The price data comes in at a time when downside surprises in Euro area macro data have narrowed recently, with the Economic Surprise Index turning up meaningfully this month. In contrast, US economic data have been less overwhelming than in the recent past, supporting EUR/USD to some extent for now.

Economic Surprise Index – Euro Area and US

A graph of a graph of a graph of a graph of a graph of a graph of a graph of a graph of a graph of a graph of a graph of a graph of a graph of  Description automatically generated

However, last week’s PMI data, especially the sharp drop in services PMI, raises the risk that activity in the Euro area could contract again in the current quarter after expanding in Q2. The deterioration in outlook is a sign that the tightening in financial conditions is spilling over fast across the economy, providing room for the ECB to leave interest rates unchanged at its September meeting. The key question remains to what extent the negatives are already in EUR’s price. Moreover, consensus US economic growth expectations appear to be optimistic, leaving scope for disappointment.

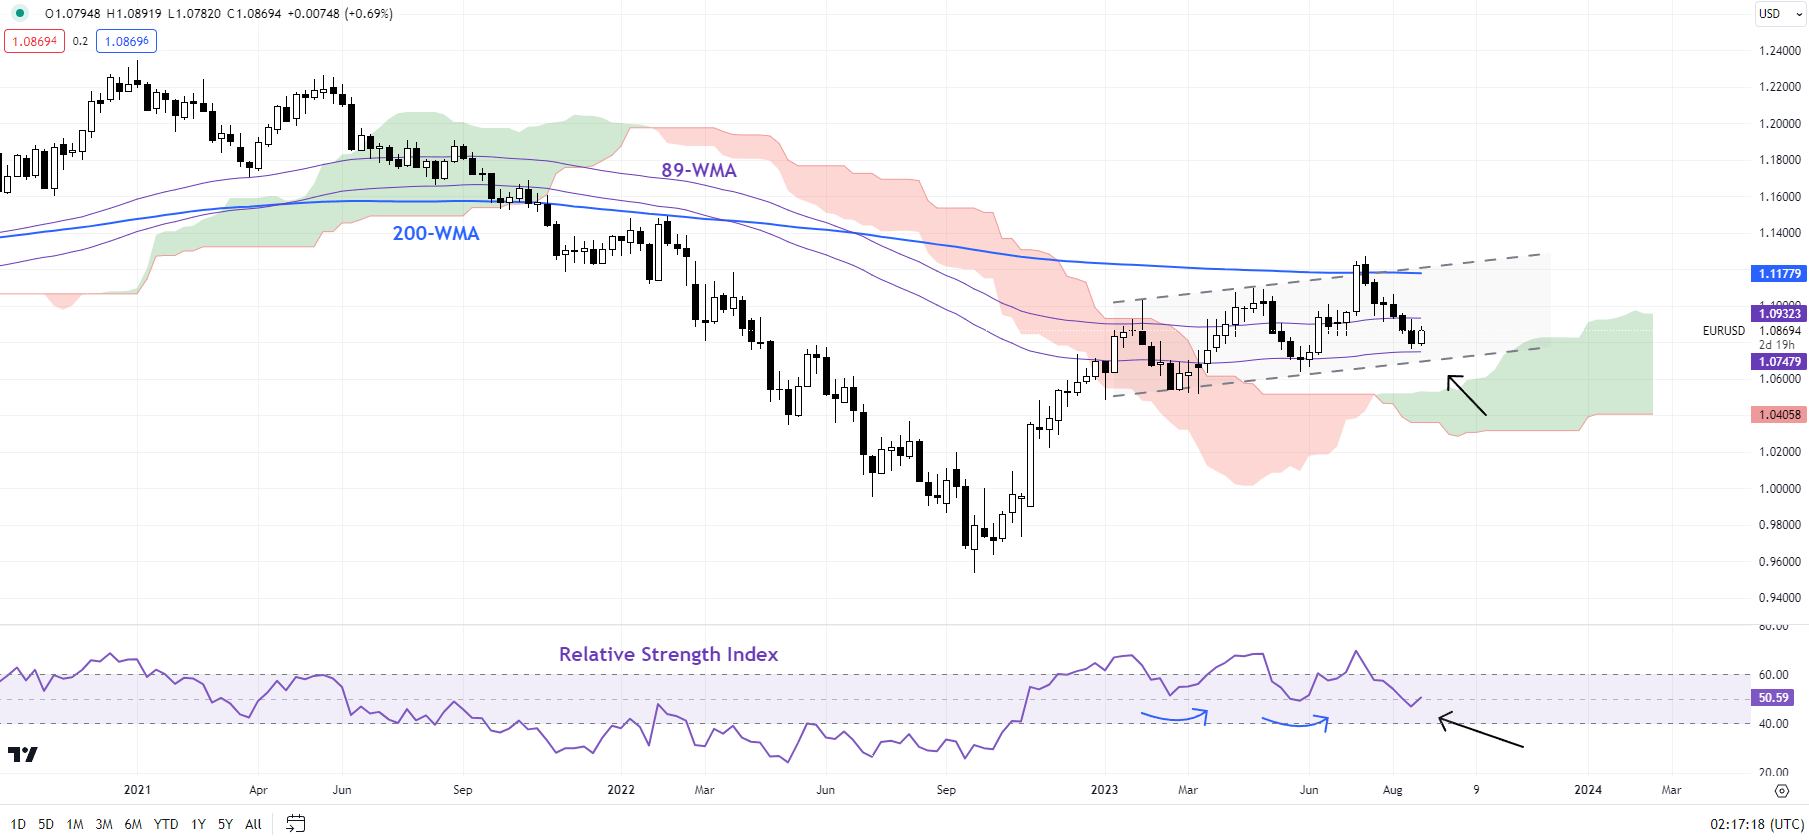
EUR/USD Weekly Chart

image2.png

In this regard, the key focus is on Euro area inflation data due Thursday: Core inflation likely eased to 5.3% on-year in August from 5.5% previously. Meanwhile, the US core PCE price index is expected to have rebounded slightly to 4.2% on-year in July from 4.1% in June. If the data meet expectations, EUR/USD’s rebound could struggle to gain traction. On the other hand, a lower-than-expected US core PCE figure coupled with a smaller-than-expected drop in Euro area inflation could be a bonus for EUR/USD.

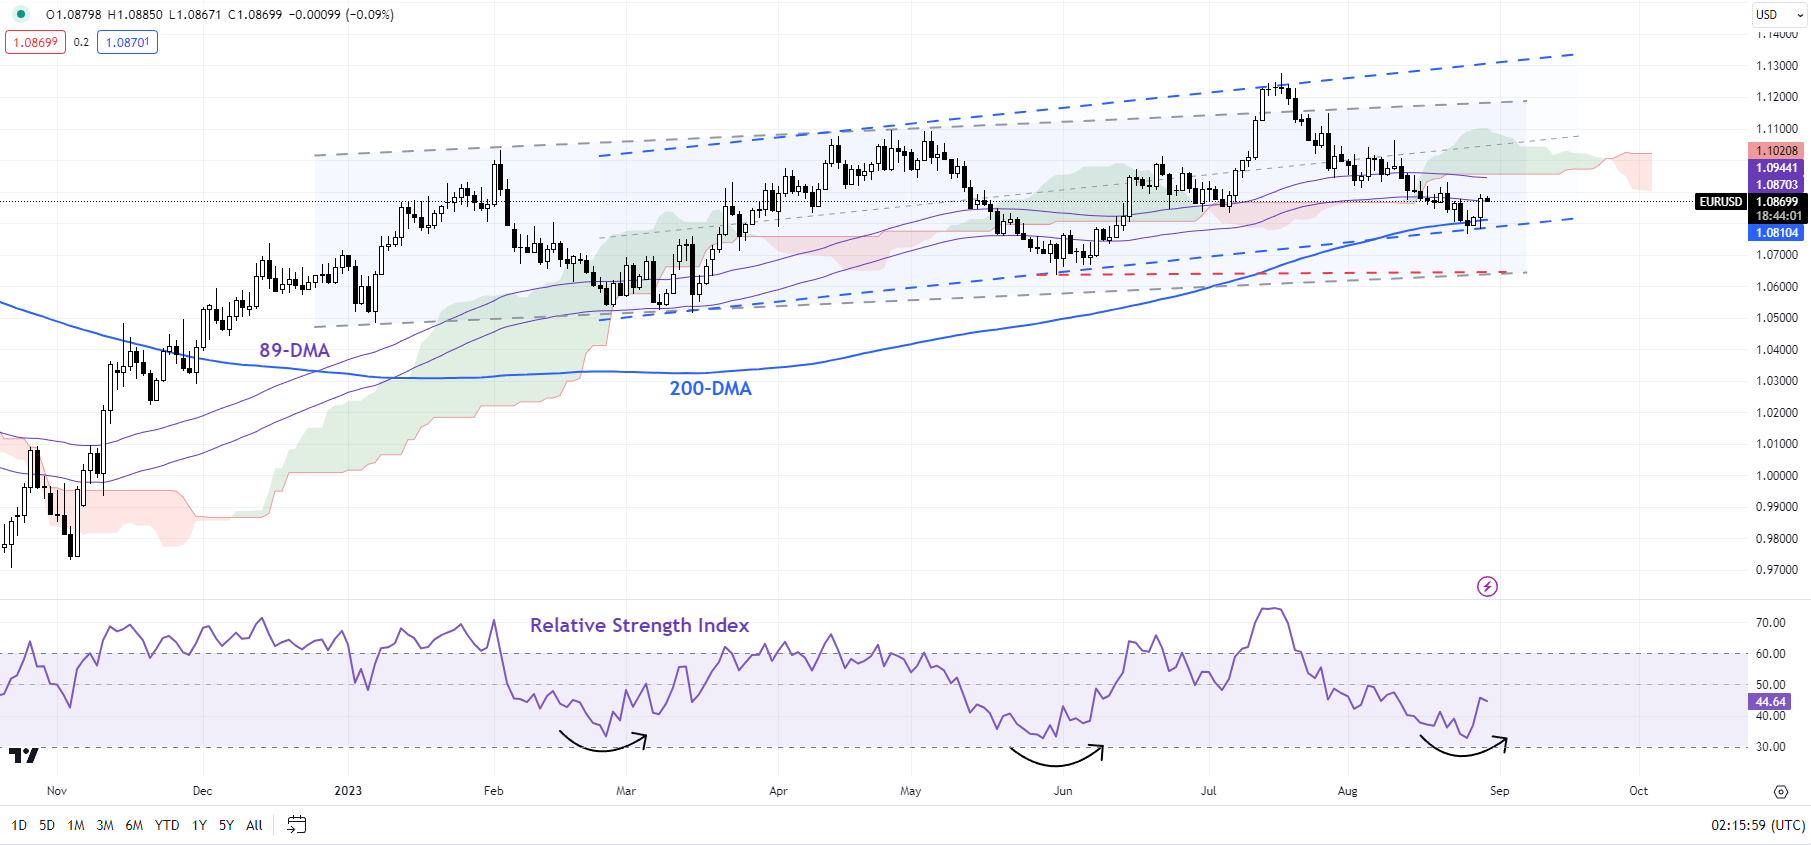
EUR/USD Daily Chart

image3.png

EUR/USD: Holding above key support

On technical charts, EUR/USD is holding above the 200-day moving average, coinciding with the lower edge of a slightly upward-sloping channel since early 2023. The 14-day Relative Strength Index has fallen to levels that were previously associated with a rebound in EUR/USD (see the daily chart).

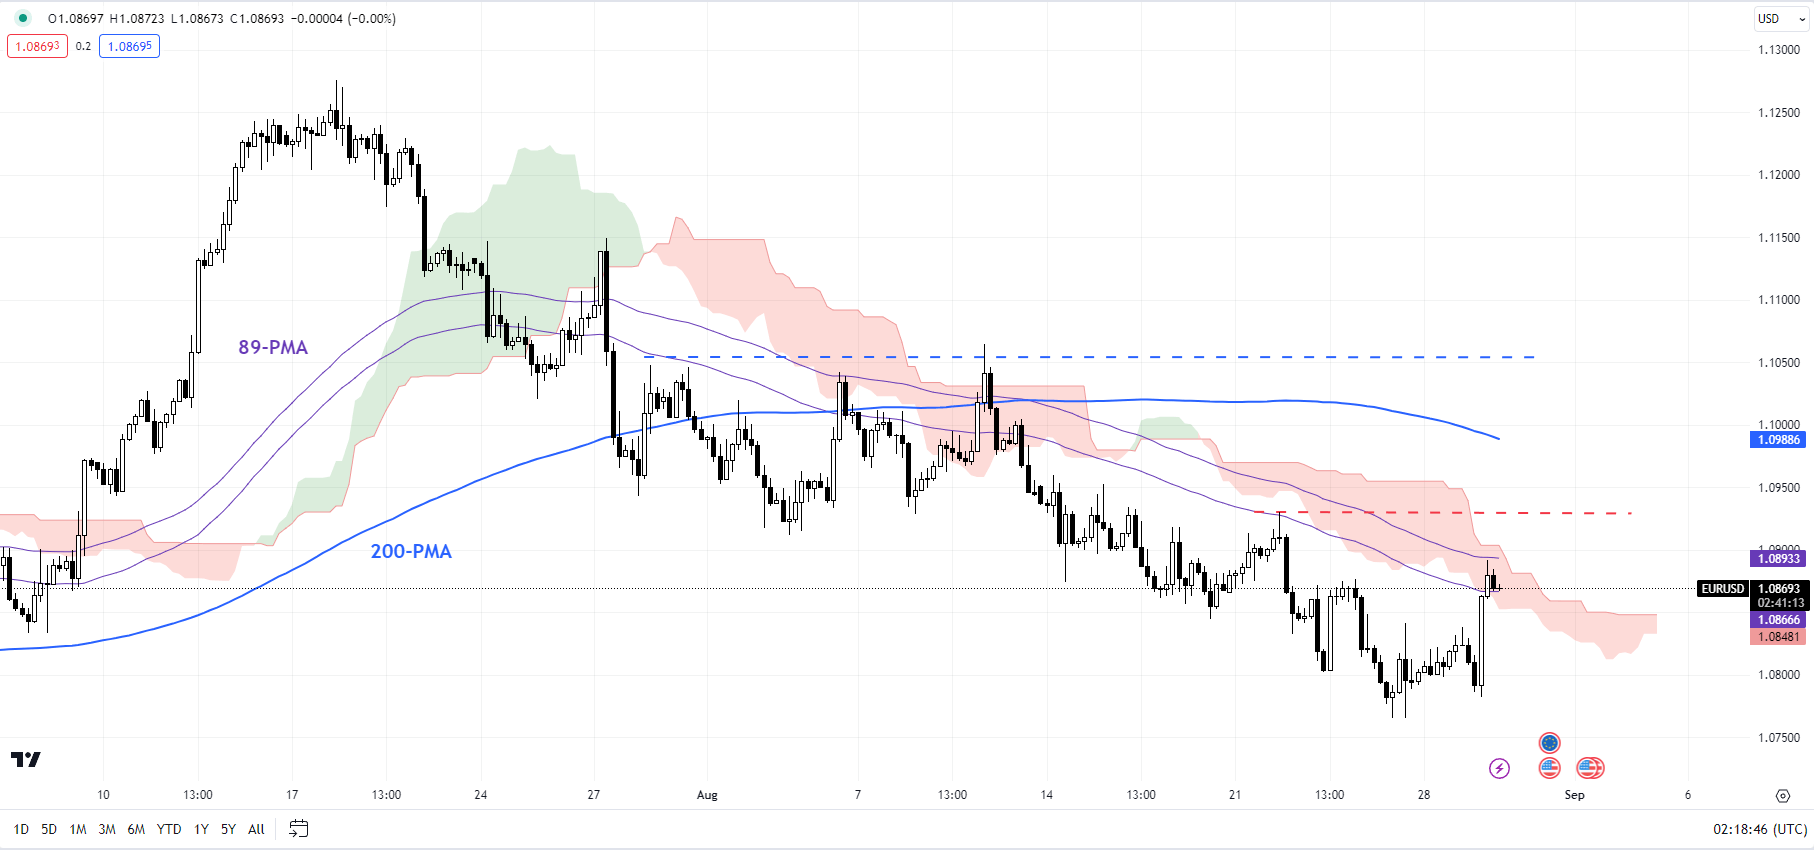
EUR/USD 240-Minute Chart

image4.png

Still, there is plenty of resistance for the pair to clear before the short-term outlook turns constructive again. The immediate hurdle is at last week’s high of 1.0930, followed by a stronger barrier at the early-August high of 1.1065. Zooming out, the retreat since last month hasn’t yet reversed EUR/USD’s broader uptrend – a break below 1.0500-1.0600 area is needed to pose a threat to the multi-month uptrend.

EUR/GBP Daily Chart

image5.png

EUR/GBP: A test of patience for bears

EUR/GBP has once again rebounded from the major floor at 0.8550. Still, the rebound isn’t sufficient to suggest the broader bearish pressure is reversing. The cross would need to rise above a stiff converged hurdle, including the 200-day moving average, around the July high of 0.8700 for any rebound to be sustainable.

JOLTs Job Openings Slide Below 9 Million

JOLTs Job Openings Slide Below 9 Million

On August 29, U.S. reported that JOLTs Job Openings declined from 9.582 million in June to 8.827 million in July, compared to analyst consensus of 9.465 million. The report missed analyst estimates by a wide margin, highlighting the negative impact of rising interest rates.

The situation in the labor market is one of the key catalysts for the Fed. The material decline in JOLTs Job Openings shows that the labor market has started to cool down.

Today, traders also had a chance to take a look at the CB Consumer Confidence report for August. The report showed that CB Consumer Confidence declined from 117 in July to 106.1 in August, compared to analyst consensus of 116.

Both reports showed that the economy was slowing down. Not surprisingly, Treasury yields moved lower after the release of the reports as bond traders bet on a less hawkish Fed.

U.S. Dollar Index has quickly moved from 104.20 to 103.80 as traders reacted to the strong pullback in Treasury yields. Traders bet that Fed may leave the federal funds rate unchanged if the labor market remains under pressure in the upcoming months.

Gold rallied towards the $1930 level, boosted by weaker dollar and falling Treasury yields. The reports provided material support to gold markets.

SP500 tested session highs above the 4450 level. The Fed policy outlook remains the key catalyst for stocks. Traders are not worried about the slowdown of the economy if it means that Fed will leave interest rates unchanged.

Oil Prices Forecast: Worries Over Chinese Demand Capping Gains

Oil Prices Forecast: Worries Over Chinese Demand Capping Gains

Interest Rate Hikes Weigh on Oil Prices

Worries regarding possible U.S. interest rate hikes and their potential impact on demand overshadowed concerns about a tropical storm affecting the U.S. Gulf Coast supply, leading to a dip in oil prices this Tuesday. Key economic data from the U.S., set to be unveiled later this week, will shed light on the future trajectory of interest rates. Jerome Powell, Federal Reserve Chair, hinted at the possibility of additional rate hikes to tackle persistent inflation.

Federal Reserve’s Stance

Markets currently perceive an 80% likelihood of the Federal Reserve maintaining the status quo next month, as indicated by Refinitiv’s FedWatch tool. However, the probability of an interest rate hike come November stands at an approximate 56%. With looming interest rate peaks, the strong bullish trend for oil prices observed in July might be challenging to sustain. Both the U.S. and European economies are anticipated to encounter downward pressures in the upcoming fourth quarter.

Trading Derivatives carries a high level of risk to your capital and you should only trade with money you can afford to lose. Trading Derivatives may not be suitable for all investors, so please ensure that you fully understand the risks involved, and seek independent advice if necessary. A Product Disclosure Statement (PDS) can be obtained either from this website or on request from our offices and should be considered before entering into a transaction with us. Raw Spread accounts offer spreads from 0.0 pips with a commission charge of USD $3.50 per 100k traded. Standard account offer spreads from 1 pips with no additional commission charges. Spreads on CFD indices start at 0.4 points. The information on this site is not directed at residents in any country or jurisdiction where such distribution or use would be contrary to local law or regulation.

China’s Economic Struggles

Demand concerns, a significant factor affecting oil prices, are also emanating from China. The Chinese economy hasn’t shown marked improvement, facing challenges like a deepening property market slump, dwindling consumer spending, and plummeting credit growth. These economic struggles led Beijing to reduce crucial policy rates, aiming to bolster activities in the world’s second-largest economy and significant oil consumer.

External Factors: Storms and Production Cuts

External factors are also in play. Tropical Storm Idalia, nearing hurricane strength, is projected to impact crude production on the U.S. Gulf Coast’s eastern side, following its lash on western Cuba. On the flip side, since the commencement of the third quarter, Brent and WTI prices surged by roughly 12% and 13% respectively, attributable to OPEC+’s production cuts.

Short-term Forecast

The coming days will focus on U.S. economic reports, particularly the personal consumption expenditures price index and the August nonfarm payrolls data. Given the confluence of these factors, the short-term outlook for oil prices remains volatile and potentially bearish, pending improvements in Chinese economic data and clarity on U.S. interest rate decisions

DAX Index: Climbing on China’s Stimulus, but Will US Data Trigger a Fall?

DAX Index: Climbing on China’s Stimulus, but Will US Data Trigger a Fall?

The DAX gained 1.03% on Monday. Following a 0.07% rise on Friday, the DAX ended the day at 15,793.

Investors responded to further Beijing stimulus measures that delivered a positive Asian equity market session. Beijing announced plans to reduce stamp duty for stock trading on Sunday to support the Chinese equity markets.

Trading Derivatives carries a high level of risk to your capital and you should only trade with money you can afford to lose. Trading Derivatives may not be suitable for all investors, so please ensure that you fully understand the risks involved, and seek independent advice if necessary. A Product Disclosure Statement (PDS) can be obtained either from this website or on request from our offices and should be considered before entering into a transaction with us. Raw Spread accounts offer spreads from 0.0 pips with a commission charge of USD $3.50 per 100k traded. Standard account offer spreads from 1 pips with no additional commission charges. Spreads on CFD indices start at 0.4 points. The information on this site is not directed at residents in any country or jurisdiction where such distribution or use would be contrary to local law or regulation.

After previously announcing stimulus measures to support the real-estate sector, hopes of a more comprehensive stimulus package drove demand for riskier assets.

There were no economic indicators from Germany to spook investors. However, China’s economic backdrop, Fed Fear, and the risk of an extended German recession remain headwinds.

The NASDAQ rose by 0.84% on Monday, with the Dow and S&P 500 seeing gains of 0.62% and 0.63%, respectively.

Daily Chart sends bearish near-term price signals.

Monday’s Market Movers

Bank and tech stocks led the way. UBS releases earnings on Thursday, with investors hoping for upbeat results. Commerzbank and Deutsche Bank ended the day up 2.46% and 2.38%, respectively.

Falling government bond yields and the NASDAQ Composite Index provided tech stock support. Infineon rose by 1.95%.

However, economic indicators from Germany and the US will impact both sectors. A slew of US economic indicators could fuel another surge in US Treasury yields, bearish for tech stocks.

Market bets on softer US inflation and a pullback in wage growth contributed to the Monday gains.

German and US Economic Indicators to Test Risk Appetite

A positive Asian session should drive buyer appetite at the European opening bell. The DAX 30 Futures avoided negative territory this morning, gaining 9 points.

However, German GfK Consumer Climate figures for September could test risk appetite. Economists forecast the Consumer Climate Index to rise from -24.4 to -24.3. A marked decline in consumer confidence would signal weaker consumption and weigh on retail stocks.

US economic indicators will likely have more impact on buyer appetite. US consumer confidence and JOLTs job openings are in focus.

An unexpected rise in consumer confidence and a jump in job openings would raise bets on a September rate hike, threatening the broader market. However, investors may hold out for the Core PCE Price Index, personal spending numbers, and the US Jobs Report before making a decisive move.

DAX Technical Indicators

While the 4-Hourly Chart affirms bearish near-term price signals, the technical indicators signal a change in sentiment.

The DAX held above the 50-day EMA on Monday, signaling a possible breakout to target the 16,000 – 16,080 resistance band. However, German consumer sentiment numbers need to show a more marked improvement in confidence, and the US stats need to ease bets on Fed rate hikes to support a breakout.

Hotter-than-expected US economic indicators would likely see the DAX fall through the 50-day EMA. A fall below 15,750 would bring the 15,600 – 15,525 support band into view.

However, considering the RSI 55.23 reading, the DAX has room to run before hitting overbought territory.

DAX 4-Hourly Chart signals a possible breakout.
DAX 290823 4-Hourly Chart
EUR/USD Forecast: US Job Openings and Consumer Confidence in Spotlight

EUR/USD Forecast: US Job Openings and Consumer Confidence in Spotlight

The EUR/USD gained 0.22% on Monday. Reversing a 0.15% decline from Friday, the EUR/USD ended the day at $1.08188. The EUR/USD slipped to an early low of $1.07944 before rising to a high of $1.08298.

German GfK Consumer Climate Numbers to Test EUR/USD Levels

This morning, German GfK Consumer Climate and French Consumer Confidence figures will draw interest.

Trading Derivatives carries a high level of risk to your capital and you should only trade with money you can afford to lose. Trading Derivatives may not be suitable for all investors, so please ensure that you fully understand the risks involved, and seek independent advice if necessary. A Product Disclosure Statement (PDS) can be obtained either from this website or on request from our offices and should be considered before entering into a transaction with us. Raw Spread accounts offer spreads from 0.0 pips with a commission charge of USD $3.50 per 100k traded. Standard account offer spreads from 1 pips with no additional commission charges. Spreads on CFD indices start at 0.4 points. The information on this site is not directed at residents in any country or jurisdiction where such distribution or use would be contrary to local law or regulation.

Consumer confidence remains a material consideration, with German consumer confidence fueling recessionary fears. An unexpected slide in confidence would signal weaker consumption and further pressure on the German services sector.

While a softer demand environment would ease demand-driven inflationary pressures, weaker consumption would support the negative economic outlook.

We expect the French consumer confidence numbers to play second fiddle to the German data.

Economists forecast the German GfK Consumer Climate Index to slip from -24.4 to -24.3 for September. However, investors should look beyond the headline number. Steady labor market conditions supported income expectations in the previous month. A fall in income expectations and the propensity to buy would weigh.

Beyond the numbers, investors should monitor ECB Executive Board member chatter. However, no Board members are on the calendar to speak today, leaving ECB commentary with the media to influence.

On Monday, Austrian Governor Holzman discussed monetary policy, favoring further ECB interest rate hikes to tackle inflation. Holzman also downplayed the risk of a recession.

US JOLTs Job Openings and Consumer Confidence to Set the Tone

US consumer confidence and JOLTs Job Openings will be in focus today. After the weak retail sales figures for July, a marked decline in consumer confidence would signal a further curb in consumer spending. Significantly, a negative outlook on spending would ease demand-driven inflationary pressures and support a Fed hold on interest rates.

However, US labor market conditions support consumer confidence at current levels. Wage growth, stemming from a tight labor market, continues to counter Fed efforts to hit disposable income.

A larger-than-expected fall in job openings and quit rates would signal a shift in labor market conditions. We expect increased EUR/USD sensitivity to the numbers as uncertainty toward Fed monetary policy lingers.

Economists forecast the CB Consumer Confidence Index to fall from 117.0 to 116.0, while economists expect job openings to drop from 9.582 million to 9.465 million.

Beyond the economic indicators, investors should monitor the news wires for Fed chatter. While the talk of further Fed rate hikes would deliver dollar support, investors may wait for the Core PCE Price Index, personal spending, and US Jobs Report before taking more decisive moves.

EUR/USD Price Action

Daily Chart

The Daily Chart showed the EUR/USD below the $1.0900 – $1.0850 resistance band. Easing US Treasury yields supported a breakout from the 200-day EMA to bring the 50-day EMA into view.

However, German and US economic indicators would need to diverge in favor of the EUR to support a breakout from the lower level of the $1.0850 – $1.0900 resistance band.

A slump in German consumer sentiment and hotter-than-expected US economic indicators would support a fall through the 200-day EMA to target the $1.0750 – $1.0700 support band.

Considering the 14-Daily RSI at 39.24, the EUR/USD has more room to fall before hitting oversold territory.

EUR/USD Daily Chart sends mixed price signals.

EURUSD 290823 Daily Chart

4-Hourly Chart

The 4-Hourly Chart affirms bearish near-term price signals. However, a slide in US consumer confidence and weaker-than-expected job openings would support a breakout from the 50-day EMA to target the upper level of the $1.0850 – $1.0900 resistance band.

The 14-4H RSI at 52.28 supports a run at $1.09 before hitting overbought territory.

4-Hourly Chart signals a possible near-term breakout.

EURUSD 290823 4 Hourly Chart