Hang Seng Index, ASX 200, Nikkei 225 Index: Economic Indicators Loom, Casting Shadow Over Positive Gains

Hang Seng Index, ASX 200, Nikkei 225 Index: Economic Indicators Loom, Casting Shadow Over Positive Gains

The Asian equity markets were in recovery mode on Monday. The Nikkei led the Hang Seng Index and the ASX 200 as investors responded to further measures from Beijing.

On Sunday, Beijing announced plans to reduce stock trading stamp duties to support the Chinese markets. Investors responded favorably to the news that followed housing sector measures to support the ailing real estate sector.

Trading Derivatives carries a high level of risk to your capital and you should only trade with money you can afford to lose. Trading Derivatives may not be suitable for all investors, so please ensure that you fully understand the risks involved, and seek independent advice if necessary. A Product Disclosure Statement (PDS) can be obtained either from this website or on request from our offices and should be considered before entering into a transaction with us. Raw Spread accounts offer spreads from 0.0 pips with a commission charge of USD $3.50 per 100k traded. Standard account offer spreads from 1 pips with no additional commission charges. Spreads on CFD indices start at 0.4 points. The information on this site is not directed at residents in any country or jurisdiction where such distribution or use would be contrary to local law or regulation.

There were no economic indicators from China to spook investors. However, investors remained cautious following hawkish Fed chatter and ahead of private sector PMI numbers from China this week.

Investors May Hit Pause Ahead of Key Stats

On Monday, the Hang Seng Index eased back from an early session high. While Beijing moves to steady the Chinese equity markets offered support, fundamental issues with the Chinese economy persist.

On Thursday and Friday, NBS private sector PMIs and the all-important Caixin Manufacturing PMI will show whether the Chinese economy is turning a corner. However, the risk of weaker numbers will likely test buyer appetite.

It could be a trickier Tuesday session. Investors will likely also consider US consumer confidence and JOLTs Job Openings out later today. A spike in US consumer confidence, an upswing in job openings, and a rise in quit rates would support a hawkish Fed.

With US core PCE price index numbers and the US Jobs Report also out this week, the economic calendar can materially impact buyer appetite. Investors should consider the threat of sticky inflation and a pickup in wage growth.

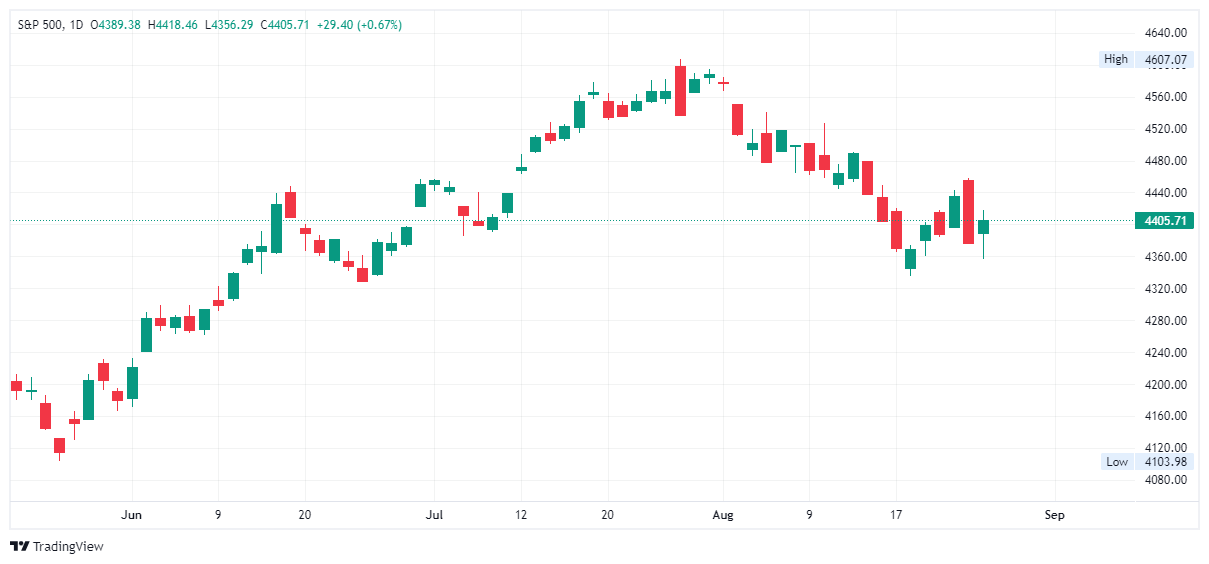
The NASDAQ rose by 0.84% on Monday, with the S&P 500 and the Dow seeing gains of 0.63% and 0.62%, respectively. We expect the overnight moves to cushion any downside.

ASX 200

ASX 200 enjoyed a bullish Monday.
ASX 200 290823 Daily ChartThe ASX 200 found support from US equity market gains from Friday and the latest measures from Beijing. Australian retail sales rebounded in July, rising by 0.5%. However, the Women’s World Cup drove consumption, limiting the impact of the upbeat numbers on sentiment toward RBA monetary policy.

On Monday, The National Australia Bank (NAB) and The Commonwealth Bank of Australia (CBA) rose by 1.33% and 1.22%, respectively. Westpac Banking Corp (WBC) and ANZ Group (ANZ) ended the day up 0.28% and 0.99%, respectively.

Mining stocks had a mixed session. Rio Tinto (RIO) and BHP Group Ltd (BHP) gained 0.72% and 1.23%, respectively, while Newcrest Mining (NCM) ended the day flat. Fortescue Metals Group (FMG) tumbled by 5.06% as investors responded to a sharp fall in full-year profits and a cut in the dividend payout.

BHP and FMG have delivered disappointing earnings results, which could test buyer appetite for mining stocks ahead of the China PMIs.

Oil stocks also had a mixed session. Woodside Energy Group (WDS) rose by 0.88%, while Santos Ltd (STO) fell by 1.17%.

Hang Seng Index

Hang Seng Index may need more Beiiing stimulus.
HSI 290823 Daily ChartThe Hang Seng Index partially recovered the Friday loss, gaining 0.97%. China measures to support stocks contributed, while caution led to a pullback from session highs. Concerns over the Chinese economic outlook capped the upside. We expect investors to remain jittery over China until economic indicators signal an improving macroeconomic environment.

The main Index components contributed to the positive session. Alibaba Group Holding Ltd (HK:9988) and Tencent Holdings Ltd (HK:0700) rose by 1.60% and 1.63%, respectively.

Bank stocks also enjoyed a positive session. Bets on the Fed standing pat on interest rates added to the more bullish mood. HSBC Holdings PLC and China Construction Bank (HK: 0939) saw gains of 0.60% and 0.98%, respectively. The Industrial and Commercial Bank of China (HK:1398) rallied 1.45%.

Nikkei 225

Nikkei benefited from BoJ commentary.
Japan 225 290823 Daily Chart(For reference purposes only)

The Nikkei 225 rallied 1.73% on Monday. Bank of Japan Governor Ueda comments from Jackson Hole provided support. Ueda justified the ultra-loose policy stance on below-target inflation. Investor sentiment toward inflation, Bank of Japan forward guidance, the regional economic outlook, and the USD/JPY remain the focal points. A stronger USD/JPY is Nikkei-positive.

Banks ended the day in positive territory. Sumitomo Mitsui Financial Group (8316) and Mitsubishi UFJ Financial Group rose by 0.89% and 1.67%, respectively.

Tokyo Electron Limited (8035) led the way, gaining 2.42%, with Fast Retailing Co (9983) and Sony Corp. (6758) rising by 1.60% and 1.18%, respectively. KDDI Corp. (9433) ended the day up a more modest 0.21%.

SoftBank Group Corp. (9984) bucked the broader market trend, slipping by 0.02%.

XRP News: Ripple on Edge as SEC Appeal Spotlights Hinman’s Testimony

XRP News: Ripple on Edge as SEC Appeal Spotlights Hinman’s Testimony

The Monday Overview

XRP slipped by 0.04% on Monday. Reversing a 0.02% gain from Sunday, XRP ended the day at $0.5231. While wrapping up the day in negative territory, XRP avoided sub-$0.51 for the third consecutive session.

SEC v Ripple Appeal Brings Hinman into Focus

On Monday, there was no SEC v Ripple case-related activity to draw interest. The lack of Court activity left William Hinman in the spotlight.

Trading Derivatives carries a high level of risk to your capital and you should only trade with money you can afford to lose. Trading Derivatives may not be suitable for all investors, so please ensure that you fully understand the risks involved, and seek independent advice if necessary. A Product Disclosure Statement (PDS) can be obtained either from this website or on request from our offices and should be considered before entering into a transaction with us. Raw Spread accounts offer spreads from 0.0 pips with a commission charge of USD $3.50 per 100k traded. Standard account offer spreads from 1 pips with no additional commission charges. Spreads on CFD indices start at 0.4 points. The information on this site is not directed at residents in any country or jurisdiction where such distribution or use would be contrary to local law or regulation.

Calls for an investigation into certain parties and testimony given under oath continued at the start of the week.

CryptoLaw founder and Amicus Curiae attorney John E. Deaton focused on William Hinman, the former SEC Director of the Division of Corporation Finance.

Deaton had this to say about Hinman testimony under oath,

“Sometimes you can guarantee something if you’re clairvoyant. I said when Hinman is asked if he knew Simpson Thacher was a member of the EEA when he gave his speech, he would deny knowing it. His depo was unsealed and look here. He has to b/c if he admits knowing, he admits to violating 18 USC 208.”

Deaton referred to a Hinman response to a question asking when he first learned that Simpson had a role in the Ethereum Alliance. Hinman replies he first learned of the link about a month or two after he left the SEC.

18 USC 208 relates to financial conflict of interest. The “statute prohibits all employees from participating in any particular Government matter that will have a direct and predictable effect on their financial interests. It also prohibits employees from acting in Government matters that will affect the financial interests of others with whom they have certain relationships.”

In an infamous 2018 speech, Hinman stated that BTC and ETH are not securities. In 2021, Empower Oversight filed a lawsuit against the SEC. Empower Oversight claimed that former SEC officials were biased against Ripple Lab and XRP. William Hinman returned to Simpson Thacher after leaving the SEC.

XRP Flatlines as Investors Await Ripple Opposition Filing

While the focus on William Hinman may not influence the outcome of the SEC motion for interlocutory appeal, a Federal investigation into the breach of 18 USC 208 would dish more embarrassment on the SEC plate.

However, the heavily anticipated Ripple opposition to the SEC motion for interlocutory appeal will move the dial. While investors must wait for the Ripple filing and the SEC response before Judge Torres rules on the motion, the language within a Ripple opposition filing will give investors a view on whether Judge Torres will rule in favor of an appeal.

A ruling in favor of the SEC motion would be XRP price negative.

The Tuesday Session

After another range-bound session, investor focus will remain on the SEC motion for interlocutory appeal. As per the Judge Torres Court schedule, Ripple must respond to the SEC motion by Friday, September 1. The SEC must file a response to the Ripple filing by September 8.

While we don’t expect an early filing, an unexpected Ripple filing would influence investor sentiment.

Beyond the SEC v Ripple case, investors should also monitor the crypto news wires or Binance and Coinbase (COIN)-related news.

A Court ruling on the motion to dismiss the SEC v Coinbase case would significantly impact market sentiment.

XRP Price Action

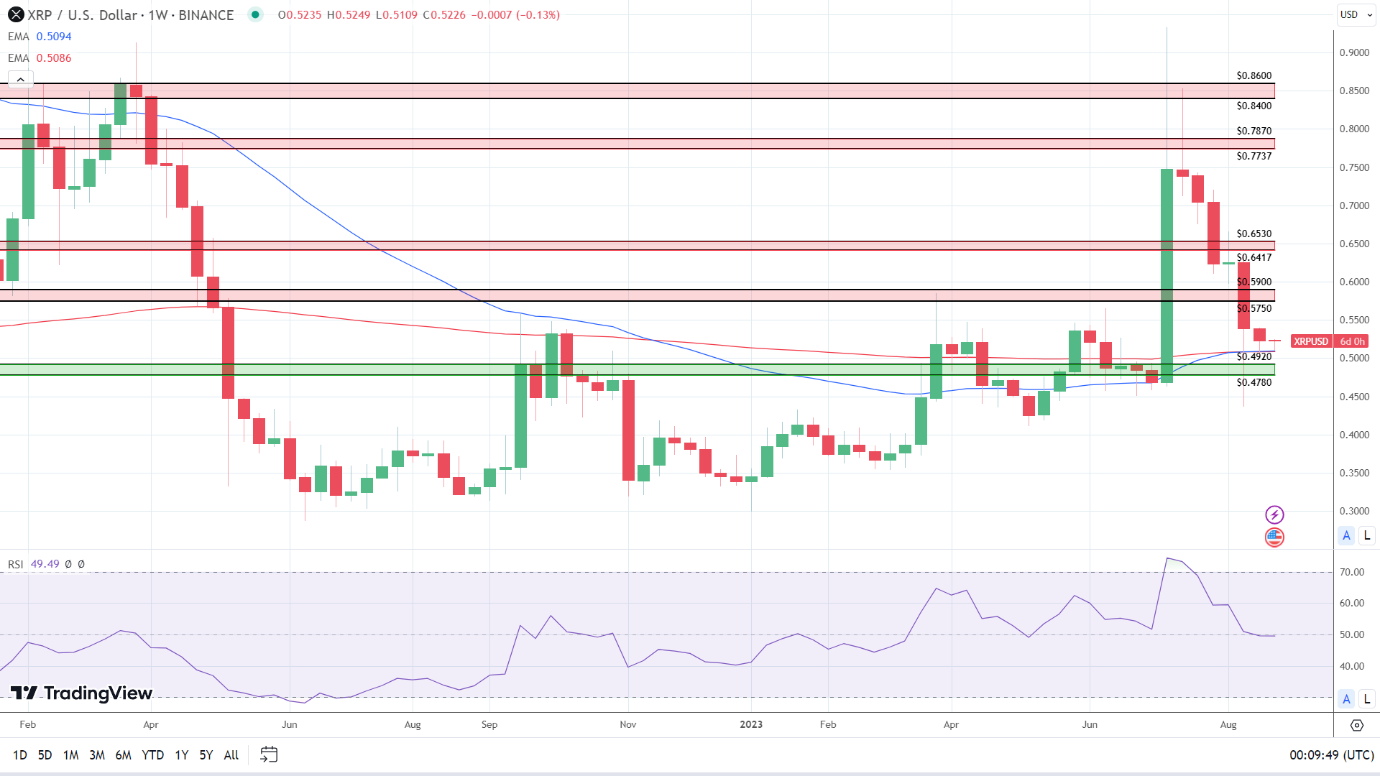
Weekly Chart remains bullish.
XRPUSD 290823 Weekly Chart

Daily Chart

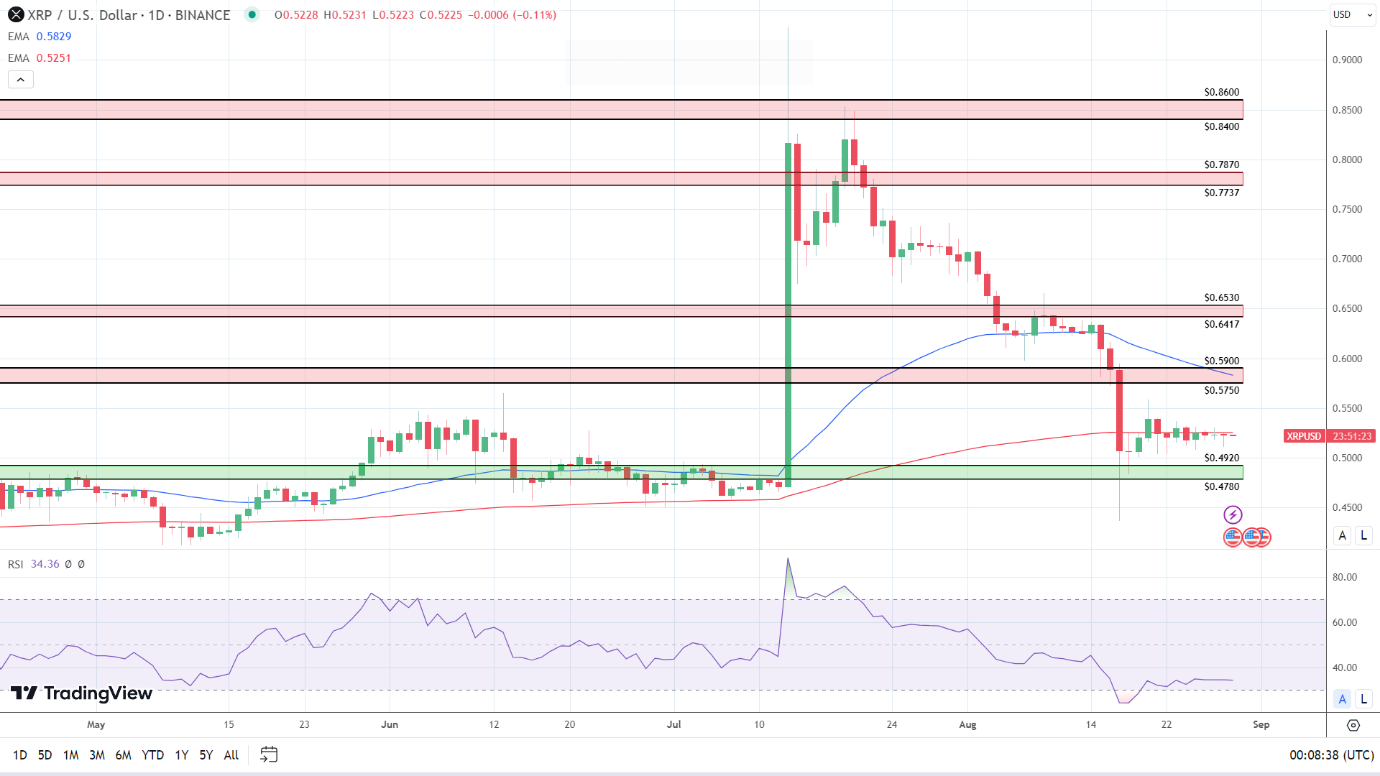
XRP continues to find support at $0.51 while falling short of the $0.5750 – $0.5900 resistance band. However, XRP will break the current range in response to the Ripple Court filing. Uncertainty surrounding the chances of an SEC appeal leaves downside risk in play.

Considering the 14-Daily RSI at 34.36, XRP would have room to fall through the upper level of the $0.4920 – $0.4780 support band before falling into oversold territory. With the 50-day and 200-day EMAs sending bearish signals, avoiding sub-$0.50 hinges on the Ripple filing.

XRP Daily Chart sends bearish price signals.
XRPUSD 290823 Daily Chart

4-Hourly Chart

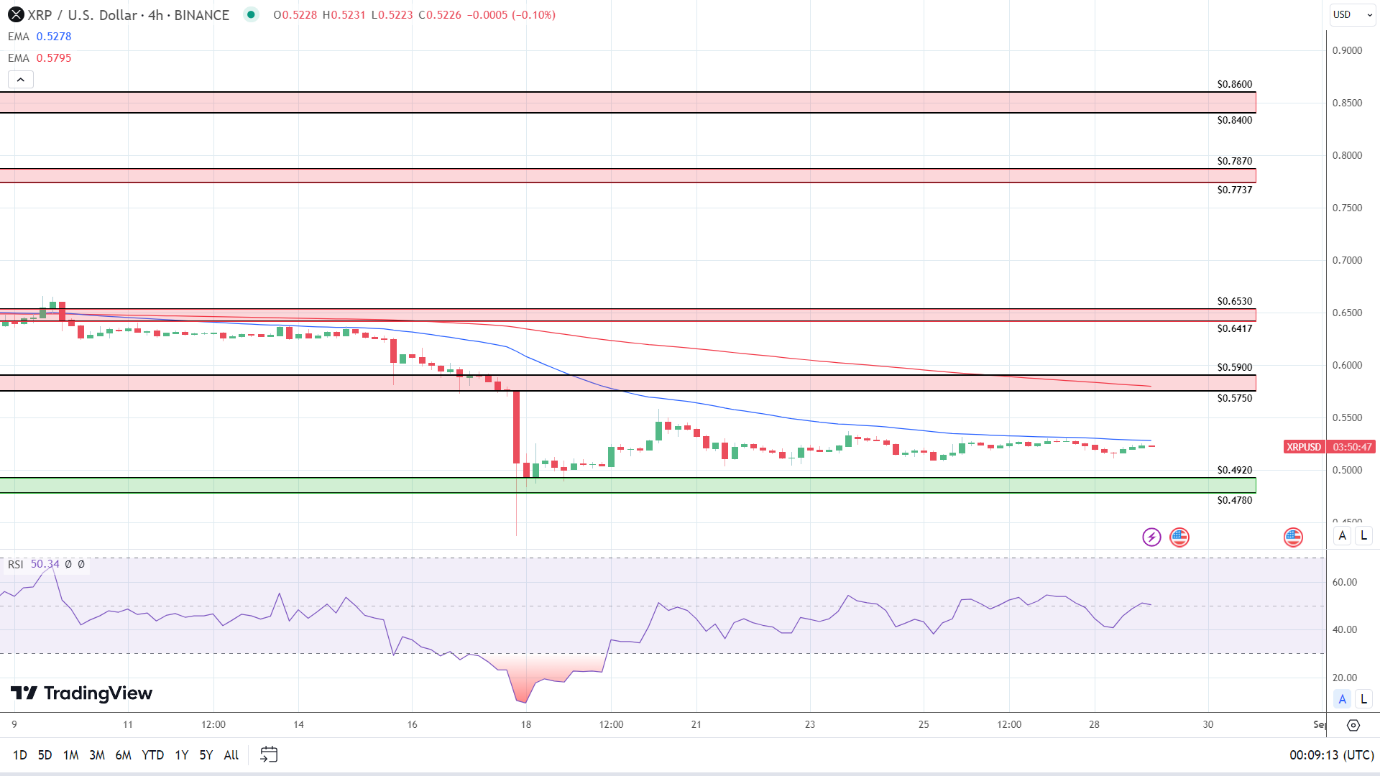
The 4-Hourly Chart affirms the bearish near and longer-term price signals. A positive response to the Ripple filing would support a breakout from the 50-day EMA to target the $0.5750 – $0.5900 resistance band and the 200-day EMA.

However, the EMAs send bearish signals. Uncertainty surrounding the outcome of the SEC motion for interlocutory appeal leaves XRP at risk of a return to sub-$0.50.

The 14-4H RSI reading of 50.34 is a neutral indicator, signaling further sideways movement.

XRP 4-Hourly Chart affirms bearish price signals.
XRPUSD 290823 4 Hourly Chart
German GfK Consumer Climate Fall Fuels German Recession Concerns

German GfK Consumer Climate Fall Fuels German Recession Concerns

German GfK Consumer Climate

After a quiet Monday session, the German economy was in the spotlight again. The German GfK Consumer Climate Index drew interest as risks of a German recession continue to grow. German labor market conditions cushioned consumer sentiment in July.

The German GfK Consumer Climate Index fell from -24.5 to -25.5 for September. Economists forecast a decline to -24.3.

According to the August survey,

  • Income expectations deteriorated in August, with the indicator falling 6.4 points to -11.5 points.
  • Rising food and energy prices impacted consumer disposable incomes despite softer inflation in July.
  • The slide in income expectations weighed on the propensity-to-buy indicator, which fell 2.7 points to -17 points.
  • Inflationary pressures and the uptrend in food and energy prices continued impacting buyer intentions.
  • After a string of disappointing German economic indicators, pessimism toward the German economy grew midway through the third quarter.
  • The economic expectations indicator declined by 9.9 points to -6.2 points, the lowest recording since December 2022 (-10.3 points).
  • After steady labor market conditions, the survey revealed increasing concerns over unemployment.

The August survey will place a greater emphasis on German retail sales, inflation, and unemployment. On Wednesday, prelim German inflation figures will draw interest ahead of retail sales and unemployment numbers on Thursday,

Weak retail sales numbers, a rise in unemployment, and a pickup in inflationary pressure would fuel fears of a sustained German economic recession.

EUR/USD Reaction to the German GfK Consumer Climate Survey

Before the German consumer confidence numbers, the EUR/USD fell to a pre-stat low of $1.08152 before rising to a high of $1.08384.

However, in response to the GfK survey, the EUR/USD fell to a post-stat low of $1.08206 before rising to a high of $1.08234.

This morning, the EUR/USD was up 0.03% to $1.08220.

EUR/USD shows mixed reaction to German GfK Consumer Climate Survey
290823 EURUSD Hourly Chart

Up Next

While there are no other Euro area economic indicators to draw interest, US economic indicators will need consideration.

US JOLTs job openings and consumer confidence figures will move the dial later today. Economists forecast a modest decline in consumer confidence and a slide in job openings.

Worse-than-expected numbers would ease bets on a September Fed rate hike and tip monetary policy divergence toward the ECB and the EUR.

Economists forecast JOLTs job openings to fall from 9.582 million to 9.465 million and the CB Consumer Confidence Index to slip from 117.0 to 116.0.

With investors focused on monetary policy divergence, central bank chatter will also need consideration. However, no central bankers are on the calendar to speak today, leaving commentary with the media to influence.

British Pound Forecast: GBP/USD Awaits NFP as GBP/JPY Cheers Ueda’s Dovish Views

British Pound Forecast: GBP/USD Awaits NFP as GBP/JPY Cheers Ueda’s Dovish Views

GBP/USD ANALYSIS

The British pound gained ground against the U.S. dollar, but its advance was limited, as traders embraced a cautious position and avoided taking large directional bets ahead of the August U.S. payrolls report due for release on Friday.

Given the Fed’s data-dependent approach, labor market incoming information will play a crucial role in determining the FOMC’s next moves, with strong job gains bolstering the case for more monetary tightening and weak employment growth diminishing the prospects of further policy firming.

Taking a look at the technical picture, GBP/USD has started to perk up after encountering support at 1.2555 late last week following a sharp sell-off, but the bounce seems to lack conviction on Monday, a sign that cable is not out of the woods yet.

For clues on the outlook, traders should closely watch price action in the coming days. That said, if GBP/USD manages to extend its rebound, the first ceiling to consider rests at 1.2620, followed by 1.2680. On further strength, the bulls could muster the momentum for an attack on trendline resistance at 1.2750.

Conversely, if sellers regain the upper hand and spark a bearish reversal, initial support appears at 1.2555, and 1.2445 thereafter. In the event of a breakdown, the crosshairs will be fixed on the 200-day simple moving average, followed by 1.2315, the 61.8% Fib retracement of the 2023 rally.

Don’t miss out on expert insights: Download our ‘How to Trade GBP/USD’ guide and enhance your trading skills today!

GBP/USD TECHNICAL CHART

image1.png

GBP/JPY ANALYSIS

Sterling also rose against the Japanese yen on Monday, extending its recovery for the second consecutive trading session after bouncing off technical support at 183.30 last Friday, with the latest advance likely bolstered by dovish comments from the Bank of Japan over the weekend.

BoJ Governor Kazuo Ueda said policymakers will maintain the current monetary easing framework as core inflation remains “a bit below target.” These statements suggest the central bank will probably not adjust its yield curve control program again this year following July’s surprise tweak, nor will it abandon negative interest rates for the foreseeable future.

BoJ’s ultra-accommodative stance will prevent the yen from gaining much traction against the British pound for now, especially if Bank of England continues to hike interest rates as part of a strategy to curb price pressures in the economy. By way of context, the UK has the most persistent inflation in G10, with headline CPI clocking in at 6.8% y-o-y in July.

Focusing on technical analysis, GBP/JPY remains entrenched within an undisputable uptrend despite recent softness, with prices trading above key moving averages and displaying impeccable higher highs and higher lows.

However, to be confident in the bullish outlook, the pair needs to break above the 2023 peak at 186.76 in the near term. If this scenario plays out, buying interest could gain impetus, paving the way for a move to 189.00. In the event of a pullback, initial support lies at 183.30, followed by 182.65. On further weakness, we could see a drop towards 181.00.

Stay ahead of GBP/JPY trends: elevate your trades by exploring market sentiment – download your guide for free!

GBP/JPY TECHNICAL CHART

A graph of stock market  Description automatically generated with medium confidence


Gold Price Outlook: XAU/USD May Rise as Retail Traders Become Bearish

Gold Price Outlook: XAU/USD May Rise as Retail Traders Become Bearish

Gold prices have been aiming higher in recent weeks. In response retail traders have been cautiously increasing downside exposure. This can be seen by taking a look at IG Client Sentiment (IGCS), which often functions as a contrarian indicator. With that in mind, could further upside progress be in store for the yellow metal in the coming sessions?

Gold Sentiment Outlook – Bearish

The IGCS gauge shows that about 75% of retail traders are net-long gold. Since most of them are biased to the upside, this hints that prices may continue falling down the road. Meanwhile, downside exposure has increased by 23.58% and 26.59% compared to yesterday and last week, respectively. With that in mind, recent changes in positioning hint that the price trend may soon reverse higher despite overall exposure.

Gold Sentiment Outlook - Bearish

XAU/USD Daily Chart

On the daily chart below, gold has extended a cautious push higher above the 38.2% Fibonacci retracement level of 1903.46. That is now placing the focus on the falling trendline from earlier this year. The latter could reinstate the broader downside focus, pushing XAU/USD back to the mid-August swing low of 1884.89.

Otherwise, clearing above the falling trendline, as well as the 1936.90 inflection zone, exposes the 23.6% level of 1971.63 as key resistance. Extending gains beyond that could open the door to revisiting the 2048.79 – 2081.82 resistance zone.

image2.png


Risk Mood Improves as US Bond Yields, US Dollar Take a Breather: Russell 2000, USD/JPY, GBP/USD

Risk Mood Improves as US Bond Yields, US Dollar Take a Breather: Russell 2000, USD/JPY, GBP/USD

Wall Street gained for the second straight day (DJIA +0.62%; S&P 500 +0.63%; Nasdaq +0.84%), as US Treasury yields took a breather despite a hawkish takeaway from the Jackson Hole Symposium. Both the US 2-year and 10-year yields cooled by around 5 basis-point (bp) overnight after touching their recent highs. The VIX has also hit its two-week low, potentially as hedging bets unwind from greater clarity on Fed’s policy outlook. Amid the quiet economic calendar to start the week, market focus will now turn to a series of macro data ahead to justify whether a November rate hike from the Fed is warranted.

Today’s schedule will leave Germany and US consumer confidence data on watch, along with the US Job Openings and Labor Turnover Survey (JOLTS), where further moderation in US July job opening numbers is expected (9.465 million forecast versus 9.582 million prior). The US S&P/Case-Shiller home price index will be in focus as well, with US home prices expected to mark its fourth straight month of year-on-year decline (-1.3% forecast versus -1.7% prior).

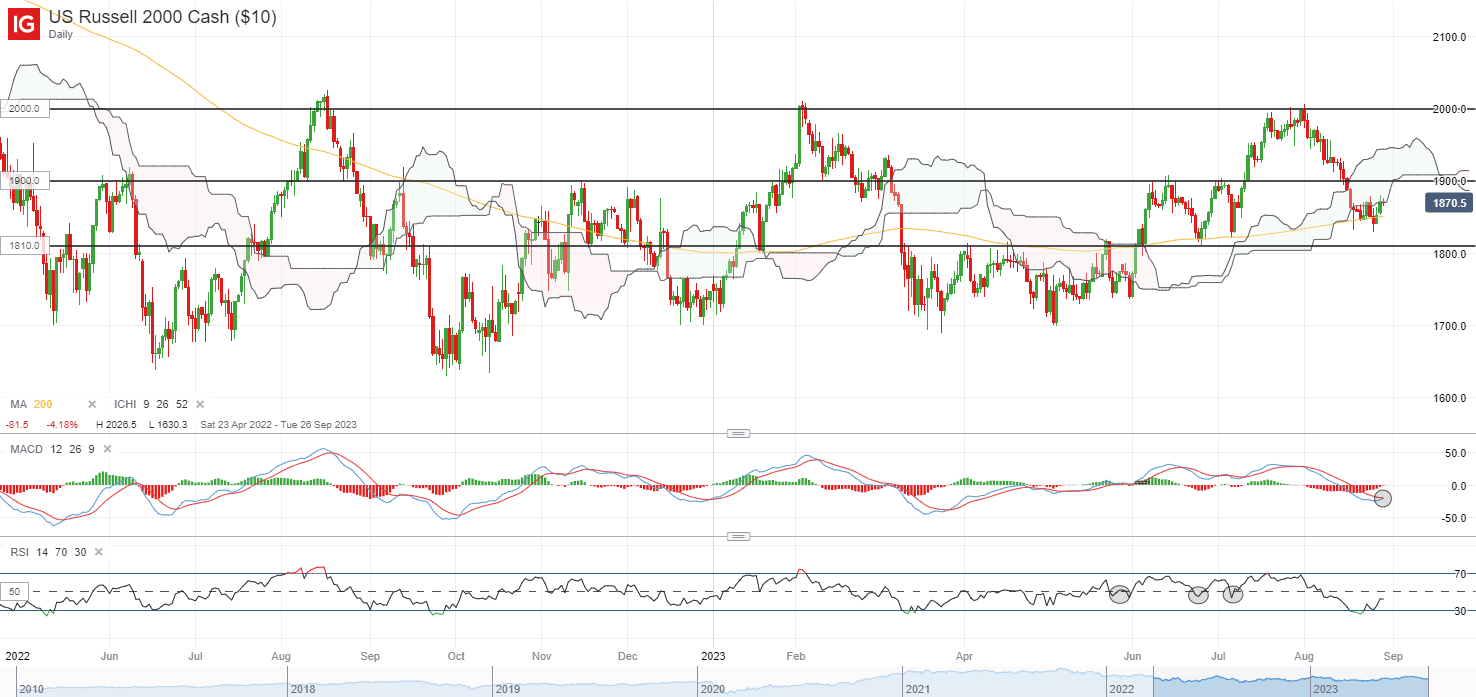
Perhaps one to watch may be the Russell 2000, which has been attempting to defend its 200-day moving average (MA) over the past week. Further upside may validate a bullish crossover on its moving average convergence/divergence (MACD) on the daily chart, with immediate resistance to overcome at the 1,900 level. On the broader scale, the index remains stuck in a long-ranging pattern since April 2022, with any move above the 1,900 level potentially leaving its upper bound at the key psychological 2,000 level on watch for a retest next.

image1.png

Asia Open

Asian stocks look set for a positive open, with Nikkei +0.50%, ASX +0.45% and KOSPI +0.34% at the time of writing. Lower Treasury yields, a slightly weaker US dollar and the positive handover from Wall Street provide room for some relief in the region, despite lingering reservations surrounding Chinese equities.

Beijing’s latest efforts to boost markets has been met with a lukewarm reaction, with gains in Chinese equities fizzling into the close yesterday. The Hang Seng Index was up as much as 3% at one point, but closed only 0.9% higher. Similar measure in 2008 eventually saw the CSI 300 move to form a new low, suggesting that a turnaround in economic conditions remains the key driving force for longer-term upside in Chinese equities.

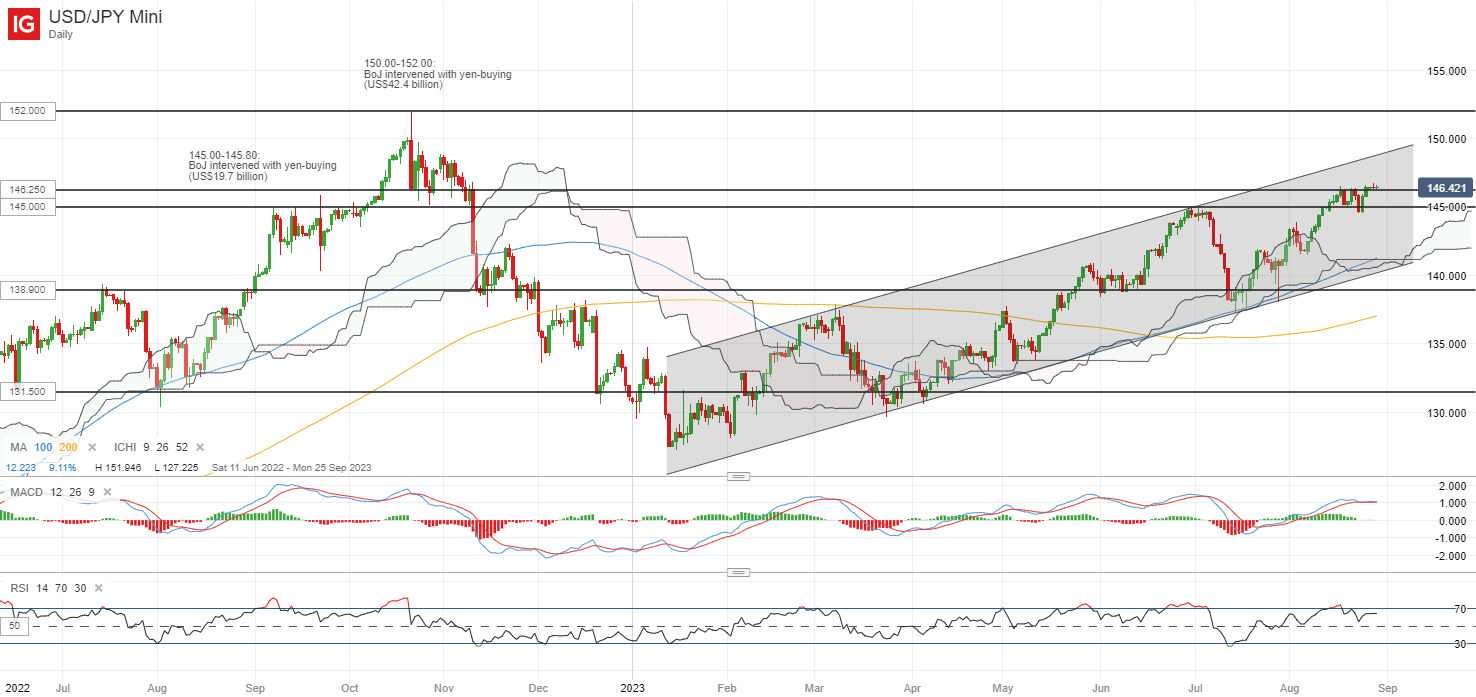
This morning saw Japan’s July unemployment rate head higher to 2.7% from previous 2.5% (forecast 2.5%), with the sharper moderation in Japan’s labour market likely to provide more room for dovishness for the Bank of Japan (BoJ) by having a taming effect on wage pressures. For now, the USD/JPY has breached the 145.00-145.80 level, where previous yen-buying intervention was executed back in September 2022. While the overall trend remains up with a rising channel pattern in place, some near-term exhaustion seems to be in place, with a flat-lined MACD and lower highs on its RSI from the daily chart. The 145.00 level will be an immediate support to hold, failing which may pave the way to retest the 141.60 level next.

image2.png

On the watchlist: GBP/USD retesting neckline of head-and-shoulder formation

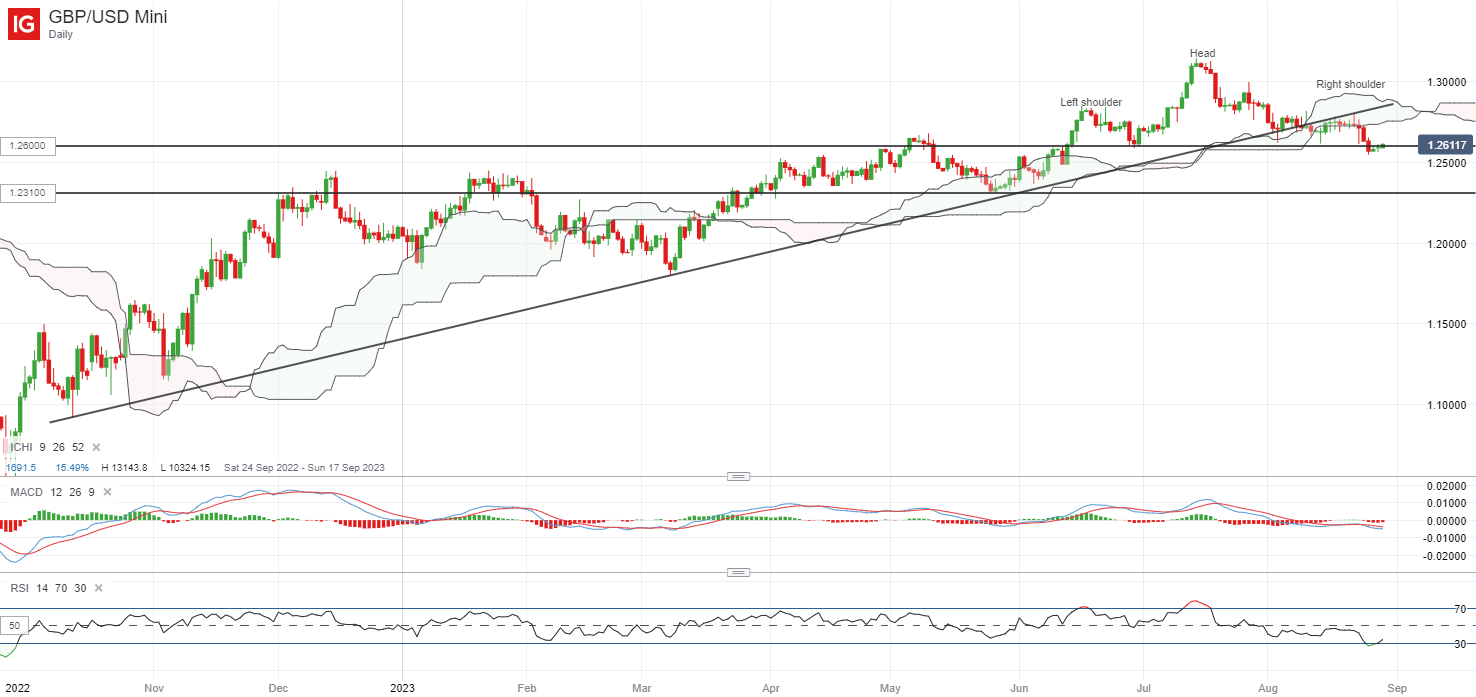
The GBP/USD has retraced by close to 4.5% since mid-July this year, further weighed by weaker-than-expected PMI data out of the UK and some firming in the US dollar last week to retest its 1.260 level. On the broader scale, the 1.260 level seems to mark the neckline of a head-and-shoulder formation, with an attempt to stabilise after recent sell-off. Its weekly RSI continues to trade above the 50 level for now, which could still put an upward trend in place, but any failure to defend the 1.260 level over the coming days may potentially pave the way to retest the 1.231 level next.

image3.png

Australian Dollar Looks to Recoup Losses Ahead of CPI; AUD/USD, AUD/NZD, AUD/JPY

Australian Dollar Looks to Recoup Losses Ahead of CPI; AUD/USD, AUD/NZD, AUD/JPY

The Australian dollar is looking for positive catalysts as it attempts to recoup some of its recent losses ahead of key Australian inflation data due Wednesday.

Australia’s CPI moderated to 5.2% on-year in July from 5.4% previously. The ongoing disinflation trend is in tandem with the Reserve Bank of Australia’s view that the worst is probably over for inflation. The Australian central bank held rates steady at 4.1% at its previous two meetings, and markets are pricing in a high chance that the central bank will stay pat when it meets next week amid tentative signs of cooling of the labour market and a deteriorating growth outlook in China.

AUD/USD Daily Chart

image1.png

Chinese policymakers’ additional stimulus recently has failed to cheer AUD bulls so far. China’s macro data continues to be underwhelming, posing downside risks to economic growth amid a struggling property sector. With a massive stimulus seemingly off the table (given the associated risks of creating imbalances within the economy), AUD would need to rely on other catalysts to get a boost. the China Economic Surprise Index is just off mid-2020 (Covid levels), and China is Australia’s largest export destination.

AUD/USD Weekly Chart

image2.png

Globally, the USD remains well supported by diverging economic outlooks – a resilient US economy compared with slowing growth outside of the US, especially in China and Europe. Powell’s remarks at Jackson Hole last week were largely balanced, but with a slightly hawkish tilt, offering some support to the greenback. The market is now pricing in about a 50% chance of a November hike compared with 38% a week ago, according to the CME FedWatch tool.

AUD/USD 240-Minute Chart

image3.png

AUD/USD: Downtrend fatigue?

Tentative signs of downtrend fatigue setting inAUD/USD lower timeframe charts. This comes as the pair continues to hold above vital converged support on the median line of a declining pitchfork channel since June and a downtrend line from the end of 2023. Still, a break above Friday’s high of 0.6440 is needed for the on-month-long slide to stall. A more decisive signal for any material consolidation would be a crack above last week’s high of 0.6590. For more discussion, see “US Dollar Flirts with Resistance After Powell; EUR/USD, GBP/USD, AUD/USD Price Action,” published August 28.

AUD/JPY 240-Minute Chart

image4.png

AUD/JPY: Downward bias yet to reverse

AUD/JPY has been well guided lower by the downward-sloping 200-period moving average on the 240-minute charts, a bias highlighted in the previous update. See “Japanese Yen After YCC Tweak; Has the Trend Changed in USD/JPY, AUD/JPY, EUR/JPY?”, published July 31. While a hold above horizontal trendline support at about 93.00 is an encouraging sign for bulls, the cross needs to clear 94.00-95.00, including the 200-period moving average and the mid-August high for the bearish pressure to fade.

AUD/NZD Daily Chart

image5.png

AUD/NZD: Beginning to flex muscles

The recent pickup in upward momentum could be a sign that AUD/NZD is beginning to flex muscles after months of remaining directionless. This follows a repeated hold above quite strong support on the lower edge of a rising channel since April. A break above the initial barrier at the July high of 1.0925 could open the way toward the June high of 1.1050.

Canadian Dollar Forecast: USD/CAD Uptrend Losing Momentum, Hanging Man Eyed

Canadian Dollar Forecast: USD/CAD Uptrend Losing Momentum, Hanging Man Eyed

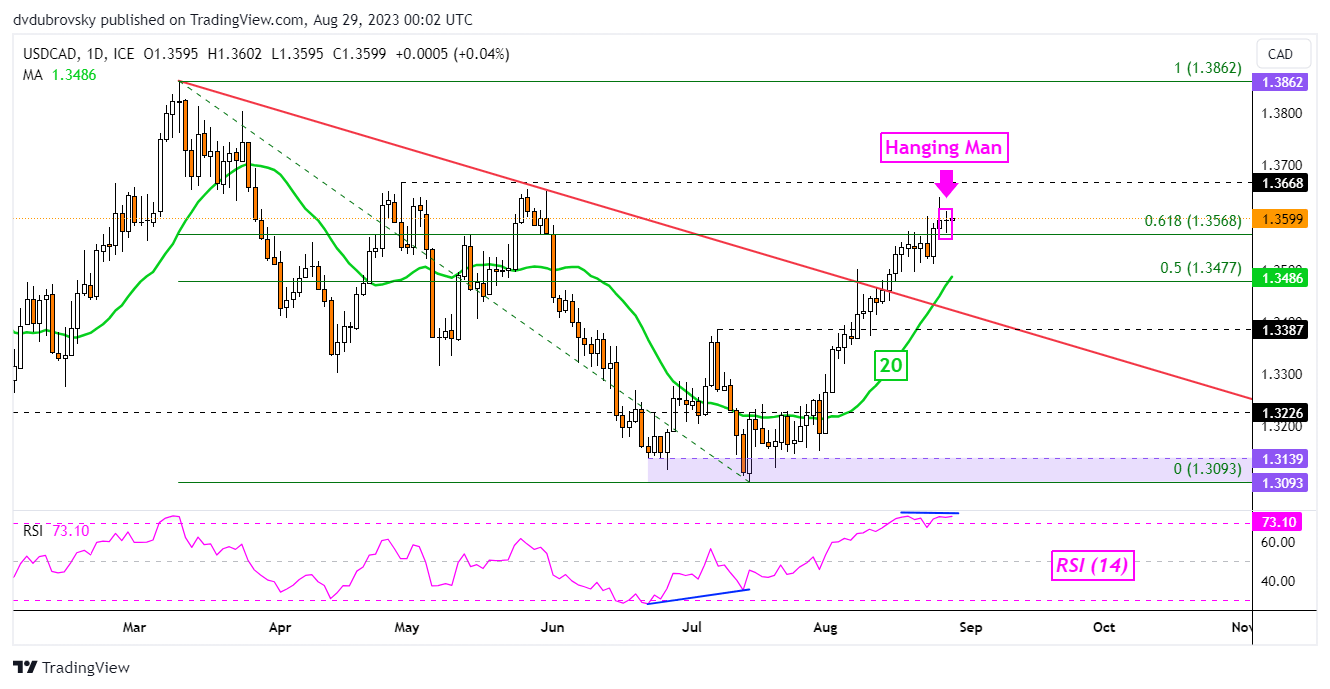
The Canadian Dollar has been losing ground to the US Dollar of late, but a closer look at USD/CAD shows that the near-term uptrend might be losing momentum. On the daily chart below, we can see that as prices climbed, negative RSI divergence started to emerge. This underscored fading momentum, which can at times precede a turn lower.

Furthermore, the exchange rate left behind a Hanging Man candlestick pattern. A confirmatory downside push could open the door to a bearish reversal. Such an outcome would place the focus on the 20-day Moving Average (MA). The latter could hold as support, reinstating the broader upside technical bias. Let us take a closer look at the 4-hour setting to see where near-term price action could go.

image1.png

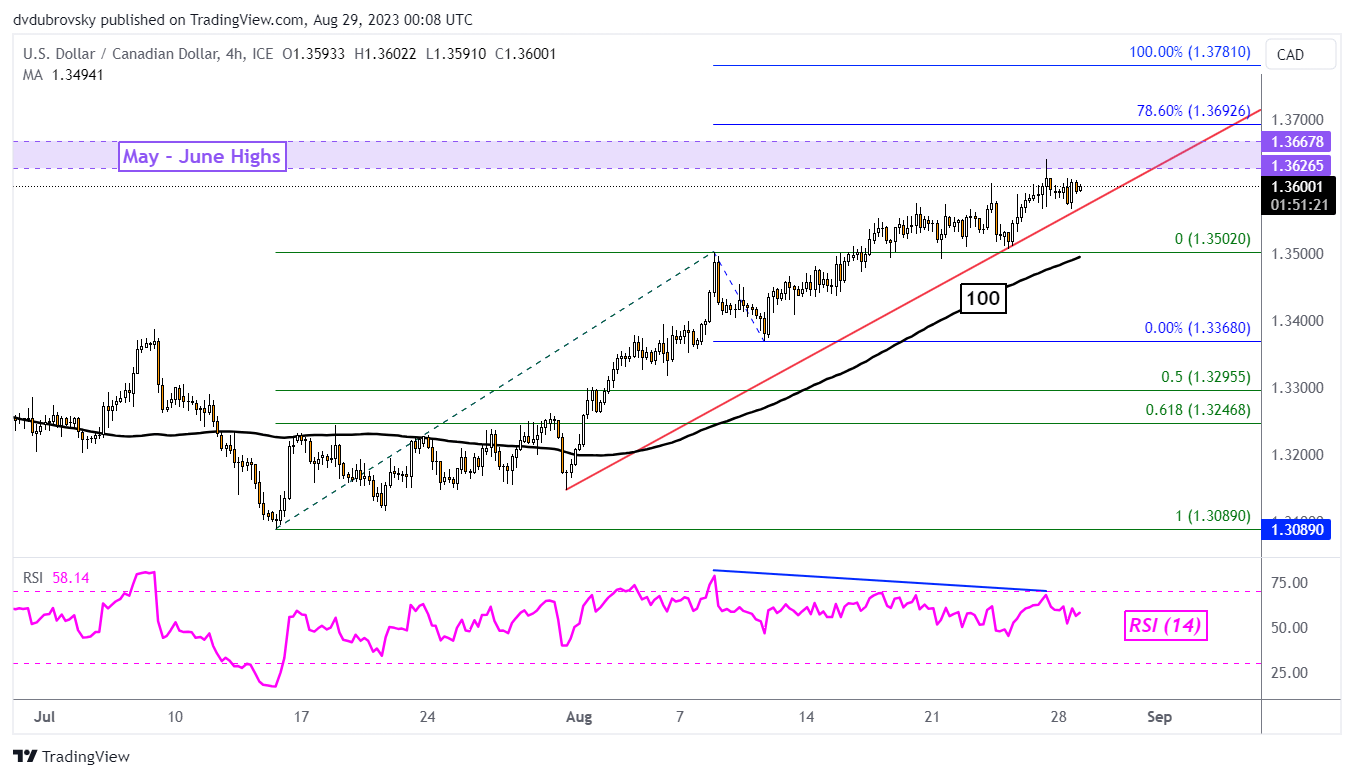
On the 4-hour chart below, we can see that negative RSI divergence is more pronounced. This is as prices are about to test highs from May and June, making for a key zone of resistance around 1.3626 – 1.3667. A drop through the trendline places the focus on the 100-period Moving Average. The latter could hold as support, maintaining the near-term upside technical bias.

In the event of a turn lower, key support is the 1.3502 inflection point. Extending lower and through the moving average exposes the August 10th low of 1.3368. Beyond the latter sit the midpoint and 61.8% Fibonacci retracement levels of 1.3295 and 1.3246, respectively. Otherwise, pushing above the zone of resistance exposes the 78.6% and 100% Fibonacci extension levels at 1.3692 and 1.3781, respectively.

image2.png


More Pain Ahead for Crude Oil? Is the Rebound Over in Natural Gas?

More Pain Ahead for Crude Oil? Is the Rebound Over in Natural Gas?

Natural gas: Is the rebound over?

The chances are growing that the five-month-long recovery is over. Natural gas’ fall in mid-August below 2.57 was a warning sign that the rebound is running out of steam – a risk pointed out in the previous update. See “How Much More to Go in Crude Oil? Is There More Upside in Natural Gas?”, published August 11.

This follows a failure to cross above the crucial hurdle at 3.00-3.05 (including the March high and the 30-week moving average). As the previous update highlighted, the two steps forward one step back nature of price action characterizes the recovery as corrective, rather than the start of a new uptrend. Natural gas is testing a vital horizontal floor at about 2.45-2.50. Any break below the support would confirm that the upward pressure had dissipated, potentially opening the door toward the May low of around 2.00.

Natural Gas Weekly Chart

image1.png

Zooming out, the failure of natural gas to witness a meaningful upward momentum in recent months is a sign that the broader downtrend is intact. The possibility of natural gas bottoming was first highlighted in early 2023 – see “Natural Gas Price Action Setup: Is the Slide Overdone?”, published February 21, and subsequently “Natural Gas Week Ahead: Base Building May Have Started”, published May 22, and “Natural Gas Price Rebound Could Extend; What’s Next For Crude Oil?”, published May 18.

Natural Gas Daily Chart

image2.png

However, the inability in recent weeks to rise toward the 200-day moving average is another sign of underlying weakness. Given the deep losses since last year, natural gas may need to undergo a prolonged period of base building before a sustainable uptrend emerges.

Crude Oil: More pain ahead?

The rise toward the April high of 83.50, a cross above the Ichimoku cloud on the daily charts, and the clearance above the 89-day moving average are signs that crude oil is beginning to flex muscles after months of subdued price action.

Crude Oil Daily Chart

image3.png

Most recently, crude oil has succumbed to vital resistance at 83.50 – a risk highlighted in theprevious update. Nevertheless, the nascent bullish trend since the end of June doesn’t appear to be over just yet. Crude oil would need to fall below the lower edge of the Ichimoku cloud on the daily chart for the short-term bullish bias to fade. Until then, the path of least resistance remains sideways to up.

Crude Oil Weekly Chart

image4.png

In recent months, crude oil has found strong support on the 200-week moving average. See “Crude Oil Extends Slide in Asia: Is This Capitulation?”, published May 4. Any break above 83.50 could pave the way toward the October high of 93.00, near the upper edge of the Ichimoku cloud on the weekly charts at about 95.00. The 93.00-95.00 region needs to be cleared to put crude oil back on the appreciation path.

NASDAQ 100, Dow Jones, S&P 500 News: Market Eyes Fed After Positive Week Start

NASDAQ 100, Dow Jones, S&P 500 News: Market Eyes Fed After Positive Week Start

US Stock Futures Point Higher as August Draws to a Close

Stock futures in the United States have started on a modestly optimistic note for the final trading week of August. Dow Jones Industrial Average futures rose by roughly 0.25%, alongside gains in S&P 500 and Nasdaq-100 futures, which increased by 0.21% and 0.31%, respectively. This uptick follows Jerome Powell’s latest remarks which set the stage for the Federal Reserve’s future monetary policy.


S&P 500, Nasdaq Composite, Dow Jones


Powell’s Cautious Optimism Drives Market Sentiment

Federal Reserve Chair Jerome Powell’s speech at the annual central bank conference in Jackson Hole, Wyoming, had Wall Street glued. He acknowledged signs of economic growth and robust consumer spending but emphasized a careful approach to further interest rate hikes. The stance maintains that the Fed would keep policy “restrictive” until inflation trends back to target levels. Market participants have priced in a 20% probability of another rate hike in the Fed’s upcoming September meeting.

Trading Derivatives carries a high level of risk to your capital and you should only trade with money you can afford to lose. Trading Derivatives may not be suitable for all investors, so please ensure that you fully understand the risks involved, and seek independent advice if necessary. A Product Disclosure Statement (PDS) can be obtained either from this website or on request from our offices and should be considered before entering into a transaction with us. Raw Spread accounts offer spreads from 0.0 pips with a commission charge of USD $3.50 per 100k traded. Standard account offer spreads from 1 pips with no additional commission charges. Spreads on CFD indices start at 0.4 points. The information on this site is not directed at residents in any country or jurisdiction where such distribution or use would be contrary to local law or regulation.

Indices Wrap-up: A Mixed Bag

Despite Powell’s positive remarks, U.S. stock indices are poised to end August in the red. The Dow and S&P 500 have declined by 3.4% and 4%, respectively, since the beginning of the month, and the tech-centric Nasdaq has dropped by approximately 5.3%. On a brighter note, shares of 3M jumped nearly 6% in premarket trading on news of a $5.5 billion settlement related to military earplug lawsuits.

3M Settles; Xpeng Acquires Didi Unit

3M shares surged 5.1% in premarket trading following reports that the company has potentially settled to pay over $5.5 billion to address claims of supplying faulty combat earplugs to the U.S. military.

Shares of Chinese EV manufacturer Xpeng, listed in the U.S., climbed 4.7% after announcing plans to acquire Didi’s electric car development unit in a deal valued at approximately $744 million.

Economic Data in Focus for the Week Ahead

Investors will keep their eyes peeled for more economic data this week, specifically the August Dallas Fed index, leading up to Friday’s crucial monthly jobs report. These economic indicators could provide a deeper look into consumer health, macroeconomic conditions, and the state of the U.S. labor market.

Short-Term Forecast: Mildly Bullish but Cautious

The market seems to be taking a cautiously optimistic stance for the week ahead, largely influenced by Powell’s remarks. While there’s a mild bullish sentiment, a lot hinges on forthcoming economic data and the Federal Reserve’s next moves. Investor caution is advisable amid such volatile conditions.