Asia Day Ahead: Relief Rally to Start the Week Ahead of Key Macro Data

Asia Day Ahead: Relief Rally to Start the Week Ahead of Key Macro Data

Wall Street managed to get through the Jackson Hole Symposium unscathed (DJIA +0.73%; S&P 500 +0.67%; Nasdaq +0.94%), despite a hawkish takeaway from Fed Chair Jerome Powell last Friday. The general view may be that market participants were already priced for a hawkish outcome in the lead-up to his speech, which allows room for some unwinding on little surprises.

In his speech, the Fed Chair highlighted that the US central bank is prepared to raise interest rates further if needed, noting that a resilient economy comes with risks that inflation could reaccelerate. Rate expectations took that as a sign for an additional hike on the table, with the odds of a November rate hike (25 basis-point) increasing to 48%, up from 33% a week ago. Treasury yields firmed as a result, with the two-year yields edging back to retest its multi-year high around the 5.100% level.

This week will bring focus to a series of key macro data, such as the US job report and PCE inflation data, in which the Fed will want to see softer numbers on both fronts to reassure on the success of current tight policies. Aside, overall trading volume may be lighter as we head into the US Labour Day weekend, which could be a trigger for higher volatility.

For now, the S&P 500 is attempting to pare back some losses from its Thursday sell-off, after nearing the lower edge of its Ichimoku cloud support on the daily chart. The 4,330 level may be an immediate support to hold, where the neckline of a potential head-and-shoulder formation coincides with its 100-day moving average (MA). Failing to defend this level may potentially pave the way to retest the 4,150 level next. Much may still await on how far the near-term relief may go, considering that we are heading into September, which tends to be the worst month for US equities seasonally.
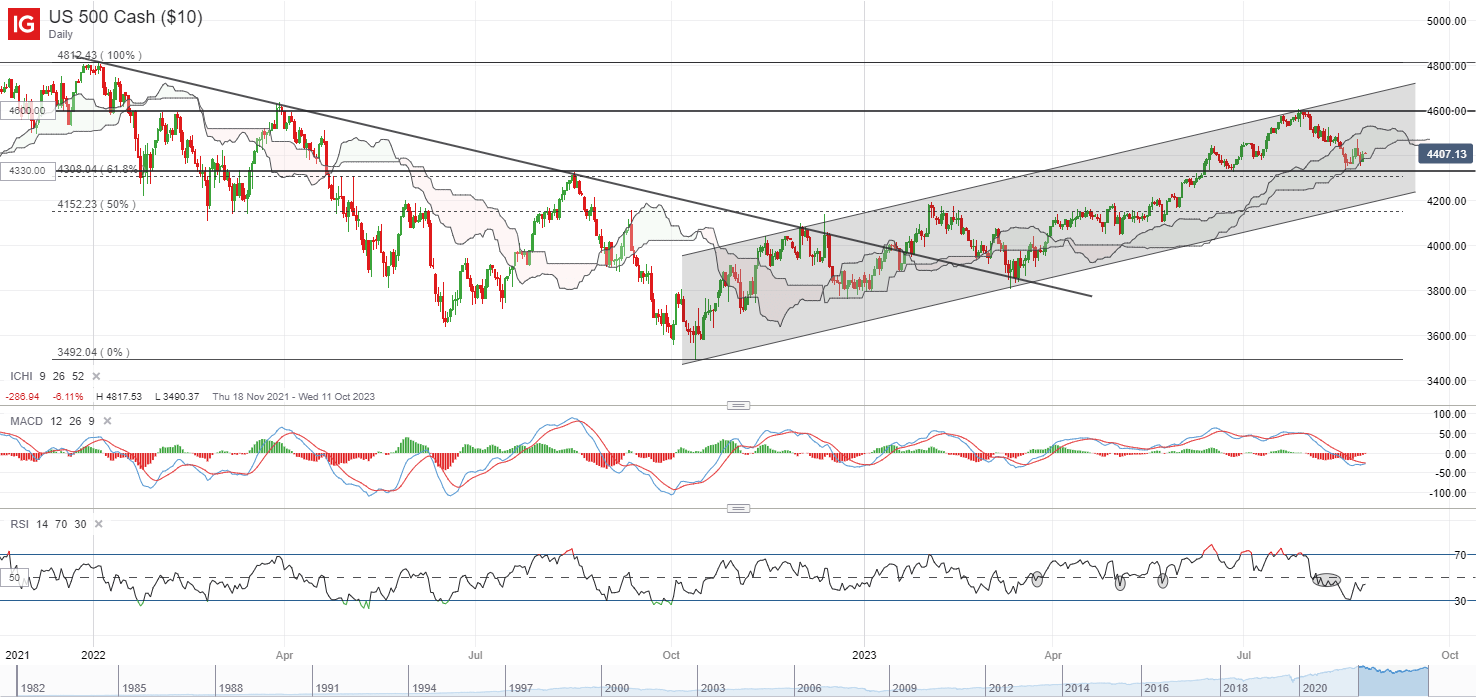
image1.png

Asia Open

Asian stocks look set for a positive open, with Nikkei +1.31%, ASX +0.47% and KOSPI +0.67% at the time of writing, tapping on the positive handover in Wall Street for some relief to start the new week. Key focus in the region this week may be on Australia’s monthly consumer price index (CPI) data on Wednesday, followed by China’s purchasing managers index (PMI) data on Thursday.

Chinese stocks will once again be in focus, with authorities stepping in to support its stock market with a reduction of the stamp duty on stock trades and a slower pace of initial public offerings. Previous round of reduction in levy on stock trades in September 2008 was met with an initial move higher, but gains were short-lived (lasting for a week) before the CSI 300 index eventually moved to hit a new low. Therefore, while the recent move may be met with a positive reaction in Chinese equities in today’s session, it may still have to take a more sustained recovery in economic conditions to bolster investors’ confidence over the longer term.

Recent bounce in the Hang Seng Index has brought the index back to retest the lower bound of its previous consolidation zone on the weekly chart at the 18,500 level, which will serve as near-term resistance to overcome. A bullish moving average convergence/divergence (MACD) formation is seen on the daily timeframe for now, but the lower highs and lower lows since the start of the year still put an overall downward trend in place. Greater conviction for buyers may have to come from a move back above the psychological 20,000 level, where the upper edge of its Ichimoku cloud resistance stands on the weekly chart, which it has failed to overcome on three previous occasions this year.
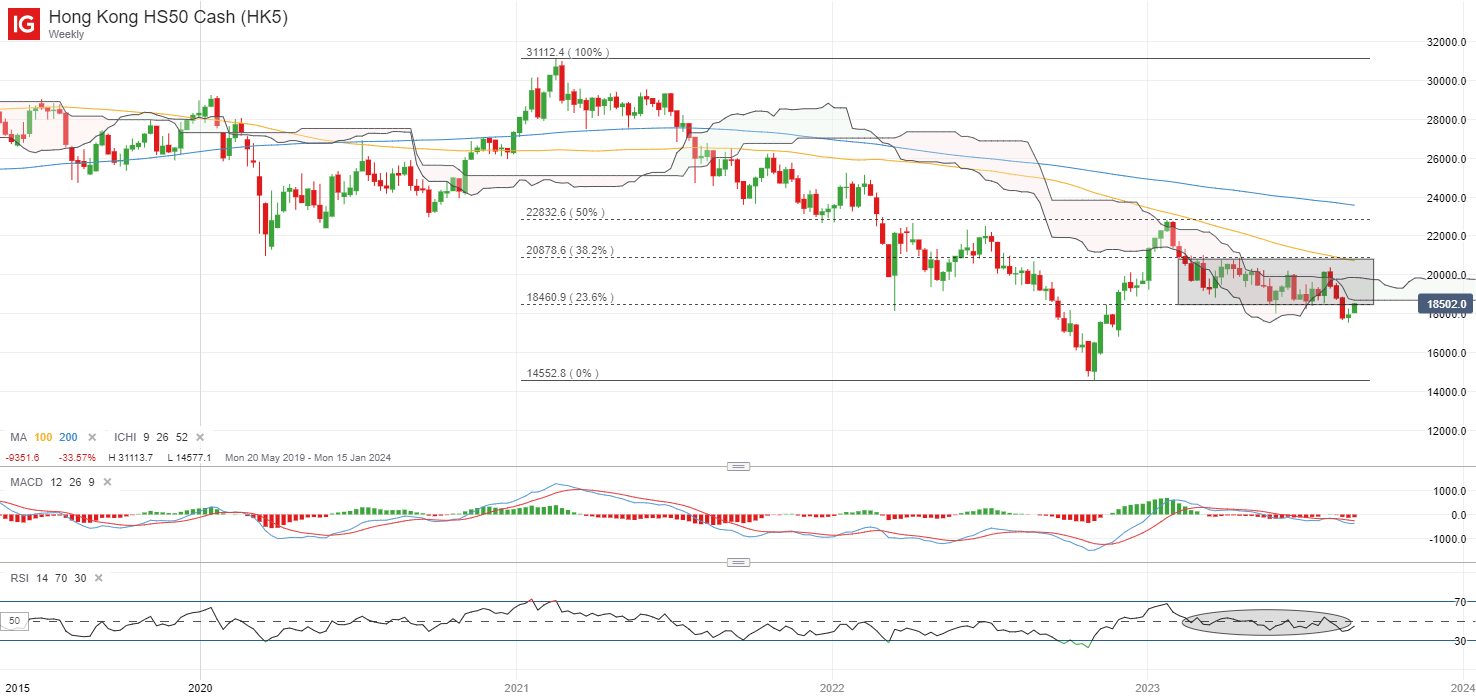
image2.png

On the watchlist: Copper prices facing key test of resistance confluence ahead

Copper prices have recovered close to 4% over the past two weeks, but are now facing a key test of resistance confluence at the US$8,500/tonne level. This is where a series of MA lines (50-day MA, 100-day MA) stands alongside the upper edge of its Ichimoku cloud on the daily chart. Heading past this level may potentially leave the US$8,700/tonne level in sight next.

Overall, some indecision is still in place, with its weekly relative strength index (RSI) hovering around the key 50 level, while its weekly MACD flatlines. On the downside, the US$8,145/tonne level may be an immediate support to hold.
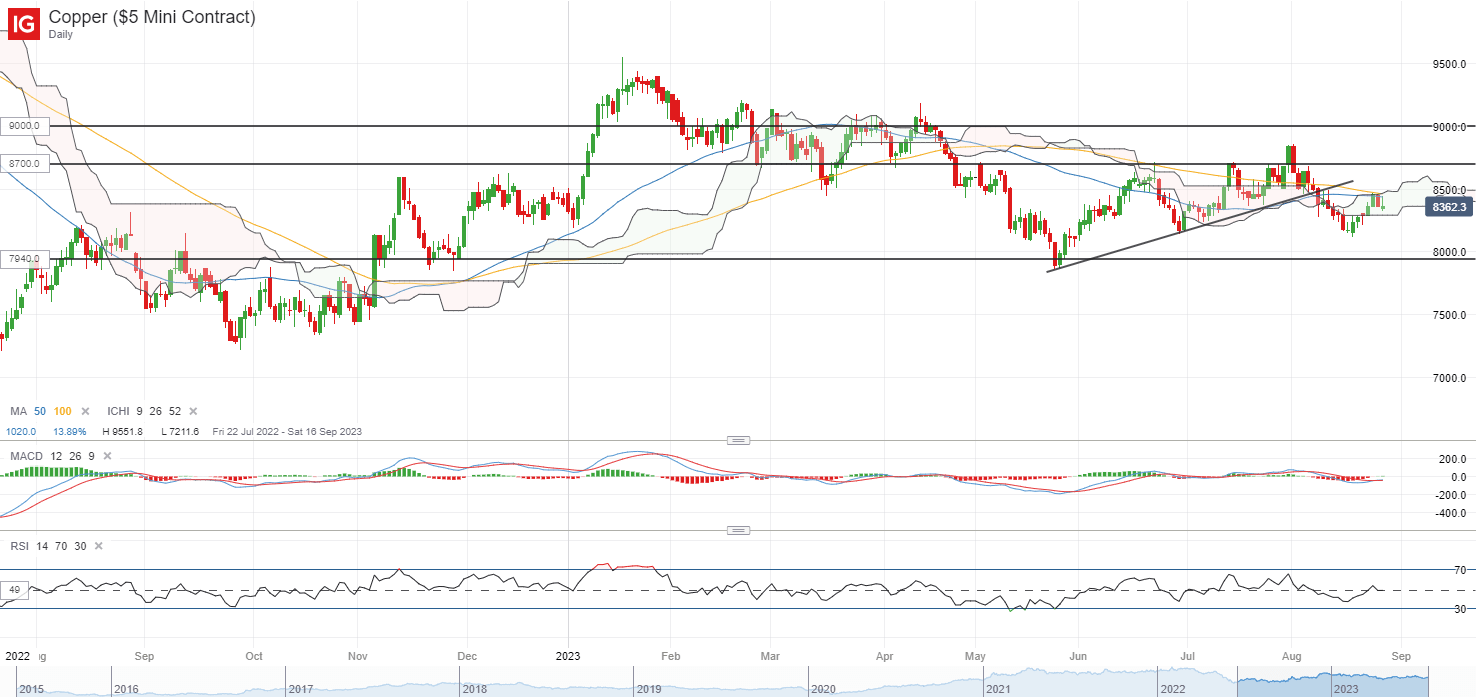
image3.png

US Dollar Flirts with Resistance After Powell; EUR/USD, GBP/USD, AUD/USD Price Action

US Dollar Flirts with Resistance After Powell; EUR/USD, GBP/USD, AUD/USD Price Action

The US dollar is holding gains against its peers after US Federal Reserve Chair Jerome Powell warned of more tightening to bring down inflation to the 2% target, especially if the recent uptick in activity exerts upward pressure on prices.

At the annual Jackson Hole Economic Policy Symposium, US Federal Reserve Chair Jerome Powell on balance stuck with a slightly hawkish tone, warning of additional rate hikes as inflation remains too high. However, Powell acknowledged the moderation in price pressure and said the Fed proceed carefully on whether to tighten further.

Powell said above trend growth could put further progress on inflation at risk and could warrant further tightening. US economic data have overwhelmed in recent months, with the Economic Surprise Index just off more than a two-year high. The recent upbeat industrial production, retail sales, and housing starts suggest activity in the current quarter has picked up. For more discussion see “US Dollar Toppish Ahead of Powell; EUR/USD, AUD/USD, GBP/USD Price Setups,” published August 24. Markets are now pricing in around 50% chance of a 25 basis points hike by the Fed at its November meeting, up from 33% a week ago.

The key focus is now on US manufacturing and services activity, US core PCE, and jobs data. Any signs of moderation in activity or price pressures could trigger a scale back in November rate hike expectations.

DXY Index Daily Chart

image1.png

On technical charts, the DXY Index (USD index) posted a doji candlestick pattern on the daily chart on Friday at vital resistance at the May high of 104.70, reflecting indecision. The 14-day Relative Strength Index is around 70 – the area that triggered a retreat on two occasions since the beginning of 2023. Having said that, the index would need to break below immediate support at last week’s low of 103.00 for the upward pressure to dissipate.

EUR/USD Daily Chart

image2.png

EUR/USD: Testing fairly strong support area

EUR/USD is flirting with fairly strong support on the 200-day moving average, coinciding with the lower edge of an upward-sloping channel, and slightly above the May low of 1.0630. The pair needs to hold above 1.0600-1.0800 for the broader upward pressure to remain intact. The 14-day Relative Strength Index is around levels that have been associated with a rebound in the past. Nevertheless, as highlighted in theprevious update, EUR/USD would need to rise above the initial resistance at 1.0900-1.0950 for the immediate downside risks to fade.

GBP/USD Daily Chart

image3.png

GBPUSD: Testing the line in the sand

GBP/USD’s failed attempt last week to clear important resistance at the August 10 high of 1.2820 is a sign of broader fatigue within the multi-month uptrend. For more discussion see “Pound’s Resilience Masks Broader Fatigue: GBP/USD, EUR/GBP, GBP/JPY Setups,” published August 23.

The pair is now testing the lower end of this month’s range of 1.2600-1.2800. The lower edge also coincides with the 89-day moving average, the lower edge of the Ichimoku cloud on the daily chart, and the end-June low of 1.2600. Below that, there is support on the 200-day moving average and the May low of 1.2300. Only a break below 1.2300 would pose a threat to the broader bullish phase.

AUD/USD 240-minutes Chart

image4.png

AUD/USD: Signs of downtrend fatigue

AUD/USD continues to hold above vital converged support on the median line of a declining pitchfork channel since June and a downtrend line from the end of 2023. Any break above Friday’s high of 0.6440 could pave the way toward last week’s high of 0.6590. A break above 0.6590-0.6600 is needed for the immediate downward pressure to fade. Such a break could clear the path toward the 200-period moving average on the 240-minute chart. (now at about 0.6600).

Australian Dollar Boosted by Hang Seng Uplift on China’s Tweaks. Will AUD/USD Recover?

Australian Dollar Boosted by Hang Seng Uplift on China’s Tweaks. Will AUD/USD Recover?

The Australian Dollar found firmer footing to start the week with market sentiment improving after China took further measures to bolster the domestic equity market.

China’s Ministry of Finance announced that stamp duty on stock trades would be halved from 0.1% to 0.05%.

In addition and in a somewhat peculiar announcement, China’s Securities Regulatory Commission announced that the pace of IPOs will be slowed.

Hong Kong’s Hang Seng Index (HSI) and the mainland CSI 300 indices roared over 2% higher. The rest of APAC equity markets are a sea of green with Japan’s bourses notching up some solid gains.

Over the weekend Bank of Japan Governor Kazuo Ueda said, “We think that underlying inflation is still a bit below our target, this is why we are sticking with our current monetary easing framework.”

The confirmation of his dovish tilt also saw USD/JPY climb towards a 10-month high to start the week.

Also speaking at the Jackson Hole symposium, Fed Chair Jerome Powell reiterated his view that rates will be high for a long time and that another hike can’t be ruled out if the data warrants it.

European Central Bank (ECB) President Christine Lagarde also raised her concerns about inflation but was less prescriptive about the rate path. A series of European CPI readings will be released this week and could provide a catalyst for moves in EUR/USD.

Elsewhere, US Commerce Secretary Gina Raimondo is visiting China this week as both countries appear willing to heal the rift. Repairing trade relations is the focus of the talks.

The WTI futures contract is near US$ 80 bbl while the Brent contract is trading around US$ 84.50 bbl at the time of going to print. Spot gold is steady near US$ 1,915 an ounce.

Looking ahead, it is mostly second and third-tier data due out today and all the details for the full economic calendar can be viewed here.

AUD/USD TECHNICAL ANALYSIS SNAPSHOT

AUD/USD has consolidated to start the week and has failed to close below an ascending trend line.

Although it has traded a couple of times below it, it is yet to close under it. That may suggest that it might remain intact for now.

Stepping back though, it is still in a descending trend channel. To learn more about trend trading, click on the banner below.

On the downside, support may lie at the breakpoints and previous lows of 0.6386,

0.6365, 0.6272 and 0.6170.

The latter might also be supported at 161.8% Fibonacci Extension level at 0.6186. To learn more about Fibonacci techniques, click on the banner below.

Nearby resistance could be at the breakpoints near 0.6460 ahead of a cluster of breakpoints and prior peaks in the 0.6595 – 0.6615.

image1.png


XAU/USD Price Forecast: Gold Retains Gains Post-Powell

XAU/USD Price Forecast: Gold Retains Gains Post-Powell

XAU/USD FUNDAMENTAL BACKDROP

Gold prices have managed to remain elevated this Monday morning as the US dollar trades marginally lower. While Fed Chair Jerome Powell and other officials (Mester) eluded to the potential for additional monetary policy tightening if necessary, the current trajectory of economic data could see rates remain on hold for some time before cutting. Money markets (refer to table below) are now expecting the first round of rate cuts around June/July as opposed to May pre-Jackson Hole.

IMPLIED FED FUNDS FUTURES

image1.png

US economic data will become even more pertinent and with several key releases scheduled this week (see economic calendar below), markets will gain more clarity moving forward. Forecasts point to a resilient US economy that could weigh negatively on gold prices should actual data print in line with estimates. Core PCE and Non-Farm Payroll (NFP) numbers will be the focus as has been the case of recent. The robust US labor market has yet to show signs of significant weakness leaving pressure on core inflation.

GOLD ECONOMIC CALENDAR

image2.png

TECHNICAL ANALYSIS

GOLD PRICE DAILY CHART

image3.png

Daily XAU/USD price action above has managed to stay above the 200-day moving average (blue) for now after breaking above the falling wedge chart pattern (black) last week. That being said, several recent doji candles suggest uncertainty/hesitancy as high impact economic data awaits. Gold is by no means out of the woods yet and could slump back below 1900.00 once again should incoming data demand so.

Resistance levels:

  • 1950.00
  • 50-day MA (yellow)
  • 1925.06

Support levels:

  • 200-day MA
  • 1900.00
  • 1890.21

IG CLIENT SENTIMENT: BULLISH

IGCS shows retail traders are currently distinctly LONG on gold, with 78% of traders currently holding long positions (as of this writing). Download the latest sentiment guide (below) to see how daily and weekly positional changes affect GOLD sentiment and outlook.

Nasdaq Index, Dow Jones, S&P 500 News: Powell’s Jackson Hole Address Sets the Tone for Wall Street

Nasdaq Index, Dow Jones, S&P 500 News: Powell’s Jackson Hole Address Sets the Tone for Wall Street

Wall Street Eyes Jackson Hole Symposium

U.S. stock futures displayed a mixed sentiment on Friday, with significant anticipation building up towards Jerome Powell’s address at the Jackson Hole Economic Symposium. The Dow Jones Industrial Average futures saw an uptick of 0.3%, whereas S&P 500 futures rose by 0.2%. However, Nasdaq-100 futures showed a decline.

A Historical Perspective

Last year, this key financial gathering witnessed a drop in stocks post-Powell’s hawkish remarks, where he highlighted potential challenges in curbing inflation. The 2022 symposium, set against the backdrop of evolving global economic dynamics, promises discussions on “structural shifts in the global economy.”

Trading Derivatives carries a high level of risk to your capital and you should only trade with money you can afford to lose. Trading Derivatives may not be suitable for all investors, so please ensure that you fully understand the risks involved, and seek independent advice if necessary. A Product Disclosure Statement (PDS) can be obtained either from this website or on request from our offices and should be considered before entering into a transaction with us. Raw Spread accounts offer spreads from 0.0 pips with a commission charge of USD $3.50 per 100k traded. Standard account offer spreads from 1 pips with no additional commission charges. Spreads on CFD indices start at 0.4 points. The information on this site is not directed at residents in any country or jurisdiction where such distribution or use would be contrary to local law or regulation.

Investor Sentiment and Market Volatility

The financial community remains vigilant, deciphering insights from Powell and his contemporaries. The main point of interest is whether high interest rates will persist, particularly if inflation rates start to retreat. Market strategists opine that any upheaval due to Powell’s speech will likely be ephemeral. They perceive recent fluctuations in equities and fixed income as corrective measures rather than a sustained shift.

Recent Market Performance

In the wake of strong Nvidia earnings, Wall Street had a turbulent session. The S&P 500 and Nasdaq couldn’t sustain an initial surge. Both experienced their largest single-day setbacks since early August, and the Dow recorded its heaviest retreat since March.

Short-Term Forecast

Despite the turbulence, the S&P 500 and Nasdaq seem poised to end the week positively with gains of 0.2% and 1.3%. Should this trend persist, it would mark the end of their three-week descent, indicating a mildly bullish short-term outlook.

Oil Prices Forecast: Futures Indicate Waning Demand Amid Robust Dollar, OPEC Dynamics

Oil Prices Forecast: Futures Indicate Waning Demand Amid Robust Dollar, OPEC Dynamics

Oil Prices Rise, But Weekly Decline Looms

Early Asian trade on Friday witnessed a marginal surge in oil prices. Nevertheless, they are poised to end the week on a descending note, influenced by global manufacturing downturns and a robust dollar.

Current Market Dynamics

In the early hours, Brent crude advanced to $83.54 a barrel, marking an 18 cent rise. Concurrently, U.S. West Texas Intermediate crude saw an uptick, settling at $79.32 a barrel. Despite these gains, crude prices are projected to decrease by 2% to 3% by week’s end, marking the second successive weekly decline. This comes after a slight rise in the prior session, spurred by data from Dutch consultancy Insights Global which highlighted a 3% drop in gasoil stocks in the ARA refining and storage hub.

Trading Derivatives carries a high level of risk to your capital and you should only trade with money you can afford to lose. Trading Derivatives may not be suitable for all investors, so please ensure that you fully understand the risks involved, and seek independent advice if necessary. A Product Disclosure Statement (PDS) can be obtained either from this website or on request from our offices and should be considered before entering into a transaction with us. Raw Spread accounts offer spreads from 0.0 pips with a commission charge of USD $3.50 per 100k traded. Standard account offer spreads from 1 pips with no additional commission charges. Spreads on CFD indices start at 0.4 points. The information on this site is not directed at residents in any country or jurisdiction where such distribution or use would be contrary to local law or regulation.

External Economic Influences

The impending remarks from Federal Reserve Chair Jerome Powell at the Jackson Hole Symposium have stirred caution among investors. As a result, the dollar soared to a 10-week apex, diminishing the appeal of oil for those holding other currencies. This dynamic is exacerbated by shrinking factory activities in major global economies. Japan, for instance, recorded a drop in factory activity for the third consecutive month, while the Euro zone and Britain have also reported economic downturns.

India’s Consumption Patterns

India, a significant player in the oil market, has reported stagnating oil consumption growth, a consequence of inflation and decelerating global trade. Notably, the increase recorded over the initial seven months equated to approximately 255,000 bpd, a significant fall from the previous year.

Supply-Side Overview

The week brought reports suggesting Saudi Arabia’s potential extension of its production cuts into October. This move, however, seemed to have a muted impact on market sentiments. Meanwhile, despite existing U.S. sanctions, Iran’s oil minister announced expectations of the country’s crude oil output hitting 3.4 million bpd by September’s end.

Short-Term Forecast

While oil prices have experienced minor fluctuations, overarching market dynamics point towards a weekly decline. Factors ranging from global economic performance to currency strengths play pivotal roles in shaping the market’s trajectory.

Technical Analysis

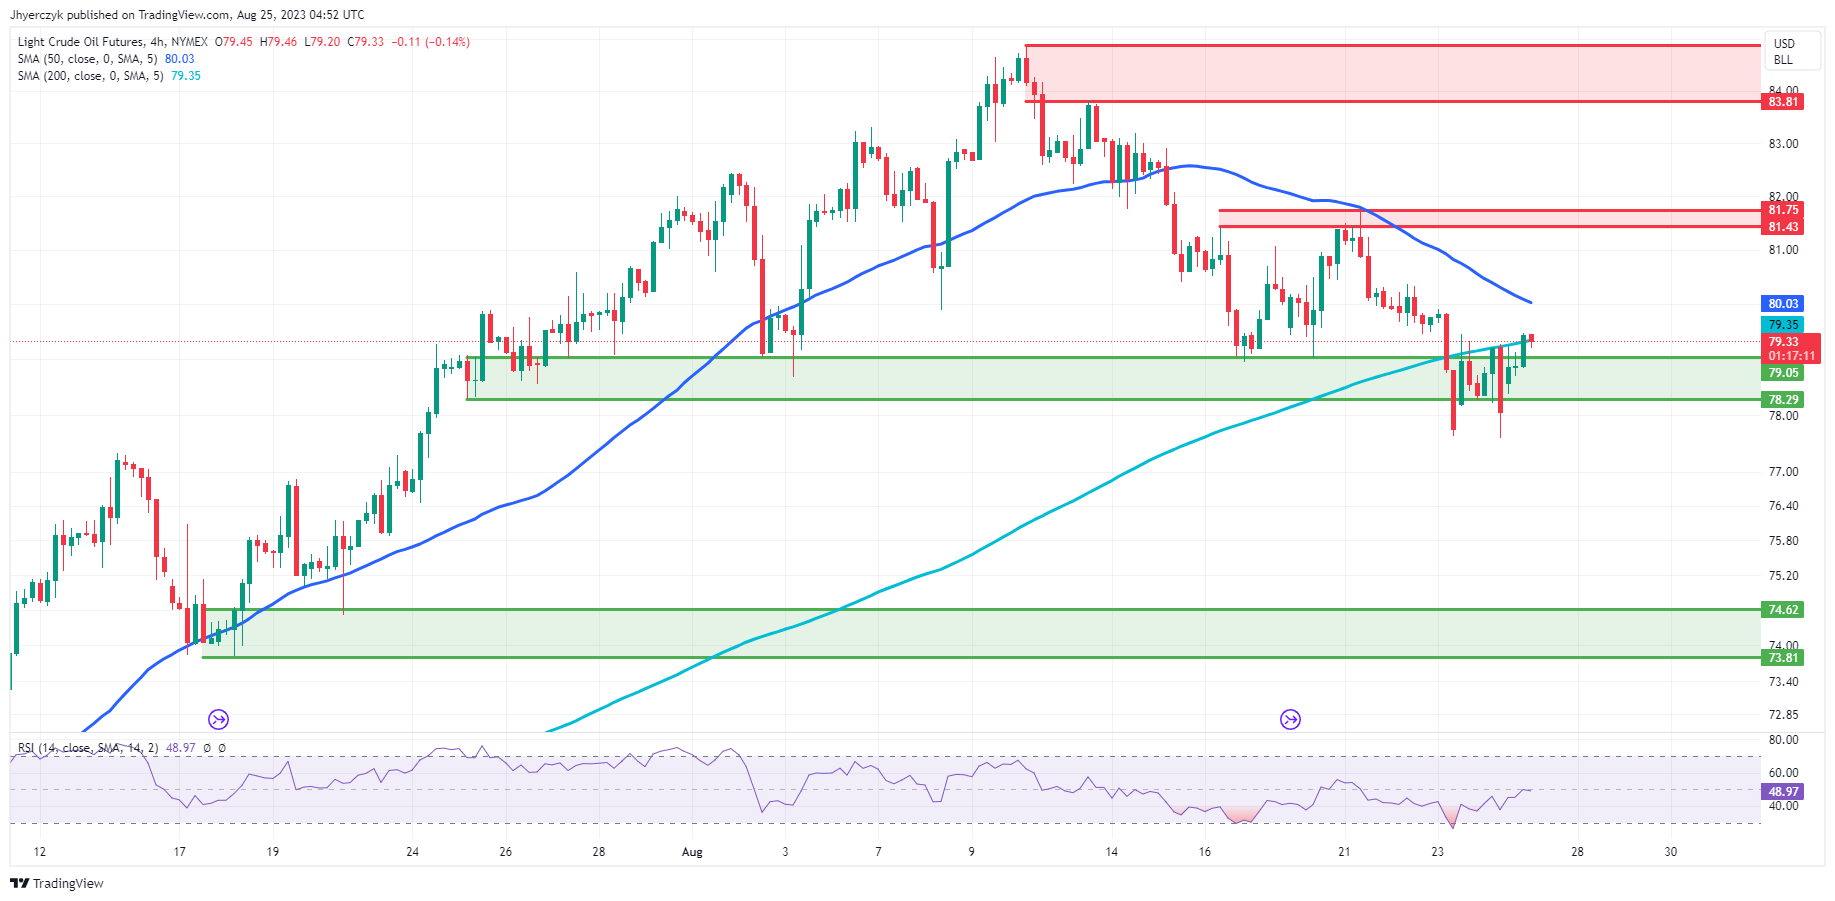
4-Hour Crude OilThe current 4-hour price at $79.31 has just dipped below the 200-4H moving average of $79.34, signaling a possible bearish crossover. This sentiment is further reinforced as it remains below the 50-4H moving average, which is at $80.03. The 14-4H RSI stands at 48.82, which, being below the neutral 50 mark, suggests weaker momentum.

The price is currently hovering just above the main support range of $79.05 to $78.29, indicating a critical juncture. With the main resistance area between $81.43 to $81.75. Based on these indicators, the market leans slightly bearish in the short term.

US Dollar Flirts with Resistance After Powell; EUR/USD, GBP/USD, AUD/USD Price Action

AUD to USD Forecast: Aussie Dollar Reacts to Fed Fear Amid RBA’s Rate Stance

Thursday Overview

On Thursday, the AUD/USD tumbled by 0.98% to end the day at $0.64172. The Aussie dollar rose to an early high of $0.64881 before sliding to a session low of $0.64125 on Fed Fear.

Advertisement

Market Risk Sentiment to Dictate Pre-Fed Chair Powell

There are no economic indicators from Australia or China for investors to react to this morning. The lack of economic indicators will leave investors to assess central bank positions to tackle inflation, China’s economy, and a shifting macroeconomic environment.

Trading Derivatives carries a high level of risk to your capital and you should only trade with money you can afford to lose. Trading Derivatives may not be suitable for all investors, so please ensure that you fully understand the risks involved, and seek independent advice if necessary. A Product Disclosure Statement (PDS) can be obtained either from this website or on request from our offices and should be considered before entering into a transaction with us. Raw Spread accounts offer spreads from 0.0 pips with a commission charge of USD $3.50 per 100k traded. Standard account offer spreads from 1 pips with no additional commission charges. Spreads on CFD indices start at 0.4 points. The information on this site is not directed at residents in any country or jurisdiction where such distribution or use would be contrary to local law or regulation.

The latest round of Australian economic indicators has closed the door on further RBA rate hikes. In Q2, the annual inflation rate softened from 7.0% to 6.0%. Australian employment numbers also fueled bets on the RBA ending its monetary policy tightening cycle. The Australian unemployment rate increased from 3.5% to 3.7% in July.

An upward trend in unemployment curbs consumer spending, leading to an easing in demand-driven inflationary pressures. The RBA surprised the markets in August, leaving the cash rate at 4.10%. After hiking rates on 12 occasions, the economic indicators suggest that the aggressive monetary policy measures are beginning to take effect.

A deteriorating macroeconomic environment with consumers tightening the purse strings will impact service sector activity and the Australian economy. The services sector contributes more than 60% to GDP. Coupled with China’s economic woes, the RBA’s bid to avoid sending the Australian economy into a recession could be challenging.

In contrast, US economic indicators leave the Fed poised to deliver one final rate hike before hitting the brakes. A hotter-than-expected US economy tilts monetary policy divergence in favor of the dollar.

Fed Chair Powell in the Driving Seat at Jackson Hole

Higher for longer is the theme regarding the Fed interest rate trajectory. While US private sector PMI numbers eased bets on one final rate hike, the tight labor market and wage growth leave investors uncertain.

This afternoon, Fed Chair Powell could remove the uncertainty that has fueled dollar volatility in recent sessions. In July, the US annual inflation rate accelerated from 3.0% to 3.2%, with the US unemployment rate falling from 3.6% to 3.5%.

Considering the Fed’s dual mandate, the simple dynamic of an upward trend in consumer prices and a downward trend in unemployment support a hawkish monetary policy outlook.

However, the Fed will have another round of economic indicators to consider before the September FOMC meeting. Fed Chair Powell could deliver a no-commitment speech on policy or a curve ball by talking about the need to tackle inflation and a tight labor market at the expense of the US economy.

The variables will leave the Aussie dollar in limbo ahead of the Fed Chair Powell speech.

With the markets focused on the Fed, we expect US economic indicators to take a back seat today.

AUD/USD Price Action

Daily Chart

The Daily Chart showed the AUD/USD below the $0.6430 – $0.6450 resistance band. Significantly, the Australian dollar remained below the 50-day and 200-day EMAs, sending bearish near and longer-term price signals.

Looking at the 14-Daily RSI, 35.30 reflects a bearish sentiment. The RSI aligns with the EMAs, signaling a fall to sub-$0.64 to bring the $0.6340 – $0.6320 support band into play. However, a move through the lower level of the $0.6430 – $0.6450 resistance band would give the bulls a look at $0.65.

AUD to USD Daily Chart sends bearish price signals.
AUDUSD 250823 Daily Chart

4-Hourly Chart

Looking at the 4-Hourly Chart, the AUD/USD sits below the $0.6430 – $0.6450 resistance band. The Thursday sell-off left the AUD/USD below the 50-day and 200-day EMAs, affirming the bearish near and longer-term price signals.

Looking at the 14-4-Houly RSI, 43.89 also reflects a bearish sentiment, with selling pressure overweighing buying pressure. The RSI aligns with the EMAs supporting a return to sub-$0.64 to bring the $0.6340 – $0.6320 support band into play. However, a move through the lower level of the $0.6430 – $0.6450 resistance band would give the bulls a run at the 50-day EMA and $0.65.

Price action today will hinge on the heavily anticipated Fed Chair Powell speech from Jackson Hole.

4-Hourly Chart affirms bearish price signals.
AUDUSD 250823 4-Hourly Chart
EUR/USD Forecast: Between German Economic Pulse and Powell’s Predictions

EUR/USD Forecast: Between German Economic Pulse and Powell’s Predictions

Thursday Overview

The EUR/USD fell by 0.48% on Thursday to wrap up the day at $1.08103. A mixed start to the day saw the EUR/USD rise to an early high of $1.08573 before sliding to a low of $1.08049. US economic indicators and market angst ahead of the Fed Chair Powell speech weighed.

EUR/USD and Sub-$1.08 in the Hands of Fed Chair Powell

German GDP and Ifo Business Climate Index numbers will draw interest this morning. Following dire August private sector PMI numbers on Wednesday, investors will likely be ready for more gloomy reports.

Trading Derivatives carries a high level of risk to your capital and you should only trade with money you can afford to lose. Trading Derivatives may not be suitable for all investors, so please ensure that you fully understand the risks involved, and seek independent advice if necessary. A Product Disclosure Statement (PDS) can be obtained either from this website or on request from our offices and should be considered before entering into a transaction with us. Raw Spread accounts offer spreads from 0.0 pips with a commission charge of USD $3.50 per 100k traded. Standard account offer spreads from 1 pips with no additional commission charges. Spreads on CFD indices start at 0.4 points. The information on this site is not directed at residents in any country or jurisdiction where such distribution or use would be contrary to local law or regulation.

Economists forecast the German economy to contract by 0.2% in the second quarter year-over-year and to stall in the quarter. A quarter-on-quarter contraction would weigh heavily. With the gloomy mood, a surprise to the upside would likely have more impact. Significantly, a quarter-on-quarter economic contraction would give the ECB more reason to hit the brakes.

Economists forecast the Ifo Business Climate Index to fall from 87.3 to 86.7. A more marked decline would add to the bearish mood. However, we expect the Ifo numbers to play second fiddle to the GDP data.

With the German economy in the spotlight, investors should monitor ECB chatter. ECB President Christine Lagarde is on the calendar to speak today. The disappointing PMI numbers from the euro area eased bets on a September ECB rate hike. Hawkish comments would drive buyer appetite.

Fed Chair Powell and the Jackson Hole Symposium in Focus

Finalized Michigan Consumer Sentiment figures will draw interest this afternoon. Despite impressive US retail sales figures, consumer sentiment waned in August, according to prelim figures. Upward revisions would support a more hawkish Fed monetary policy outlook.

An upward trend in consumer sentiment signals a pickup in consumption that would fuel demand-driven inflationary pressures. Further rate hikes would reduce disposable incomes, impact spending, and ease demand-driven consumer price inflation.

According to preliminary numbers, the Michigan Consumer Sentiment Index fell from 71.6 to 71.2 in August.

However, while the stats will draw interest, we expect Fed Chair Powell’s speech to be the key driver. After the consumer sentiment numbers, Powell could talk about higher-for-longer.

Higher-for-longer would shift monetary policy divergence more in favor of the dollar. Considering the latest labor market numbers and sticky inflation, dovish chatter would catch the markets by surprise.

EUR/USD Price Action

Daily Chart

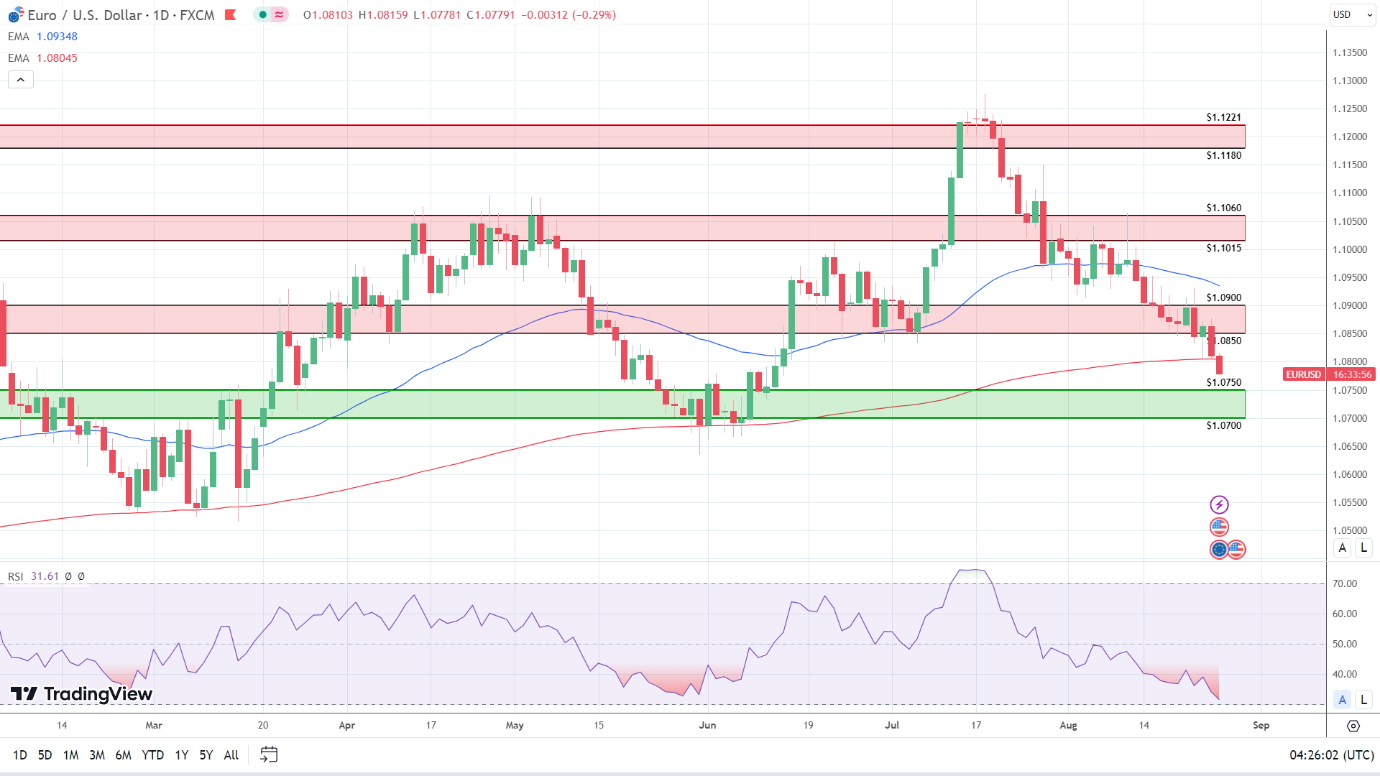
The Daily Chart showed the EUR/USD below the 1.0850 – $1.0900 resistance band. After the Thursday loss, the EUR/USD sat below the 50-day and 200-day EMAs, sending bearish near and longer-term price signals.

Looking at the 14-Daily RSI, the 31.61 reading reflects a bearish sentiment. The RSI aligns with the EMAs, signaling a fall through the upper level of the $1.0750 – 1.0700 support band. However, a EUR/USD move through the 200-day EMA would bring the $1.0850 – $1.0900 resistance band into view.

EUR/USD Daily Chart sends bearish price signals.
EURUSD 250823 Daily Chart

4-Hourly Chart

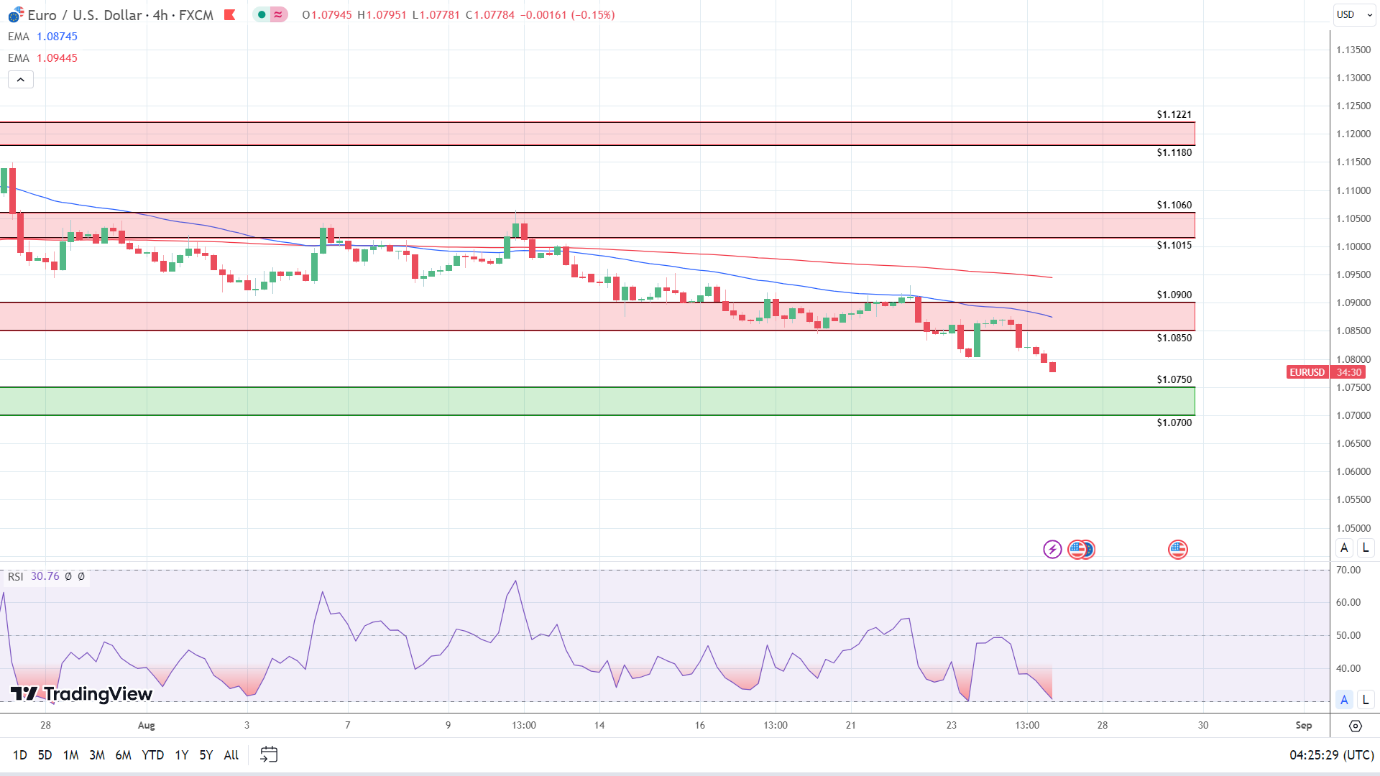
Eying the 4-Hourly Chart, the EUR/USD sits below the $1.0850 – $1.0900 resistance band. The EUR/USD also sat below the 50-day and 200-day EMAs, sending bearish near and longer-term price signals.

The 14-4H RSI at 30.76 reflects a bearish sentiment, with selling pressure outweighing buying pressure. Significantly, the RSI signals a fall through the upper level of the $1.0750 – $1.0700 support band to bring sub-$1.07 into play. However, a move through the lower level of the $1.0850 – $1.0900 resistance band would give the bulls a run at the 50-day EMA.

4-Hourly Chart affirms bearish price signals.
EURUSD 250823 4 Hourly Chart
Silver Prices Forecast: XAG/USD Traders Awaiting Powell’s Balanced Take at Jackson Hole

Silver Prices Forecast: XAG/USD Traders Awaiting Powell’s Balanced Take at Jackson Hole

Overview

Silver (XAG/USD) faces downward pressure amid the U.S. dollar’s resurgence, yet it’s geared up for a notable week, with Federal Reserve Chair Jerome Powell’s imminent speech being the focal point.

Silver’s Performance and U.S. Treasury Impact

Spot silver has seen a decline to $24.06 per ounce, but its weekly surge of approximately 5.64% highlights its resilience. The ascent to its August 1st peak was propelled by diminishing U.S. Treasury yields.

Trading Derivatives carries a high level of risk to your capital and you should only trade with money you can afford to lose. Trading Derivatives may not be suitable for all investors, so please ensure that you fully understand the risks involved, and seek independent advice if necessary. A Product Disclosure Statement (PDS) can be obtained either from this website or on request from our offices and should be considered before entering into a transaction with us. Raw Spread accounts offer spreads from 0.0 pips with a commission charge of USD $3.50 per 100k traded. Standard account offer spreads from 1 pips with no additional commission charges. Spreads on CFD indices start at 0.4 points. The information on this site is not directed at residents in any country or jurisdiction where such distribution or use would be contrary to local law or regulation.

Federal Reserve’s Stance and Market Sentiment

Two Federal officials recently acknowledged the uptick in bond market yields, hinting at a potential pause in interest rate hikes. Although the prevailing sentiment at the Fed is inclined towards maintaining the current rates, potential cuts in 2023 aren’t ruled out. Investors are eagerly awaiting insights from both Powell and ECB President Christine Lagarde during the annual Jackson Hole symposium.

Powell’s Anticipated Address

Ever since Powell assumed the Fed Chair position in 2018, his Jackson Hole addresses have been influential, covering a broad spectrum of policy shifts. This year, with the backdrop of waning inflation and a sturdy economy, he might adopt a balanced approach, refraining from giving any explicit directions and maintaining a pragmatic outlook on monetary policy.

Short-Term Forecast

Silver’s recent rally was truncated, pointing towards an aggressive short-covering spate. The rising U.S. dollar, marking its sixth consecutive weekly gain, has impacted silver adversely. Further exacerbating the decline is gold’s retreat and the ebbing holdings of the SPDR Gold Trust. Given these dynamics, the long-term outlook for silver appears bearish.

Technical Analysis

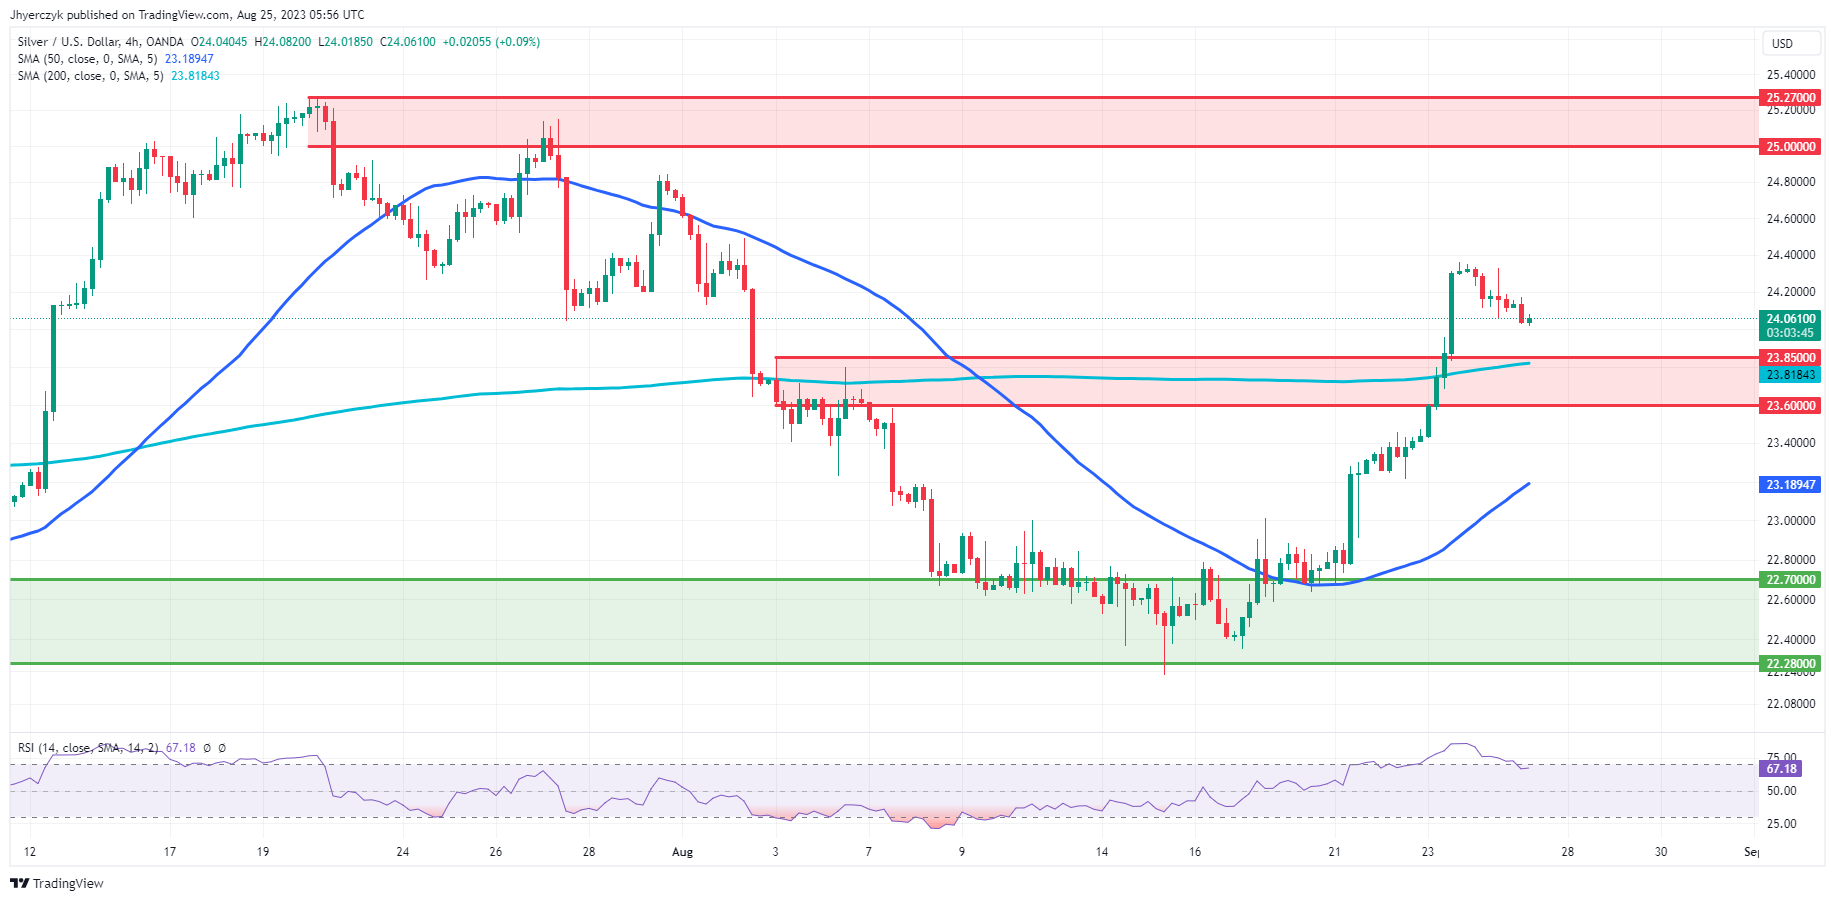
4-Hour Silver (XAG/USD)Silver (XAG/USD) is exhibiting a minor increase, moving from 24.04 to its current 4-hour price of 24.06. Its position relative to the 200-4H moving average at 23.82 suggests bullish momentum, a sentiment echoed by its stand above the 50-4H moving average of 23.19.

The 14-4H RSI sits at 67.10, leaning towards the overbought territory, indicating stronger upward momentum. However, caution is needed as it approaches the main resistance area bracketed between 25.00 and 25.27. With the commodity holding well above its main support zone of 22.70 to 22.28, the current market sentiment for Silver over the short-term can be characterized as bullish.

Gold Prices Forecast: XAU/USD Dips Amid Dollar Rally, Eyes on Powell’s Speech

Gold Prices Forecast: XAU/USD Dips Amid Dollar Rally, Eyes on Powell’s Speech

Overview

Gold (XAU/USD) prices experienced a dip on Friday due to the U.S. dollar’s rally. However, the metal is set for its most robust performance in six weeks, with all eyes on Federal Reserve Chair Jerome Powell’s impending address.

Gold’s Performance and U.S. Treasury Impact

Spot gold (XAU/USD) dropped by 0.2% landing at $1,913.90 per ounce, paralleled by U.S. gold futures declining by 0.3% to $1,942. These movements come after gold showcased a potential weekly gain of about 1.3%. This upward trajectory was influenced by a pullback in U.S. Treasury yields, propelling gold prices to a peak unseen since August 10.

Trading Derivatives carries a high level of risk to your capital and you should only trade with money you can afford to lose. Trading Derivatives may not be suitable for all investors, so please ensure that you fully understand the risks involved, and seek independent advice if necessary. A Product Disclosure Statement (PDS) can be obtained either from this website or on request from our offices and should be considered before entering into a transaction with us. Raw Spread accounts offer spreads from 0.0 pips with a commission charge of USD $3.50 per 100k traded. Standard account offer spreads from 1 pips with no additional commission charges. Spreads on CFD indices start at 0.4 points. The information on this site is not directed at residents in any country or jurisdiction where such distribution or use would be contrary to local law or regulation.

Federal Reserve Stance and Market Anticipation

Thursday’s financial scene featured two Fed officials hinting at their satisfaction with the recent bond market yield surge. They also hinted at a possible stagnation in interest rate hikes. Market participants eagerly await more insights on the rate landscape from speeches by Powell and European Central Bank President Christine Lagarde at the Jackson Hole economic symposium.

Dollar’s Influence and Gold’s Path Ahead

Gold’s momentary breach of the $1,900 mark led to a surge reaching around the $1,920 area. Nonetheless, Powell’s forthcoming remarks harbor the power to either anchor gold back to $1,900 or propel it to the $1,950 mark. Concurrently, the strengthening U.S. dollar, marking its sixth consecutive weekly ascent, is hampering gold’s upward momentum by elevating costs for foreign purchasers.

Short-Term Forecast

With the U.S. dollar’s steady climb and the anticipation surrounding Powell’s speech, the market appears to be in a state of flux. The continuous dip in holdings by SPDR Gold Trust suggests a bearish undertone. However, global economic cues will dictate the final direction.

Technical Analysis

4-Hour Gold (XAU/USD)The Gold (XAU/USD) 4-hour chart shows the current price at 1913.72, just marginally below its previous 4-hour close of 1913.80. This minimal movement indicates relative stability in the short term. The price remains below the 200-4H moving average of 1936.48, suggesting a bearish trend. However, it sits above the 50-4H moving average of 1901.33, indicating recent bullish momentum. The 14-4H RSI stands at 57.36, suggesting a slightly stronger momentum as it’s above the neutral 50 mark.

While Gold is comfortably above its main support range (1893.07 to 1885.79), it’s yet to approach its main resistance area (1946.99 to 1954.88). Overall, the market sentiment appears cautiously bullish.