Natural Gas Price Rebounds After EIA Report

Natural Gas Price Rebounds After EIA Report

On August 24, EIA released its Weekly Natural Gas Storage Report. The report indicated that working gas in storage increased by 18 Bcf from the previous week, compared to analyst consensus of 33 Bcf.

At current levels. stocks are 513 Bcf higher than last year at this time and 268 Bcf above the five-year average of 2,815 Bcf.

In addition to the EIA report, traders will also focus on the developments in Australia. Accoring to recent reports, Woodside Energy reached an agreement with the unions at Australia’s LNG project. The news had a negative impact on the natural gas prices in Europe, which is dependent on LNG imports.

The U.S. market is not directly impacted by the developments in Australia, but a potential strike could have served as a positive catalyst for natural gas prices in the U.S. as consumers would have rushed to buy LNG everywhere they could find it.

Natural gas prices moved back above the $2.50 level after the release of the EIA report as natural gas storage build missed analyst estimates. The current demand for natural gas remains high, but it remains to be seen whether natural gas prices will be able to gain sustainable upside momentum as demand is expected to decline next week.

Australian Dollar Fundamental Bias Breakdown: What Matters the Most for AUD/USD?

Australian Dollar Fundamental Bias Breakdown: What Matters the Most for AUD/USD?

Like other exchange rates, AUD/USD can be influenced by the difference in relative monetary policy, which in this case is between the RBA and the Fed. But that alone is one of the many ingredients that drive the direction of the Aussie. Financial markets are constantly adapting to changing economic environments. That also means the importance of what impacts the Australian Dollar changes over time.

For example, another ingredient that influences AUD/USD is financial market sentiment. That is because Australia finds itself sitting at the front end of the global supply chain, or in other words, the world business cycle. That is why you will often see the exchange rate being influenced by stock markets, especially those related to Emerging Markets.

China is Australia’s largest trading partner, and the latter heavily exports commodities to the former. That also means that understanding the dynamics of commodity prices is another factor that determines Australian Dollar direction. This means three vital ingredients are impacting the exchange rate: relative monetary policy, market sentiment and commodity prices.

With that in mind, this is a special report that focuses on trying to understand how the influence of these variables on the Australian Dollar changed from 2006 up until the middle of 2023. The purpose of the study will be to demonstrate why it is important to adapt fundamental analysis to constantly changing environments. With that in mind, let us cover how this was performed.

How the Study Was Conducted

Rolling regression modeling over a 36-month window in steps was used on the following variables (all of which were expressed in month-over-month form): AUD/USD, the spread between Australian and United States 2-year government bond yields, the MSCI Emerging Markets Index (EEM) and the Bloomberg Commodities Index (BCOM). Doing this created explanatory coefficients that changed in influence over time. It should also be noted that to gauge underlying relationships, a few data outliers were removed. If you are interested, a full analysis of how this was performed was outlined in a Twitter thread.

How Has RBA & Fed Policy Divergence Been Influencing AUD/USD?

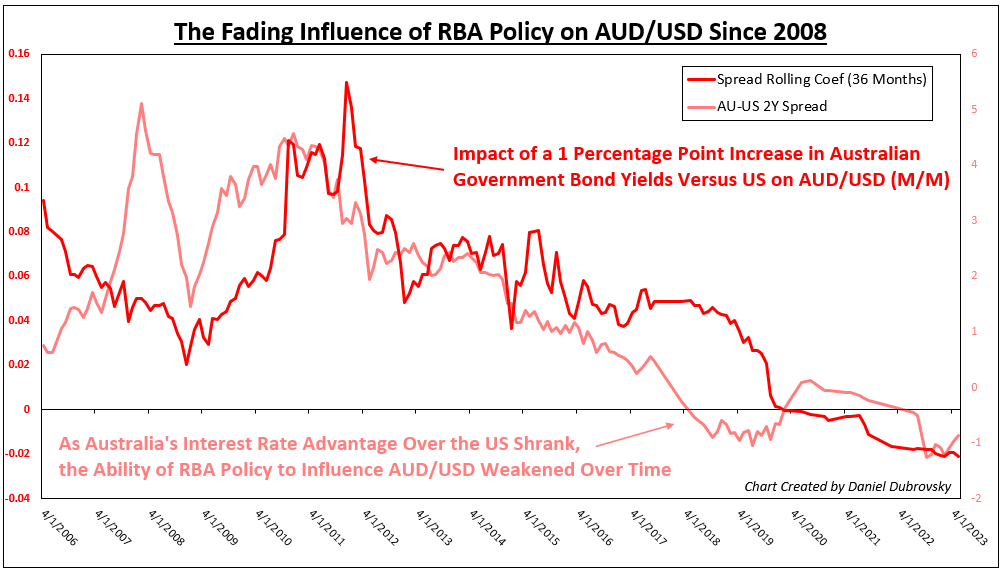
We will start with the importance of relative monetary policy. The dark red line on the chart below is the rolling bond yield spread coefficient and how it changed over time. When this line is rising above 0, that means a 1 percentage point improvement in 2-year bond yield returns in Australia relative to the United States produced an increasingly more positive reaction from AUD/USD (m/m), controlling for EEM and BCOM.

In other words, increasingly higher interest rates in Australia relative to the United States typically means stronger Aussie appreciation. What you may notice is that the dark red line has been falling steadily since 2011 and turned slightly negative around the time of 2020. When the dark red line is at 0, that means there is practically no relationship between AU-US bond yield spreads and AUD/USD.

So, what happened to this relationship? The yield advantage that Australia once had relative to the United States slowly evaporated after the 2008 Financial Crisis (light red line), turning negative heading into Covid and remaining mostly thereafter. In other words, interest rates in the US became higher than in Australia. As this happened, the ability of RBA monetary policy to influence AUD/USD (through setting interest rates) weakened significantly and remained so in the few years after Covid.
How Has RBA & Fed Policy Divergence Been Influencing AUD/USD?

How Has Emerging Market Sentiment Been Impacting AUD/USD?

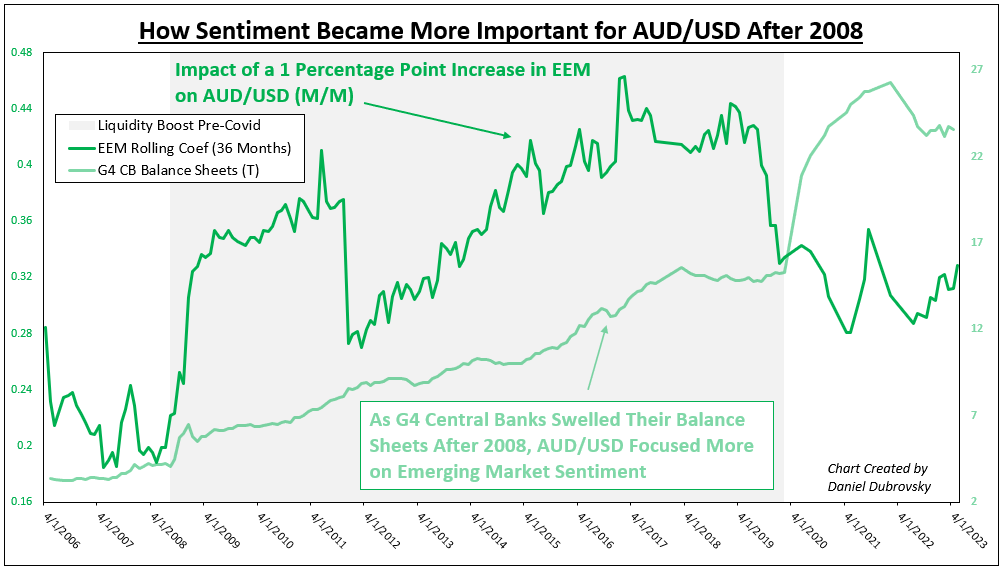
While RBA policy became an increasingly poorer predictor of AUD/USD, Emerging Market sentiment became more important. The dark green line on the chart below is the rolling EEM coefficient. When this line is rising above 0, a 1 percentage point boost in monthly Emerging Market performance shows increasingly better returns in AUD/USD (m/m), controlling for bond yield spreads and BCOM.

I have overlaid this with G4 central bank balance sheet assets. What you can see is that as major central banks injected liquidity into the financial system after the 2008 recession, sentiment became an increasingly better predictor of the Aussie exchange rate. But, you might notice that the dark green line peaked just before Covid and stayed lower thereafter despite the surge in asset holdings.

That would speak to less influence from market sentiment driving AUD/USD in the post-Covid era (although the relationship remained positive). Let us take a closer look at why this happened.
How Has Emerging Market Sentiment Been Impacting AUD/USD?

What About Commodity Prices?

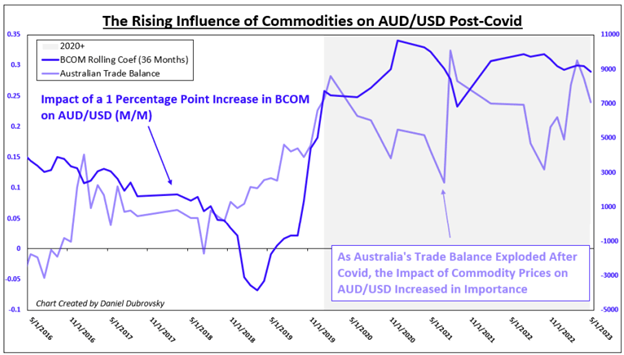
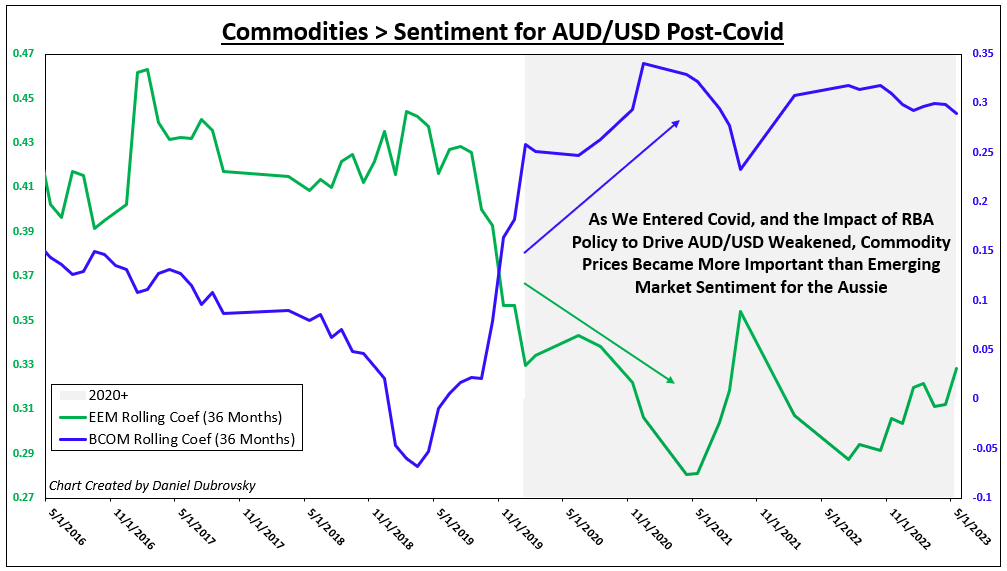
The dark blue line on the chart below is the rolling BCOM coefficient, zoomed in on just 2016+. When this line is rising increasingly above 0, a 1 percentage point boost in the BCOM Index tends to elicit a stronger positive effect on AUD/USD (m/m), controlling for bond yield spreads and EEM. What is very interesting is that the dark blue line surged higher heading into Covid and remained elevated thereafter.

This is as Australia’s trade balance exploded during Covid, meaning the value of the nation’s exports became significantly larger than its imports. In other words, as commodity prices surged, benefiting Australia, AUD/USD paid more attention to the BCOM Index and less so to EEM and AU-US bond yield spreads.
What About Commodity Prices?

A Closer Look at Post-Covid

The last chart below plots the EEM and BCOM coefficients zoomed in on 2016+. The reason this was performed is to visualize the evolution of AUD/USD underlying fundamental dynamics during Covid. Specifically, you can see how entering the pandemic, commodities became a more important factor than Emerging Market sentiment for driving the Aussie exchange rate. This was likely due to the significance of how global trading and surging prices impacted Australia’s economy, and thus the exchange rate.
A Closer Look at Post-Covid

Conclusion and Study Limitations

While it is generally correct that monetary policy is a key driver of exchange rates, the truth is each currency behaves differently because of the unique traits of various economies. For the Australian Dollar, sentiment and commodity prices are other key factors that are involved in this equation.

On top of this, fundamental conditions change, and the influence of certain variables is no different. What this study has demonstrated is that for the Australian Dollar, RBA policy direction became an increasingly poorer predictor of the exchange rate in the aftermath of the 2008 financial crisis.

Instead, factors like market sentiment and commodity prices become better predictors of the exchange rate as underlying fundamental conditions evolved heading into Covid. Perhaps this could reverse course in the future, such as in a scenario where interest rates in Australia begin far outpacing those in the US.

It should be noted that this kind of modeling with rolling regressions creates many outputs, 180 to be exact in this sample. That is 180 different regressions that could each have their quirks or issues, such as creating a coefficient that is not statistically significant.

This was not considered. Instead, a general comprehensive regression of the entire dataset was thoroughly analyzed for potential issues. This included testing for correlation between control variables, residual normality, residual autocorrelation and heteroskedasticity. No major faults were identified.

Big Mistake Leads Technical Trader to Top Three Tools

Big Mistake Leads Technical Trader to Top Three Tools

I’ve been trading the markets for nearly 20 years – There’s been ups and down. Along the way you try to find what style trading works best for your personality and goals. Sometimes this process can be orderly and structured- it wasn’t for me.

The 116 Death Trap

Developing your strategy comes at a cost –often a lot of time, money and frustration. I came to this realization in 2003 as USD/JPY was pulling back from multi-year highs. The ‘116 death trap,’ as I’ve dubbed it, was a seemingly rock solid zone of support. It had caught the lows since 2001 with numerous defenses suggesting a perfect opportunity for me to ‘catch the lows’ and cost average in. Even when price broke, my hope was that every rebound was the low. Not quite. In September of 2003, the death trap began with a drop of more than 12% over the next year, taking USD/JPY to lows not seen since the late-90s. Even a glimmer of hope offered by a multi-week rally in early 2004 reversed. With the pain finally too hard to tolerate, I exited at the lows. So much for cost averaging into a loser. That was my hard lesson learned.

USD/JPY Daily Price Chart

Where did I go wrong?

Well, there was a lot, but for starters, emotions are not your friend. Most of all, my error was not having a plan and not recognizing market conditions. Knowing the style of trading that works best for your personality, risk tolerance and goals is critical and without a plan you are on a ship without a rudder.

Everyone comes to this realization differently. I learned through years of managing market flow for one of the first brokers to offer online retail FX trading. It was through close observations of retail market flow and tracking near-term price-action that Ideveloped three basic principles for my technical trading strategy. It boils down to assigning a value for price, time and momentum.

Price Value – Key reversals, Fibonacci, High/Low-day Closes

It’s all about the levels – identifying support / resistance is a critical part of being able to create actionable trade ideas targeting or countering key levels in price. These lateral levels can be identified using various methods. The three I rely on most are key reversals (outside-day reversals), high and low-day closes and Fibonacci.

The word “Fibonacci” often appears in trading and it is likely that you have already seen or heard of it — for good reason. It is a simple measurement based on the golden ratio of 61.8%. This ratio can be observed everywhere in nature from trees to galaxy formations and is also very relevant to buying and selling behavior in markets. It is a tool you can implement in both trending and range-bound markets to help identify areas of possible support / resistance. We have a lot more in the education section: Fibonacci Application in Financial Markets (dailyfx.com)

Time value indicator – Slope and Trend lines

One discipline I rely heavily on is pitchfork and median-line analysis. The goal of this style of analysis is to identify the slope or gradient of a given market in an attempt to highlight when a price level may be significant. It is this time value that adds another dimension to the lateral levels identified earlier – these “confluence zones” are often points in price and time that can offer major pivots in near-term price-action. Trading into / off these inflection points todayform the basis of my favored technical trade setups.

Momentum value – RSI

The speed of a market can tell The Relative Strength Index (RSI). The RSI is an oscillator that is used as a measure of momentum — the speed of the recent price movement in either direction. While all oscillators are inherently backward looking, they can still be of value when you are trying to asses when the market maybe overextended in either the overbought or oversold conditions. The ability to assess the inertia of a given market is critical for near-term swing and trend trading as it offers a window into the possible longevity and strength of a given move as well as ideas on when it may expire.

Bottom line

Having a multi-faceted approach that takes into account price value, momentum value and time value could help steer you not only to possible opportunities, but also help you avoid failure. Knowing the condition of the market using price, time and momentum has been a major philosophy of my trading.


De-risking ahead of Fed Chair’s Jackson Hole speech: Brent crude, AUD/JPY, EUR/USD

De-risking ahead of Fed Chair’s Jackson Hole speech: Brent crude, AUD/JPY, EUR/USD

Market Recap

Initial gains in Wall Street reversed sharply overnight, with Nvidia’s stellar results hit with a sell-the-news market reaction, as market participants de-risk ahead of Fed Chair Jerome Powell’s Jackson Hole speech later tonight. The VIX was up 7.6% as a reflection of increased hedging activities, while market sentiments (from the CNN Fear and Greed Index) have fallen back into ‘fear’ territory for the first time since March this year.

No doubt the Fed’s policy outlook will be the key driving force for markets ahead. With fresh updates on US inflation and labour market data after the previous FOMC meeting, focus will be on what factors the Fed Chair will have his attention on. Maintaining his emphasis on the Fed’s data-dependent stance and bringing up progress in US inflation may potentially be perceived as a less hawkish view, but on the other hand, highlighting the risks of a reacceleration in demand and the need for high-for-longer rates will likely be a more hawkish message.

For now, expectations remain firmly priced for rates to be kept on hold in September, but the probability for a November hike has increased to the current 41%, from 32% just a month ago. Treasury yields firmed overnight, following an earlier sell-off on Wednesday, while the US dollar is back at its two-month high, as some positioning for a hawkish takeaway gets underway.

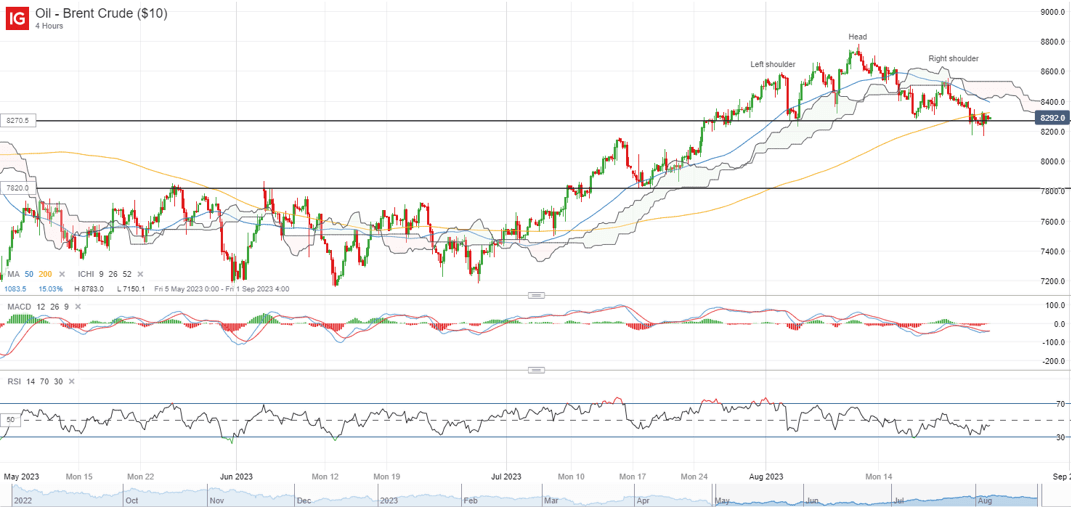
Perhaps one to watch may be Brent crude prices, which saw dip buyers attempting to defend the neckline of a head-and-shoulder formation (four-hour chart), with the formation of a series of long-legged pin bars overnight. Greater conviction may have to come from a move back above its shoulders at the 85.40 level, where the upper edge of its Ichimoku cloud resistance (four-hour) may have to be overcome as well. On the other hand, price projection from any breakdown of the head-and-shoulder neckline at the 82.70 level could leave the 78.20 level on watch next.

Asia Open

Asian stocks look set for a negative open, with Nikkei -1.55%, ASX -1.05% and KOSPI -0.81% at the time of writing. The rush for market participants to further de-risk ahead of Fed Chair Jerome Powell’s comments has spilled over to the Asia session, given that the previous Fed minutes did not reflect the level of unity among policymakers for a rate pause as what many have expected.

The Nasdaq Golden Dragon China Index is down 0.7% overnight, which may challenge the rebound in Chinese equities from oversold technical levels in the earlier session. The formation of lower highs and lows in the Hang Seng Index year-to-date, along with its weekly RSI failing to sustain above the 50 level for the third time this year may still call for more wait-and-see.

On the economic calendar, this morning saw the release of Tokyo’s August Consumer Price Index (CPI) data, with moderating headline inflation (2.9% versus previous 3.2%) but a further uptick in the ‘core-core’ aspect (2.6% versus previous 2.5%) providing a mixed view overall. That did not trigger too much of a reaction in the USD/JPY, with the pair taking its lead from US dollar strength on mounting hawkish Fed views.

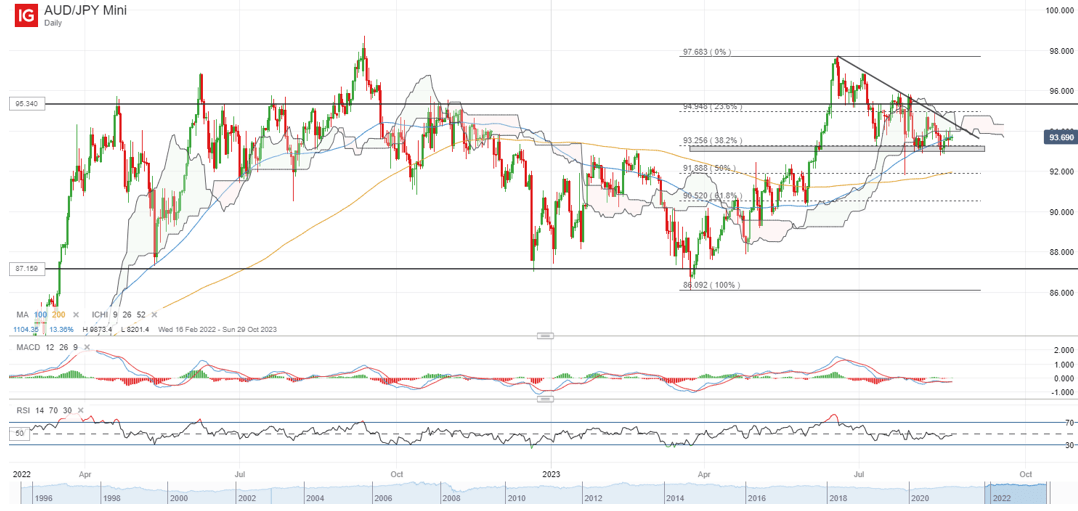
Aside, the AUD/JPY seems to be trading on a near-term descending triangle, with the formation of lower highs and the triangle base around the 93.00 level. Arguably, the recent retracement to a 38.2% Fibonacci level from its March 2023 bottom to June 2023 peak may also leave some hopes on a broader bullish pennant formation. The 93.00 level may be an immediate support level to hold, failing which could pave the way to retest the 91.80 level next, where strong dip-buying off a 50% Fibonacci retracement level was sighted on 28 July 2023. On the upside, the downward trendline resistance will be a key line to overcome, with greater conviction probably having to come from a move back above the 95.34 level.

On the watchlist: 200-day MA for EUR/USD in the crosshair

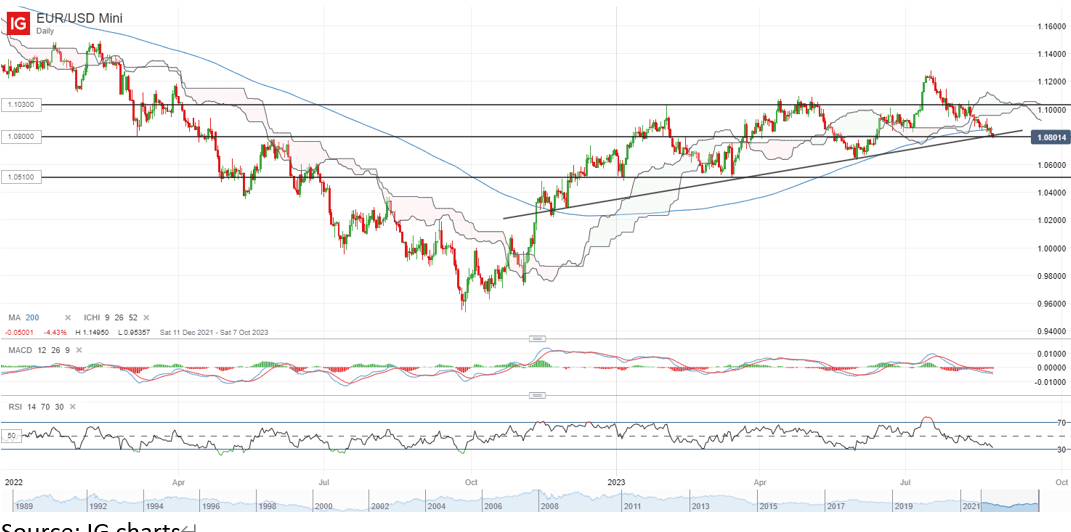
Strength in the US dollar overnight has kept the EUR/USD under pressure, with the pair pushing to a new two-month low and leaving its 200-day MA under threat of a breakdown. Its weekly RSI is also back to retest the key 50 level for the third time this year, with any failure to defend the MA-line over the coming days likely to leave sellers in greater control.

For now, the 1.080 level seems like an immediate key support to hold. Any subsequent move below the 1.080 level may potentially pave the way towards the 1.063 level next, which will also mark the first time where the pair trades below its 200-day MA since November 2022.

How Do the US Dollar, Gold, S&P 500, and More Trade at the Onset of Recessions?

How Do the US Dollar, Gold, S&P 500, and More Trade at the Onset of Recessions?

The onset of recessions in the United States typically results in reoccurring financial market trading patterns. While not all of them will be the same, we can look back and see how key assets have performed. This is a special report that analyzes how the US Dollar, gold, S&P 500, Australian Dollar and 10-year Treasury yield traded during the first 3 months of economic downturns.

The length and severity of each recession will vary. This means the usual reaction you might expect from an asset during the onset of a downturn will not always repeat perfectly. For example, during the 2000s housing crash, the US entered a recession in Q4 of 2007. While the stock market declined during these 3 months as one might have expected, peak market volatility occurred much later towards the end of 2008.

Before diving into this topic, I need to set the ground rules, starting with the definition of a recession. In this study, I will be using a GDP-based recession indicator, which attempts to assign dates to downturns based on a mathematical model. This is as opposed to the NBER’s Business Cycle Dating Committee playbook, which can at times be subjective. You can learn more about the indicator I am referencing here.

This definition is also different from the widely referenced two consecutive quarters of negative growth, which is unofficial and often too simplistic, failing to capture other economic trends. For example, in 2022, the economy experienced 2 quarters of negative growth in Q1 and Q2. But, the labor market outperformed.

For analyzing the US and Australian Dollars, I will be using a correlation-weighted currency index instead of an exchange rate. This helps us capture the broader direction of a currency against the world rather than any individual unit. Otherwise, comparing AUD/USD with the DXY Dollar Index runs the risk of placing too much emphasis on the greenback.

Average Snapshot

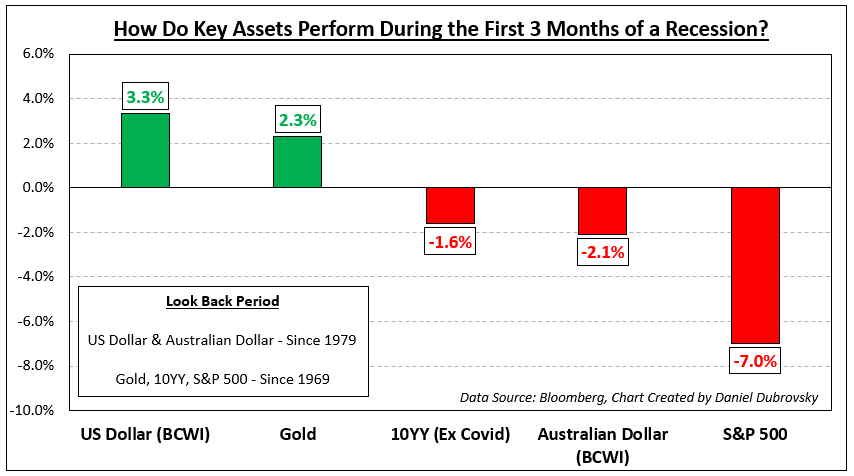
The chart below is a snapshot of how these assets performed during the onset of recessions ordered from best performing to the worst. The sequence is as follows: US Dollar, gold, 10-year Treasury yield, Australian Dollar and S&P 500. The availability of currency data meant I could only look back to 1979. For the rest of the assets, I was able to look back to 1969. The remainder of this article breaks down the individual performance beginning with the US Dollar.

Average Snapshot

US Dollar

Looking back to recessions since 1979, which adds up to 6, the Bloomberg Correlation-Weighted US Dollar Index rose 3.3% on average in the first 3 months of economic downturns. That is not to say each time it climbed. The up/down ratio is 50%. But, as you can see in the chart below, when the dollar rallies, it tends to do so strongly. During periods when the currency fell, the downside reaction was much weaker. This should come as little surprise. In the currency spectrum, the US Dollar functions as a haven given its status as the world’s reserve currency.

US Dollar

Gold

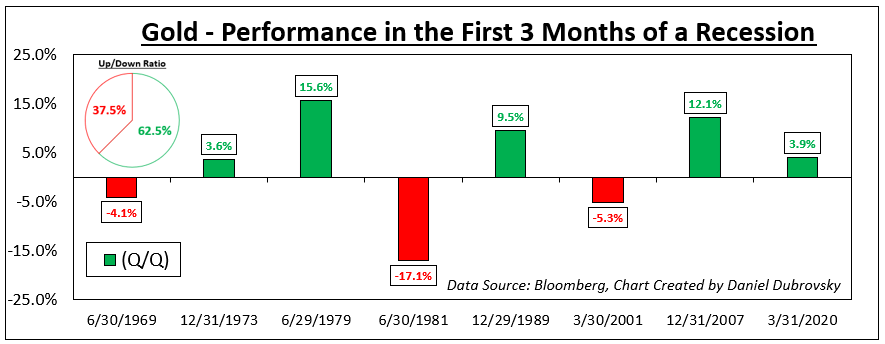
Meanwhile, gold also tends to perform decently at the onset of recessions going back to 1969. On average, the yellow metal returned +2.3% with a win/loss ratio of about 62.5%. Like the US Dollar, the wins were stronger than your average losses, excluding the early 1980s recession (-17.1%). Does this make gold a haven? Remember that gold is not as liquid as a currency. XAU/USD tends to function as an anti-fiat instrument. When the return on cash dwindles, which is what usually happens during recessions, gold becomes relatively more attractive and vice versa.

Gold

10-Year Treasury Yield

From this point forward, we are moving on to assets that underperform. Since 1969, the 10-year Treasury yield has declined by -1.6% on average during the onset of recessions (excluding Covid, which was a major negative outlier that skews the mean). Factoring in Covid though, the up/down ratio is about 29%. Bonds tend to receive a high amount of demand during economic uncertainty due to perceived safety, pushing up the price at the cost of yields.

10-Year Treasury Yield

Australian Dollar

Looking at the Bloomberg Correlation-Weighted Australian Dollar Index, the Aussie returned on average -2.1% during the first 3 months of a US recession since 1979. AUD also has a depressingly low win/loss rate of 16.7%. In currency markets, the Aussie is known for its sentiment-linked status, often closely following equities. Australia’s economy is closely tied to the global business cycle due to commodity exports, making it important to watch growth in the United States. When the latter sneezes, the world can catch a cold, driving up market volatility and negatively impacting the Australian Dollar.

Australian Dollar

S&P 500

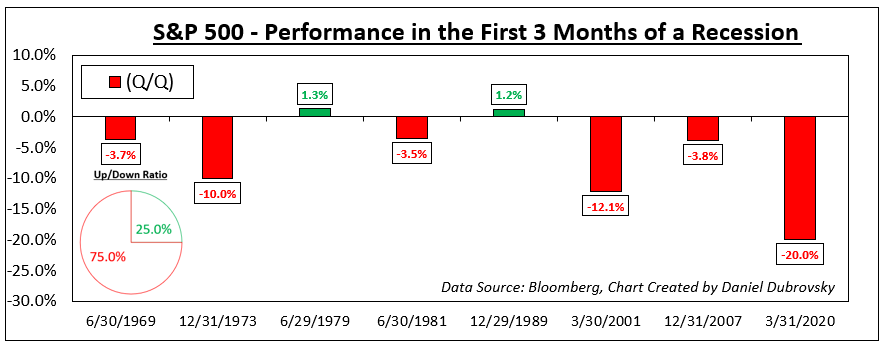
Finally, we arrive at the S&P 500, which is one of the key US benchmark stock indices. Unsurprisingly, the S&P 500 has returned on average -7.0% at the onset of recessions since 1969. But, unlike the Australian Dollar, the win/loss ratio is slightly better at 25%. This is unsurprising. Depending on the severity of the recession, uncertainty plays a key role in how much the stock market declines and how fast it does.

Recessions raise the risk that companies can go out of business and/or lay off workers, resulting in stock market crashes. Often, a bubble popping can lead to a recession, such as the dotcom bust in the early 2000s and the housing market leading in 2008. There are also leading indicators of a recession that you might be interested to learn about.

S&P 500

Natural Gas Prices Forecast: Weather and Storage Reports Sway Today’s Trade

Natural Gas Prices Forecast: Weather and Storage Reports Sway Today’s Trade

U.S. Natural Gas Prices in Flux Amid Weather Predictions and Storage Reports

U.S. natural gas prices have dwindled for three consecutive sessions, reaching their most modest since mid-June, with weather patterns driving the market sentiment. While the ongoing heatwave across the nation has been factored into the prices for some time, predictions hint at milder temperatures in the upcoming week.

Weather’s Role in Pricing

Current scorching temperatures sweeping the nation are set to continue with highs ranging between mid-90s to 100s, signaling strong national demand. However, from August 27-31, the U.S. will experience slightly above-average temperatures, with hotter conditions making a comeback in early September. The imminent break in the ongoing heat, particularly in the Great Lakes, Ohio Valley, and Northeast regions, might dampen the high demand seen so far.

Trading Derivatives carries a high level of risk to your capital and you should only trade with money you can afford to lose. Trading Derivatives may not be suitable for all investors, so please ensure that you fully understand the risks involved, and seek independent advice if necessary. A Product Disclosure Statement (PDS) can be obtained either from this website or on request from our offices and should be considered before entering into a transaction with us. Raw Spread accounts offer spreads from 0.0 pips with a commission charge of USD $3.50 per 100k traded. Standard account offer spreads from 1 pips with no additional commission charges. Spreads on CFD indices start at 0.4 points. The information on this site is not directed at residents in any country or jurisdiction where such distribution or use would be contrary to local law or regulation.

Market’s Response to Storage Reports

Anticipation is building for today’s Energy Information Administration (EIA) natural gas storage report. Market participants forecast a 33 Bcf build, marginally below last week’s 35 Bcf, but significantly lesser than the 54 Bcf seen the same time last year. The five-year average around this period stands at 49 Bcf. In terms of total natural gas in storage, expectations are set at 3,098, a jump from 3,065 in the prior week.

European Market Dynamics

European gas prices observed a drop of roughly 15% at the Dutch Title Transfer Facility benchmark for September. This plunge to around $12 per mmBtu was influenced by robust European gas inventories, nuclear reactor restarts in France, and optimism that Australia might sidestep potential strikes at LNG plants.

Supply and Demand Outlook: Bullish or Bearish?

In the light of the recent dip in prices, the outlook tilts bearishly. Gas production in the U.S. Lower 48 witnessed a slight reduction in August. Despite a predicted rise in demand forecasts, including exports, the upcoming week’s outlook remains uncertain. Notably, gas flows to key U.S. LNG export plants have seen a decline due to ongoing maintenance activities.

To sum up, while weather patterns undeniably influence gas prices, the downward shift cannot solely be attributed to them. Factors such as storage reports and international market dynamics play a crucial role. Given these variables, traders and investors should tread cautiously and keep a close eye on these markers to discern the market’s potential trajectory.

Technical Analysis

4-Hour Natural GasThe current price of 2.440 is below both the 200-4H moving average of 2.652 and the 50-4H moving average of 2.618, suggesting a bearish momentum. This sentiment is further confirmed by the 14-4H RSI of 27.15, indicating the commodity is oversold.

In terms of support and resistance, the price is hovering above the main support area (2.260 to 2.136) but is well below the main resistance area (3.027 to 3.091). With the price movement confined between these zones and the technical indicators leaning bearish, the current market sentiment for Natural Gas on the 4-hour chart is bearish.

Bitcoin Prices Forecast: How BTC Reacts to SEC Moves and US Economic Indicators

Bitcoin Prices Forecast: How BTC Reacts to SEC Moves and US Economic Indicators

Wednesday Overview

On Wednesday, bitcoin (BTC) gained 1.35%. Reversing a 0.37% loss from Tuesday, BTC ended the session at $26,501. Significantly, BTC ended an eight-day losing streak.

Investor Sentiment Toward Fed Monetary Policy Delivers Brief Distraction

BTC and the broader market continued to struggle going into the Wednesday session. Market sentiment toward the SEC and the likelihood of the SEC approving the pending BTC-Spot ETF applications weighed on buyer appetite.

Trading Derivatives carries a high level of risk to your capital and you should only trade with money you can afford to lose. Trading Derivatives may not be suitable for all investors, so please ensure that you fully understand the risks involved, and seek independent advice if necessary. A Product Disclosure Statement (PDS) can be obtained either from this website or on request from our offices and should be considered before entering into a transaction with us. Raw Spread accounts offer spreads from 0.0 pips with a commission charge of USD $3.50 per 100k traded. Standard account offer spreads from 1 pips with no additional commission charges. Spreads on CFD indices start at 0.4 points. The information on this site is not directed at residents in any country or jurisdiction where such distribution or use would be contrary to local law or regulation.

We expect further market reaction to BTC-Spot ETF-related news, with the SEC likely to open other BTC-Spot ETF applications for public comment. Blackrock (BLK) and Fidelity are among the big names with applications awaiting SEC review.

There were no crypto events to deliver the morning reversal to a session low of $25,922. Market sentiment toward the SEC and the outlook for the BTC-Spot ETFs continued to weigh on buyer appetite.

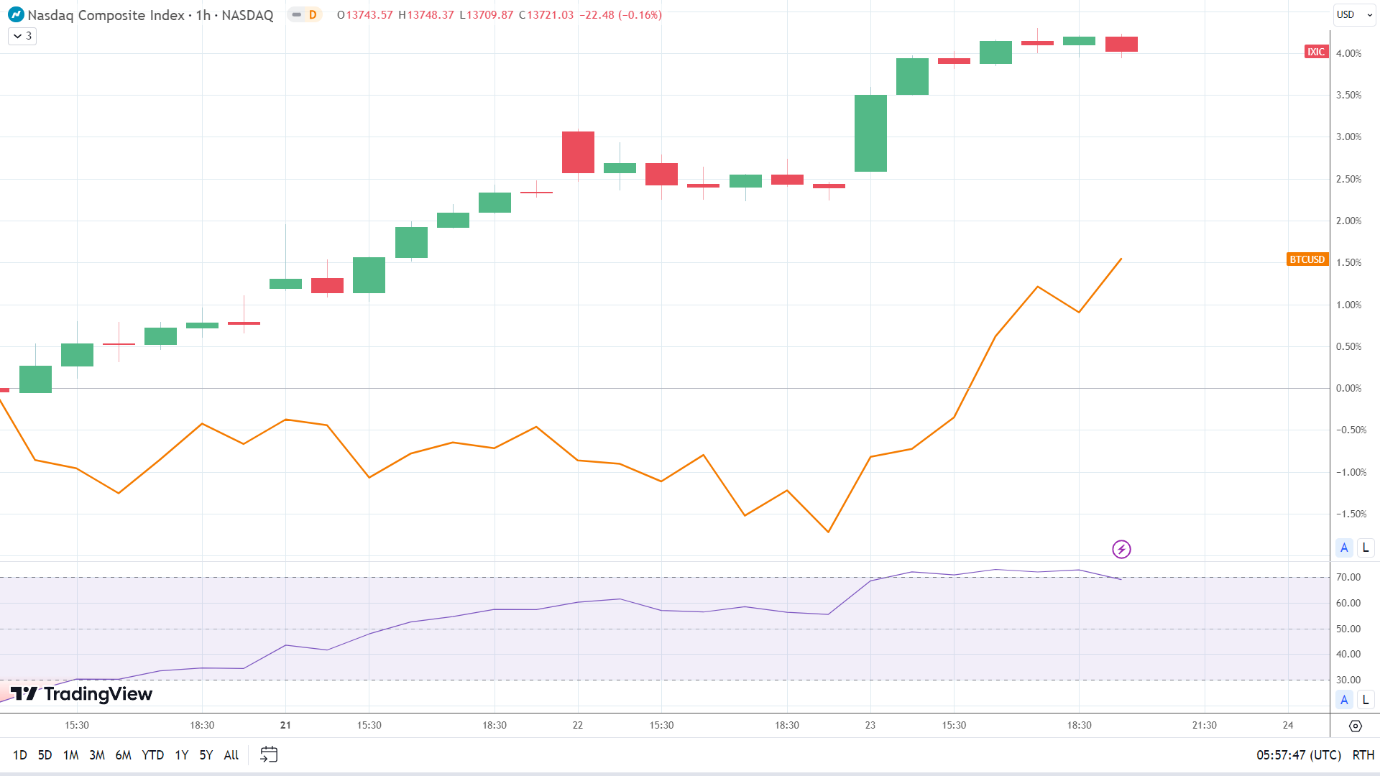
However, falling US Treasury yields provided afternoon support. Investors reacted to the worse-than-expected US private sector PMIs. BTC and the broader market tracked the NASDAQ Composite Index throughout the US session.

NASDAQ correlation tightens on Fed monetary policy bets.
NASDAQ Correlation 240823 Daily Chart

The Thursday Session: The SEC and the Fed Are in the Spotlight

Investors should continue tracking SEC updates on the pending BTC-Spot ETF applications. We expect investors to respond negatively to the news of the SEC opening up more applications to the public for comment.

However, SEC v Ripple, SEC v Binance, and SEC v Coinbase Coinbase (COIN) case-related news also needs consideration. While the SEC considers BTC a commodity, BTC is not immune from SEC activity within the digital asset space.

Beyond the digital asset space, investors need to monitor Fed chatter. Following the reaction to US PMI numbers, we anticipate price sensitivity to hawkish commentary relating to the Fed interest rate path.

Bitcoin (BTC) Price Actions

Daily Chart

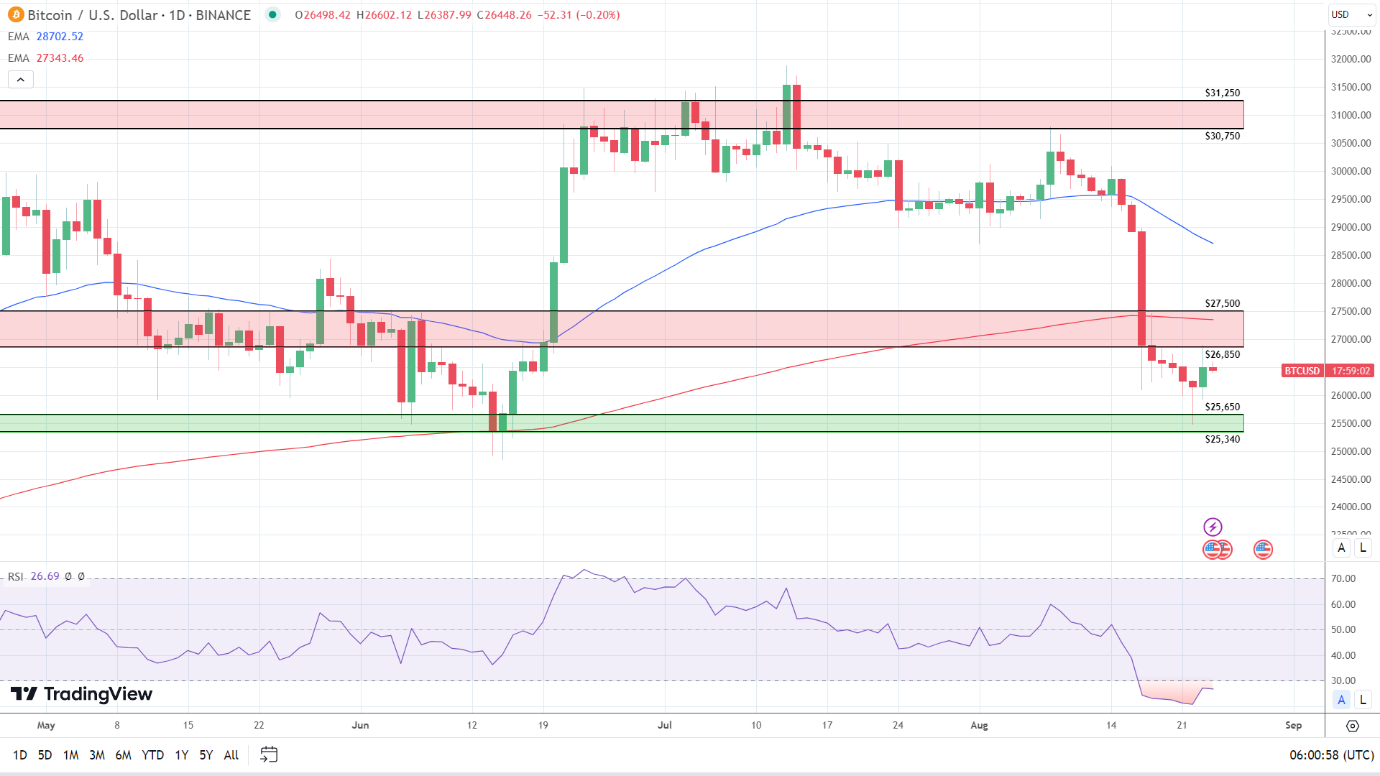
The Daily Chart showed BTC below the $26,850 – $27,500 resistance band. Despite the gains on Wednesday, an eight-day losing streak continued to leave BTC below the 50-day and 200-day EMAs, sending bearish near and longer-term price signals.

Looking at the 14-Daily RSI, the 26.69 continued to show BTC in oversold territory. The RSI aligns with the EMAs supporting a return to sub-$26,000 to bring the $25,650 – $25,340 support band into play. However, a BTC return to $26,500 would signal a move through the lower level of the $26,850 – $27,500 resistance band. A move through the 200-day EMA would signal a shift in investor sentiment.

BTC Daily Chart sends bearish price signals.
BTCUSD 240823 Daily Chart

4-Hourly Chart

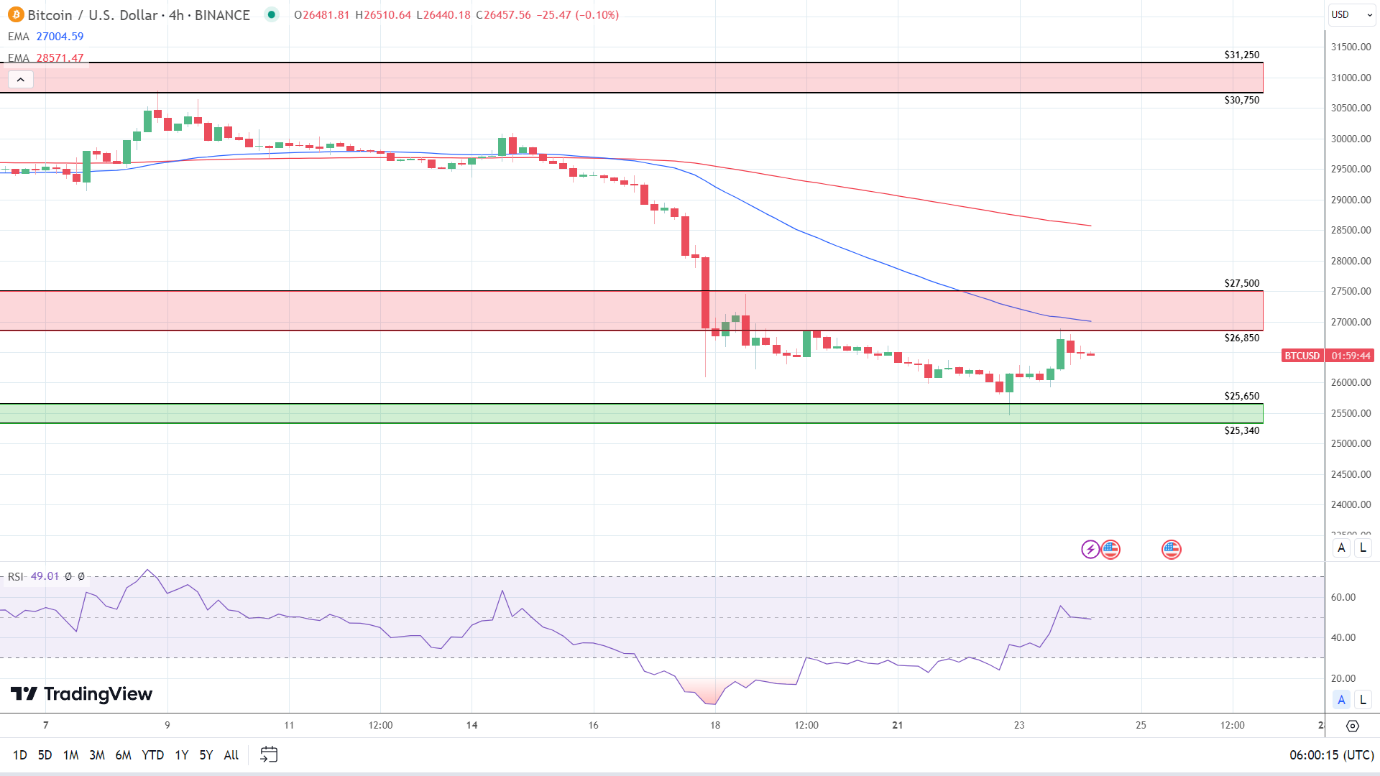
Looking at the 4-Hourly Chart, BTC hovers below the $26,850 – $27,500 resistance band. BTC remains below the 50-day and 200-day EMAs, reaffirming bearish near-term price signals.

The 14-4H RSI reading of 49.01 reflects a moderately bearish sentiment, with selling pressure outweighing buying pressure. Significantly, the RSI aligns with the EMAs, with sub-$26,000 and the $25,650 – $25,340 support band in play. However, a move through the lower level of the $26,850 – $27,500 resistance band would support a breakout from the 50-day EMA to target the upper level of the $26,850 – $27,500 resistance band.

4-Hourly Chart affirms bearish price signals.
BTCUSD 240823 4 Hourly Chart
GBP to USD Forecast: UK Pound Reacts to PMI Slide; News from Jackson Hole Eyed.

GBP to USD Forecast: UK Pound Reacts to PMI Slide; News from Jackson Hole Eyed.

Wednesday Overview

On Wednesday, the GBP to USD slipped by 0.07% to wrap up the day at $1.27221. The GBP/USD rose to an early high of $1.27646 before sliding to a low of $1.26144. However, easing bets on a Fed rate hike supported a US session recovery.

Bears Target a Three-Day Losing Streak

There are no UK economic indicators for investors to consider today. The lack of UK economic indicators will leave the GBP to USD in the hands of market risk sentiment and bets on BoE interest rate hikes.

Trading Derivatives carries a high level of risk to your capital and you should only trade with money you can afford to lose. Trading Derivatives may not be suitable for all investors, so please ensure that you fully understand the risks involved, and seek independent advice if necessary. A Product Disclosure Statement (PDS) can be obtained either from this website or on request from our offices and should be considered before entering into a transaction with us. Raw Spread accounts offer spreads from 0.0 pips with a commission charge of USD $3.50 per 100k traded. Standard account offer spreads from 1 pips with no additional commission charges. Spreads on CFD indices start at 0.4 points. The information on this site is not directed at residents in any country or jurisdiction where such distribution or use would be contrary to local law or regulation.

UK private sector PMI numbers for August increased the chance of a UK economic recession. The latest numbers also eased bets on two BoE interest rate hikes before hitting the brakes.

US private sector PMI numbers provided the GBP/USD with late support on Wednesday. However, the weaker numbers will also raise concerns over the US economy, with recessionary fears likely to weigh on the GBP/USD.

No Bank of England Monetary Policy Committee Members are on the calendar to speak today. Following the August PMI numbers, investors should monitor the news wires for BoE member commentary. Dovish comments in response to the latest retail sales and PMI numbers would be bearish for the GBP/USD pair.

US Labor Market and Durable Goods Orders in Focus

US core durable goods orders and jobless claims are in focus today. Following the disappointment of the private sector PMIs, a spike in initial jobless claims would be bullish for the GBP/USD pairing.

Core durable goods orders will also influence as investors closely monitor the economic indicators. Another weak set of economic indicators will raise the chances of a US economic recession and reduce the expectation of a September Fed rate hike.

However, sentiment toward the latest economic indicators suggest a GBP/USD retreat. US service sector activity continued to expand while the UK services sector contracted for the first time since January.

The service sector contributes more than 70% to the UK and US economies, increasing GBP/USD sensitivity to the numbers.

Away from the numbers, investors should monitor Fed chatter from the Jackson Hole Symposium. The latest PMI numbers will likely give the Fed doves a stronger voice. Hawkish Fed commentary would catch investors by surprise and sink the GBP/USD.

GBP to USD Price Action

Weekly Chart sends mixed price signals.
GBPUSD 240823 Weekly ChartThe Daily Chart showed the GBP to USD below the $1.2785 – $1.2862 resistance band. Looking at the EMAs, the GBP to USD sat below the 50-day EMA while holding above the 200-day EMA, sending bearish near-term but bullish longer-term price signals.

Looking at the 14-Daily RSI, 45.59 reflects a bearish sentiment. The RSI signals a return to sub-$1.2650 to bring the $1.2520 – $1.2440 support band into view. However, a move through the 50-day EMA would give the bull a run at the lower level of the $1.2785 – $1.2862 resistance band to target $1.2850.

GBP to USD Daily Chart sends bearish near-term price signals.
GBPUSD 240823 Daily Chart

4-Hourly Chart

Looking at the 4-Hourly Chart, the GBP to USD sits below the $1.2785 – $1.2862 resistance band. After the bearish Wednesday session, the GBP to USD remains below the 50-day and 200-day EMAs, sending bearish near and longer-term price signals.

The 14-4H RSI reading of 48.35 reflects bearish sentiment, with selling pressure outweighing buying pressure. Significantly, the RSI aligns with the EMAs, signaling a return to $1.2650. However, a GBP/USD move through the 50-day EMA would give the bulls a run at the 200-day EMA and the lower level of the $1.2785 – $1.2862 resistance band.

GBP to USD Daily Chart sends bearish price signals.
GBPUSD 240823 4 Hourly Chart
EUR/USD Prices Forecast: ECB Forced to Balance Inflation Amid Business Contraction

EUR/USD Prices Forecast: ECB Forced to Balance Inflation Amid Business Contraction

Euro Holds Steady Amid Economic Uncertainty

The Euro is displaying resilience against the U.S. Dollar on Thursday, following a turbulent session influenced by mixed global economic indicators. Early losses on Wednesday were recouped as disappointing U.S. PMI data caused a dip in U.S. yields, which in turn pressured the dollar.

The EUR/USD was recorded at 1.0863 as of 08:29 GMT, showing no change from its previous value.

Trading Derivatives carries a high level of risk to your capital and you should only trade with money you can afford to lose. Trading Derivatives may not be suitable for all investors, so please ensure that you fully understand the risks involved, and seek independent advice if necessary. A Product Disclosure Statement (PDS) can be obtained either from this website or on request from our offices and should be considered before entering into a transaction with us. Raw Spread accounts offer spreads from 0.0 pips with a commission charge of USD $3.50 per 100k traded. Standard account offer spreads from 1 pips with no additional commission charges. Spreads on CFD indices start at 0.4 points. The information on this site is not directed at residents in any country or jurisdiction where such distribution or use would be contrary to local law or regulation.

Mixed Economic Signals: Europe and U.S.

Overnight surveys reveal a concerning picture in Europe; both manufacturing and service sectors are shrinking. German business activity, a cornerstone of the European economy, contracted at its fastest pace in over three years this August. Across the Atlantic, U.S. business activity also waned, marking its weakest growth since February, which hints at a potential economic slowdown.

Rate Hike Prospects: Dimming Outlook

Expectations for a September interest rate hike by the European Central Bank (ECB) have been severely curtailed. Money market futures indicate just a 40% probability for a rate increase next month, plummeting from a 60% chance priced in before the release of disappointing business activity data. The Federal Reserve’s Jackson Hole symposium is also highly anticipated for its impact on U.S. rates.

ECB’s Tightrope Walk: Inflation vs. Growth

The European Central Bank finds itself in a precarious situation, caught between quelling high inflation and avoiding an economic recession. A majority of economists polled by Reuters expect the ECB to pause interest rate hikes this September. Nevertheless, the possibility of a year-end rate increase still looms, underscoring the ECB’s aggressive monetary stance.

Short-Term Forecast: Cautiously Bearish

With dwindling prospects for an immediate rate hike and ongoing contraction in business activity, the short-term outlook for the Euro appears bearishly skewed. A pause in ECB rate hikes this September seems more likely than not, although this should not be mistaken as a sign that inflation has reached desirable levels.

In sum, traders and policymakers alike find themselves navigating through uncertain economic waters, making the next moves of central banks critically important to watch.

Technical Analysis

4-Hour EUR/USDThe current EUR/USD price of 1.0859 shows a slight decrease from its previous 4-hour price of 1.0870. Analyzing the moving averages, it’s trading below both the 200-4H moving average of 1.1017 and the 50-4H moving average of 1.0886, suggesting a bearish trend. The 14-4H RSI at 46.54 is below the neutral 50, indicating weaker momentum.

The price is hovering just above the main support area (1.0834 to 1.0804), but is significantly below the main resistance area (1.1042 to 1.1065). Based on these technical indicators, the EUR/USD market sentiment appears to be bearish in the short term.

Silver Prices Forecast: XAG/USD Treads Carefully Ahead of Jackson Hole Insights

Silver Prices Forecast: XAG/USD Treads Carefully Ahead of Jackson Hole Insights

Jackson Hole Symposium Awaits: Silver on the Edge

Despite weaker Treasury yields, a subdued U.S. dollar, and rising gold prices, silver (XAG/USD) prices took a step back on Thursday. Market participants are currently adopting a wait-and-see approach, with many eyeing the Jackson Hole meeting for insights on interest rates, resulting in profit-taking and position-adjusting.

Federal Reserve’s Rate Anticipation

The Federal Reserve’s annual symposium in Jackson Hole, Wyoming, remains the financial world’s focus. Chair Jerome Powell’s upcoming address is expected to shed light on future interest rate decisions, a crucial factor considering silver’s attractiveness tends to wane with rising U.S. rates.

Trading Derivatives carries a high level of risk to your capital and you should only trade with money you can afford to lose. Trading Derivatives may not be suitable for all investors, so please ensure that you fully understand the risks involved, and seek independent advice if necessary. A Product Disclosure Statement (PDS) can be obtained either from this website or on request from our offices and should be considered before entering into a transaction with us. Raw Spread accounts offer spreads from 0.0 pips with a commission charge of USD $3.50 per 100k traded. Standard account offer spreads from 1 pips with no additional commission charges. Spreads on CFD indices start at 0.4 points. The information on this site is not directed at residents in any country or jurisdiction where such distribution or use would be contrary to local law or regulation.

Currency Dynamics and Economic Indicators

The dollar’s current dip reflects global economic concerns and dampened interest rate expectations, pushing down U.S. yields. This comes as U.S. business activity hints at stagnation and Europe’s central bank faces challenges, with traders predicting halted rate hikes. Meanwhile, the UK’s repeated rate boosts signal a potential slowdown in economic momentum.

Europe’s Economic Stance

The European Central Bank’s (ECB) anticipated decision to delay rate hikes is rooted in contracting business activities, revealing growing economic issues. The Bank of England’s continuous rate hikes to combat inflation further emphasize the looming economic concerns.

Short-term Silver Outlook

With traders and investors awaiting the Jackson Hole Symposium’s outcomes, current indicators suggest a halt in rate hikes for the U.S. and Europe. Consequently, while U.S. Treasury yields may decline, silver’s market displays bullish signs for the immediate future.

Technical Analysis

4-Hour Silver (XAG/USD)Based on the 4-hour chart data for Silver (XAG/USD), the current price of 24.14 sits above both the 200-4H moving average of 23.79 and the 50-4H moving average of 23.01, suggesting a bullish trend. The 14-4H RSI value of 74.42 indicates that the commodity is currently overbought, which might be a cautionary signal for potential price retracement.

The current price level is comfortably seated above the main support area between 22.70 to 22.28, but slightly below the main resistance area of 25.00 to 25.27. Overall, the market sentiment for Silver in the short term appears to be bullish, although the overbought RSI value suggests caution.