Nvidia Shares Jump 9% after Posting Stellar Q2 Earnings, Signaling Bullish Q3

Nvidia Shares Jump 9% after Posting Stellar Q2 Earnings, Signaling Bullish Q3

Highlights

  • Nvidia Posts Stellar Q2 Earnings and Signals Bullish Q3
  • Data Center and Gaming Propel Nvidia’s Remarkable Earnings
  • Nvidia’s Impressive Earnings Surge; $25B Share Buyback Announced

Nvidia Shines with Promising Q2 Results and Q3 Forecast

Nvidia, the prominent chipmaker, has delivered results that surpassed market estimates, sparking a notable 9% surge in its shares in extended trading on Wednesday.

Performance Breakdown

  • Earnings: Nvidia reported an adjusted earnings of $2.70 per share, beating the Refinitiv’s expectation of $2.09.
  • Revenue: The company’s revenue stood at a staggering $13.51 billion, outdoing the Refinitiv’s forecast of $11.22 billion.

Data Center Dominance

Central to Nvidia’s stellar performance is its data center segment, particularly fueled by the demand for AI chips like A100 and H100 – vital for AI applications including ChatGPT. This segment alone garnered a revenue of $10.32 billion, marking an impressive annual growth of 171%.

Gaming Growth

On the other hand, Nvidia’s gaming business, though now relatively smaller, witnessed a commendable rise of 22% on an annual basis, resulting in a revenue of $2.49 billion. When set against expectations, the numbers are intriguing:

  • Gaming revenue: $2.49 billion against the anticipated $2.38 billion.
  • Datacenter revenue: $10.32 billion, surpassing the projected $8.03 billion.

Outlook and Buyback Announcement

Nvidia is not just optimistic about the present; its future projections are bullish too. The firm expects a Q3 revenue of approximately $16 billion, a figure considerably higher than Refinitiv’s forecast of $12.61 billion. This implies a monumental annual sales growth of 170%. Additionally, Nvidia’s board has greenlit a massive $25 billion in share buybacks, indicating strong confidence in the company’s stock value.

Japanese Yen Makes a U-Turn, Will USD/JPY Extend Lower from Here?

Japanese Yen Makes a U-Turn, Will USD/JPY Extend Lower from Here?

The Japanese Yen might be showing early warning signs that the currency might be getting ready to reverse against the US Dollar. Over the past 24 hours, USD/JPY broke under the 145.07 inflection point that was established in late June. This followed the presence of negative RSI divergence showing fading upside momentum.

That can at times precede a turn lower. Now, recent losses have exposed the 20-day Moving Average (MA) as immediate support. This line may reinstate the near-term upside focus. Otherwise, confirming a breakout below opens the door to extending losses. Still, keep in mind that the rising trendline from March is maintaining the broader bullish technical bias.

image1.png

Zooming in on the 4-hour chart reveals that a Double Top chart pattern appears to be in play. Prices have closed under the neckline of around 145.07, and this also followed the emergence of negative RSI divergence. Confirmation is lacking at the time of publishing, but immediate support is the 100-period Moving Average on this timeframe.

Breaking under the line may open the door to extending losses that the Double Top could be insinuating. That places the focus on the 38.2% Fibonacci retracement level of 142.99 before the current August low of 141.50 comes into focus. Otherwise, closing above 146.56 opens the door to extending gains towards the 61.8% Fibonacci extension level of 148.27 seen on the daily chart above.

image2.png

Crude Oil Price Loses Grip Despite Optimism Taking Hold. Where to for WTI?

Crude Oil Price Loses Grip Despite Optimism Taking Hold. Where to for WTI?

The crude oil price slipped overnight after US data disappointed and that led to speculation in the market that the Federal Reserve might step back a more aggressively hawkish stance, potentially as soon as later today.

The Kansas City Fed-hosted Jackson Hole economic symposium will get under and commentary from a number of Fed board members will be crossing the wires.

The main event though will be Fed Chair Jerome Powell’s comments and he won’t be taking to the microphone until Friday.

The symposium has been used in the past by previous Fed leaders to get a clear message across, especially if there is a perception that the market has misinterpreted the Fed’s outlook.

Overnight saw the S&P Global Composite PMI come in at 50.4 for August against 52 anticipated and previously.

Stripping out the components, most of the market’s disappointment was in the Manufacturing PMI that printed at 47, notably below the 49.3 forecast and 49 in the prior month.

Being a diffusion index, a read below 50 is seen as economically contractionary while a number over 50 is seen as expansionary.

The equity market appeared to take the stance that bad news is good news and Wall Street stacked on the gains with the Nasdaq leading the way, adding 1.59% in its cash session.

However, crude seemed to slump on the prospect of lesser demand despite US stockpiles dipping again.

The US Energy Information Agency (EIA) weekly petroleum status report revealed a massive drop of -6.135 million barrels for the week ended August 18th, lower than the -2.85 million anticipated and following the disappearance of -5.96 million barrels in the prior week.

Going into Thursday’s session, oil appears vulnerable with the WTI futures contract trading under US$ 78.50 bbl while the Brent contract is eyeing off US$ 82.50 bbl.

For more information on how to trade oil, click on the banner below.

WTI CRUDE OIL TECHNICAL ANALYSIS SNAPSHOT

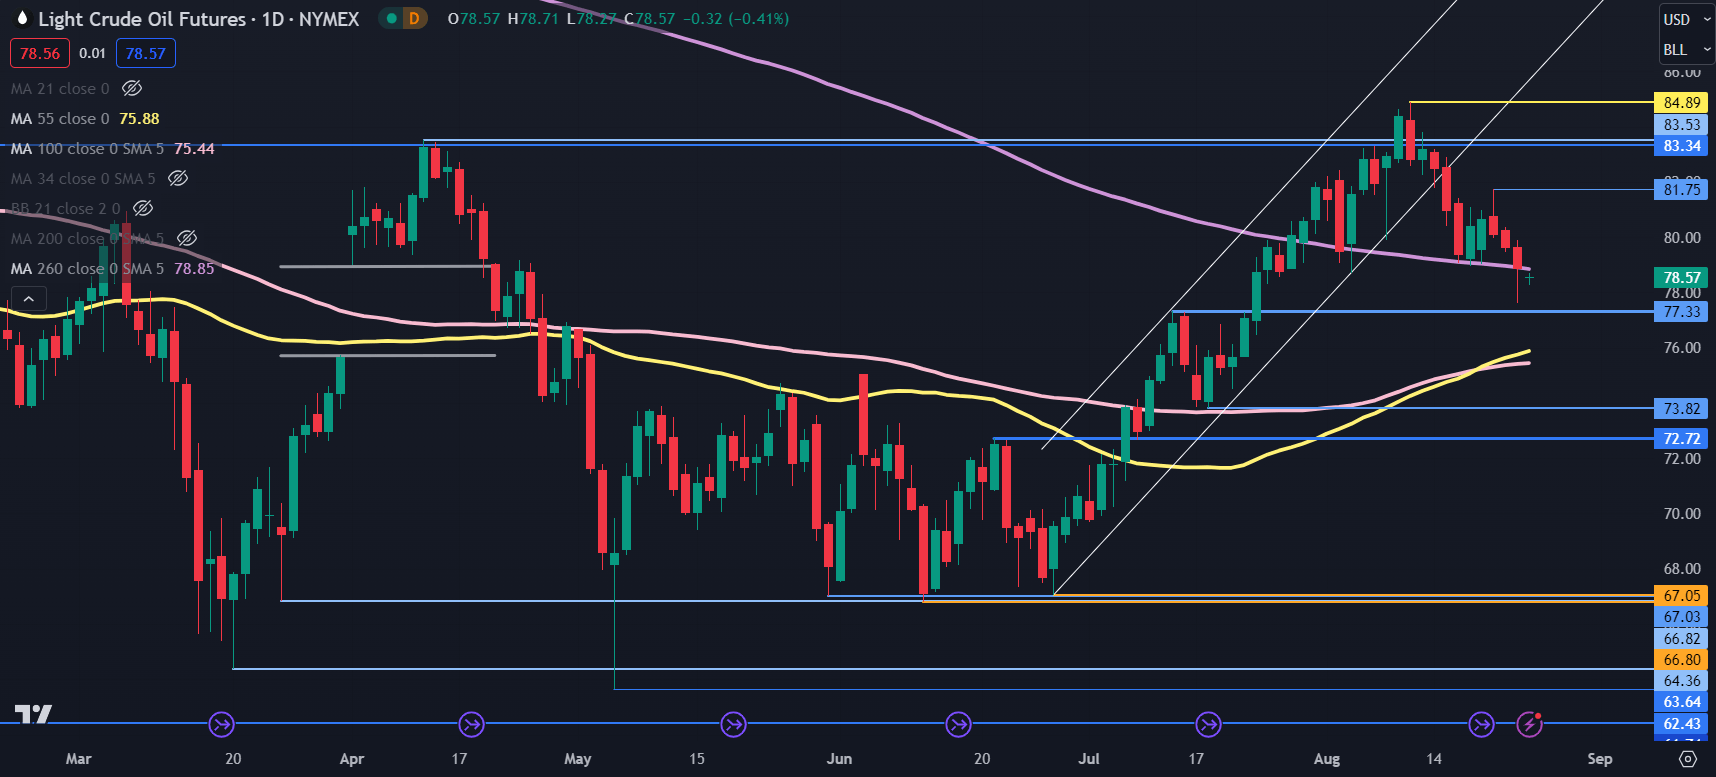
After breaking below the ascending trend line a fortnight ago, the WTI futures contract has continued lower and overnight moved under the 100-day simple moving average (SMA).

This may indicate that bearish momentum is evolving. The price action yesterday pulled up short of potential breakpoint support at 77.33 ahead of the prior low at 73.82.

Between those levels, the 55- and 100-day SMAs may provide support in the 75.50 – 75.80 area.

On the topside, resistance might be at the recent peak of 81.75 ahead of the breakpoints near 83.40 ahead of the prior high at 84.89.

image1.png


Retreat in US yields and Nvidia’s Earnings Provide Some Calm: SPDR S&P Semiconductor, Nikkei 225, Silver

Retreat in US yields and Nvidia’s Earnings Provide Some Calm: SPDR S&P Semiconductor, Nikkei 225, Silver

Market Recap

Market participants piled back into tech stocks overnight, as a retreat in the US 10-year Treasury yields from its 16-year high eases some market anxiety for a high-for-longer rate outlook. Downside surprises in US flash purchasing managers index (PMI) numbers have reflected a sharper moderation in demand for both the manufacturing (47 vs 49.3 forecast) and services (51 vs 52.2 forecast) sectors, which may challenge hawkish bets. This follows after bond yields turned lower in Europe on weaker-than-expected PMI readings as well. The S&P 500 now seems to be eyeing a reclaim of its 50-day moving average (MA), which has given way just last week.

Bullish bets on Nvidia have also paid off. While its valuation has been lofty (price-to-sales at 45), its outperformance on all fronts continue to show no signs of slowing in growth momentum, which provides the much-needed justification. Both its top and bottom-line have smashed expectations, while this quarter’s revenue guidance was also revised upwards ($16 billion versus $12.61 billion consensus) – 27% higher than estimates. To top it off, the company has authorised $25 billion in share buybacks.

Ahead, the next highlight on the calendar will be Federal Reserve Chair Jerome Powell’s speech at Jackson Hole, which will be due tomorrow (25 August, 10:05pm SGT). Until then, sentiments may continue to bask in the US AI/tech optimism, while keeping an eye on US jobless claims and durable goods orders, where any softer read may be looked upon to further cool tightening bets.

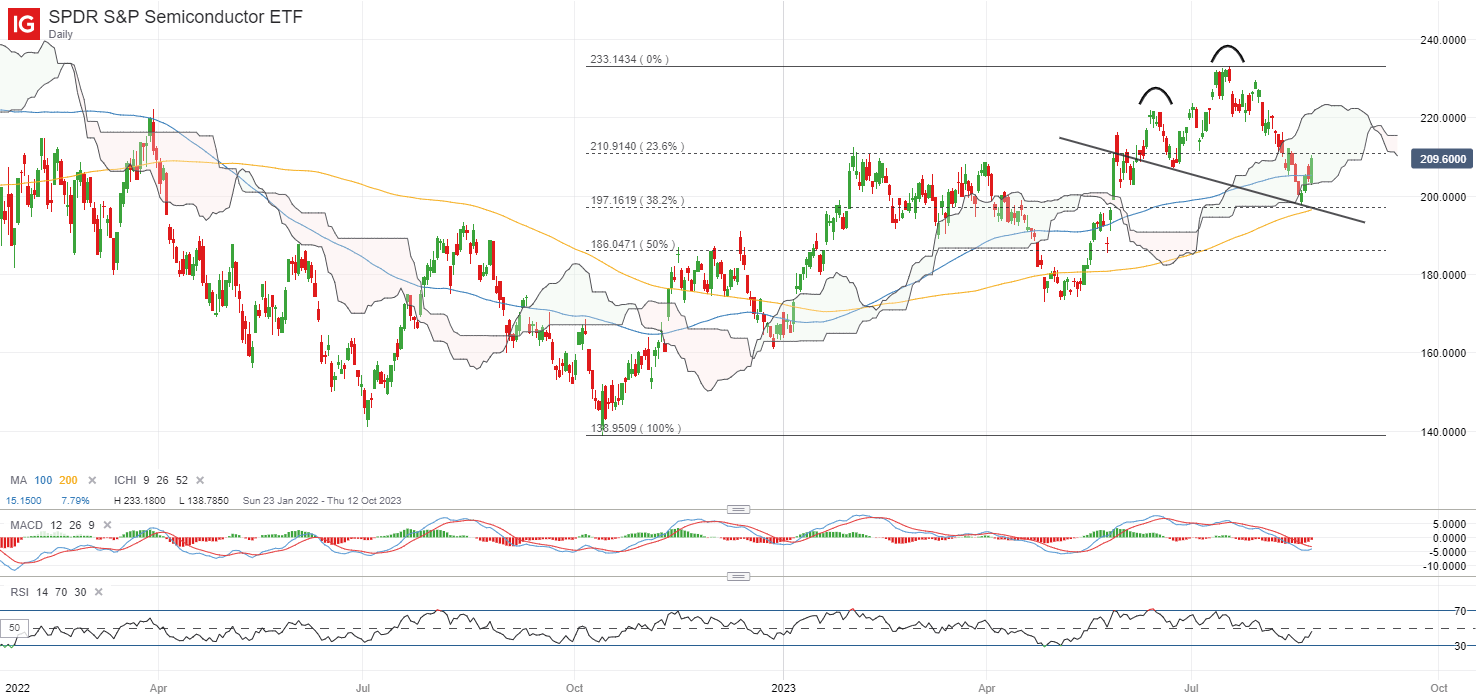
Perhaps one to watch may be the SPDR S&P Semiconductor ETF, which has seen a bounce off a support confluence lately (Ichimoku cloud support, 38.2% Fibonacci level). The February 2023 high at the 210.90 level will be an immediate resistance to overcome ahead, in order to pave the way to retest the 222.64 level next. A strong positive follow-through may be needed however, given that any turn lower could still run the risks of a potential head-and-shoulder formation.

US 500 Bullish

Data provided by

of clients are net short.
Change in Longs Shorts OI
Daily -19% 12% -2%
Weekly -17% 4% -5%
What does it mean for price action?
Get My Guide

image1.png

Source: IG charts

Asia Open

Asian stocks look set for a more lukewarm open, with Nikkei +0.27%, ASX +0.40% and KOSPI +0.73% at the time of writing. A retreat in US bond yields, alongside a weaker US dollar and a sharp decline in volatility (VIX -5.8%) may allow the risk environment to find some relief from recent bearish sentiments. The Nasdaq Golden Dragon China Index is up 1.5% overnight, potentially setting a more positive backdrop for Chinese equities into today’s session, although much await on any sustained follow-through, given the still-weak underlying fundamentals.

Interest rate decision was out from the Bank of Korea (BOK) this morning, largely meeting market expectations for further rate pause as inflation continues to moderate while growth conditions have been weaker-than-expected over the past month (downside surprises in 2Q GDP, industrial output, trade activities). The day ahead is expected to see interest rate decision from Bank Indonesia, with a no-change in policy rate likely to be the story as well.

Aside, the Nikkei 225 index continues to trade within a bullish flag formation, recently finding its footing from the lower channel trendline support with some dip-buying (bullish hammer candlestick on daily chart). Any subsequent break above the channel pattern may be on watch to validate buyers in greater control, with the flag formation’s price target potentially leaving a retest of its all-time high at the 38,195 level on the table. On the other hand, any failure for the lower channel trendline support to hold may leave the 30,400 level on watch next.
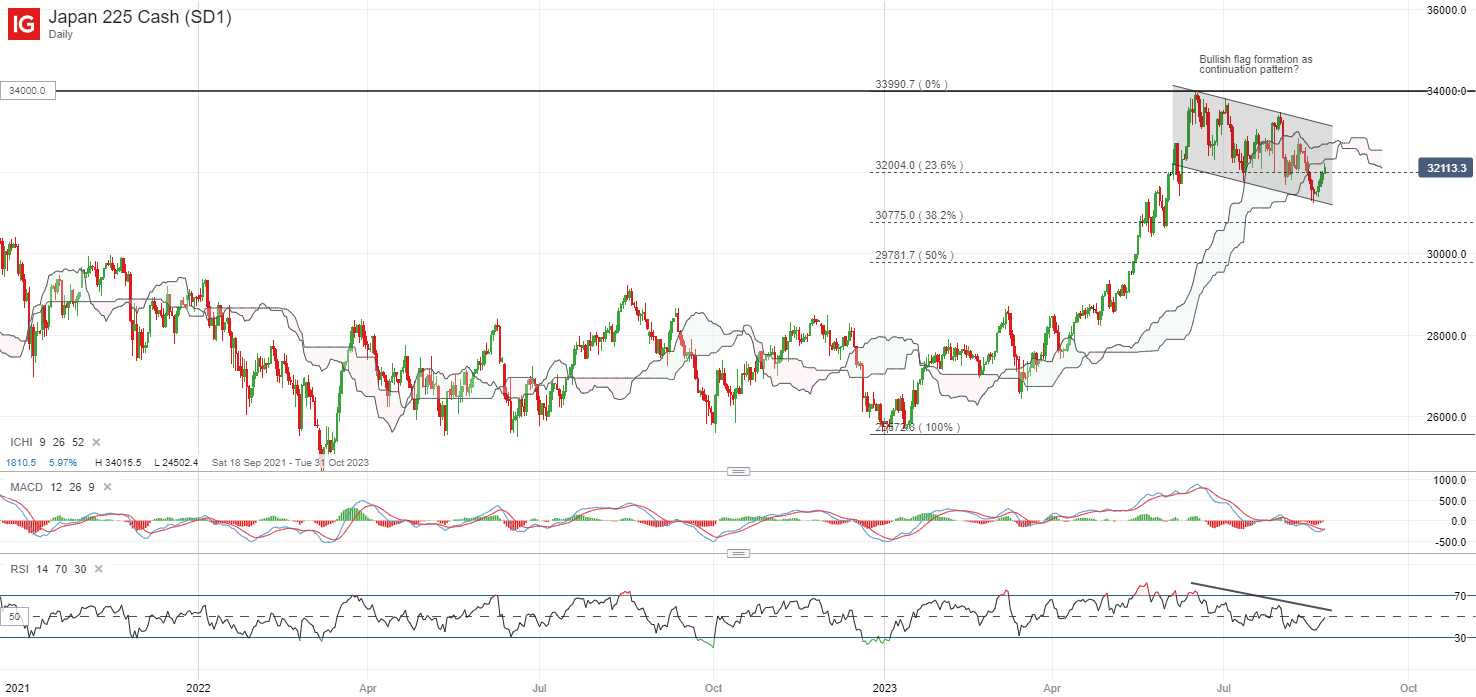
image2.png

Source: IG charts

On the watchlist: Can silver prices retest its year-to-date high?

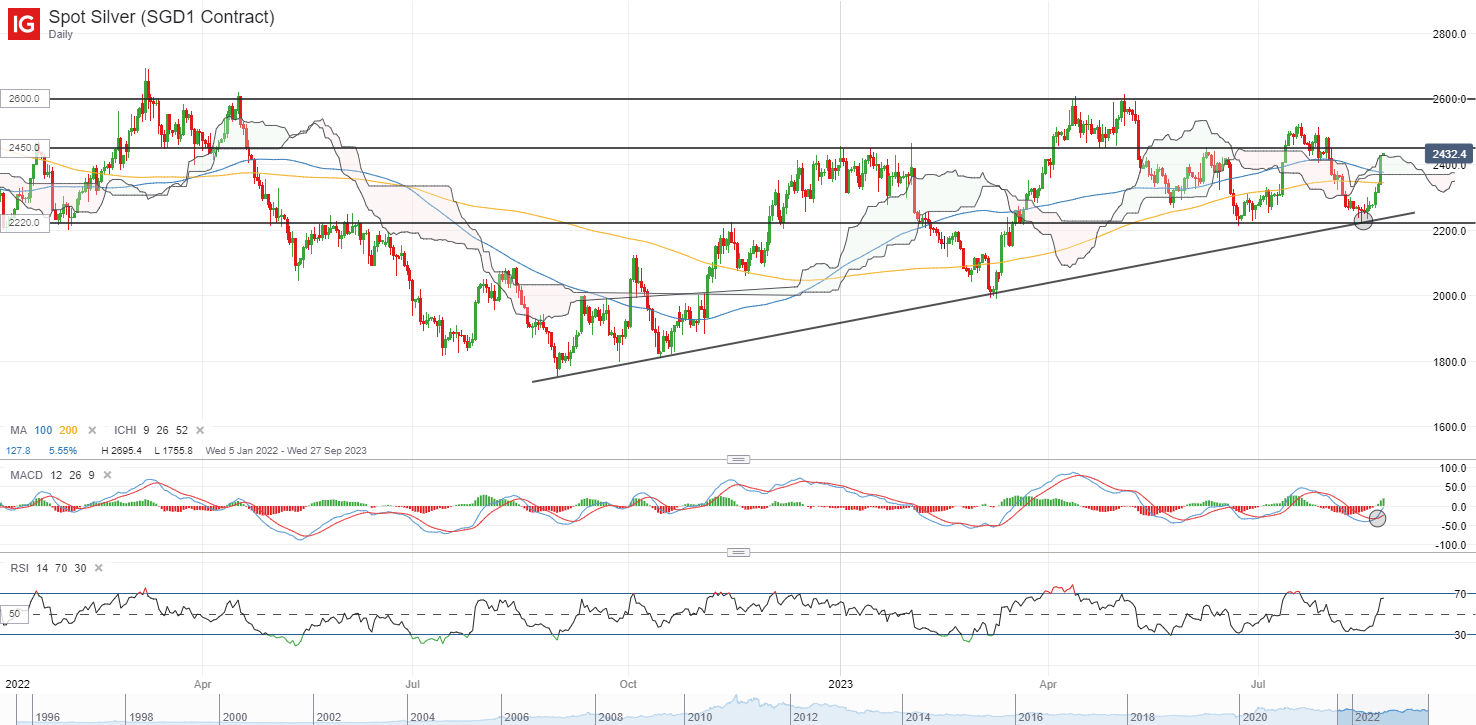
Silver prices have been gaining for the fifth straight day, with lower US bond yields and a weaker US dollar overnight providing the catalysts for another 3.8% jump, extending its gains for the week to 6.9%. This follows after bouncing off a support confluence at the US$22.20 level, with a bullish crossover formed on its moving average convergence/divergence (MACD) on the daily chart. Immediate resistance at the US$24.50 level will be on watch next, where moving past this level may potentially pave the way to retest its year-to-date high at the US$26.00 level.

Building Confidence in Trading

Building Confidence in Trading
Recommended by Jun Rong Yeap
Building Confidence in Trading
Get My Guide

image3.png

Source: IG charts
US Dollar Toppish Ahead of Powell; EUR/USD, AUD/USD, GBP/USD Price Setups

US Dollar Toppish Ahead of Powell; EUR/USD, AUD/USD, GBP/USD Price Setups

There are growing signs that the US dollar could be in the process of making an interim top. To be fair, this wouldn’t necessarily imply that the uptrend is over.

Downbeat US manufacturing and services PMI on Wednesday triggered a material slide in the US dollar globally, even as Euro area and UK factory output contracted. The outsized response to otherwise not-so-bad (single set of) data — at least in terms of levels of the PMIs compared with its peers – is a reflection of the broader mood. This is especially true given the most recent set of data, including industrial production, retail sales, and housing starts looked solid. For more discussion, see the previous update “US Dollar Looks Tired Ahead of Jackson Hole: EUR/USD, GBP/USD, USD/JPY Price Setups,” published August 22.

DXY Index Daily Chart

image1.png

The key focus is now on US Federal Reserve Chair Jerome Powell is due to speak on Friday at the three-day meeting of central bankers at the Jackson Hole Economic Symposium beginning Thursday. A balanced, data-dependent assessment could provide an excuse for a further retreat in the US dollar globally. However, if Powell’s tone turns out to be hawkish guided by the recent strong US data, then USD’s retreat could be limited.

DXY Index 240-Minutes Chart

image2.png

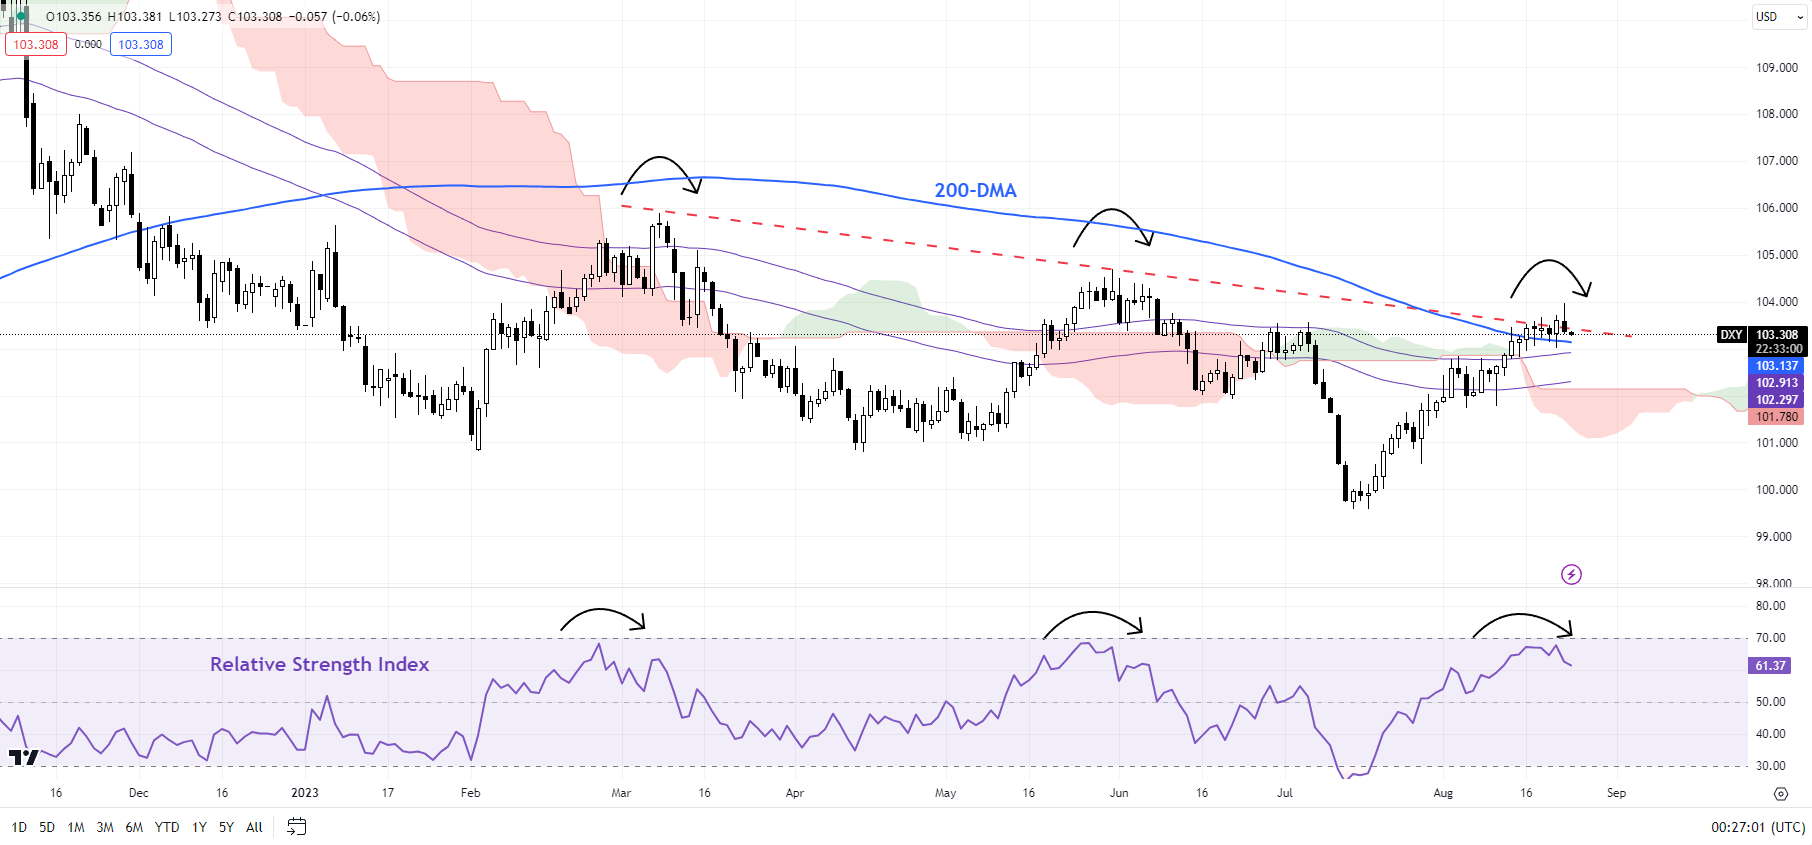
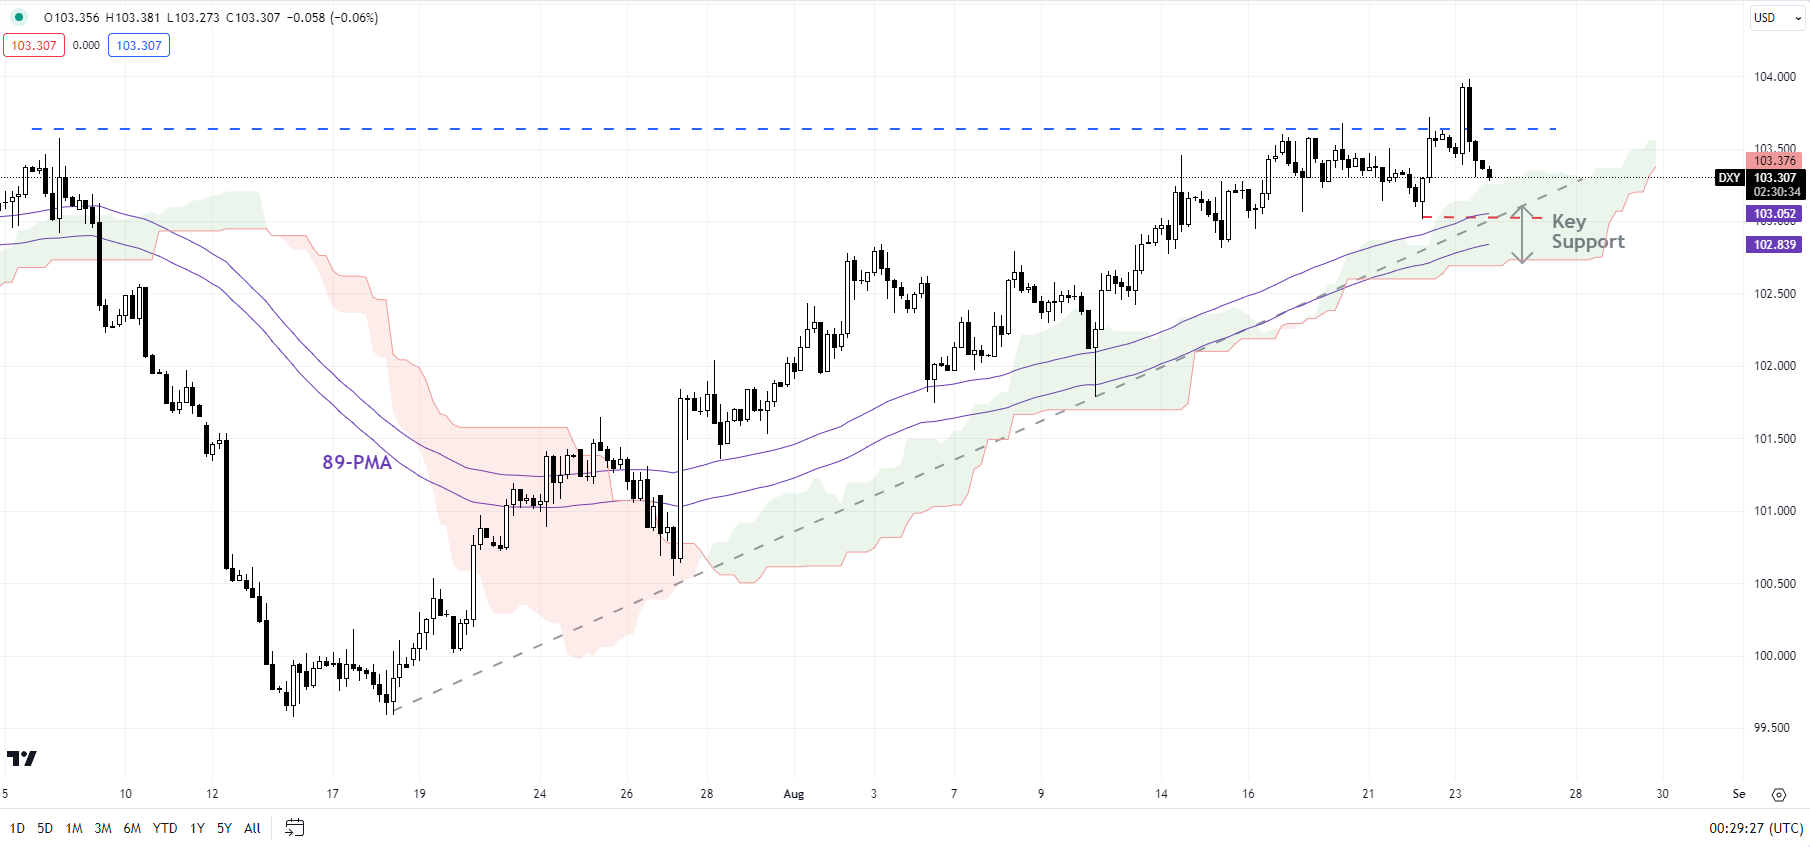
On technical charts, the DXY Index (USD index) has been struggling to clear above a stiff barrier on the 200-day moving average and a downtrend line from early 2023. Back-to-back doji / small body candles in recent days coupled with an inverted hammer on Wednesday raise the odds that the USD rally could be about to stall. Zooming on to the hourly charts, any break below the immediate converged floor at 102.50-1.0300, including the 89-period moving average and the lower edge of the Ichimoku cloud on the 240-minute charts would confirm that the upward pressure had faded.

EUR/USD 240-Minutes Chart

image3.png

Chart Created by Manish Jaradi Using TradingView

EUR/USD: Awaiting confirmation of a low

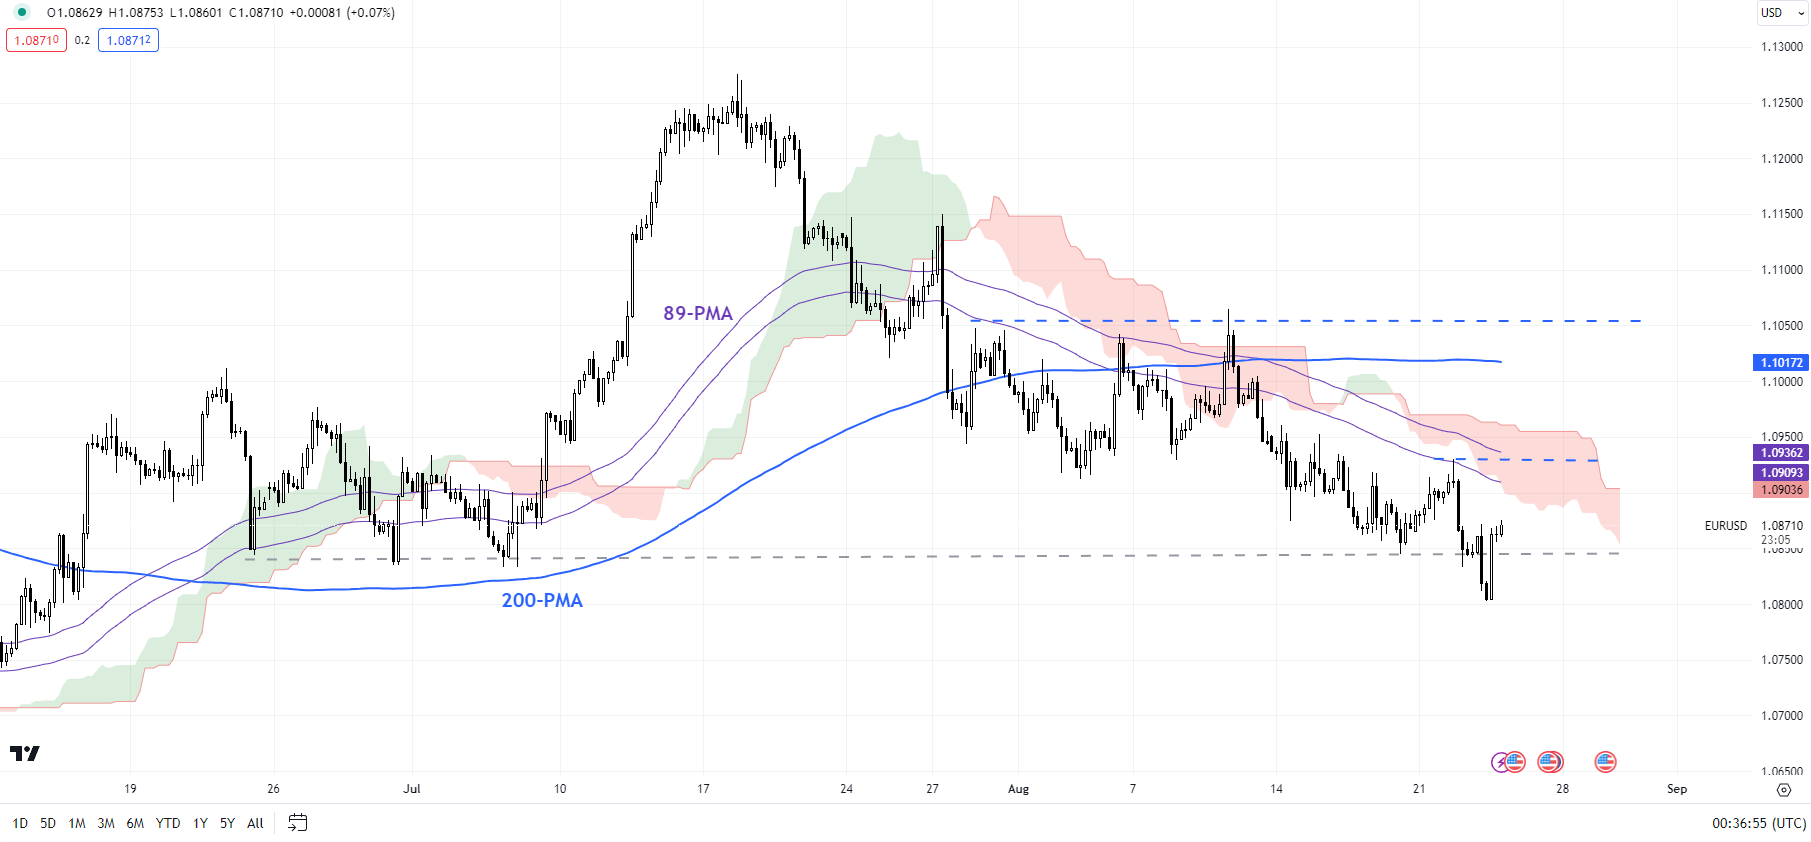
EUR/USD is holding above a crucial floor at the 89-day moving average, the 200-day moving average, and the lower edge of the Ichimoku cloud on the daily chart. While a necessary condition to ensure a low is in, the hold above support on its own isn’t sufficient to conclude the worst is over. The pair would need to rise above the initial resistance at 1.0900-1.0950 for the immediate downside risks to fade. Subsequent resistance is at the August 10 high of 1.1065.

GBP/USD 240-Minutes Chart

image4.png

GBPUSD: Settles in a range

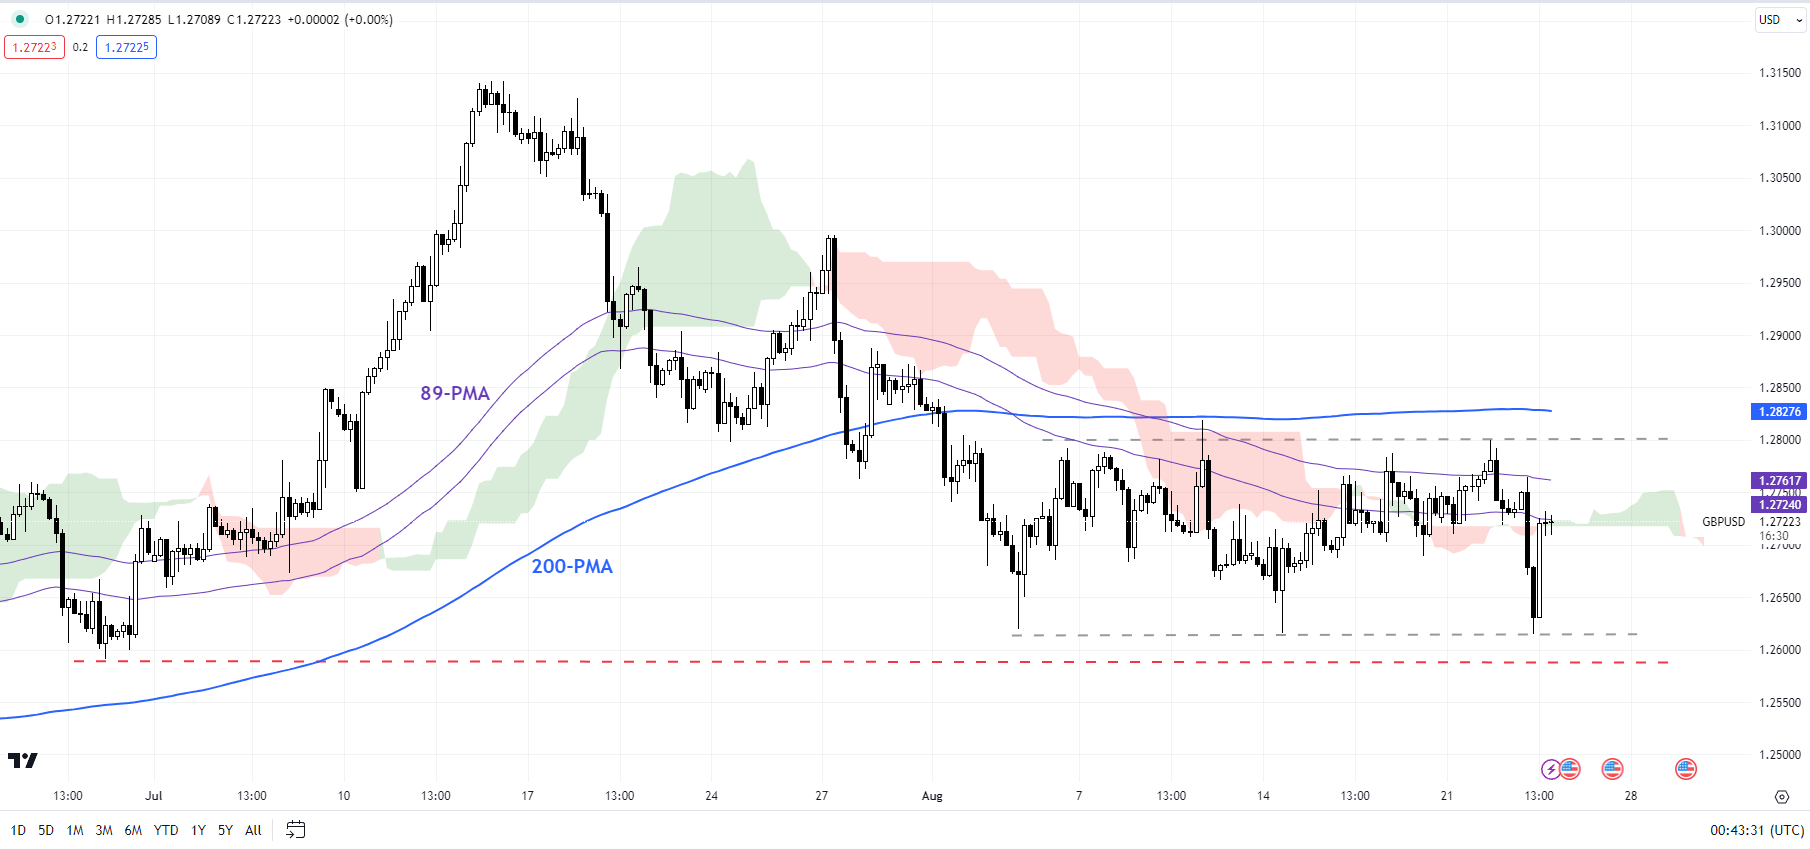
GBP/USD appears to have settled in a narrow range this month of 1.2600-1.2800. The lower edge also coincides with the 89-day moving average, the lower edge of the Ichimoku cloud on the daily chart, and the end-June low of 1.2600. There is plenty of support under 1.2600 to limit any downside, including the 200-day moving average and the May low of 1.2300. On the upside, GBP/USD needs to rise above the August 10 high of 1.2820 for the immediate downward pressure to fade.

AUD/USD Daily Chart

image5.png

AUD/USD: At vital converged support

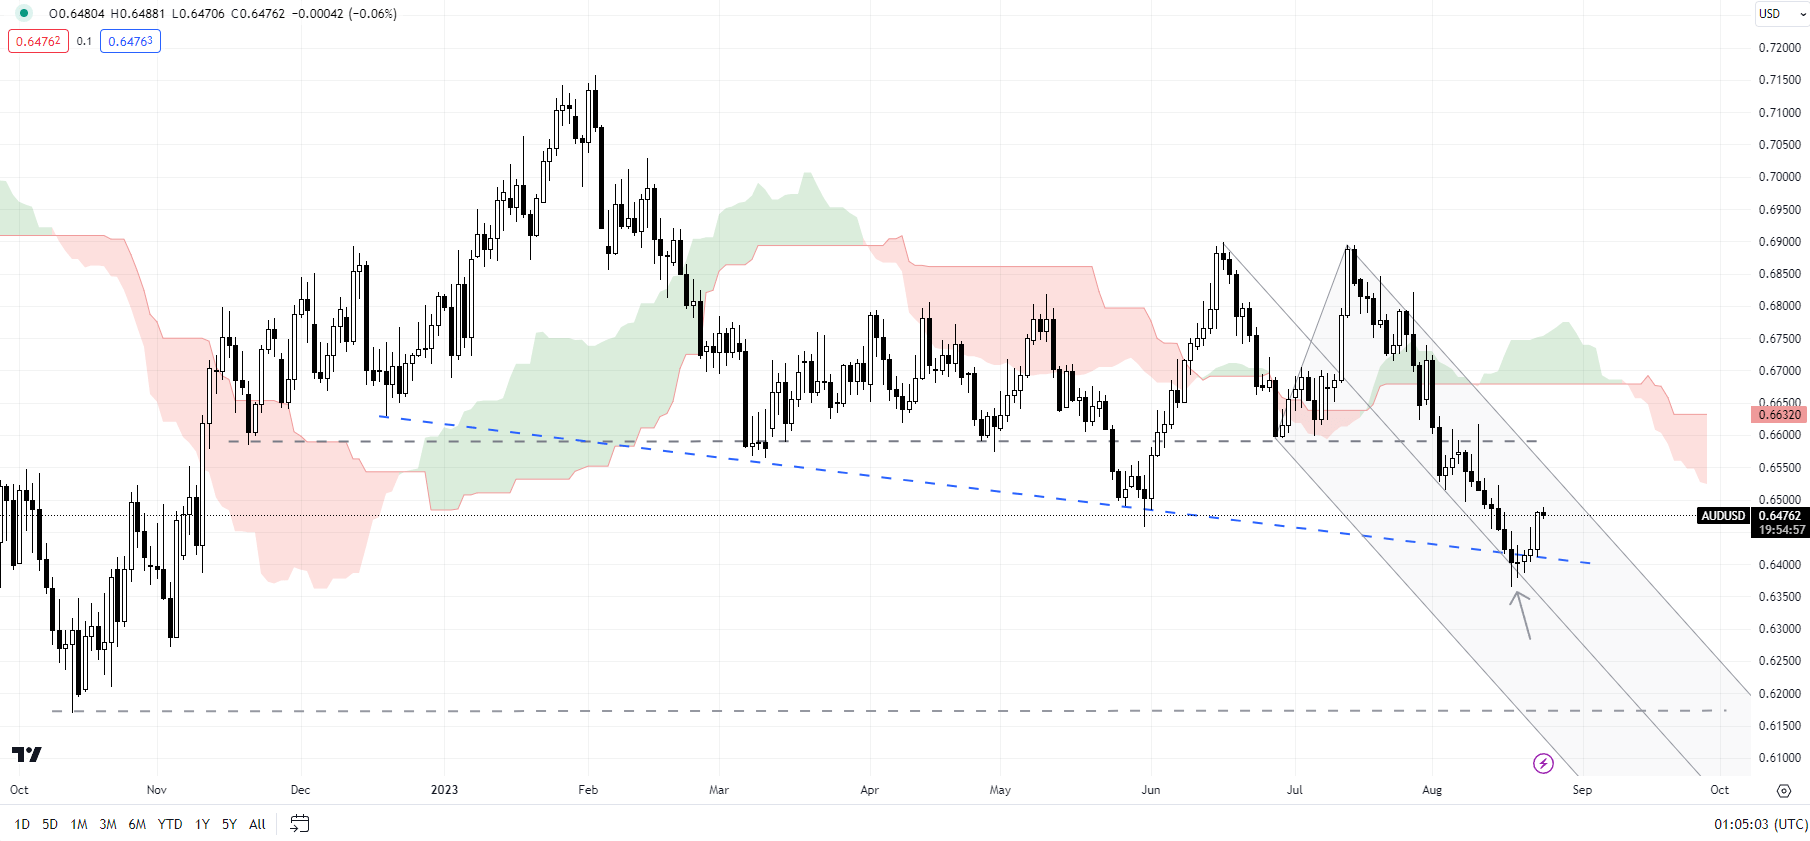
AUD/USD looks deeply oversold as it tests a vital converged support on the median line of a declining pitchfork channel since June and a downtrend line from the end of 2023. The rise on Wednesday above minor resistance at Tuesday’s high of 0.6450 could be an early sign of a potential turnaround in AUD/USD. A cross above the 89-period moving average and the upper edge of the Ichimoku cloud on the 240-minute charts would be confirmation that AUD/USD had formed a base in the interim.

US Indices’ Upside Could be Capped: S&P 500, Nasdaq Price Setups

US Indices’ Upside Could be Capped: S&P 500, Nasdaq Price Setups

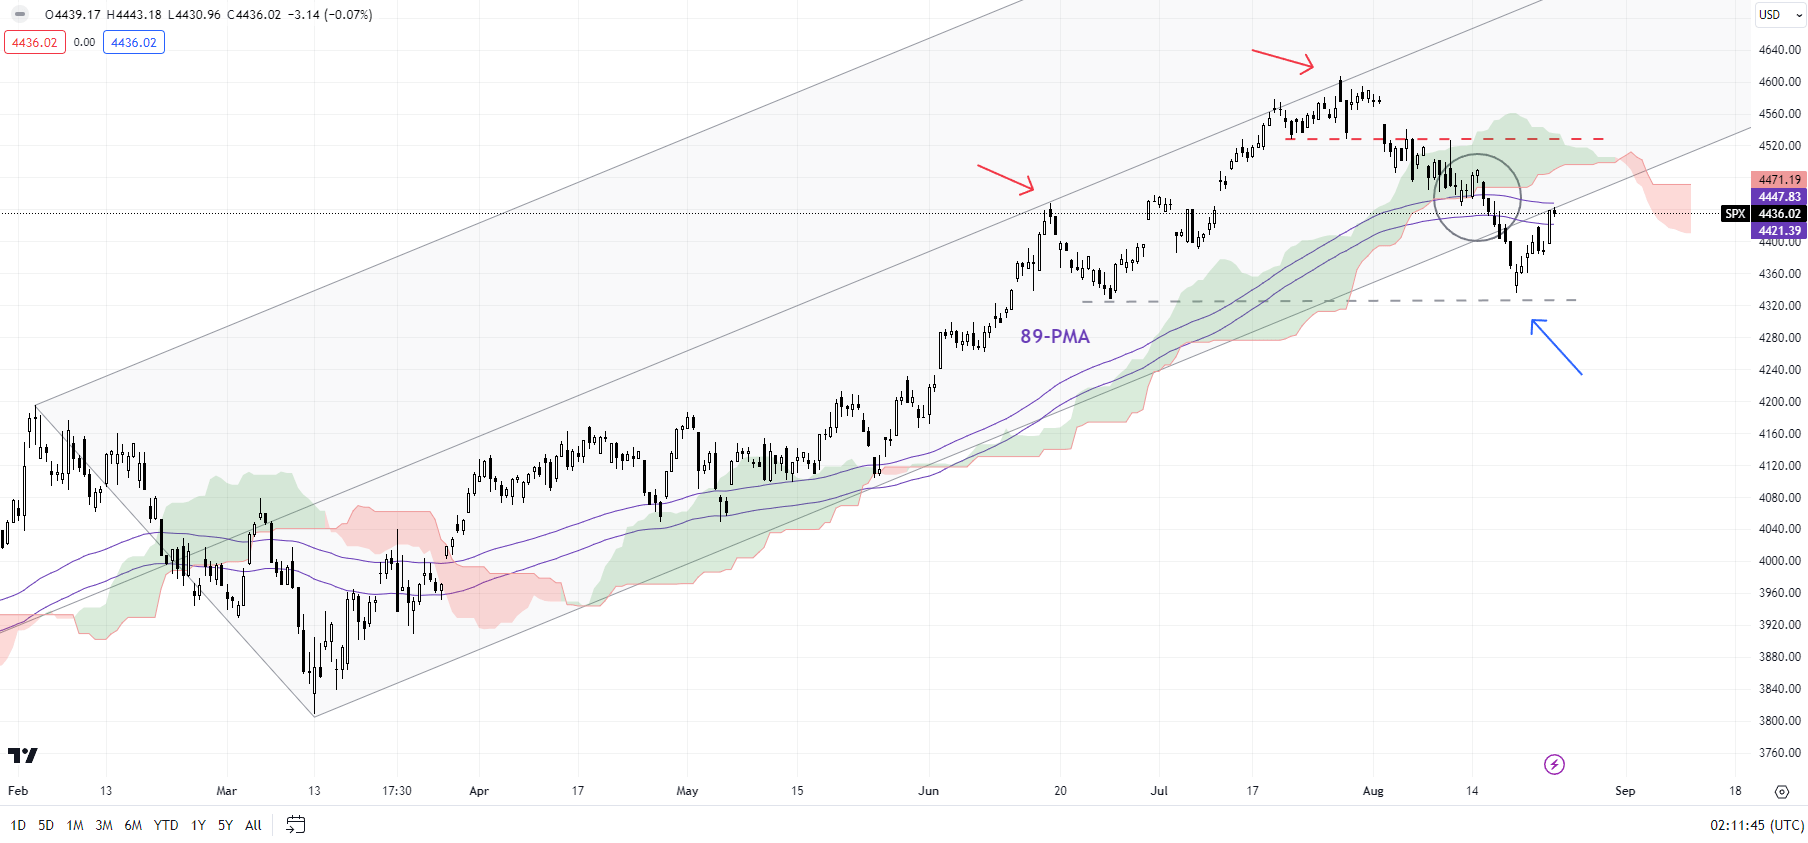
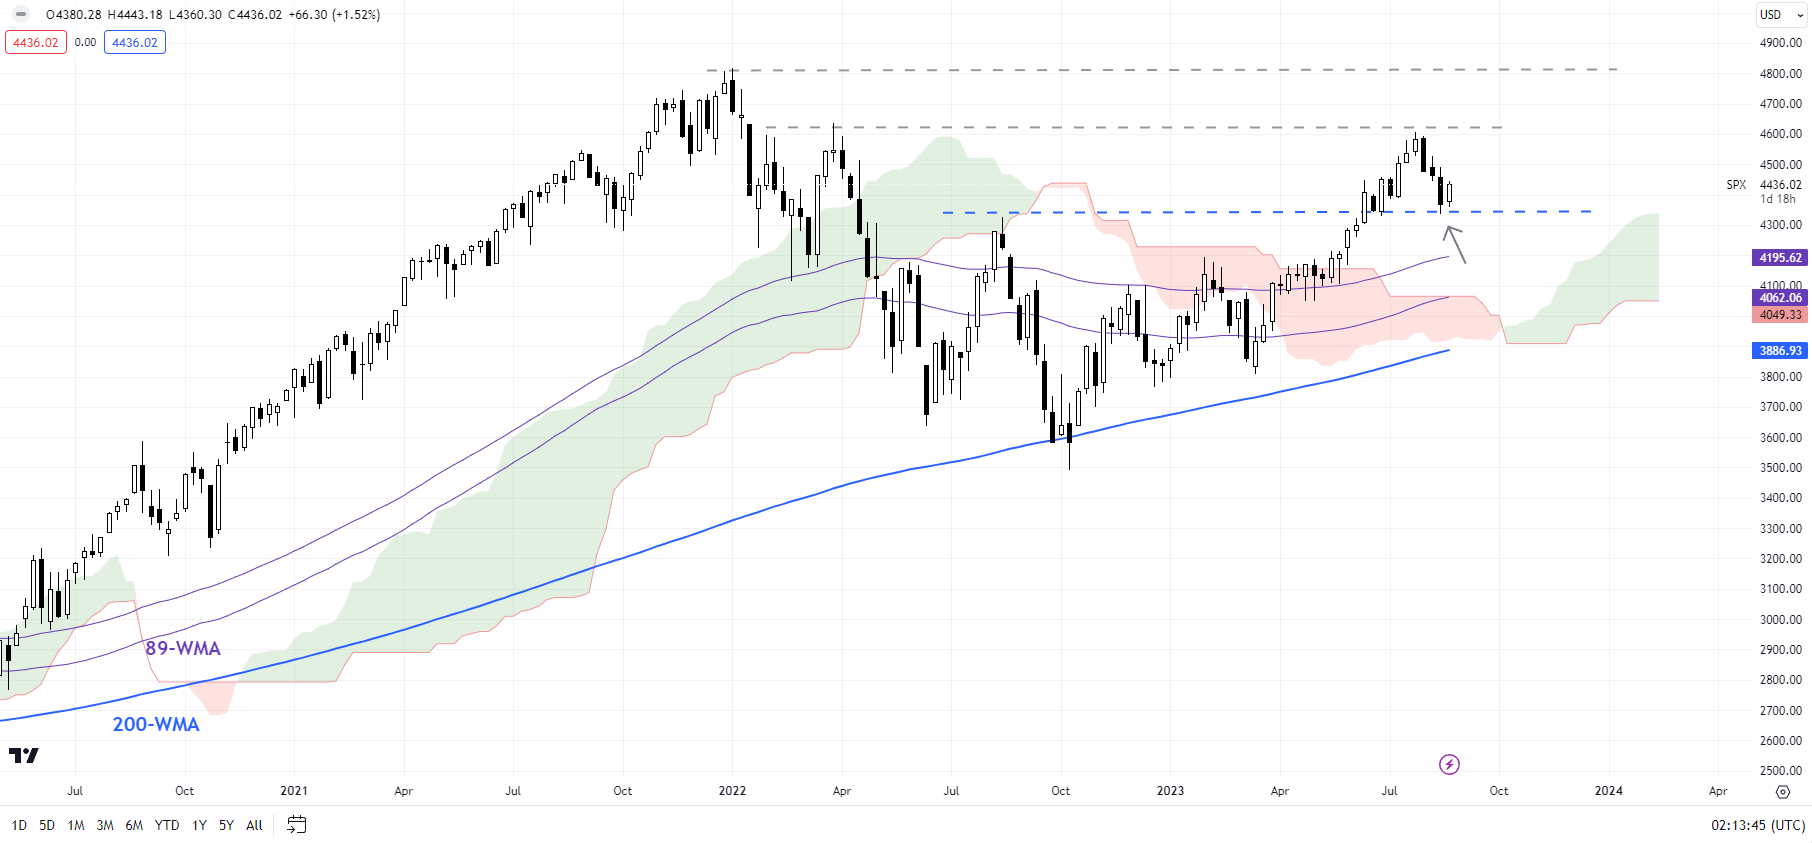
US indices may have rebounded in recent days, thanks to earnings and the retreat in US yields. But the deep decline since last month has left a scar on the broader uptrend, one that could be hard to fill soon.

The S&P 500 index’s peak-to-trough decline of 6% since July and the Nasdaq 100 index’s drop of 8% is the deepest since the rally began in March – a risk pointed out in the recent updates. See “US Indices Rally Beginning to Crack? S&P 500, Nasdaq Price Setups,” published August 3. See “S&P 500, Nasdaq 100 Forecast: Overly Optimistic Sentiment Poses a Minor Setback Risk,” published July 23.

Overbought conditions, extreme optimism, and the belief that the US economy is soft landing have been some of the positive catalysts. However, with real yields rising, valuations well above historical averages, and full-year EPS projections yet to turn materially higher, the bar for equities to outperform some of the other asset classes is now higher. This implies that the rebound in recent days may not necessarily be “business-as-usual”, and the upside could be capped for now.

Nasdaq 100 240-Minute Chart

image1.png

Nasdaq 100: Holding above the crucial cushion

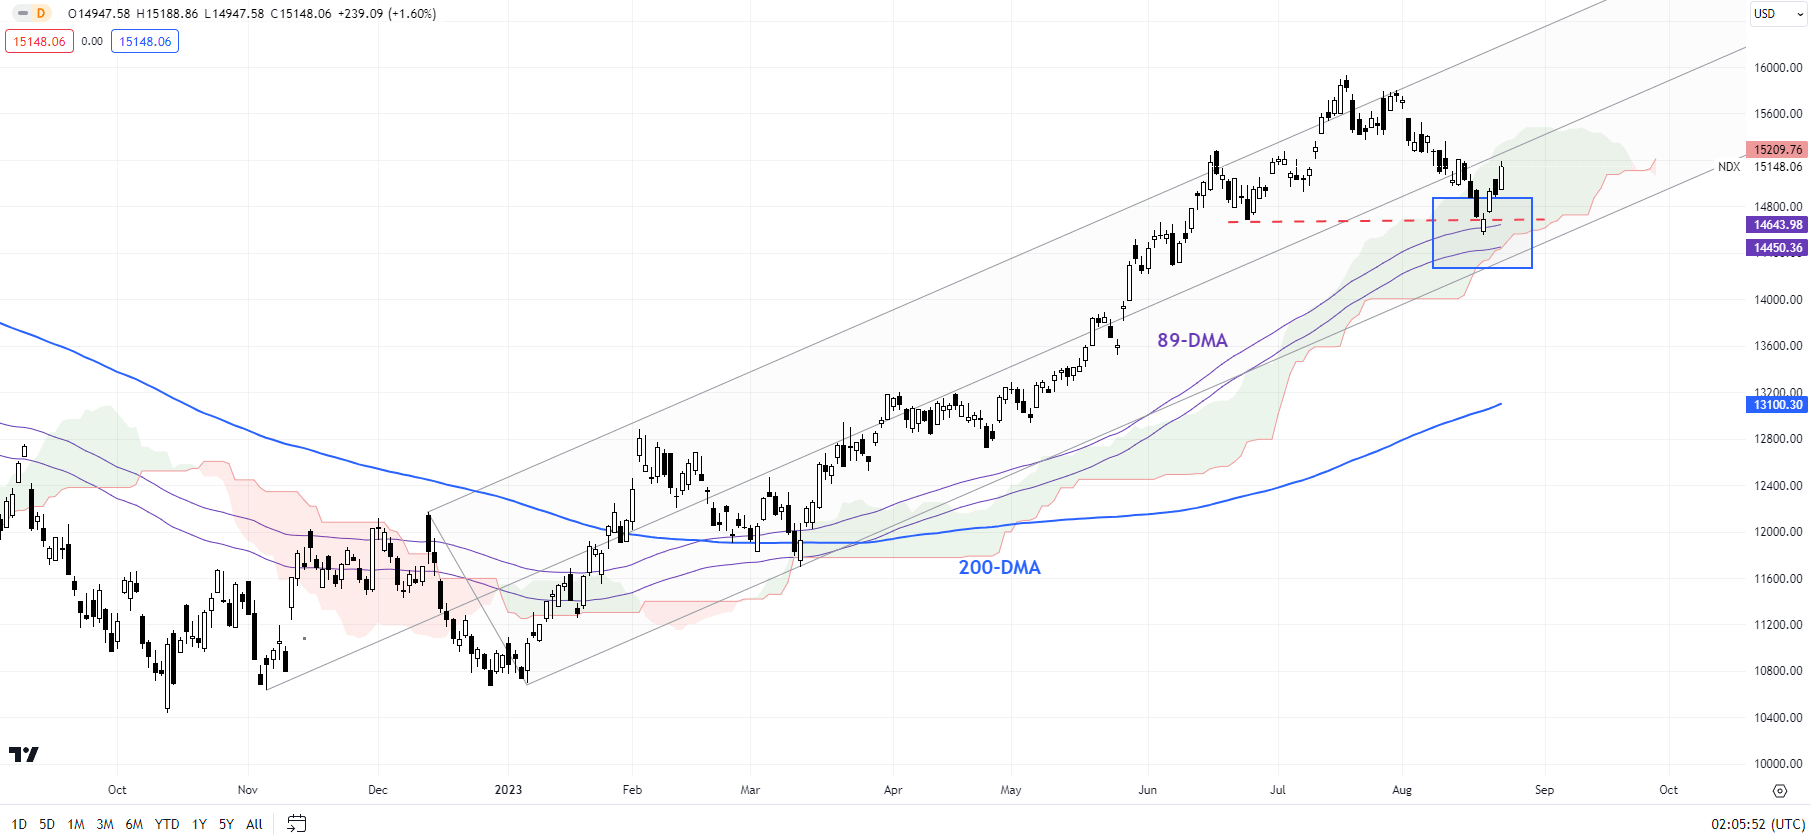
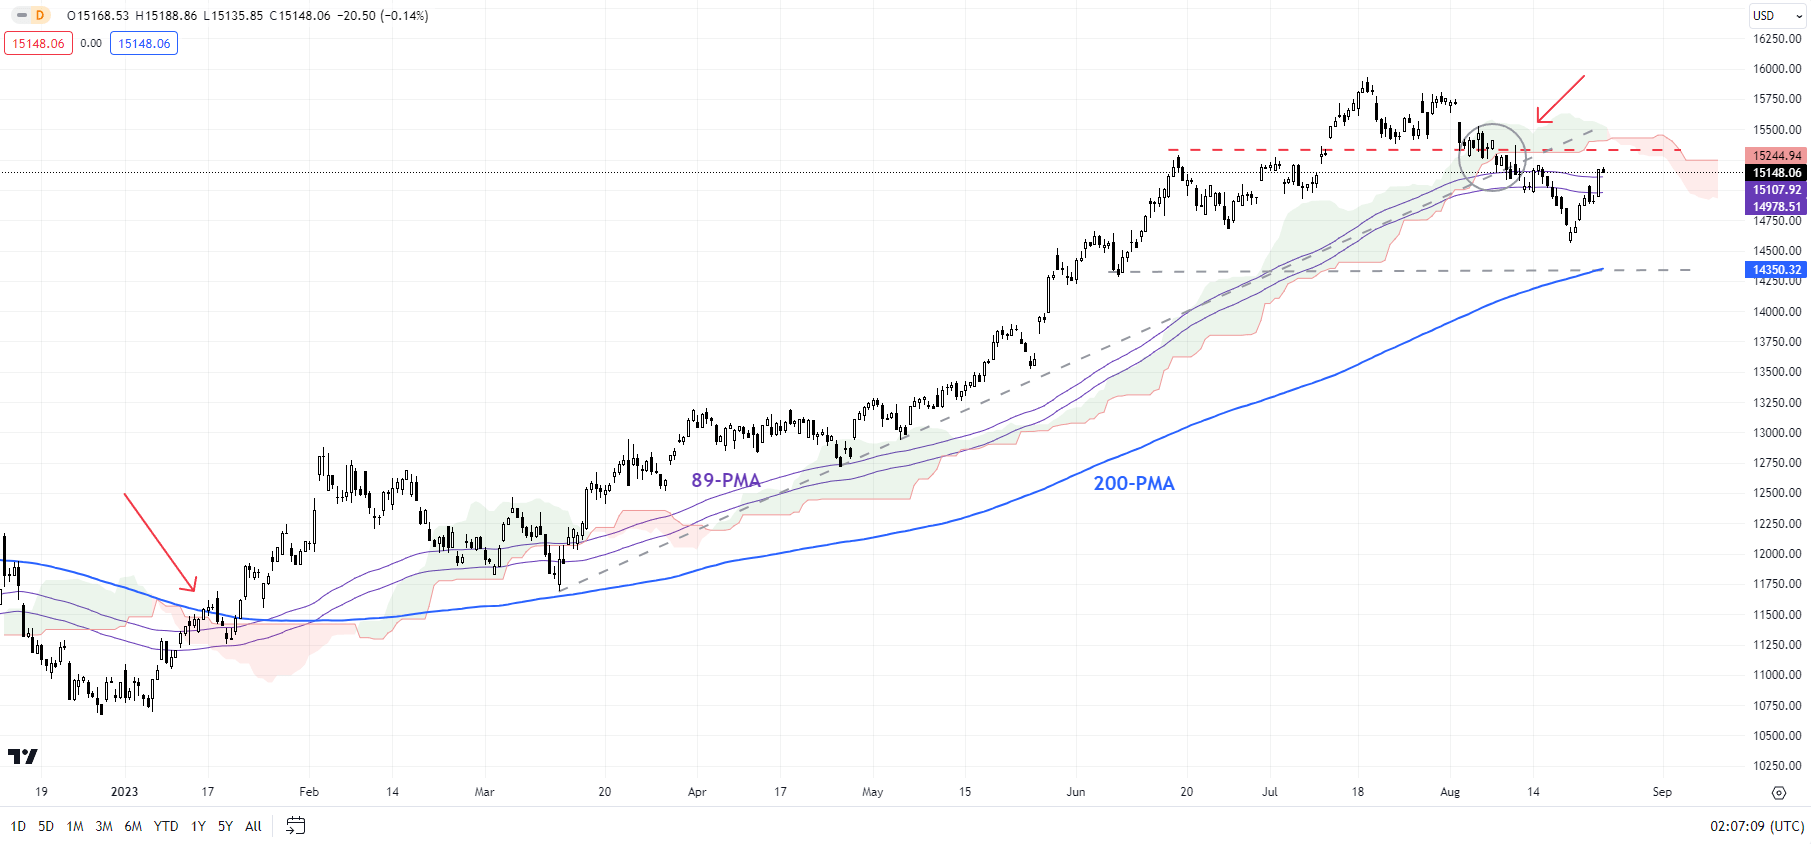
On technical charts, the Nasdaq 100 index’s slide appears to have stalled at the vital cushion area, including the 89-day moving average, the lower edge of the Ichimoku cloud on the daily chart, and the June low of 14700. Importantly, the index’s fall below the 89-period moving average and the lower edge of the Ichimoku cloud on the 240-minute charts – for the first time since the rally began earlier this year – is a signal that the broader bullish pressure could be easing.

Nasdaq 100 Daily Chart

image2.png

Moreover, as noted in arecent update, monthly charts have been feeble compared with the 50% rally since October (see the monthly chart), raising the risk of a gradual weakening pattern in gold in recent months. For more discussion, see “Is Nasdaq Following Gold’s Footsteps? NDX, XAU/USD Price Setups,” published August 14. For the immediate softness to fade, the index would clear past resistance at 15400. Stronger resistance is at the July high of 15900.

S&P 500 240-Minute Chart

image3.png

S&P 500: Upward pressure has eased

As highlighted in an update in July, the S&P 500 index’s fall below minor support at the late-July low of 4550 has confirmed that the short-term upward pressure has faded – a risk pointed out in July. See “S&P 500, Nasdaq 100 Forecast: Overly Optimistic Sentiment Poses a Minor Setback Risk,” published July 23.

S&P 500 Weekly Chart

image4.png

The recent retreat follows a failure to rise past converged resistance on the upper edge of a rising pitchfork channel from the end of 2022 and the April 2022 high of 4637. For now, though, the index has managed to find support at the June low of 4325, slightly below the lower edge of a rising pitchfork since early 2023. The broader index could need to clear past the support-turned-resistance at 4550 for the downside risks to dissipate.

UK’s Economic Headwinds: Private Sector Takes a Hit in August

UK’s Economic Headwinds: Private Sector Takes a Hit in August

UK Private Sector Slows Amidst Economic Pressures

August saw the UK’s private sector witnessing a renewed dip in business activity, thus breaking a six-month streak of growth. A rapid decline in new orders, influenced by domestic economic challenges and rising borrowing costs, were significant contributors to this downturn.

Economic Landscape

The S&P Global / CIPS Flash UK Composite Output Index for August settled at 47.9, dropping from July’s 50.8, a concerning shift not seen since January 2021. This indicates a mild contraction in UK’s private sector output, impacting both manufacturing and service sectors. The service sector saw a marginal dip, while the manufacturing sector reported a pronounced decrease in production. Rising interest rates and tighter household budgets appear to be discouraging clients from spending, though international travel and leisure services seem to be somewhat resilient.

Labor and Inflationary Concerns

Despite the economic slowdown, businesses faced severe challenges in recruiting and retaining skilled workers. Rising wages, especially within the service sector, were prevalent, even as the costs of energy and raw materials diminished. Consequently, the average cost burdens rose at the slowest rate since February 2021, with price inflation seeing a fourth consecutive month of moderation.

Business Sentiment and Forecast

Despite the evident decline in demand conditions, business activity expectations for the UK’s private sector remained moderately optimistic. Service providers expressed mild concern regarding the broader economic landscape and the effects of high interest rates. Manufacturers, on the other hand, seemed more positive, driven by new product investments and declining input costs.

The present data suggests potential GDP contraction by 0.2% in the third quarter. As we look ahead, indications are that the UK economy is grappling with inflation, and recession risks are mounting. High interest rates continue to temper demand, but they seem effective in curtailing inflationary pressures, hinting at a potentially bearish outlook for the private sector.

Will the US Dollar Keep Rising Beyond Its Highest Point in 10 Weeks Against Major Currencies?

Will the US Dollar Keep Rising Beyond Its Highest Point in 10 Weeks Against Major Currencies?

The US Dollar Index Is Up for 6 Consecutive Weeks

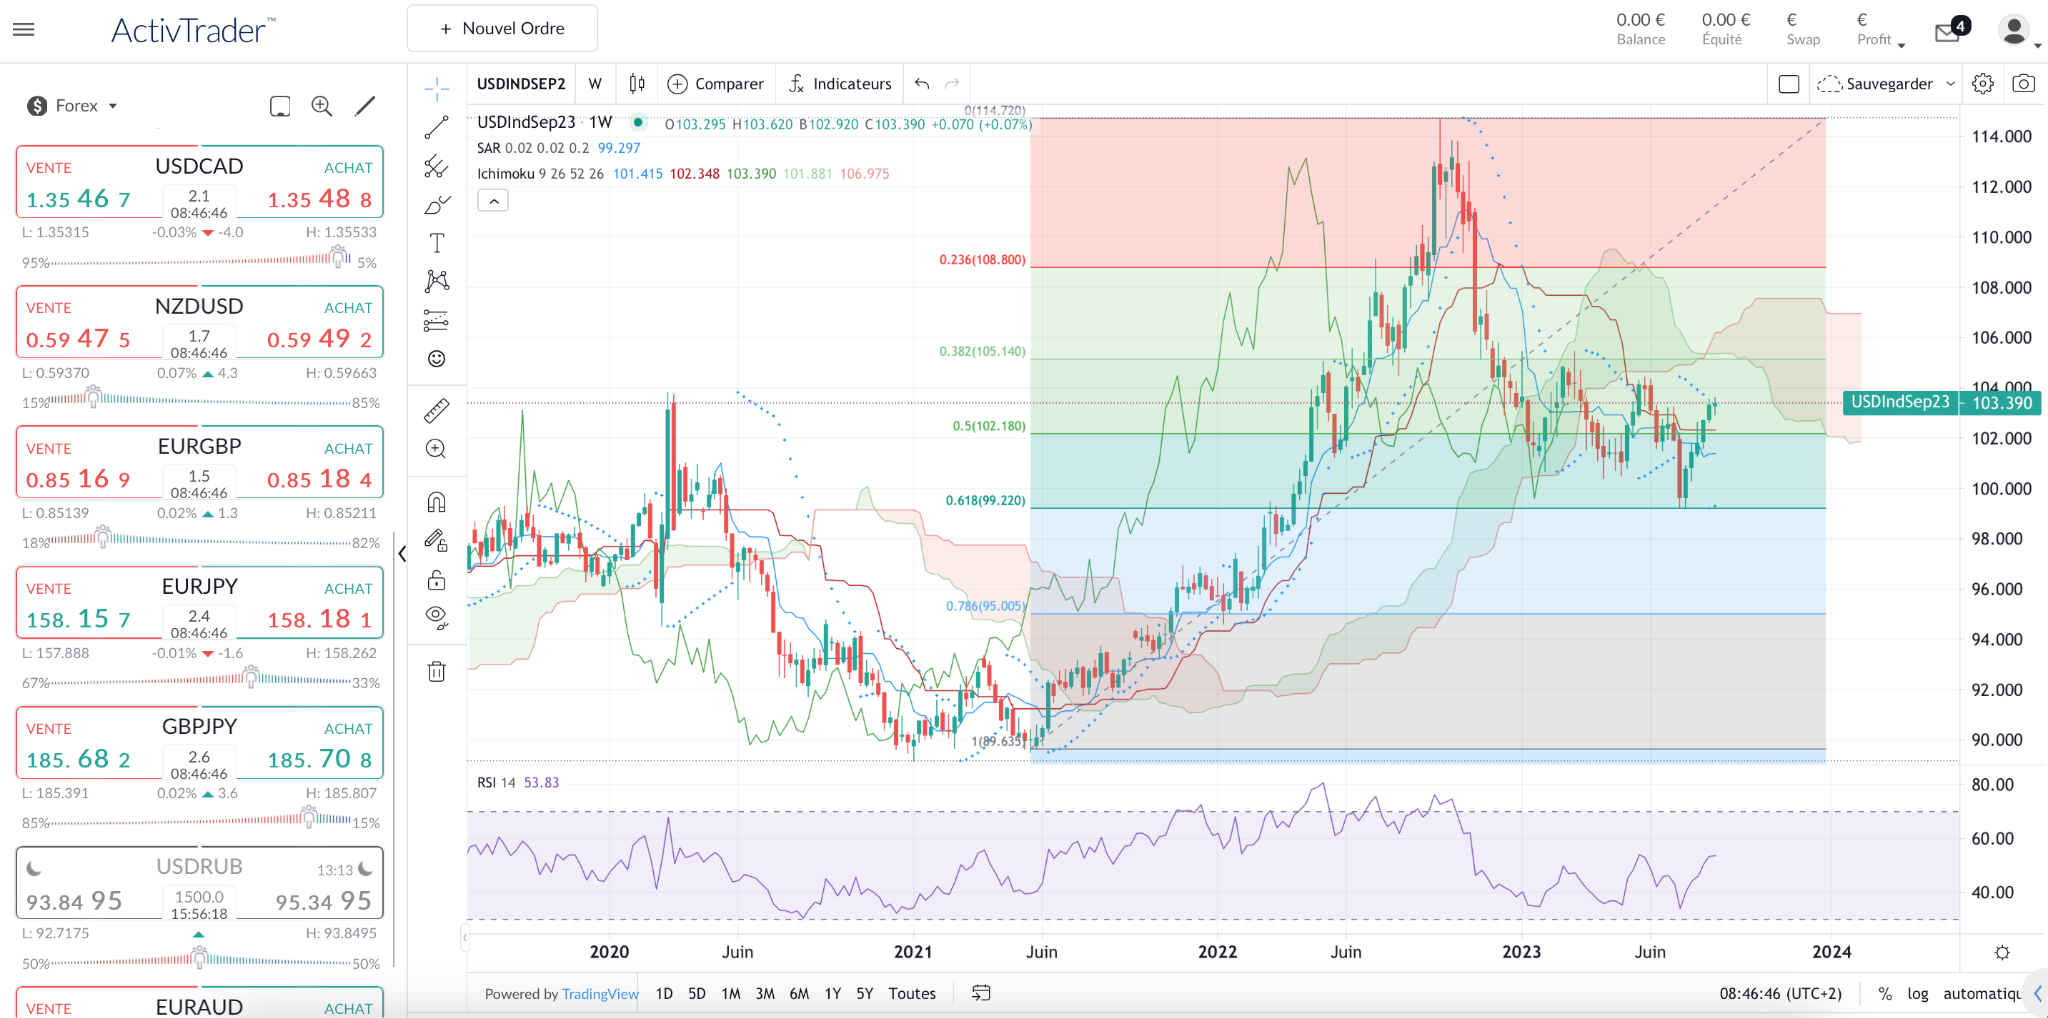
Commencing in June 2021, the US dollar index has maintained a steady upward trajectory, demonstrating substantial growth. It has advanced by more than 25% from that date until the end of September 2021, surging from 89.41 to 114.815.

Trading Derivatives carries a high level of risk to your capital and you should only trade with money you can afford to lose. Trading Derivatives may not be suitable for all investors, so please ensure that you fully understand the risks involved, and seek independent advice if necessary. A Product Disclosure Statement (PDS) can be obtained either from this website or on request from our offices and should be considered before entering into a transaction with us. Raw Spread accounts offer spreads from 0.0 pips with a commission charge of USD $3.50 per 100k traded. Standard account offer spreads from 1 pips with no additional commission charges. Spreads on CFD indices start at 0.4 points. The information on this site is not directed at residents in any country or jurisdiction where such distribution or use would be contrary to local law or regulation.

Following this peak, the US dollar index has experienced a decline, recently reaching the 61.8% Fibonacci retracement level of the initial rise in the early part of the current month, as depicted on the weekly chart. Since this level, the US dollar has been up for 6 consecutive weeks.

The Sell-off in US Government Debt Is Slowing Down Ahead of Jackson Hole

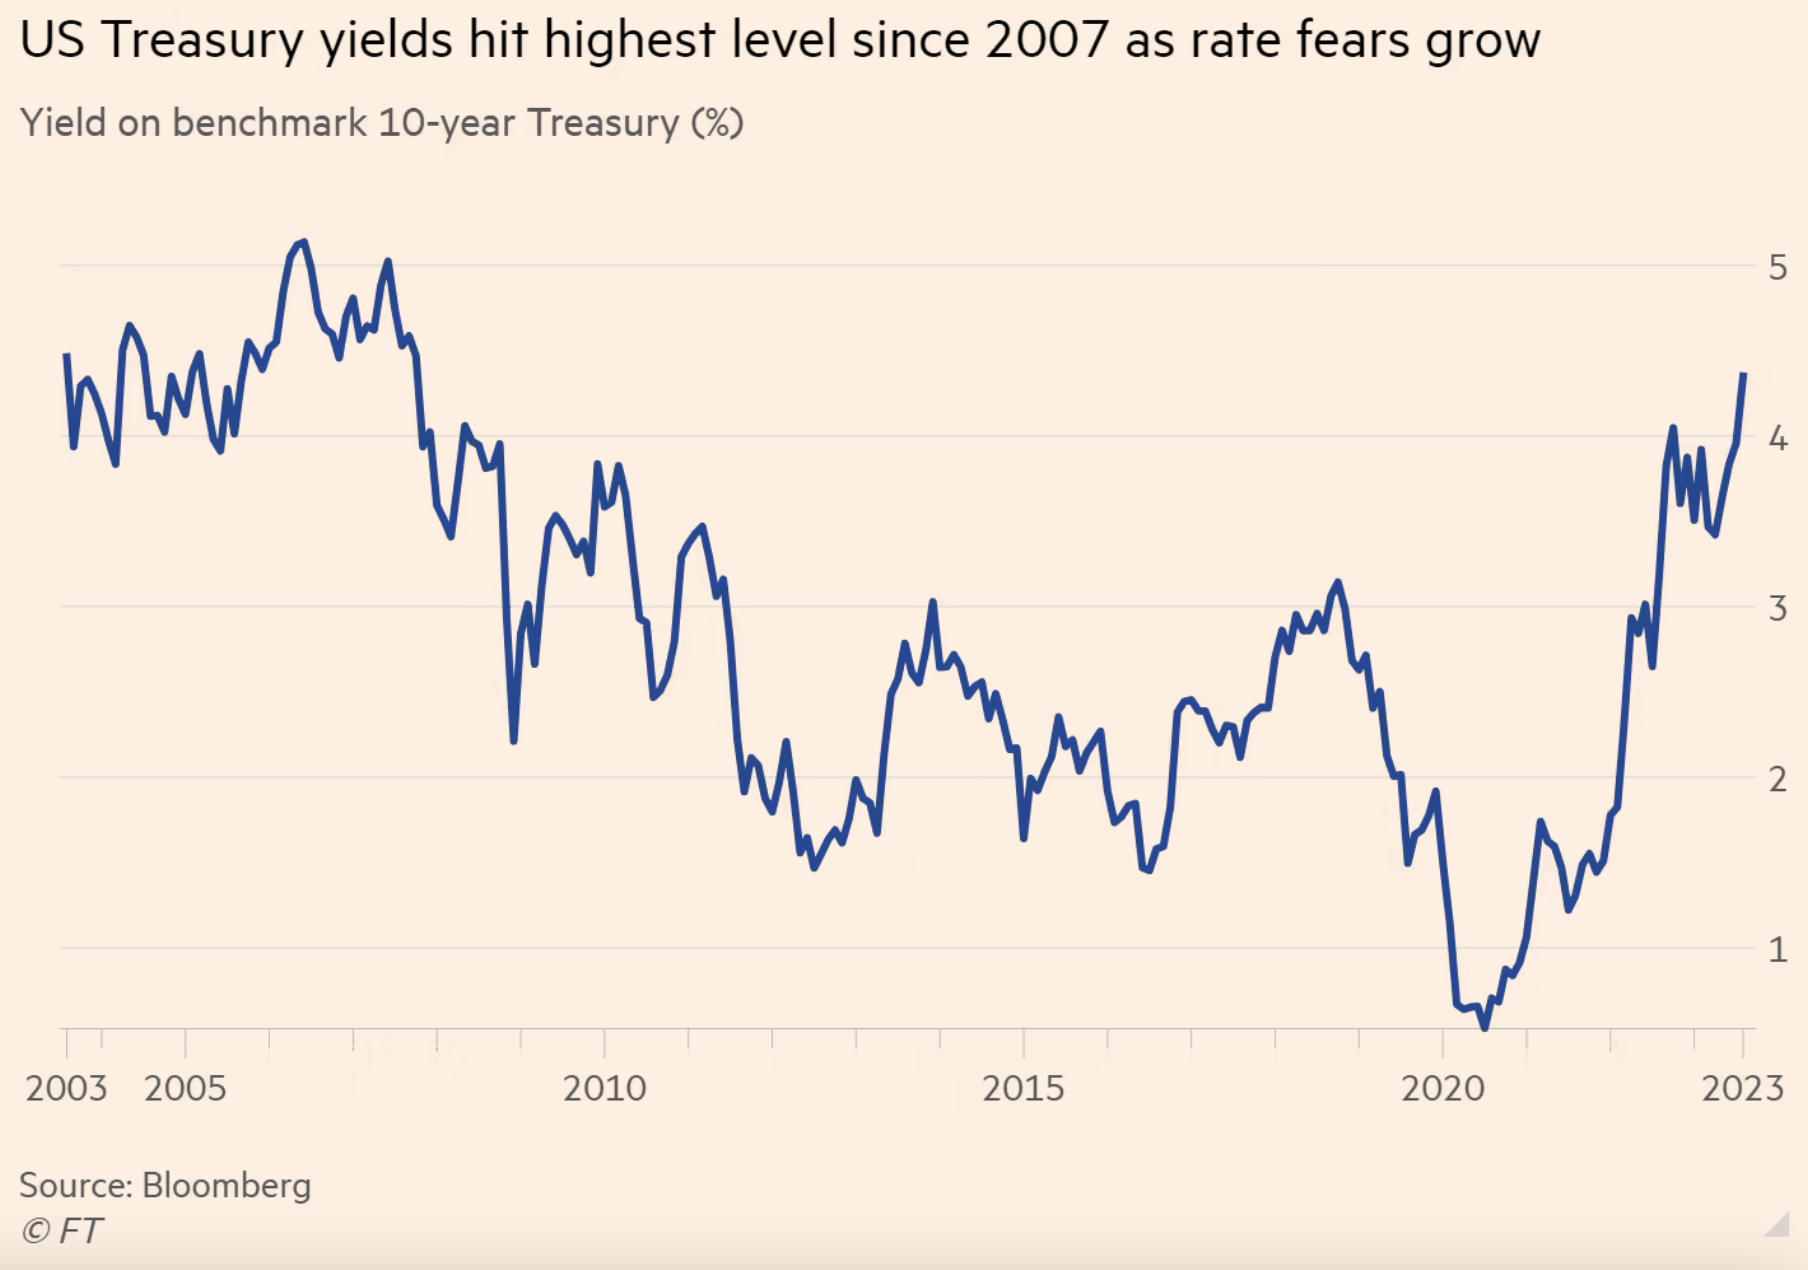
As reported by the Financial Times, the ongoing sell-off in US government bonds persisted on Monday. Yields on benchmark Treasuries reached a 16-year peak, propelled by the economy’s unyielding strength.

Robust economic indicators observed over the summer have prompted uncertainty about the Federal Reserve’s likelihood of initiating rate cuts in the near term – this uncertainty has been a key driver of the bond market’s decline.

The yield on the 10-year note surged by up to 0.1 percentage points, reaching 4.35% on Monday, which exceeded a previous peak in October and marked its highest level since November 2007.

Evolution of the US 10-year yield – Source: Financial TimesThis dynamic reflects the inverse relationship between bond prices and yields – when yields rise, bond prices fall.

The strong economy raises expectations that the Federal Reserve might refrain from implementing rate cuts, as higher interest rates may be needed to curb inflation that is still above target, even if it remains moderate (annual CPI at 3.2% in July) thanks to high interest rates in the country.

So with high inflation and a resilient economy, investors expect the Fed to keep tightening the US monetary policy. When interest rates rise or are expected to keep rising, investors tend to sell existing bonds with lower coupon rates, causing their prices to fall and their yields to rise. This selling pressure is a response to the desire to capture higher yields available in the market due to the increased interest rates.

Jackson Hole Should Offer Some Answers to Investors

The 46th annual Economic Policy Symposium, hosted by the Federal Reserve Bank of Kansas City, is taking place from August 24th to 26th in Jackson Hole, Wyoming. Since its inception in 1978, this symposium has been a platform for discussing crucial economic matters.

This year’s theme, “Structural Shifts in the Global Economy,” will engage experts from various fields to discuss significant enduring changes influencing the global economy, while the disruption of the pandemic is fading.

Despite the recent dip in US inflation, investors are still cautious ahead of the annual gathering about upcoming steps from the FOMC, as they’re expecting to have a clearer view about whether or not the Fed is really ready to pause its tightening cycle. This insight is crucial for investors to adjust their strategies accordingly, as it will impact market sentiment, risk appetite, and asset allocation decisions.

As some investors consider the potential for upcoming rate cuts, the FOMC’s stance seems inclined towards a “higher-for-longer” outlook on interest rates. This approach aims to determine the duration for which the Federal Reserve will uphold elevated interest rates and to pinpoint the recently established neutral interest rate.

This neutral rate neither fosters nor impedes economic growth, raising interest in its determination within the present financial scenario. Powell’s statements could suggest that this rate is now higher than previously believed, adding to the intrigue surrounding the matter.

Disclaimer

CFDs are complex instruments and come with a high risk of losing money rapidly due to leverage. 85% of retail investor accounts lose money when trading CFDs with this provider. You should consider whether you understand how CFDs work and whether you can afford to take the high risk of losing your money.

ActivTrades Corp is authorised and regulated by The Securities Commission of the Bahamas. ActivTrades Corp is an international business company registered in the Commonwealth of the Bahamas, registration number 199667 B.

The information provided does not constitute investment research. The material has not been prepared in accordance with the legal requirements designed to promote the independence of investment research and as such is to be considered to be a marketing communication.

All information has been prepared by ActivTrades (“AT”). The information does not contain a record of AT’s prices, or an offer of or solicitation for a transaction in any financial instrument. No representation or warranty is given as to the accuracy or completeness of this information.

Any material provided does not have regard to the specific investment objective and financial situation of any person who may receive it. Past performance is not a reliable indicator of future performance. AT provides an execution-only service. Consequently, any person acting on the information provided does so at their own risk.

Oil Prices Forecast: OPEC Production Cuts Challenge China’s Demand Dip

Oil Prices Forecast: OPEC Production Cuts Challenge China’s Demand Dip

Oil Prices React to Mixed Market Signals

In recent Asian trading sessions, oil prices experienced a slight upswing. This movement stems from a balance between weak demand cues from China, the globe’s leading importer, and the potential impact of more U.S. rate hikes juxtaposed with possible constraints in oil supply.

China’s Economic Deceleration Impacts Oil Demand

China’s economic health plays a pivotal role in driving global oil demand. However, the world’s second-largest economy has been showing signs of deceleration. Market participants had placed high hopes on various stimulus measures, but the Chinese government’s efforts, such as a smaller-than-anticipated reduction in a key lending benchmark, haven’t met expectations. This lackluster performance casts a shadow over oil demand for the remaining months of this year.

Trading Derivatives carries a high level of risk to your capital and you should only trade with money you can afford to lose. Trading Derivatives may not be suitable for all investors, so please ensure that you fully understand the risks involved, and seek independent advice if necessary. A Product Disclosure Statement (PDS) can be obtained either from this website or on request from our offices and should be considered before entering into a transaction with us. Raw Spread accounts offer spreads from 0.0 pips with a commission charge of USD $3.50 per 100k traded. Standard account offer spreads from 1 pips with no additional commission charges. Spreads on CFD indices start at 0.4 points. The information on this site is not directed at residents in any country or jurisdiction where such distribution or use would be contrary to local law or regulation.

Central Banks’ Meeting Shadows OPEC+

Concurrently, all eyes are on Jackson Hole, Wyoming, as top officials from major global central banks, including the U.S. Federal Reserve, assemble for their annual meet. Investors are treading cautiously, looking for any hints on the future trajectory of interest rates. A higher rate environment, combined with China’s subdued demand, might temporarily eclipse the effects of tightening supply, primarily driven by OPEC+.

OPEC+ Efforts Tighten Oil Supply

On the brighter side for oil markets, supply has been constricting. Saudi Arabia’s initiative to reduce output by 1 million barrels per day from July to September and Russia’s pledge to cut exports by 500,000 bpd in August are prime examples. The collective effort from OPEC+ aims to rein in supply, offering support to prices. Additionally, in the U.S., despite a slight miss in expectations, crude stocks have been dwindling, suggesting a tauter supply landscape.

Short-Term Outlook

In the short-term, while rising interest rates and China’s waning demand present bearish cues, the tightening oil supply could provide a counterbalance. With pivotal events and data releases lined up, including the Energy Information Administration’s weekly report, market participants should brace for potential volatility.

Technical Analysis

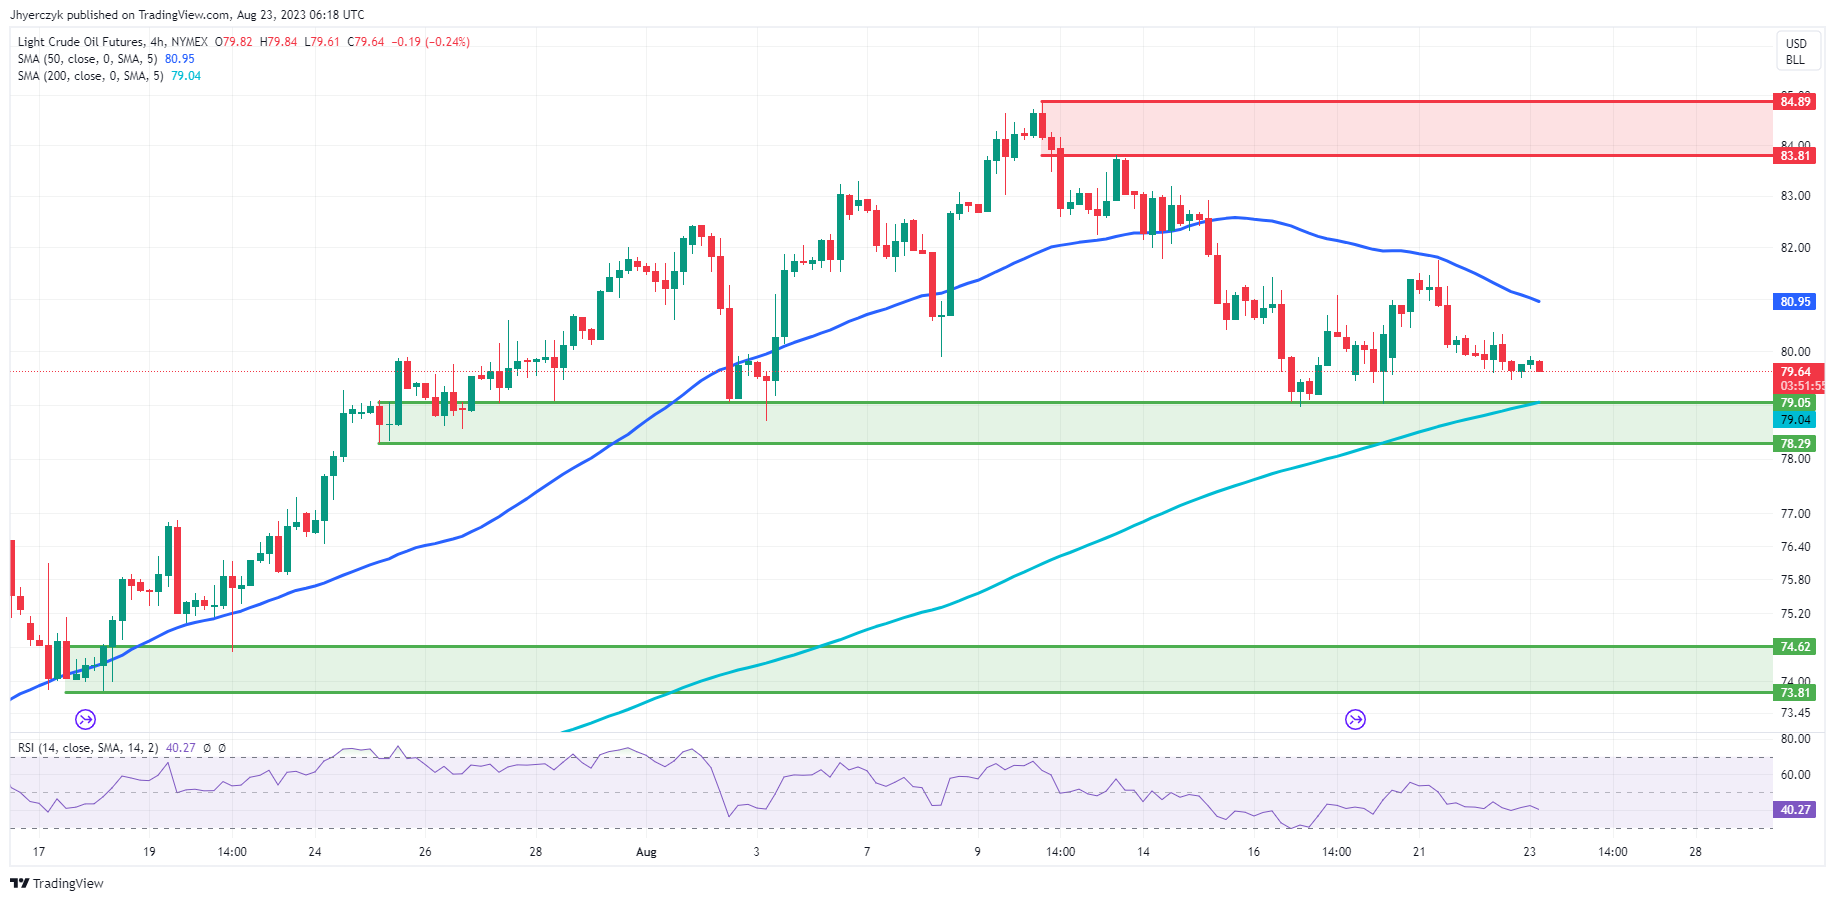
4-Hour Crude OilThe commodity’s price has slightly decreased on the 4-Hour chart, moving from 79.83 to 79.67. This price sits between the 200-4H moving average of 79.04 and the 50-4H moving average of 80.95, indicating a sideways movement or slight bearish momentum. The 14-4H RSI stands at 40.60, suggesting a weaker momentum, although not reaching the oversold territory.

Notably, the current price is hovering just above the main support area, which ranges from 79.05 to 78.29, and remains significantly below the main resistance area, which stretches between 83.81 to 84.89. Considering the moving averages and proximity to the support region, the current market sentiment for crude oil appears to be cautiously bearish.

Dax Index: Navigating Through US and Eurozone PMI Forecasts and Their Impact

Dax Index: Navigating Through US and Eurozone PMI Forecasts and Their Impact

Tuesday Session Overview

The DAX gained 0.66% on Tuesday. Following a 0.19% rise on Monday, the DAX wrapped up the day at 15,706. A bearish end to the session saw the DAX pull back from a session high of 15,799. Another rise in government bond yields weighed on riskier assets.

Monday gains from the US and a bullish Asian session across equity markets on Tuesday delivered an early boost. However, rising government bond yields left the DAX off the session high.

Trading Derivatives carries a high level of risk to your capital and you should only trade with money you can afford to lose. Trading Derivatives may not be suitable for all investors, so please ensure that you fully understand the risks involved, and seek independent advice if necessary. A Product Disclosure Statement (PDS) can be obtained either from this website or on request from our offices and should be considered before entering into a transaction with us. Raw Spread accounts offer spreads from 0.0 pips with a commission charge of USD $3.50 per 100k traded. Standard account offer spreads from 1 pips with no additional commission charges. Spreads on CFD indices start at 0.4 points. The information on this site is not directed at residents in any country or jurisdiction where such distribution or use would be contrary to local law or regulation.

There were no euro area economic indicators to provide direction. However, US housing sector numbers and uncertainty surrounding Fed monetary policy tested buyer appetite.

Investors remain divided on Fed interest rates, with the hawks expecting one final rate hike before the end of the year. However, other investors expect the Fed to wait for the next round of US economic indicators before providing guidance. With investors focused on the Jackson Hole Symposium, uncertainty is influencing.

The S&P 500 and the Dow fell by 0.28% and 0.51%, respectively, while the NASDAQ rose by 0.06%. Bank stocks struggled on the news of S&P Global downgrading US banks exposed to the real estate sector. Falling oil and natural gas prices weighed on energy stocks.

Daily Chart sends mixed price signals.

Tuesday’s Market Movers

The auto sector had another mixed session on Tuesday. BMW and Mercedes-Benz Group rose by 0.46% and 0.37%, respectively. Porsche gained 0.18%, while Volkswagen ended the day up 0.02%. The gains were modest, with recessionary fears weighing on the demand outlook.

Continental AG bucked the trend, falling by 0.17% after rallying by 5.87% on Monday as investors reacted to plans to sell the ContiTech car unit. Continental is undergoing reorganization to boost profitability.

Bank stocks avoided losses. Commerzbank and Deutsche Bank rose by 0.05% and 0.26%, respectively.

Infineon was among the best performers, gaining 2.71%. Tech stocks found support after the NASDAQ rally on Monday.

The Day Ahead for the DAX

Prelim private sector PMI figures for France, Germany, and the Eurozone will impact market risk sentiment.

The Germany economy stumbled into the third quarter. Weak economic indicators raised the chances of a sustained recession. However, the PMI numbers will influence investor sentiment and the ECB. A deeper contraction across the German manufacturing sector and weaker service sector activity will impact the DAX.

Economists forecast the German manufacturing PMI to fall from 38.8 to 38.7. Significantly, economists expect the German services PMI to fall from 52.3 to 51.5. A fall below 51 would likely spook investors.

While the German PMIs will have more impact, we expect the DAX to react to the Eurozone PMIs. Economists forecast the Eurozone Services PMI to fall from 50.9 to 50.5. A fall to sub-50.0 would signal a contraction and force the ECB to reconsider another interest rate hike. The manufacturing sector will likely continue to contract in August.

The US services PMI will test investor sentiment toward the US economy and the Fed. An unexpected contraction in the US services sector would reignite fears of a US recession. Economists forecast the August services PMI to fall from 52.3 to 52.2. A rise in the services PMI would increase the chance of a Fed rate hike.

DAX Technical Indicators

After two positive sessions, the DAX remained above the 15,600 – 15,525 support band. However, DAX sat below the 50-day and 200-day EMAs, sending bearish near and longer-term price signals.

Looking at the 14-4H RSI, the RSI sits at 46.45, reflecting bearish sentiment, with selling pressure overweighing buying pressure. Significantly, the RSI aligns with the EMAs signaling a fall through the 15,600 – 15,525 support band to give the bears a run at sub-15,500.

Price action hinges on the euro area and US prelim private sector PMIs.

DAX 4-hourly chart sends bearish price signals.