US Dollar Dip Pauses as Markets Reassess Fed Moves and China Concerns. Lower USD?

US Dollar Dip Pauses as Markets Reassess Fed Moves and China Concerns. Lower USD?

The US Dollar has steadied the ship going into Thursday after disappointing data overnight that may indicate rough waters ahead for the US economy.

Annualised GDP for the second quarter was revised down to 2.1% from 2.4% and the ADP employment report missed estimates. It showed that 177k jobs were added in August rather than the 195k anticipated.

In a classic case of bad news is good news, this led to speculation that the Federal Reserve might not need to be as aggressive in its monetary policy settings as previously thought.

Equities appear to like that angle with Wall Street recovering from early losses in the cash session to finish the day with modest gains. The Nasdaq was the best performer, eking out a 0.54% uplift. Futures are pointing to a quiet start to the cash session ahead.

APAC stock markets have had a mixed day with Australian and Japanese indices slightly in the green, while the bourses on mainland China and Hong Kong edged into the red.

Country Garden, one of China’s largest property players, revealed further problems and signalled that a debt default could happen after reporting a record loss of US$ 7 billion for the first half of this year.

Official Chinese manufacturing PMI for August beat estimates of 49.2 to print at 49.7, but it wasn’t enough to overcome lingering concerns around the property sector.

Japanese industrial production figures month-on-month to the end of July came in at -2.0% instead of the anticipated -1.4%. USD/JPY dipped toward 145.75 in the aftermath before recovering back above 146.

Crude oil has held on to recent gains with the WTI futures contract above US$ 81.50 bbl while the Brent contract is near US$ 86 bbl. Likewise, spot gold is holding above US$ 1,940.

Looking ahead, Euro-wide CPI data will be released ahead of US jobless claims.

DXY (USD) INDEX TECHNICAL ANALYSIS

The DXY (USD) index steadied today after notching up 3-days of losses and crashing below an ascending trendline.

Support could be at 102.58 which is the 38.2% Fibonacci Retracement level of the move from 99.58 up to 104.45. The 50% retracement of the same move may also provide support near 102.00.

Between those levels, the 55- and 100-day simple moving averages (SMA) might provide support, currently in the 102.35 – 102.50 area.

On the topside, nearby resistance could be at the 10-day SMA which is near a historical breakpoint at 103.57. Further up, the prior peak at 104.45 and 104.70 may offer resistance.
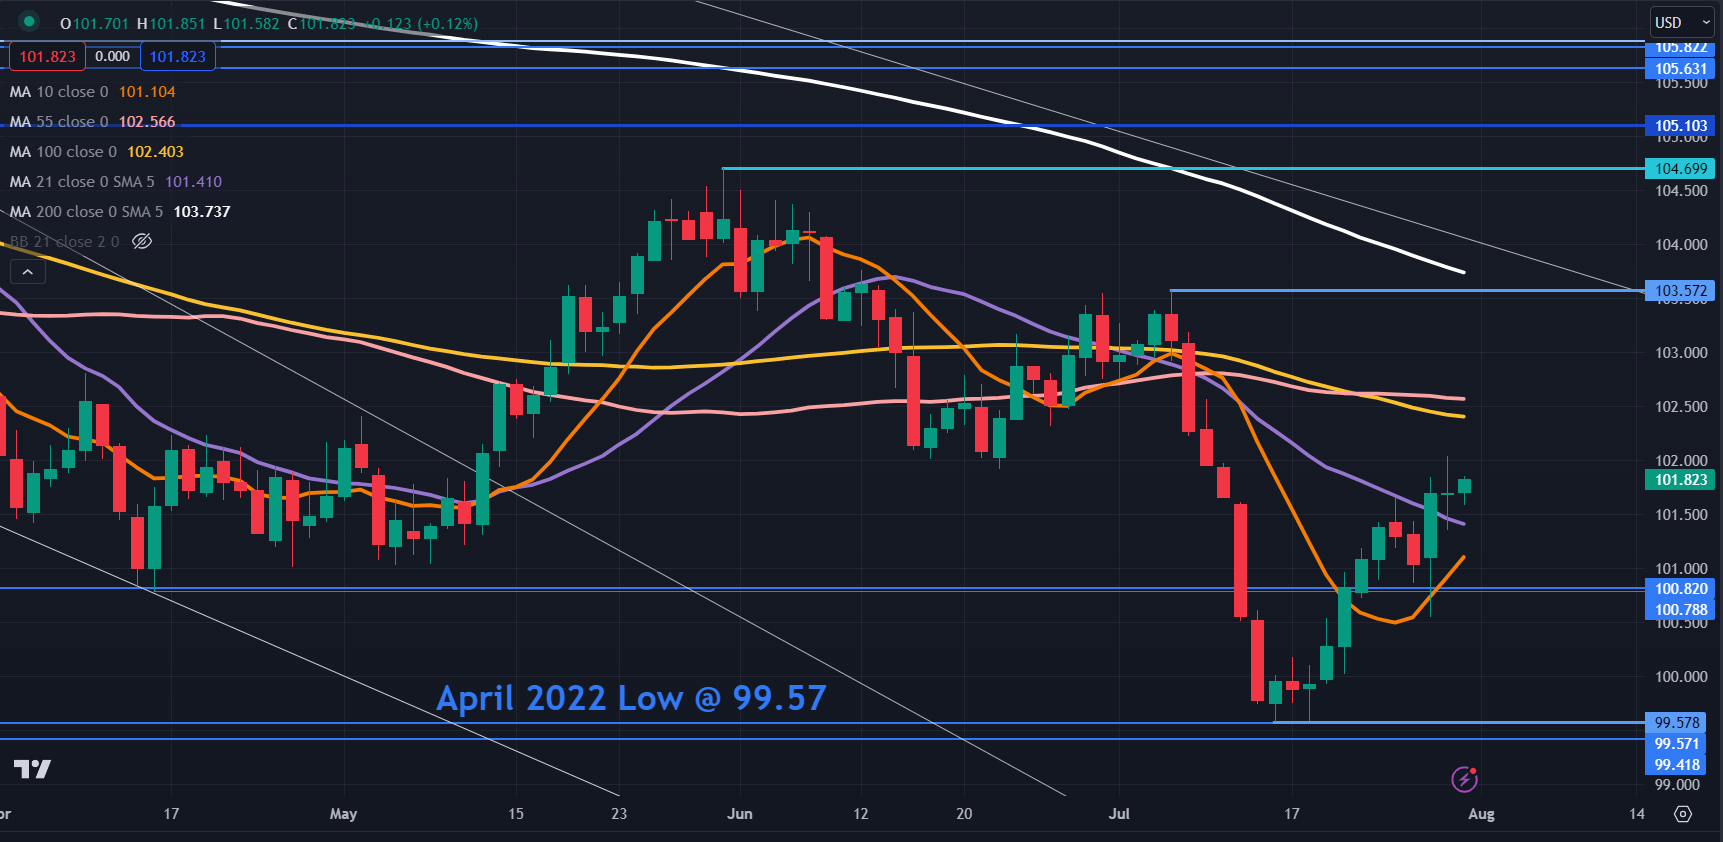
image1.png


China PMI Bounce Yet to Excite HK/China Equities: Hang Seng, CSI 300 Price Setups

China PMI Bounce Yet to Excite HK/China Equities: Hang Seng, CSI 300 Price Setups

The improvement in China’s manufacturing activity is yet to impress Hong Kong/China equities. Indeed, the Hang Seng Index has surrendered its early gains.

China NBS manufacturing PMI rose slightly to 49.7 in August vs. 49.4 expected, and 49.3 in July. NBS non-manufacturing PMI slowed to 51.0 vs. 51.1 expected and 51.5 in July. While the manufacturing sector is still in contraction territory, the improvement provides comfort that the recent stimulus measures are spilling over the economy.

CSI 300 Index Daily Chart

image1.png

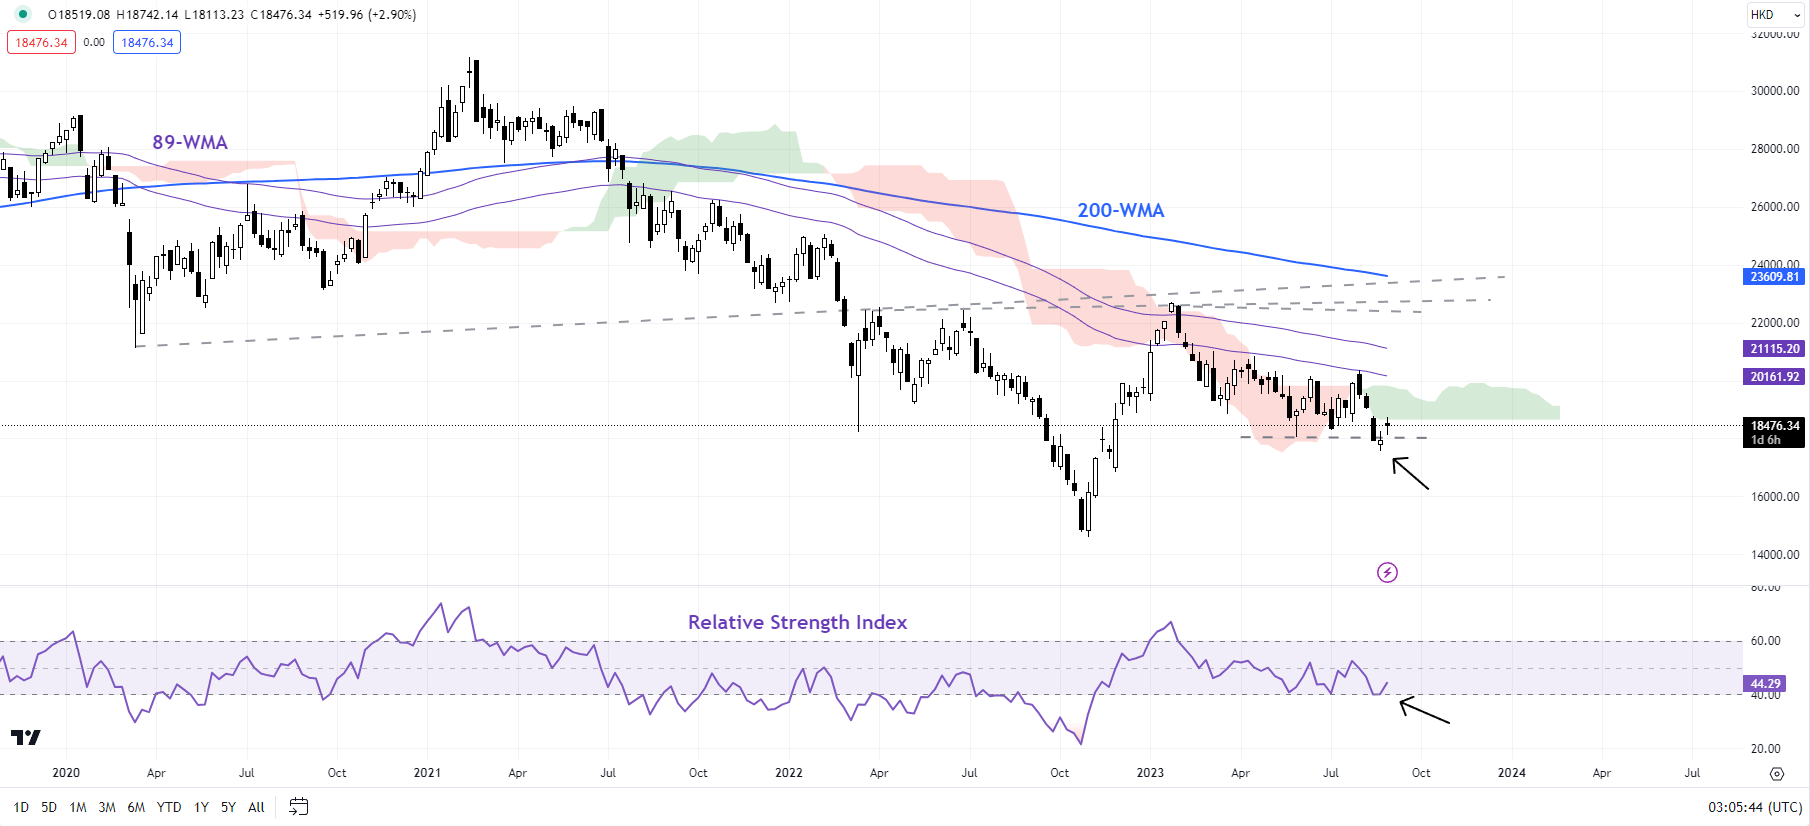
Thursday’s data is in line with the recent less-worse-than-expected China macro data which broadly have been underwhelming, according to the Economic Surprise Index (ESI). The China ESI has rebounded slightly recently, but it is not too far from mid-2020 lows (Covid levels) which has prompted analysts to downgrade growth estimates for the current year.

Hang Seng Index Weekly Chart

image2.png

Meanwhile, Chinese policymakers have responded with a spate of stimulus measures in recent weeks in an attempt to revive the faltering post-Covid recovery and a struggling property sector. However, the targeted measures are yet to translate into undervalued Hong Kong/China equities probably need more than just targeted stimulus measures to witness a sustainable rebound.

Hang Seng: Feeble rebound so far

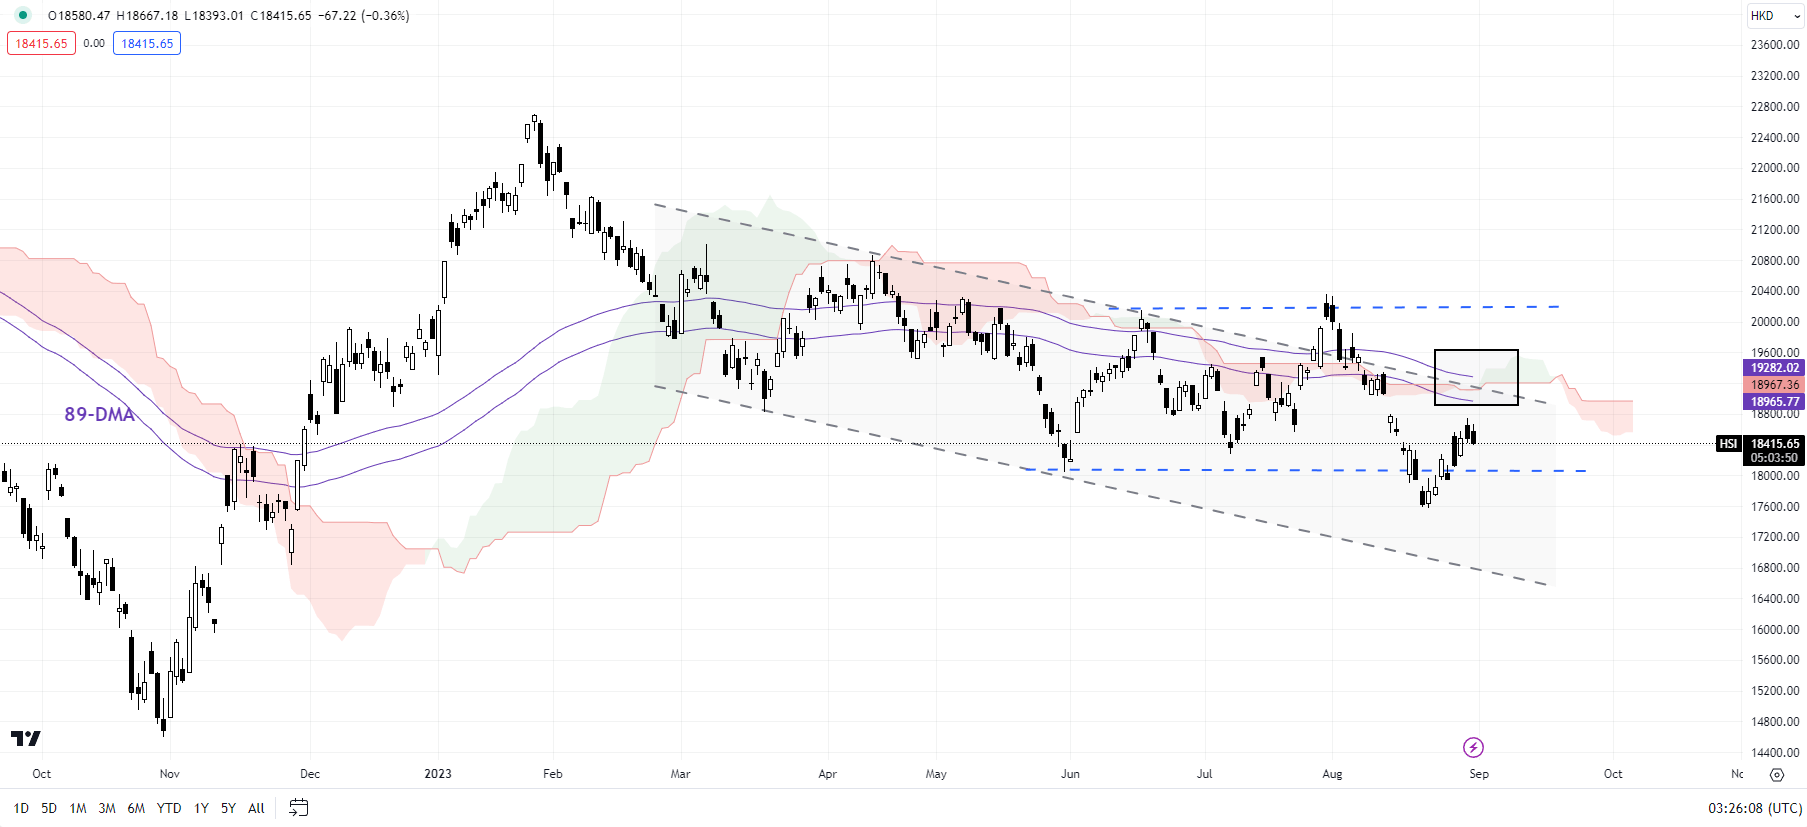
On technical charts, the Hang Seng Index is attempting to rebound from near quite strong converged support at the May low of about 18000, slightly above the lower edge of a declining channel since early 2023 (now at about 16850). As highlighted in the previous update, this support area is crucial – any break below would raise the odds that the November-January 2023 rebound is over, shifting the balance of risks toward the downside. See “HK/China Equities Test the Line in the Sand; Hang Seng, CSI 300 Price Setups,” published August 17.

Hang Seng Index Daily Chart

image3.png

The rebound in recent days is a welcome sign for bulls, but the index needs to clear the initial hurdle at 18500-19000 for the immediate bearish risks to fade. A stronger signal that a meaningful rally was underway would be a crack above the mid-June high of 20155. Until then, the balance of risks remains tilted toward the downside.

CSI 300 Index Monthly Chart

image4.png

CSI 300: No material strength yet

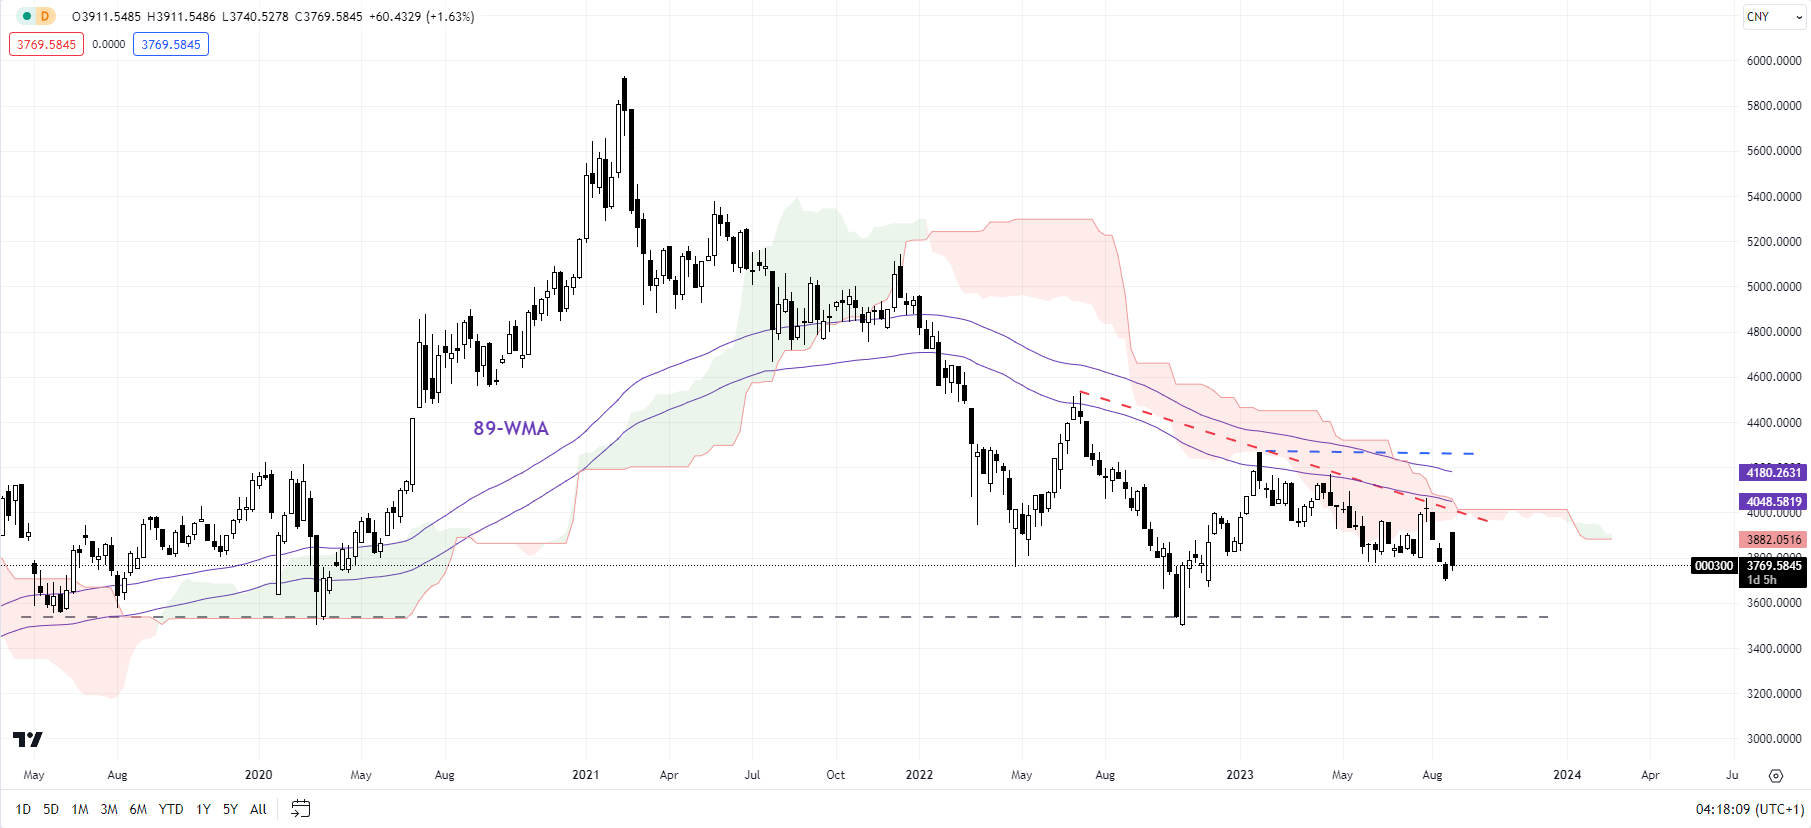
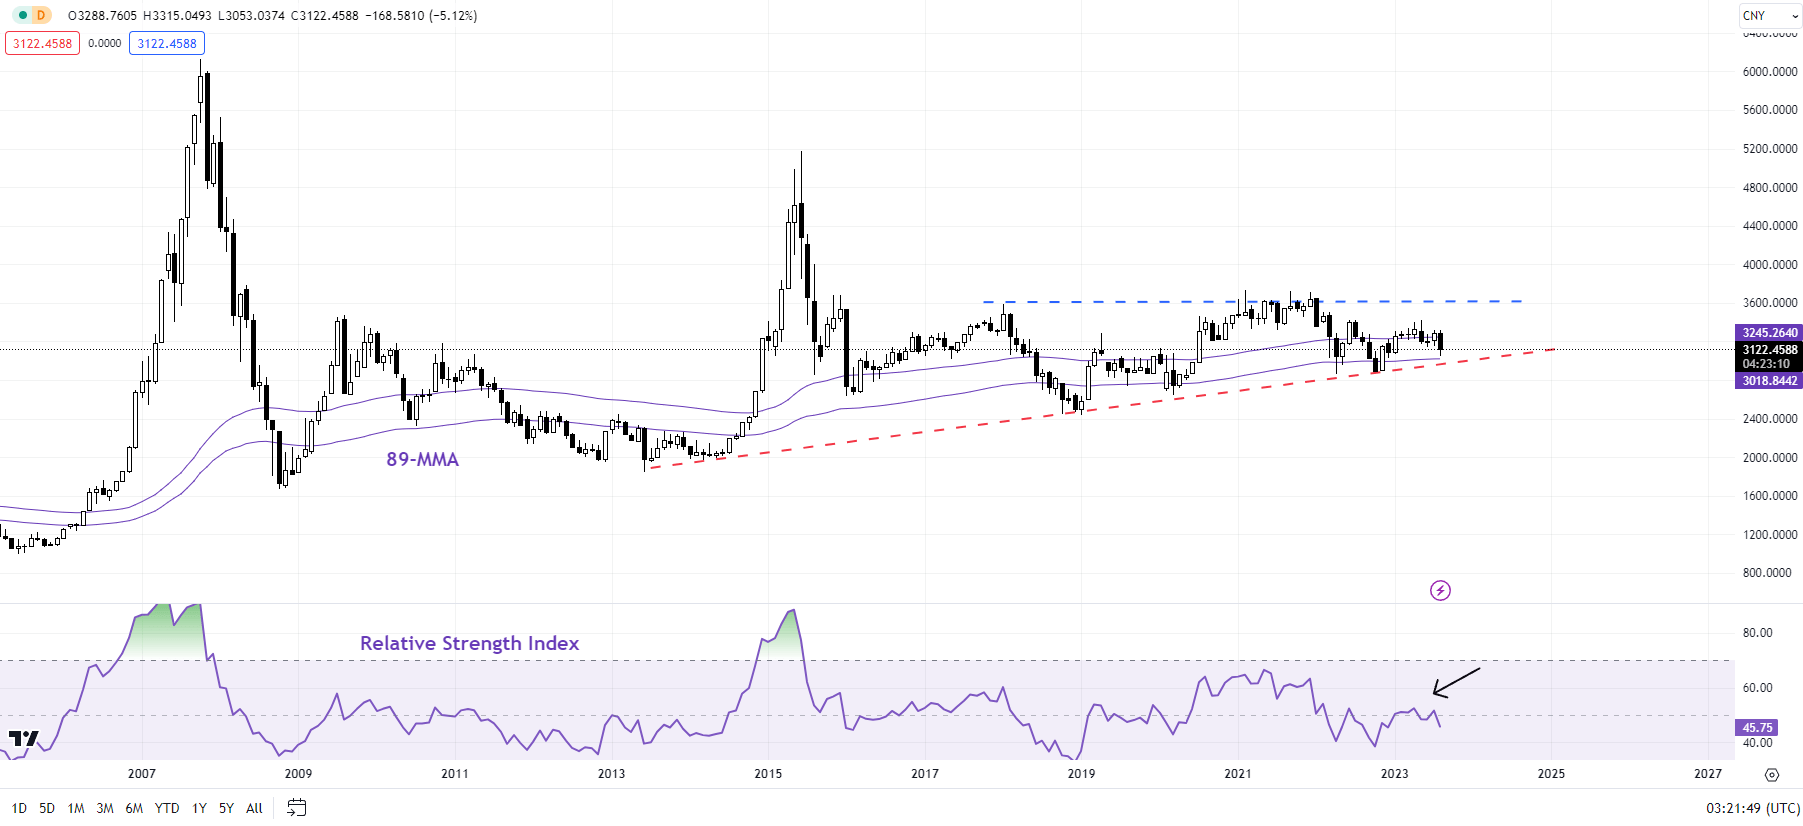
The CSI 300 index has been guided lower by the downward-sloping 89-week moving average, roughly around a downtrend line from mid-2022. The index has immediate resistance at the August high of 4065 to grapple with followed by the February high of 4268, slightly under the 200-week moving average (now at about 4400). Unless the 4300-4400 barrier is cleared, the broader bias remains sideways to down.

On the downside, major support has been on a horizontal trendline since 2019 (at about 3500). Any break below could initially pave the way toward the 2019 low of 2935

USD to CAD Prices Forecast: Steady Amid Fed, BOC Uncertainties

USD to CAD Prices Forecast: Steady Amid Fed, BOC Uncertainties

USD to CAD Movement Amidst External Factors

The USD to CAD saw an upswing on Wednesday, rebounding from a notable drop the day prior. The Canadian Dollar was influenced by falling gold and silver prices, though buoyed by resilient crude oil prices. This movement came in the wake of a drastic fall in the U.S. JOLTS job openings data for July, which hit a 2-1/2 year low, sending the U.S. Dollar on one of its steepest monthly declines. Eyes are now on the upcoming monthly non-farm payrolls report this Friday, a significant data point for U.S. employment metrics.

U.S. Outlook: Treasury Yields and Federal Reserve’s Stance

Market participants are closely monitoring U.S. Treasury yields. The two-year yield, closely tied to anticipated monetary policy shifts, touched 4.871% before steadying around 4.9%. Meanwhile, the 10-year yield lingered near 4.13%. Given the recent data and market sentiment, there’s an 86.5% chance the Federal Reserve will keep rates unchanged on September 20. However, the November meeting paints a more ambiguous picture, with rate hike probabilities nearing a toss-up. Federal Reserve Chair Jerome Powell has hinted at possible tightening, emphasizing inflationary concerns.

Trading Derivatives carries a high level of risk to your capital and you should only trade with money you can afford to lose. Trading Derivatives may not be suitable for all investors, so please ensure that you fully understand the risks involved, and seek independent advice if necessary. A Product Disclosure Statement (PDS) can be obtained either from this website or on request from our offices and should be considered before entering into a transaction with us. Raw Spread accounts offer spreads from 0.0 pips with a commission charge of USD $3.50 per 100k traded. Standard account offer spreads from 1 pips with no additional commission charges. Spreads on CFD indices start at 0.4 points. The information on this site is not directed at residents in any country or jurisdiction where such distribution or use would be contrary to local law or regulation.

Canada’s Economic Health and BoC’s Decisions

All eyes are on Canada’s impending second-quarter GDP report. Predictions indicate a significant deceleration, with growth expected at 1.1%, a drop from the previous quarter’s 3.1%. This rate is also lower than the Bank of Canada’s (BoC) 1.5% projection. Inflation is rising, but the slowdown may prompt the BoC to pause on interest rate hikes. However, their decisions remain contingent on fresh economic data, considering other variables like wildfires and civil strikes that might impact the figures.

Rate Trajectory for BoC

In July, the BoC raised its key rate to a 22-year high of 5%. Financial markets currently see a 70% likelihood of a pause in rate hikes this September. Yet, a tilt towards further tightening by year’s end is evident. Factors such as the dock workers’ strike and June’s GDP decline hint at the possibility of a negative GDP for Q3. If domestic demand remains robust, the BoC could still favor a rate hike in September.

Short-Term Forecast: Mixed Sentiment

The landscape suggests a bearish short-term sentiment for the U.S. Dollar against the CAD. Yet, evolving economic data from both nations will play a critical role in determining future currency movements and central bank decisions.

Technical Analysis

4-Hour USD to CADThe current 4-hour price of 1.3563 aligns precisely with the previous 4-hour close, indicating a flat market with no price change over the period. The price is above the 200-4H moving average of 1.3373, suggesting an underlying bullish trend. However, it’s just below the 50-4H moving average of 1.3564, which could indicate a slight bearish sentiment in the shorter term. The 14-4H RSI stands at 46.27, suggesting slightly weakened momentum.

While the currency pair is trading just above the main support area of 1.3508 to 1.3495, it’s below the main resistance area of 1.3612 to 1.3654. Based on these metrics, the market sentiment appears to be cautiously bearish in the short term.

Oil Prices Forecast: US Inventory Plunge, OPEC Cuts Fuel Bullish Response

Oil Prices Forecast: US Inventory Plunge, OPEC Cuts Fuel Bullish Response

Overview

Oil prices witnessed a surge on Wednesday, influenced by multiple factors including a significant drawdown in U.S. crude inventories and concerns regarding Hurricane Idalia in the Gulf of Mexico. A declining U.S. dollar further accentuated the demand for oil.

Inventory Draw and Dollar Dynamics

The U.S. experienced a sharp decline in crude stocks, with an 11.5 million barrel reduction for the week ending August 25, far surpassing the predicted average draw of 3.3 million barrels. This suggests a robust demand in the oil market. Additionally, the dip in the U.S. dollar index after less-than-expected job openings in July has indirectly supported the oil prices. A weaker dollar renders dollar-priced oil less expensive for holders of other currencies.

Hurricane Idalia and Gulf Productions

Hurricane Idalia has become a focal concern for investors. The Gulf of Mexico contributes approximately 15% of U.S. oil output. Despite initial worries, the current trajectory predicts the hurricane will veer eastwards, avoiding major oil facilities. Chevron Corp has taken precautions by evacuating some staff, though its operations in the Gulf remain uninterrupted. However, the storm’s presence underscores potential future disruptions in the region, given expectations of a turbulent hurricane season.

Global Supply and Demand Factors

Saudi Arabia’s possible continuation of its voluntary output cut into October has raised anticipation of tighter oil supply. In response, experts believe Saudi Arabia will elevate their selling prices, particularly for crude supplied to Asian markets. Conversely, China’s uncertain economic situation, despite some recovery in July, casts a shadow over the demand side. As the world’s largest oil importer, any significant economic downturn in China might dampen global oil prices.

Short-Term Forecast

While the immediate oil market appears bullish due to reduced U.S. inventories and potential output cuts by Saudi Arabia, concerns over China’s economy and the overarching macroeconomic environment can introduce volatility. Hurricane Idalia, though not directly impacting major oil platforms, highlights the unpredictable nature of the industry and the potential for unexpected disruptions in supply.

Technical Analysis

4-Hour Light Crude OIl FuturesLight Crude Oil Futures are currently trading at $81.47, just under the minor decrease from the previous 4-hour price of $81.59. The commodity is hovering above both the 200-4H moving average of $79.82 and the 50-4H moving average of $79.95, indicating a potential bullish sentiment. The 14-4H RSI reading stands at 61.68, suggesting strengthening momentum but not yet in the overbought territory.

The current price is resting at the lower edge of the main resistance area between $81.47 and $81.75, with a notable support base between $79.05 and $78.29. Overall, the market sentiment leans bullish.

DAX Index: German Inflation and US Employment Affecting DAX Market Trends

DAX Index: German Inflation and US Employment Affecting DAX Market Trends

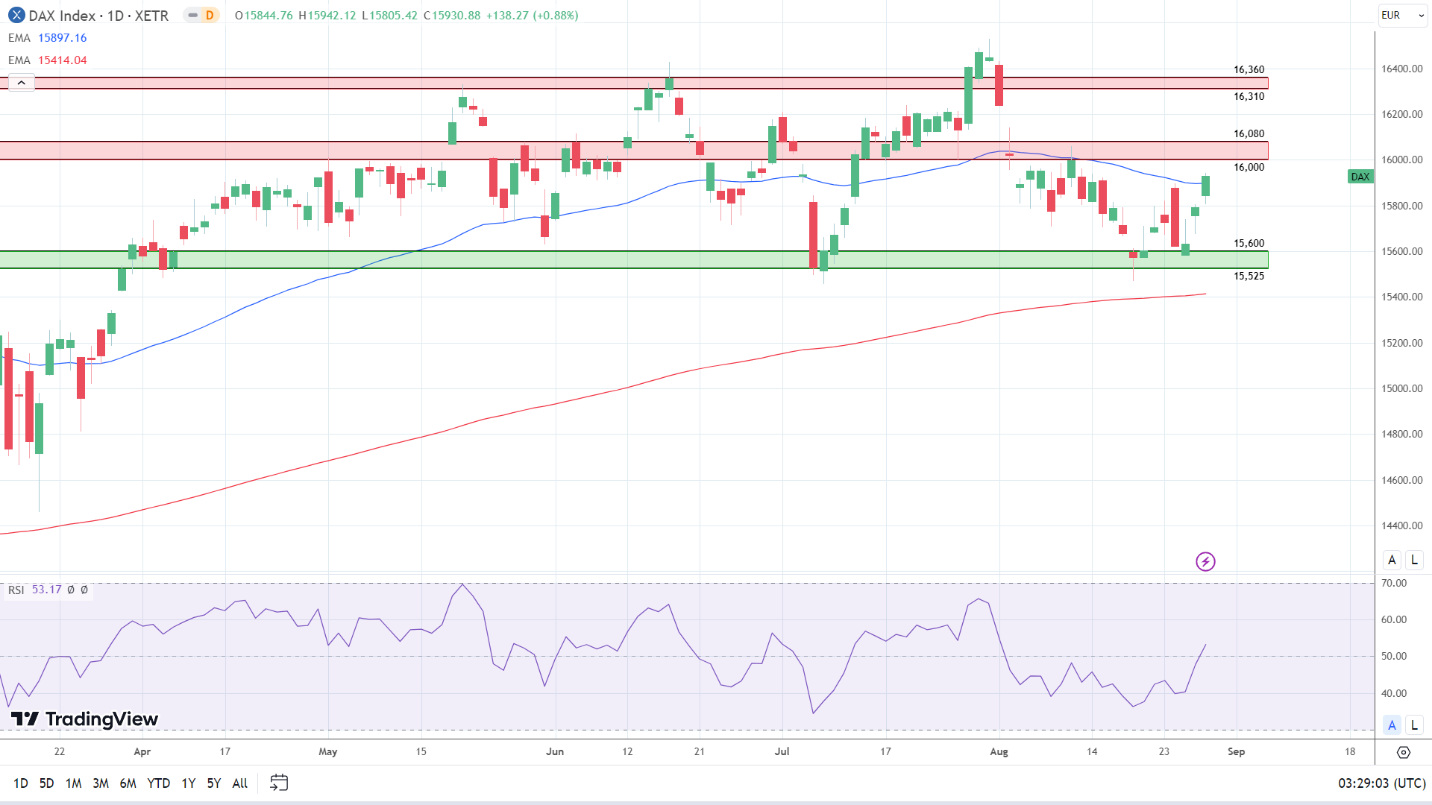
On Tuesday, the DAX extended the winning streak to three sessions, gaining 0.88%. Following a 1.03% rally on Monday, the DAX ended the day at 15,931.

Reports of the PBoC planning to cut the Reserve Ratio Requirement supported a bullish Asian session. The DAX tracked the US and Asian markets into positive territory. The PBoC rumors followed Beijing’s efforts to ease pressure on the Chinese equity markets by reducing the stamp duty on stock trading.

Trading Derivatives carries a high level of risk to your capital and you should only trade with money you can afford to lose. Trading Derivatives may not be suitable for all investors, so please ensure that you fully understand the risks involved, and seek independent advice if necessary. A Product Disclosure Statement (PDS) can be obtained either from this website or on request from our offices and should be considered before entering into a transaction with us. Raw Spread accounts offer spreads from 0.0 pips with a commission charge of USD $3.50 per 100k traded. Standard account offer spreads from 1 pips with no additional commission charges. Spreads on CFD indices start at 0.4 points. The information on this site is not directed at residents in any country or jurisdiction where such distribution or use would be contrary to local law or regulation.

However, German consumer sentiment figures tested buyer appetite before a US session breakout. The German GfK Consumer Climate Index fell from -24.6 to -25.5. Economists forecast a more modest fall to -24.3.

US consumer confidence also waned, with the CB Consumer Confidence Index falling from 114.0 to 106.1 in August. A slide in consumer confidence and a marked fall in JOLTs job openings eased bets on further Fed rate hikes, supporting riskier assets. JOLTs job openings fell from 9.165 million to 8.827 million in July.

The US equity markets responded to the shift in sentiment toward Fed monetary policy. On Tuesday, the NASDAQ rallied 1.74% on Monday, with the Dow and S&P 500 ending the day up 0.85% and 1.45%, respectively.

Daily Chart turns bullish.

The Tuesday Market Movers

Listed companies exposed to China and tech stocks continued to make gains, while banks were also on the front foot.

Siemens Energy (+2.71%), Siemens AG (+1.51%), Infineon (+1.90%), and Adidas (+2.09%) were among the leading stocks.

Today, economic indicators from the euro area and the US will need consideration. Significantly, an unexpected pickup in German inflationary pressures would weigh on the DAX, with the ECB maintaining a hawkish policy stance.

However, stimulus hopes from Beijing will provide comfort ahead of the US session.

German Inflation and US ADP Nonfarm Employment in Focus

This morning, the Asian equity markets were on the charge for the third consecutive session. Market reaction to the Tuesday US economic indicators and influence on Fed interest rate expectations supported a breakout session.

Hopes of more stimulus from Beijing contributed to the positive first half of the week.

However, German inflation figures must reflect ECB efforts to curb inflation. Hotter-than-expected inflation would support a September ECB rate hike amidst a gloomy macroeconomic environment. Economists forecast the annual inflation rate to soften from 6.2% to 6.0%.

While the German inflation numbers will draw interest, we expect the US economic indicators to have more impact. ADP nonfarm employment change and second estimate GDP numbers for Q2 will be in focus.

After the unexpected slides in job openings and consumer confidence, a worse-than-expected rise in nonfarm payrolls and a downward revision to GDP numbers would test buyer appetite. Investors expect the Fed to end its monetary policy tightening cycle following the numbers on Tuesday. Investor focus on the Fed could shift to the US economy if the US economic indicators reflect a sharp shift in labor market conditions.

While a Fed hold on interest rates is bullish, the risk of a US economic recession would be bearish. Economists forecast the ADP to report a 195k increase in nonfarm employment, down from 394k in July.

The Futures markets point to another bullish day ahead, with the DAX 30 up 48 points and the Dow mini gaining 47 points this morning.

DAX Technical Indicators

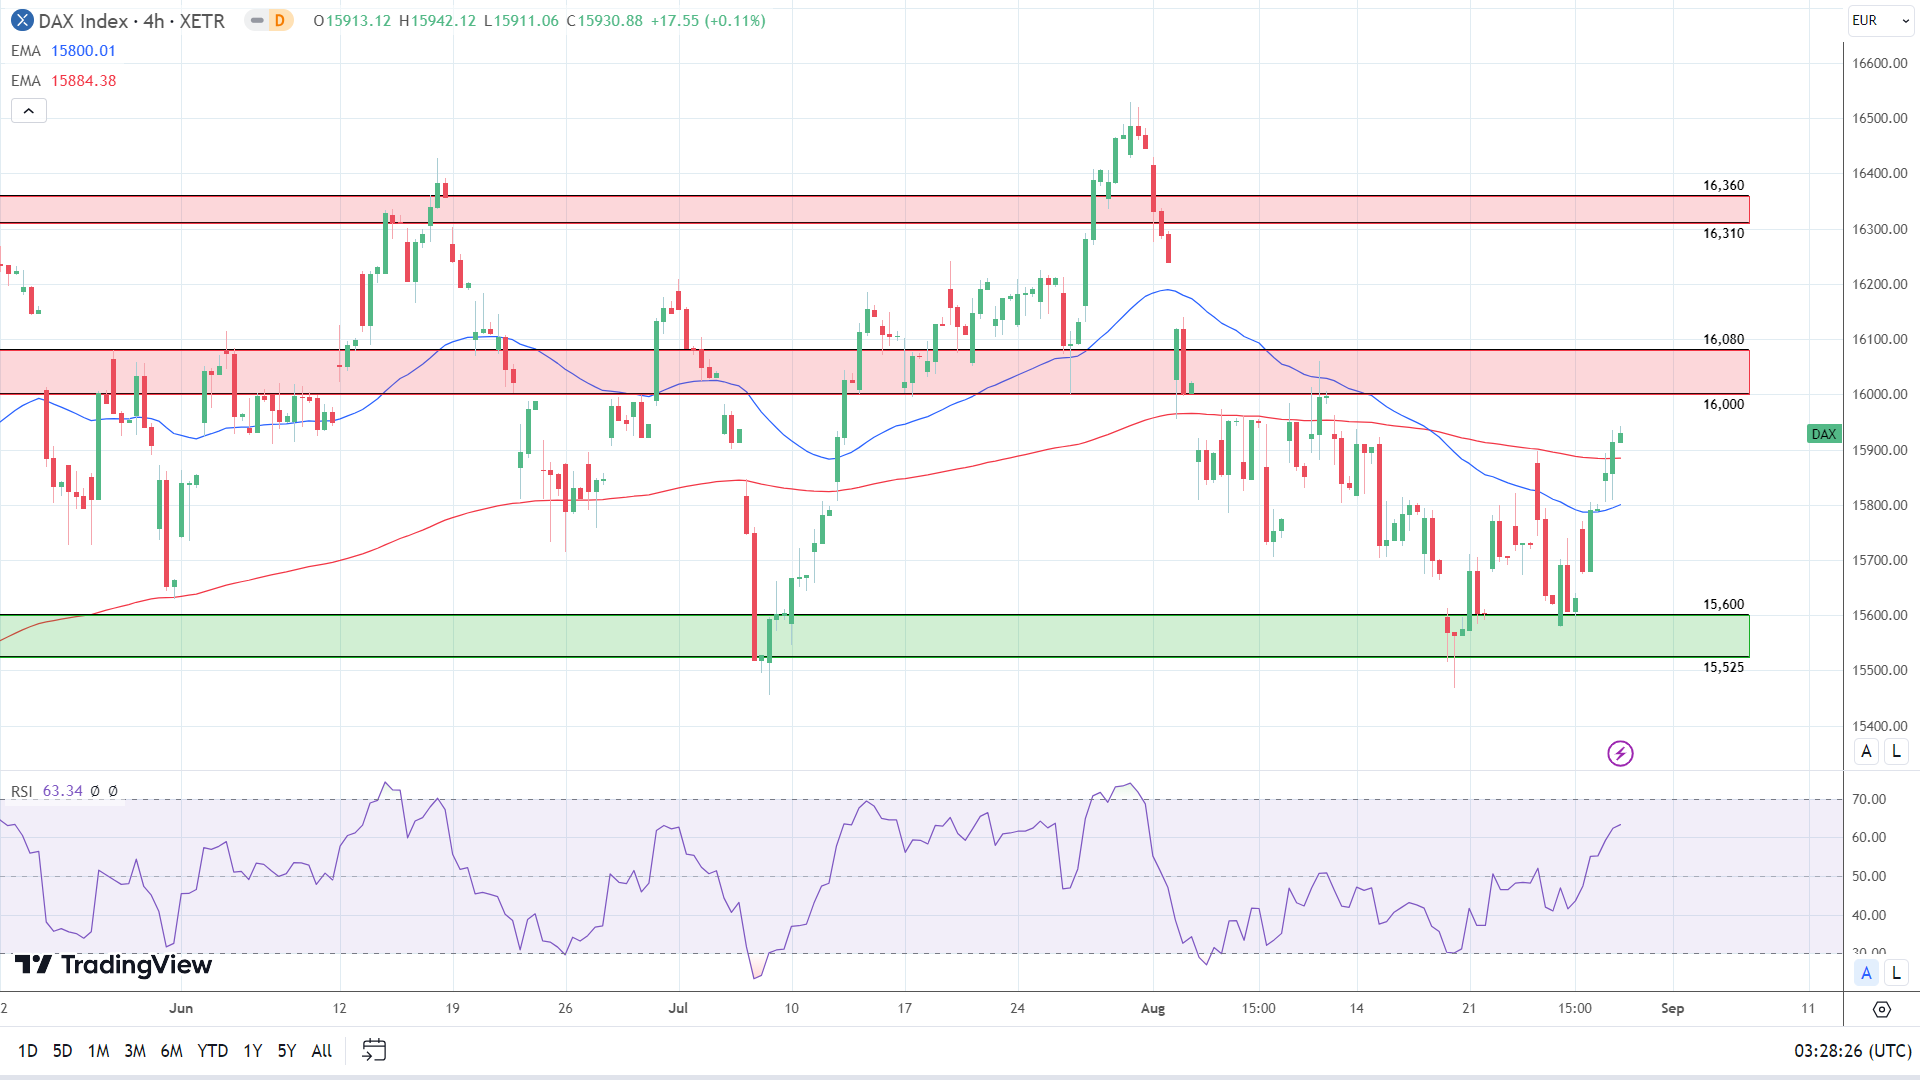
The 4-Hourly Chart sends bullish near and longer-term price signals, with the DAX breaking through the 200-day EMA on Tuesday. German inflation and US ADP Nonfarm Employment figures must be market-friendly to support a run at the 16,000 – 16,080 resistance band.

However, hotter-than-expected German inflation numbers and a sharp increase in nonfarm employment would send the DAX through the 200-day EMA to bring the 50-day EMA into play. A fall through the 50-day EMA would signal a bullish-trend reversal.

The 14-4H RSI reading of 63.34 gives the DAX plenty of room to run before hitting overbought territory.

4-Hourly Chart affirms bullish shift
DAX 300823 4-Hourly Chart
EUR/USD Forecast: ECB Bets and US ADP Numbers to Influence EUR USD Analysis

EUR/USD Forecast: ECB Bets and US ADP Numbers to Influence EUR USD Analysis

Tuesday Overview

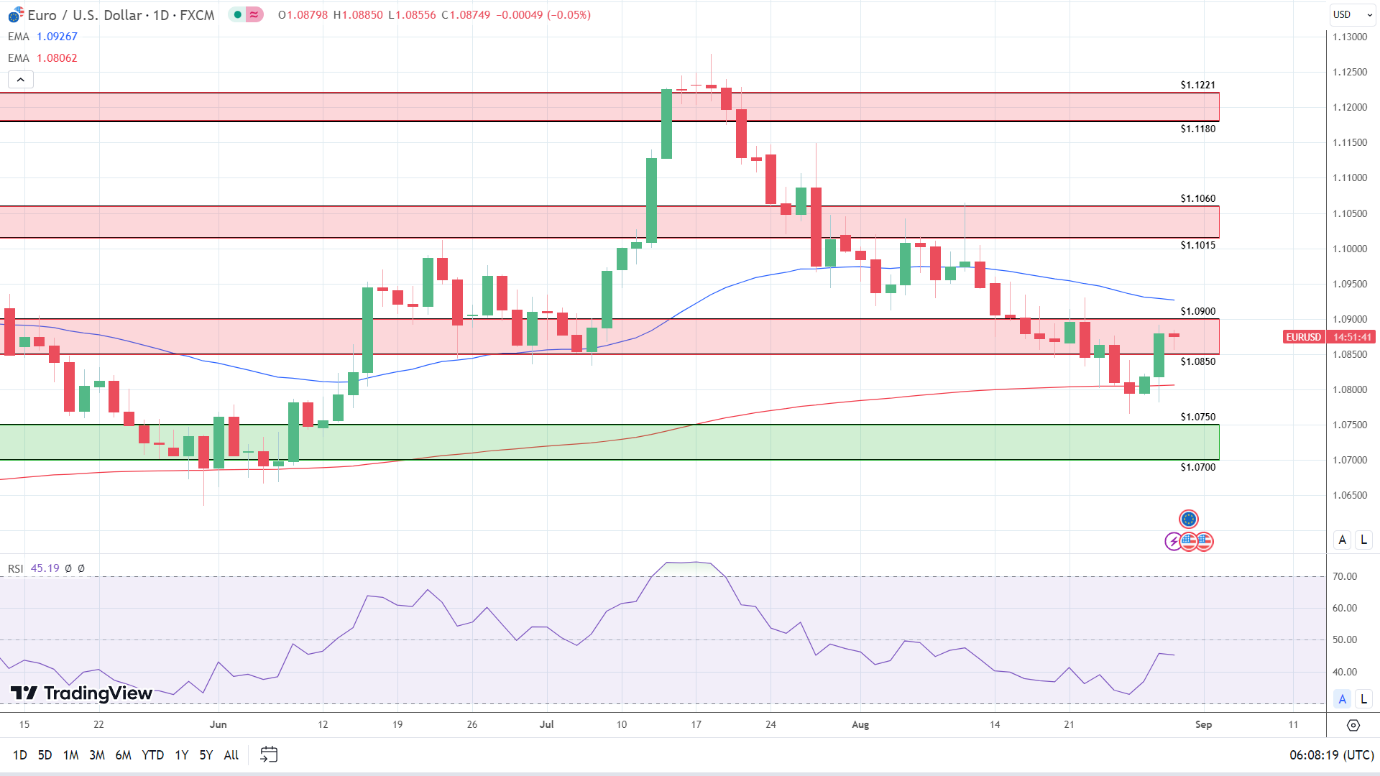
On Tuesday, the EUR/USD rose by 0.56%. Following a 0.22% gain on Monday, the EUR/USD ended the day at $1.08798. The EUR/USD fell to a low of $1.07820 before rising to a high of $1.08919.

German Inflation and Economic Sentiment to Influence ECB Policy Bets

The Business and Consumer Survey for the Eurozone will draw interest later this morning. Considering the latest German GfK Consumer Climate survey and the deteriorating macroeconomic environment, private sector confidence will likely deteriorate further.

Trading Derivatives carries a high level of risk to your capital and you should only trade with money you can afford to lose. Trading Derivatives may not be suitable for all investors, so please ensure that you fully understand the risks involved, and seek independent advice if necessary. A Product Disclosure Statement (PDS) can be obtained either from this website or on request from our offices and should be considered before entering into a transaction with us. Raw Spread accounts offer spreads from 0.0 pips with a commission charge of USD $3.50 per 100k traded. Standard account offer spreads from 1 pips with no additional commission charges. Spreads on CFD indices start at 0.4 points. The information on this site is not directed at residents in any country or jurisdiction where such distribution or use would be contrary to local law or regulation.

Economists forecast the Business and Consumer Survey to fall from 94.5 to 93.7 in August. While weaker-than-expected figures would be EUR/USD bearish, investors are likely expecting gloomy figures.

However, German inflation numbers will move the dial later today. The ECB maintains its view that inflation remains too high. Sticky German inflation figures would fuel bets on further ECB monetary policy tightening moves to tame inflation.

Economists forecast the German annual inflation rate to soften from 6.2% to 6.0% in August. Hotter-than-expected figures would drive the buyer appetite for the EUR/USD.

Investors should consider ECB Executive Board member commentary throughout the session, with inflation in focus. However, no Executive Board members are on the calendar to speak today, leaving ECB chatter with the media to influence.

US ADP Nonfarm Employment Change to Test Dovish Fed Bets

This afternoon, ADP nonfarm employment change figures for August will draw interest. Following the larger-than-expected decline in JOLTs job openings, we expect increased market sensitivity to the ADP numbers.

Economists forecast the ADP to report a 195k increase in nonfarm employment following a 324k rise in July. A deteriorating labor market environment would signal a pullback in consumer spending. The resulting downward trend in consumption would ease demand-driven inflationary pressures and allow inflation to trend toward target.

Other US economic indicators include Q2 GDP numbers, housing sector figures, and trade data. However, barring a material downward revision to the GDP figures, we don’t expect the numbers to influence the EUR/USD.

Beyond the economic indicators, investors should monitor the news wires for FOMC member chatter. A reaction to the latest economic indicators would draw interest.

EUR/USD Price Action

Daily Chart

The $1.0850 – $1.0900 resistance band capped the EUR/USD on Tuesday and this morning. However, hotter-than-expected German inflation and weak ADP numbers would support a breakout from the upper level of the 1.0850 – $1.0900 resistance band. In contrast, a German inflation rate below 6% would bring sub-$1.0850 and the 200-day EMA into view.

Considering the 14-Daily RSI at 45.19, the EUR/USD has plenty of room to fall before hitting oversold territory. Softer German inflation numbers and better-than-expected ADP figures would bring the 200-day EMA into view.

EUR/USD Daily Chart sends mixed price signals.
EURUSD 300823 Daily Chart

4-Hourly Chart

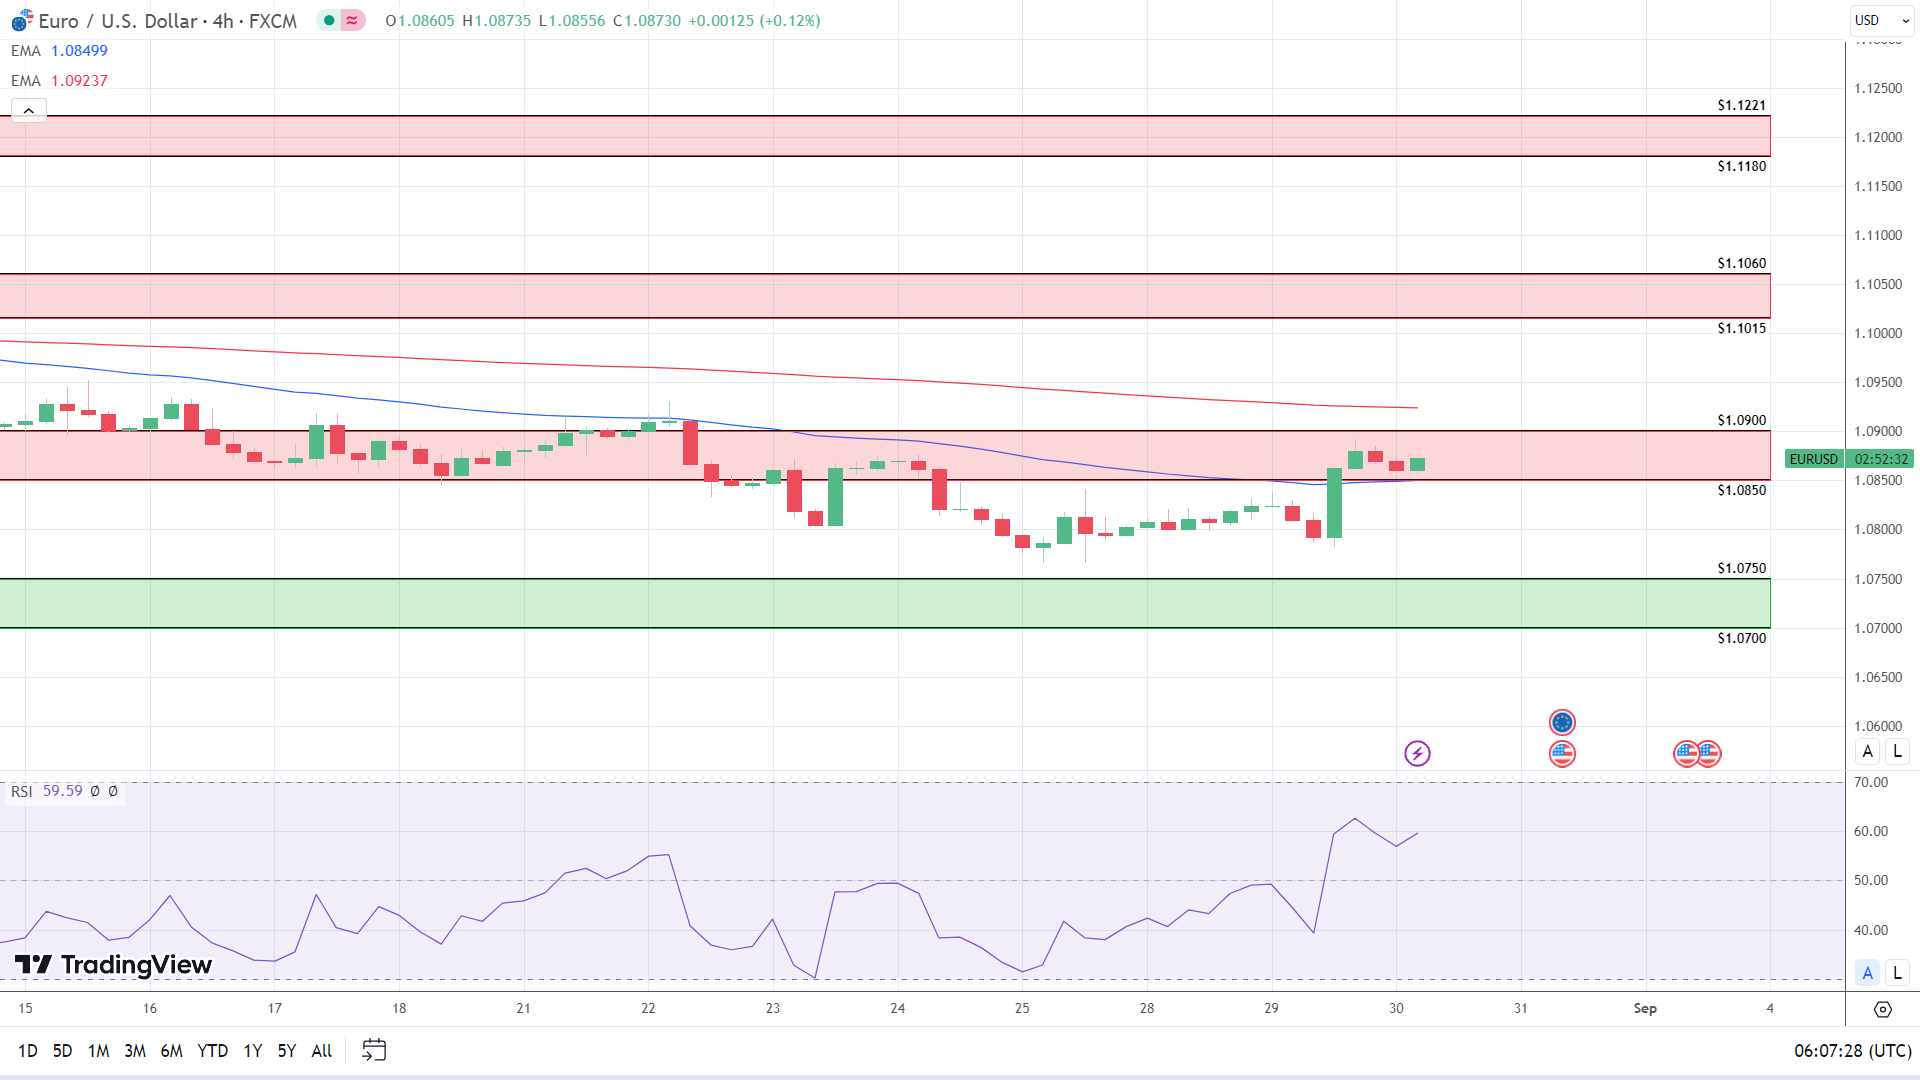
While the EUR/USD holds above the 50-day EMA, the $1.0850 – $1.0900 resistance band continues to cap the upside. The German inflation and US ADP numbers need to be EUR/USD friendly to support a breakout from $1.09.

However, softer-than-expected German inflation numbers and a marked increase in nonfarm employment would see the EUR/USD fall through the 50-day EMA to target the $1.0750 – $1.0700 support band.

The 14-4H RSI at 59.59 gives the EUR/USD plenty of room to run higher before entering the overbought territory.

4-Hourly Chart sends bullish near-term price signals.
EURUSD 300823 4 Hourly Chart
Silver Prices Forecast: Softening US Economic Data Boost XAG/USD’s Allure

Silver Prices Forecast: Softening US Economic Data Boost XAG/USD’s Allure

Investor sentiment has pushed silver (XAG/USD) prices to a four-week peak, fueled by softer economic indicators and the anticipation that the U.S. Federal Reserve may hold off on future rate hikes. With Treasury yields hitting a three-week low and a decline in consumer confidence, silver is currently in the limelight for its non-interest yielding allure.

The Dollar and Treasury Yields

Silver’s price trajectory is entangled with the performance of the U.S. dollar and Treasury yields. As both metrics have seen declines, silver has secured a more bullish stance. Investors should keep an eye out for the upcoming GDP and non-farm payroll reports, as outperformance in these areas could temper silver’s recent gains.

Trading Derivatives carries a high level of risk to your capital and you should only trade with money you can afford to lose. Trading Derivatives may not be suitable for all investors, so please ensure that you fully understand the risks involved, and seek independent advice if necessary. A Product Disclosure Statement (PDS) can be obtained either from this website or on request from our offices and should be considered before entering into a transaction with us. Raw Spread accounts offer spreads from 0.0 pips with a commission charge of USD $3.50 per 100k traded. Standard account offer spreads from 1 pips with no additional commission charges. Spreads on CFD indices start at 0.4 points. The information on this site is not directed at residents in any country or jurisdiction where such distribution or use would be contrary to local law or regulation.

Fed’s Wait-and-See Stance

With economic cues steering investors away from betting on U.S. financial strength, the Federal Reserve seems poised to adopt a wait-and-see approach in its upcoming policy meeting. The CME’s FedWatch Tool has shown a rise in expectations for the Fed to maintain the status quo, making the probability now stand at 53%.

Economic Indicators and Market Sentiment

Recent data reveals significant declines in job openings and consumer confidence, factors which usually boost silver’s market value. Moreover, due to the uncertainty surrounding the Fed’s upcoming monetary policy actions, there has been a shift towards a cautiously optimistic environment for silver investors.

Short-Term Outlook

The market sentiment for silver remains cautiously bullish. Investors are advised to stay vigilant, especially with the personal consumption expenditures price index and non-farm payrolls report due this week, which could be game-changers for interest rate decisions. Economic uncertainties notwithstanding, silver’s appeal appears stronger, yet the market can shift rapidly based on upcoming economic reports.

Technical Analysis

4-Hour Silver (XAG/USD)The current 4-hour price of $24.60 is well above the 200-4H and 50-4H moving averages, at $23.87 and $23.83, respectively, indicating a bullish trend. The 14-4H RSI reading of 68.45 leans towards overbought conditions but still allows room for potential upside.

On the support and resistance front, the current price is above the main support range of $23.850 to $23.600. It is approaching the main resistance area between $25.00 to $25.27, affirming bullish momentum. Using these technical indicators, we consider the current market sentiment for Silver bullish.

Gold Prices Forecast: XAU/USD Reacts Bullishly to Softening US Economic Data

Gold Prices Forecast: XAU/USD Reacts Bullishly to Softening US Economic Data

Gold Prices and the U.S. Economy

Gold prices lingered near a three-week peak, largely influenced by the perception of stalled U.S. interest rate hikes. This sentiment builds on recent economic indicators suggesting potential slowdowns in the nation’s growth.

Impact of Economic Indicators

Several economic cues have investors rethinking their stances on U.S. financial strength. Notably, U.S. Treasury yields hit a three-week low after data revealed a significant decline in job openings for July – the lowest in roughly 2.5 years. Additionally, consumer confidence took an unexpected dip in August. These softer economic signals typically boost gold’s allure, considering it doesn’t yield interest.

Trading Derivatives carries a high level of risk to your capital and you should only trade with money you can afford to lose. Trading Derivatives may not be suitable for all investors, so please ensure that you fully understand the risks involved, and seek independent advice if necessary. A Product Disclosure Statement (PDS) can be obtained either from this website or on request from our offices and should be considered before entering into a transaction with us. Raw Spread accounts offer spreads from 0.0 pips with a commission charge of USD $3.50 per 100k traded. Standard account offer spreads from 1 pips with no additional commission charges. Spreads on CFD indices start at 0.4 points. The information on this site is not directed at residents in any country or jurisdiction where such distribution or use would be contrary to local law or regulation.

Gold’s Tug-of-War with the Dollar

The trajectory of gold prices remains closely tied to the U.S. dollar’s performance and associated yields. A weakening dollar and declining yields have historically bolstered gold’s standing. Should this U.S. economic softening persist, gold prices might continue their upward trend. Yet, caution remains: if upcoming GDP and NFP reports outperform expectations, the recent uptick in gold could be short-lived.

Key Reports and Federal Reserve’s Stance

Investors are keenly watching for the Commerce Department’s pending GDP report and subsequent significant releases – notably the PCE price index and the non-farm payrolls. Current sentiment suggests that the Federal Reserve might adopt a wait-and-see approach in its upcoming meeting. Interestingly, the CME’s FedWatch Tool indicated a growing expectation of the Federal Reserve maintaining status quo, with the odds now at 53%.

Short-Term Forecast

Given the mixed economic indicators and potential Federal Reserve hesitancy, gold’s outlook remains cautiously bullish. The recent uptick in holdings by the SPDR Gold Trust, a leading gold-backed ETF, further solidifies this sentiment. However, investors should remain vigilant, especially with crucial economic reports on the horizon.

Technical Analysis

4-Hour Gold (XAU/USD)Based on the provided 4-hour chart data for Gold (XAU/USD), the current price of $1936.65 is slightly above its previous 4-hour close of $1936.14, indicating marginal bullish momentum. It’s also above the 200-4H moving average ($1934.34) and the 50-4H moving average ($1910.16), further reinforcing a bullish outlook.

The 14-4H RSI stands at 69.36, which is just below the overbought threshold of 70, suggesting strong bullish momentum but cautioning against a potential reversal.

Support levels exist between $1893.07 to $1885.79, while main resistance ranges from $1946.99 to $1954.88. Overall, the market sentiment appears bullish but warrants caution due to the near-overbought RSI level.

Australian Inflation Rate Softened to 4.9% in July Easing Hawkish RBA Bets

Australian Inflation Rate Softened to 4.9% in July Easing Hawkish RBA Bets

Australian Monthly CPI Indicator

After better-than-expected Australian retail sales numbers on Monday, inflation figures drew interest this morning. A mixed set of economic indicators has delivered RBA monetary policy uncertainty. With the RBA battling to tame inflation, a pickup in consumption and consumer price inflation would have fueled bets on further RBA moves to bring inflation to target.

However, the Monthly Consumer Price Index (CPI) Indicator increased by 4.9% in July versus 5.4% in June. Economists forecast an increase of 5.2%.

According to the ABS,

  • Housing (+7.3%) and food and non-alcoholic beverages (+5.6%) contributed the most to annual price increases.
  • Automotive fuel (-7.6%) and fruit and vegetables (-5.4%) contributed to the softer headline figure.
  • Excluding volatile items, including automotive fuel, fruit and veg, and holiday travel, the annual inflation rate softened from 6.1% to 5.8%.
  • The Monthly Consumer Price Index Indicator peaked at 8.4% in December 2022.

The softer inflation numbers and latest employment figures give the RBA good reason to remain in a vigilant holding pattern. In July, the Australian unemployment rate increased from 3.5% to 3.7%. The rise in the unemployment rate should ease wage growth pressures and demand-driven inflationary pressures.

AUD/USD Reaction to the Australian Inflation Rate

Before the inflation numbers, the AUD/USD rose to a pre-stat high of $0.64832 before falling to a low of $0.64740.

However, in response to the inflation numbers, the AUD/USD rose to a post-stat high of $0.64729 before sliding to a low of $0.64495.

This morning, the Aussie dollar was down 0.37% to $0.64566.

Australian inflation rate sinks the Aussie Dollar.
300823 AUDUSD Hourly Chart
Advertisement

Up Next

The US economic calendar will draw interest this afternoon. Second estimate GDP numbers for the second quarter and ADP employment change figures for August are in focus.

JOLTs job openings suggested a marked shift in labor market conditions, with job openings sliding from 9.165 million to 8.827 million in July. A weaker-than-expected increase in employment change would rein in bets on further Fed interest rate hikes.

Economists forecast the ADP to report a 195k increase in employment versus a 324k surge in July.

The second quarter GDP numbers will also need consideration. However, barring a sizeable downward revision, we expect the ADP numbers to have more impact on the Fed and market risk sentiment.

Japanese Yen Price Action Setups: USD/JPY, GBP/JPY Key Levels Identified

Japanese Yen Price Action Setups: USD/JPY, GBP/JPY Key Levels Identified

YEN FUNDAMENTAL BACKDROP

The Japanese Yen had continued its struggle on Monday and continued into yesterday before lackluster US data helped the Yen stage a recovery. Insights provided by a former Bank of Japan (BoJ) official stated that the BoJ is unlikely to intervene on the Yen until USD/JPY tops the 150.00. This coupled with Dollar Strength in the European session yesterday helped propel USD/JPY and GBP/JPY higher ahead of the US session.

The US session brought the first batch of US data this week with Jolts job opening number and CB Consumer Confidence Data both of which came In well below estimates. The impact of the poor data release saw both Yen pairs retreat in what is a welcome reprieve for the Yen.

The Asian session has seen a recovery by both USD/JPY and GBP/JPY as the Yen faced some pressure as investors flocked toward Japanese Stocks. We also heard comments from BoJ Board Member Naoki Tamura who stated the Central Bank may end negative rates if the inflation goal is in sight. Tamura further clarified that even if the BOJ were to end negative rates, it won’t be scaling back monetary easing as long as it can keep interest rates low. These comments may also be aiding Yen weakness this morning as the European session approaches.

EXTERNAL FACTORS CONTINUE TO DRIVE YEN PAIRS

It is not surprising at all that we have been unable to hold onto Yen gains as this seems to be a theme of late post data releases. Initial volatility and gains are usually given back sometimes within the same session with little or no follow through, a sign of how important market participants perceive data releases as Central Banks echo data dependency.

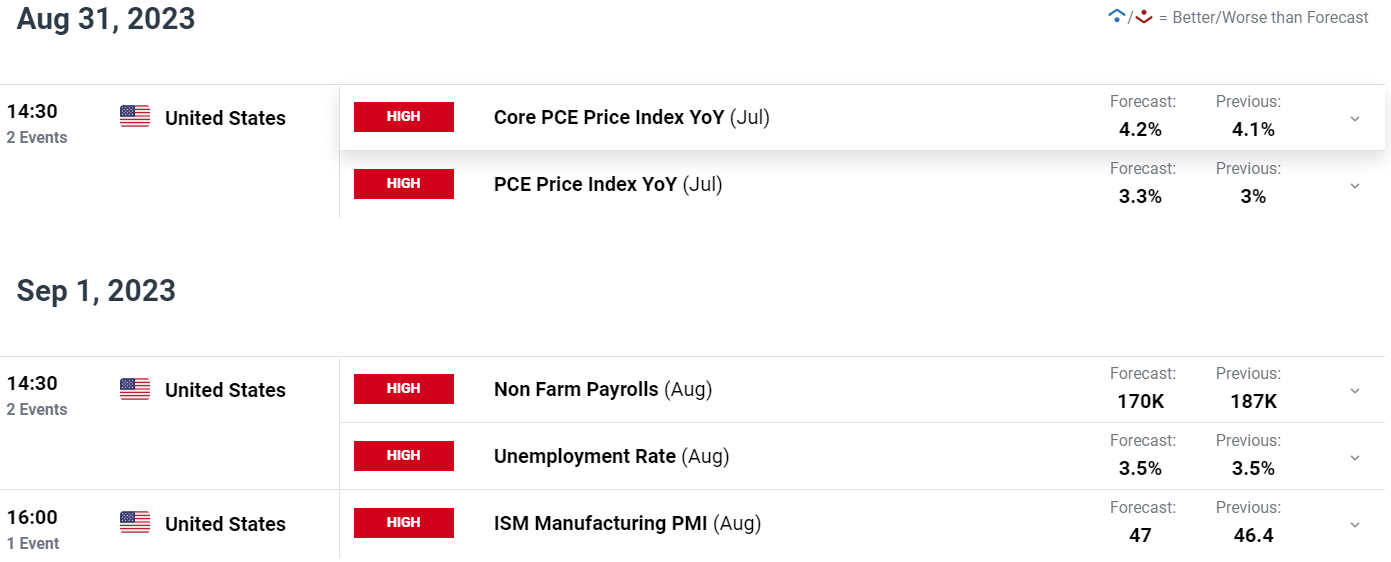
Japanese Yen pairs continue to be driven by external factors with a lot in terms of high impact data releases ahead. The US side brings US GDP data today which will be followed by Core PCE and the NFP jobs report to cap a busy week in terms of data.

Market participants will be keeping a close eye on US data to gauge where the Fed may land at the upcoming Central Bank meeting in September.

image1.pngA screenshot of a computer  Description automatically generated

PRICE ACTION AND POTENTIAL SETUPS

GBPJPY

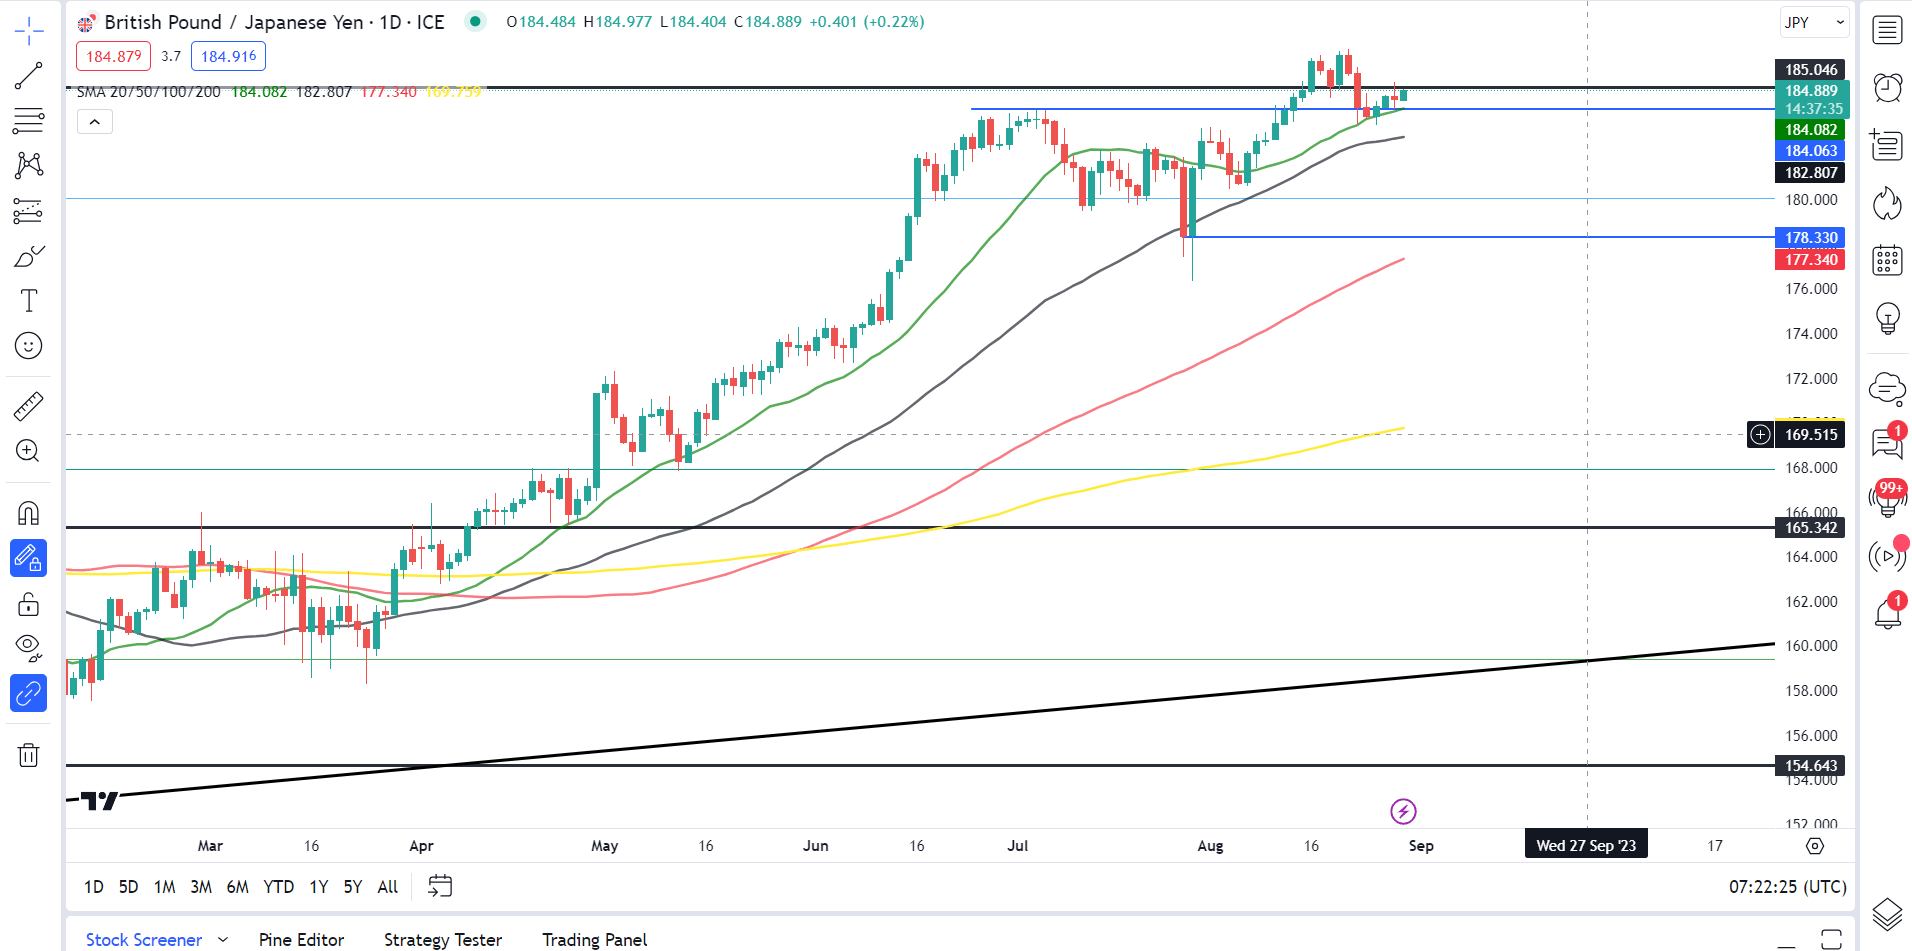
GBPJPY has been enjoying a bit of a lull this week as it remains caught between the 184.00 and 185.00 handles. I expect this to be short lived however, with a lot of support keeping GBPJPY elevated and holding back any significant retracement.

Around the 184.00 handle we have the 20-day MA while the 100-day MA languishes around the 182.73 handle and could come into play should we see a deeper retracement. Considering the lack of data from both Japan and the UK this week market moves could likely be guided by overall sentiment.

This could mean that even a break of the immediate resistance around the 185.00 handle may not have the legs to challenge the YTD high ahead of the weekend. GBPJPY could need a catalyst to break out of this recent range and until the fundamental picture changes or we get a significant miss on any high impact data I do expect the downside on GBPJPY to remain limited.

GBPJPY Daily Chart

Source: TradingView, prepared by Zain Vawda

Key Levels to Keep an Eye On:

Support levels:

  • 184.00 (20-day MA)
  • 182.70 (100-day MA)
  • 180.72 (August swing low)

Resistance levels:

  • 185.00 (psychological level)
  • 186.80 (YTD High)
  • 187.50

USDJPY

USD/JPY Daily Chart

Source: TradingView, prepared by Zain Vawda

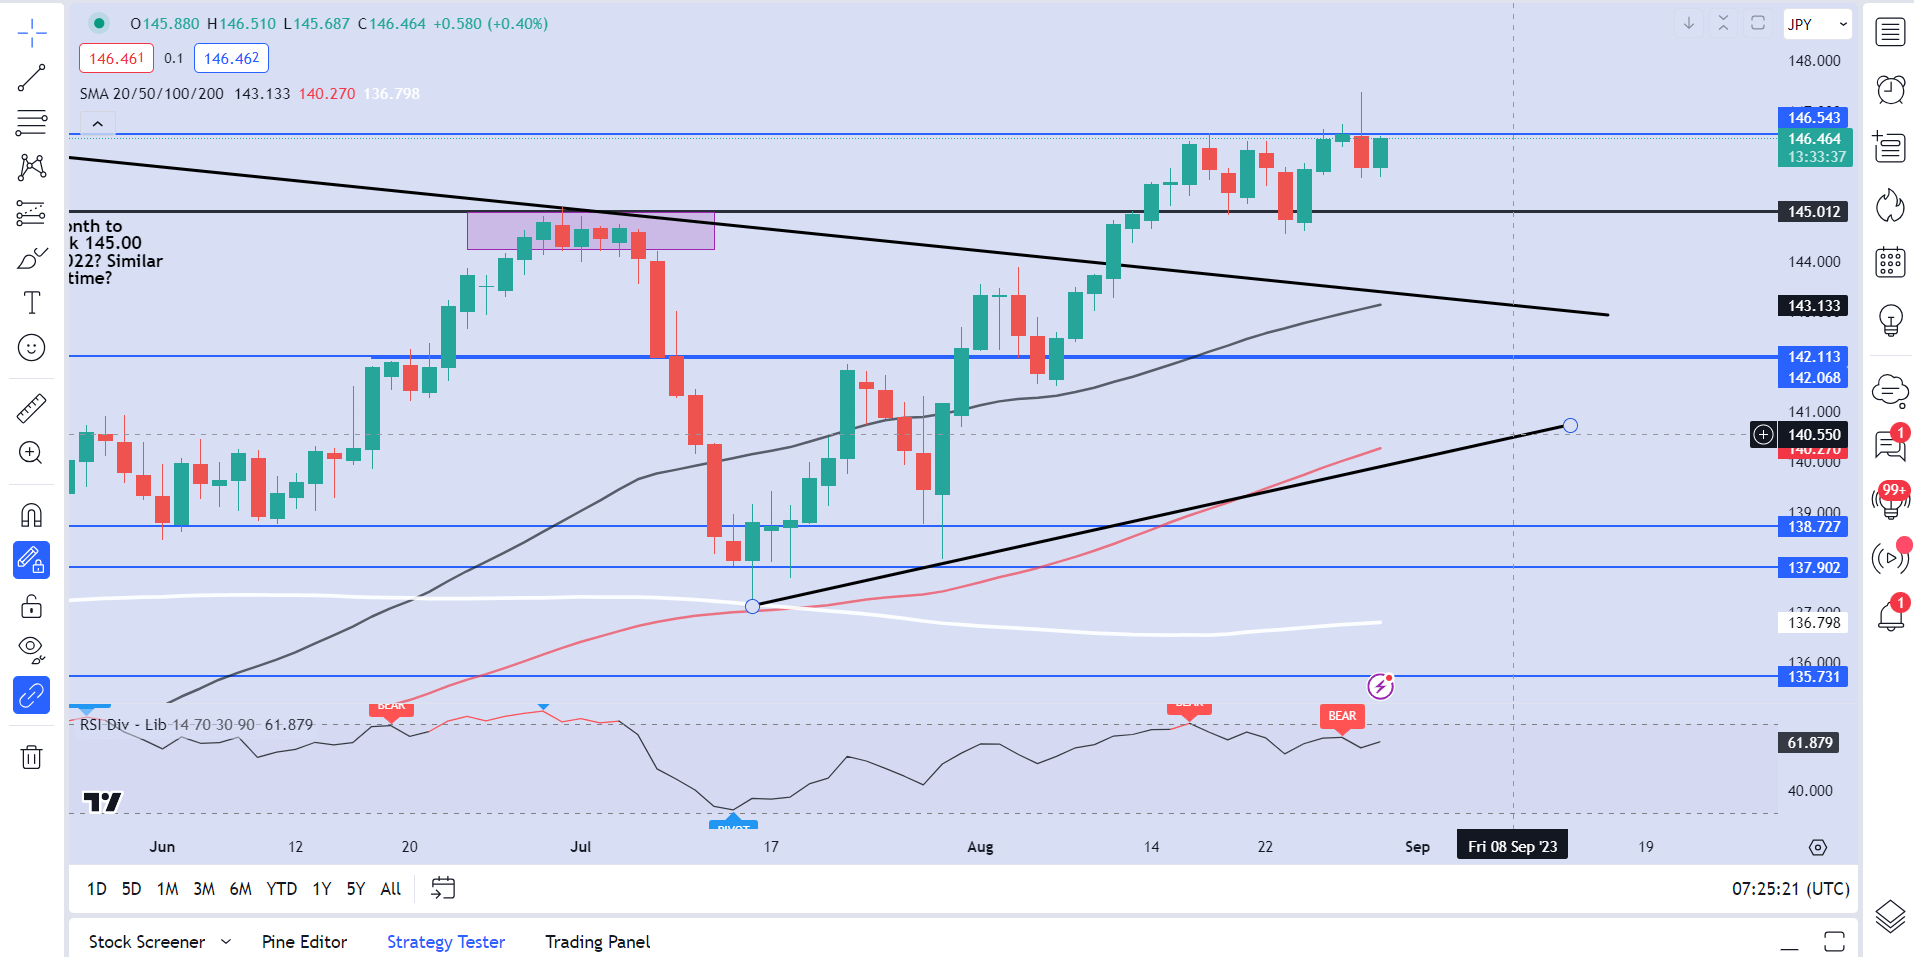
From a technical perspective, USD/JPY printed a massive shooting star candlestick on the daily timeframe. This usually signals further downside ahead which has so far failed to materialize. Similar to GBPJPY downside support remains strong and as long as the DXY continues to hold the high ground expect any selling pressure to be limited. We saw this last week having dipped below the 145.00 handle before rebounding immediately back above.

Today’s daily candle is on its way to retest resistance around the 146.50 handle before it eyes yesterday’s highs. A break of yesterday’s high may be on the cards but this is likely to be down to US GDP later today. A stronger than expected GDP print could provide USD bulls with the impetus they need to continue on their march to the coveted 150.00 handle and potential FX intervention. Either way Yen pairs remaining exciting to watch.

Key Levels to Keep an Eye On:

Resistance levels:

  • 146.50
  • 147.38
  • 150.00

Support levels:

  • 146.63
  • 145.00
  • 144.50

Taking a quick look at the IG Client Sentiment Data whichshows retail traders are 76% net-short on USD/JPY.