
U.S. To Levy Human-Rights Sanctions On Russia, China – WSJ https://t.co/zoYDzqRuiv
— LiveSquawk (@LiveSquawk) December 9, 2022

U.S. To Levy Human-Rights Sanctions On Russia, China – WSJ https://t.co/zoYDzqRuiv
— LiveSquawk (@LiveSquawk) December 9, 2022

Take part in a flagship affiliate contest for the partners from Nigeria, earn the highest partner’s commission, and win fantastic prizes!
Registration: https://bit.ly/3iDhap5
Attract new referrals, compete with other LiteFinance affiliates from Nigeria, win gorgeous prizes every month and a Hyundai Tucson, a trip to the LiteFinance office or a MacBook Pro by the end of the contest.
For more information, call:
08166635848

The week started with some potential for volatility in FX markets but as the days have worn on, that flare of USD strength from Monday has continued to fizzle out.
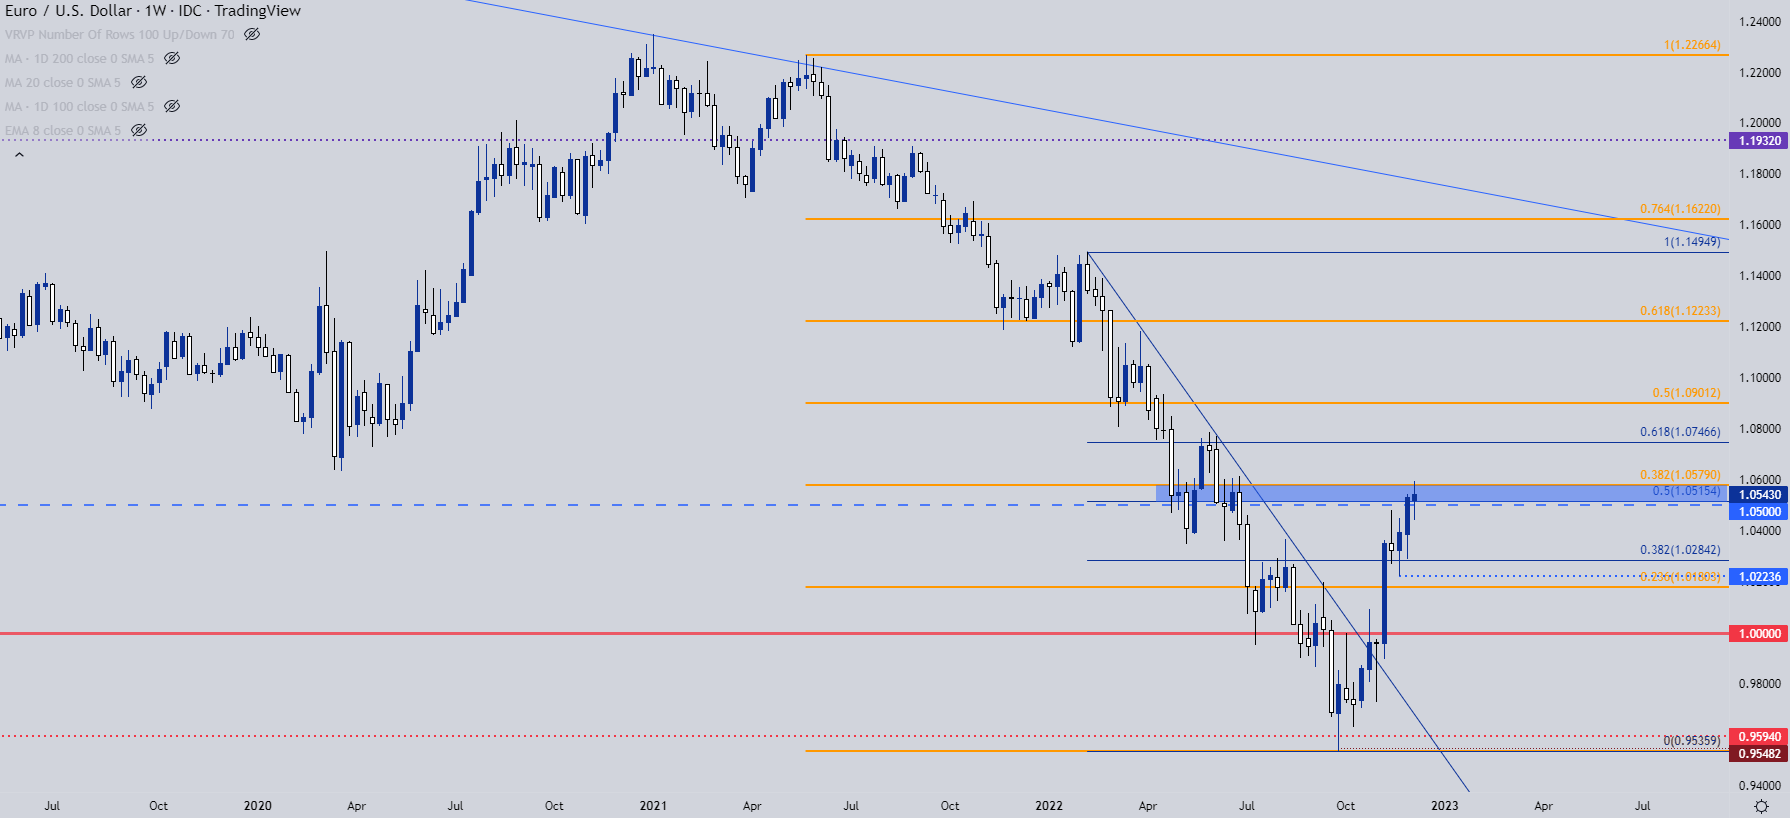
To open the week, EUR/USD tested a breakout beyond a key Fibonacci level at 1.0579. It snapped back pretty soon after, and this synced with a support bounce in the USD from one of its own Fibonacci levels. Initially this gave the appearance of trend potential, and the Monday session offered some run on both of those themes with even a bit of continuation on Tuesday. Yesterday, however, saw both themes pull back, with USD selling-off and EUR/USD pushing back above the 1.0500 level. This gives the appearance of anticipation for next week’s rather voluminous Central Bank outlay. Pertinent to EUR/USD, we’re hearing from the Fed (on Wed) and the European Central Bank (on Thurs). After that, we have but a couple of weeks until the end of the year so that drive on next week’s economic calendar is looking quite opportunistic for trend and breakout traders.
At this point, the weekly bar of EUR/USD is looking indecisive and is working as a doji. Given the blistering pace of gains from the September low, a doji at a key spot of resistance could be of interest for swing traders, but we have to confirm that first with this week’s close. And for that we have to get through some US data tomorrow with the release of PPI data at 8:30 AM followed by Consumer Sentiment at 10 AM (both times Eastern).
EUR/USD Weekly Price Chart
EUR/USD
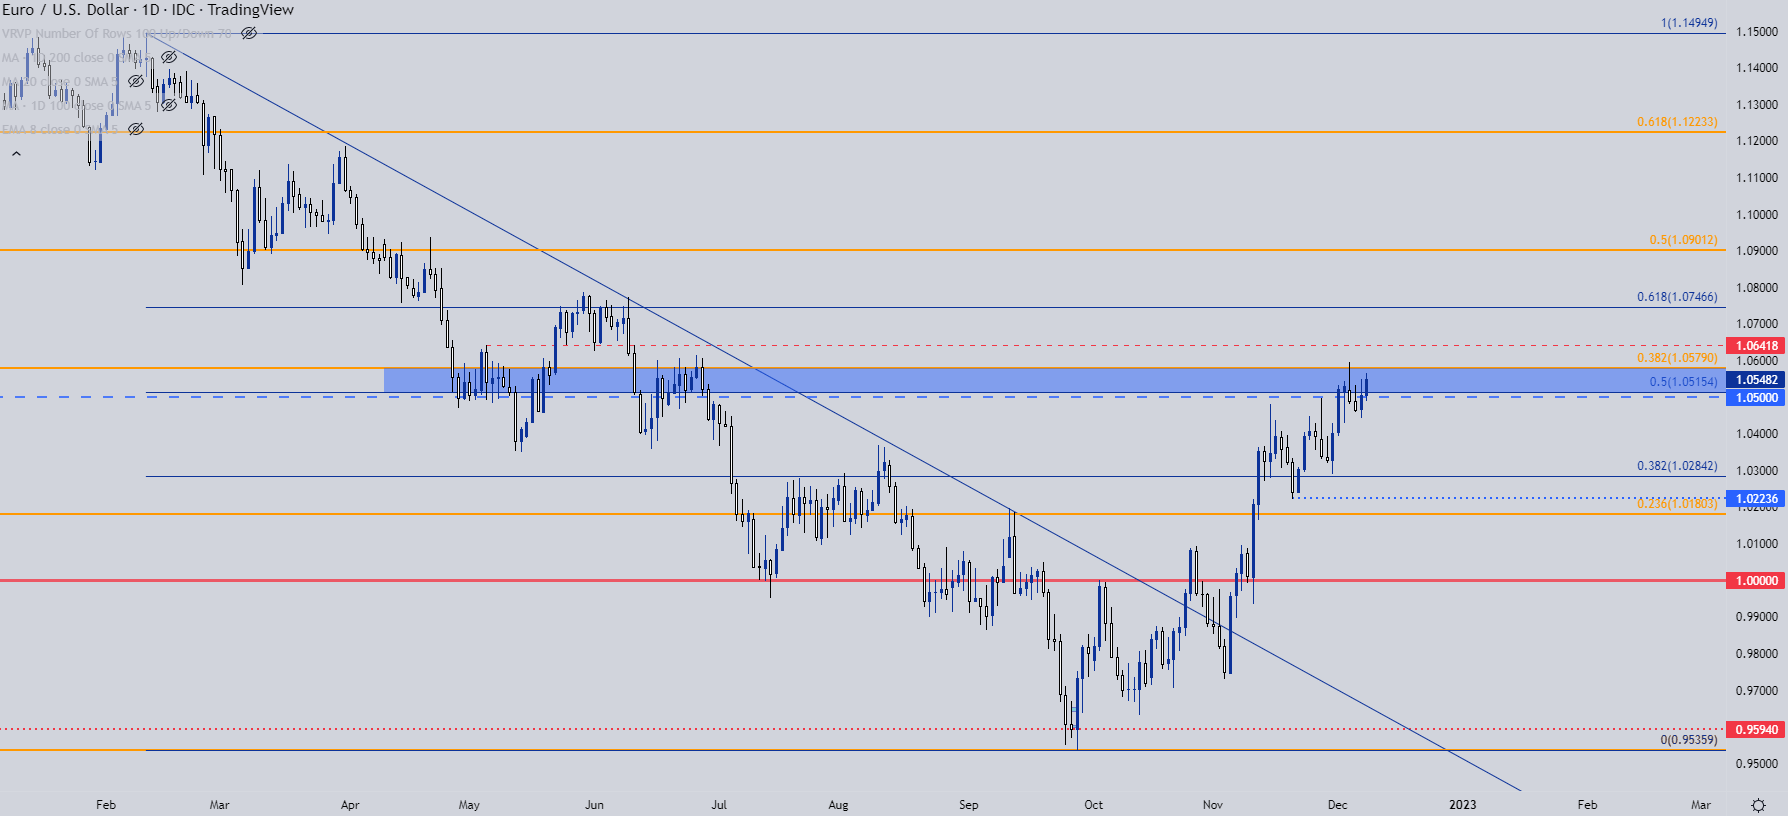
From the daily chart, we can see a key zone that’s in-play to hold the highs at the moment. There’s confluence between two Fibonacci levels of note, as the 50% mark of the Feb-Sept major move plots at 1.0515 and the 38.2% retracement of the longer-term sell-off, spanning from May of 2021 down to the September low rests at 1.0579. That was the level that was tested through on Monday before the short-term reversal showed up.
From the daily there are still up-trending tendencies and only early signs that a top may be in. What would be needed next is a lower-high, inside of the Monday high, combined with a lower-low, which could be sought below the Wednesday swing at 1.0450.
The alternative case would be an episode of capitulation, which could show in the event of a fresh high being met with intense selling pressure, thereby opening the door for reversal scenarios.
EUR/JPY
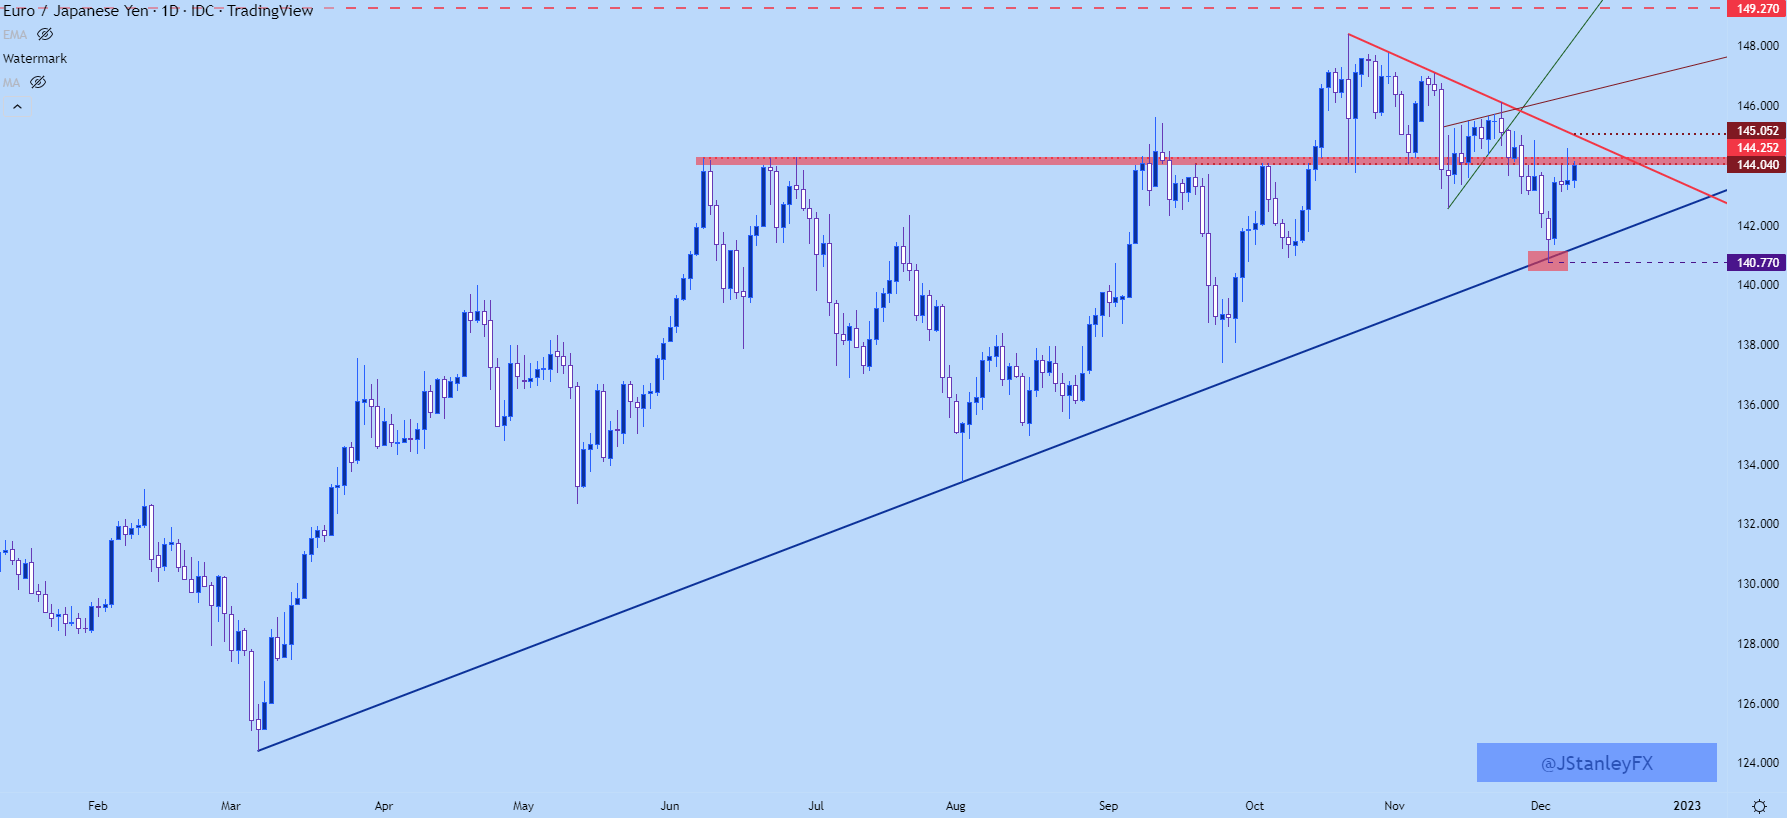
For Euro bears, there may be a more attractive setup elsewhere. EUR/JPY could be one of those candidates. Even as USD weakness has hung around, JPY strength has continued to show and in EUR/JPY, this led to a break of a rising wedge formation two weeks ago. Rising wedges are often tracked for bearish reversals, and that led into a push down to fresh monthly lows.
Bears then ran it down to trendline support with a low being set at 140.77 on Friday. Since then prices have bounced, and we’re now testing a familiar area of resistance-turned-support around the 144 handle. And just above, there’s another spot of resistance, as taken from a bearish trendline connecting a group of recent lower-highs in the pair. This currently projects to around the 145 level.
EUR/JPY Daily Chart
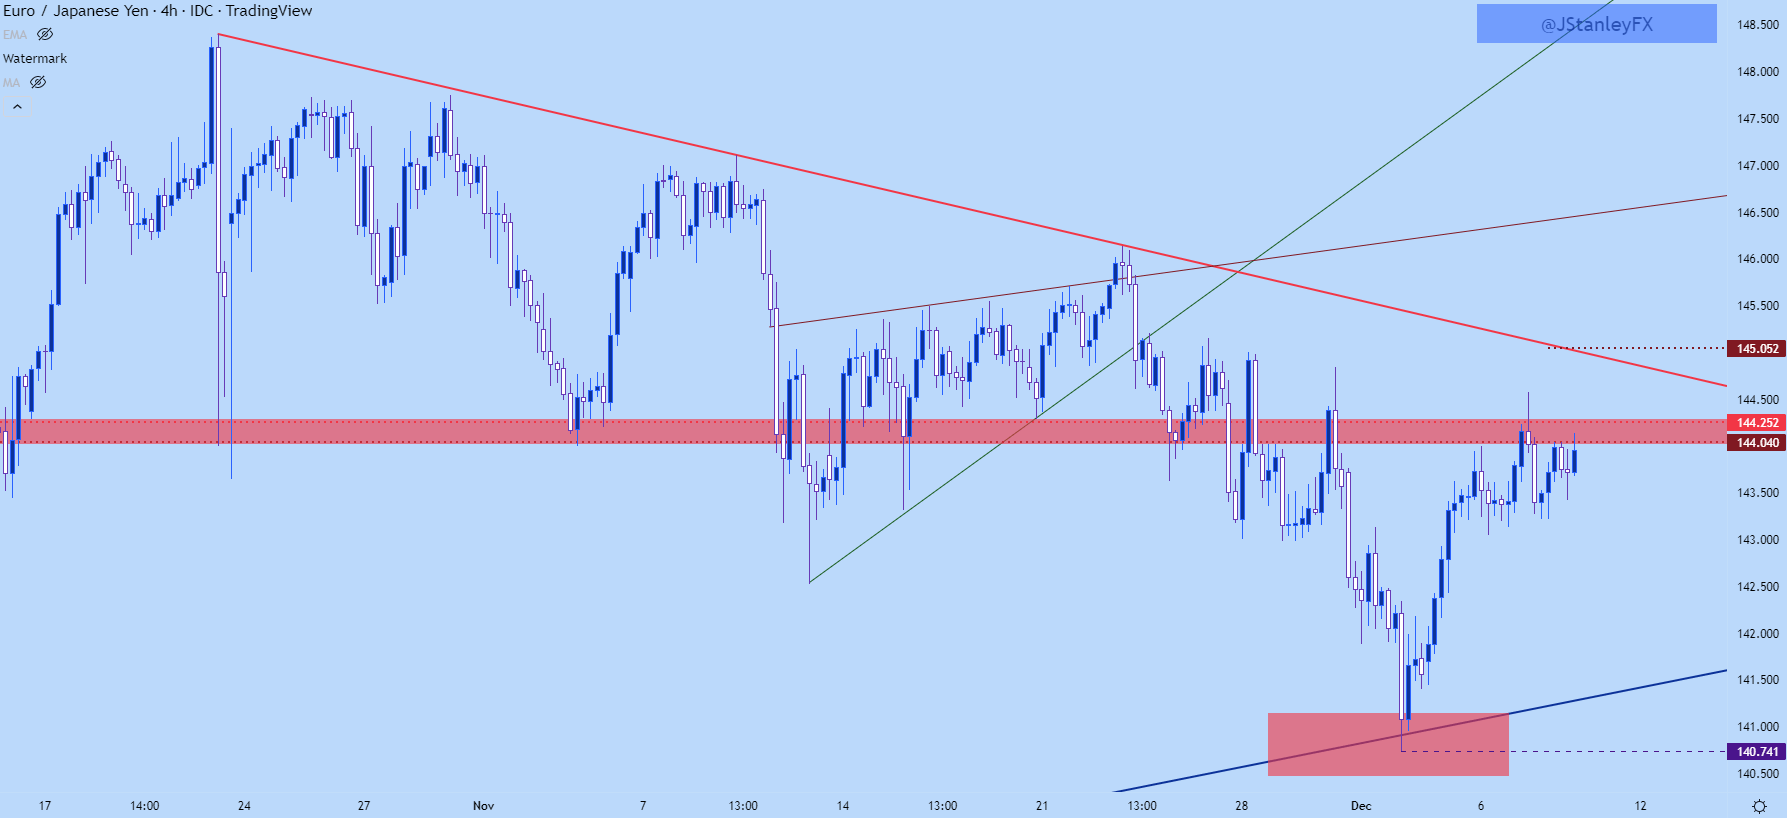
From a shorter-term basis, we can see where EUR/JPY tested above that resistance zone yesterday and quickly snapped back. This keeps the door open for swing potential, particularly if this zone of resistance can hold a lower-high below yesterday’s swing.
EUR/GBP
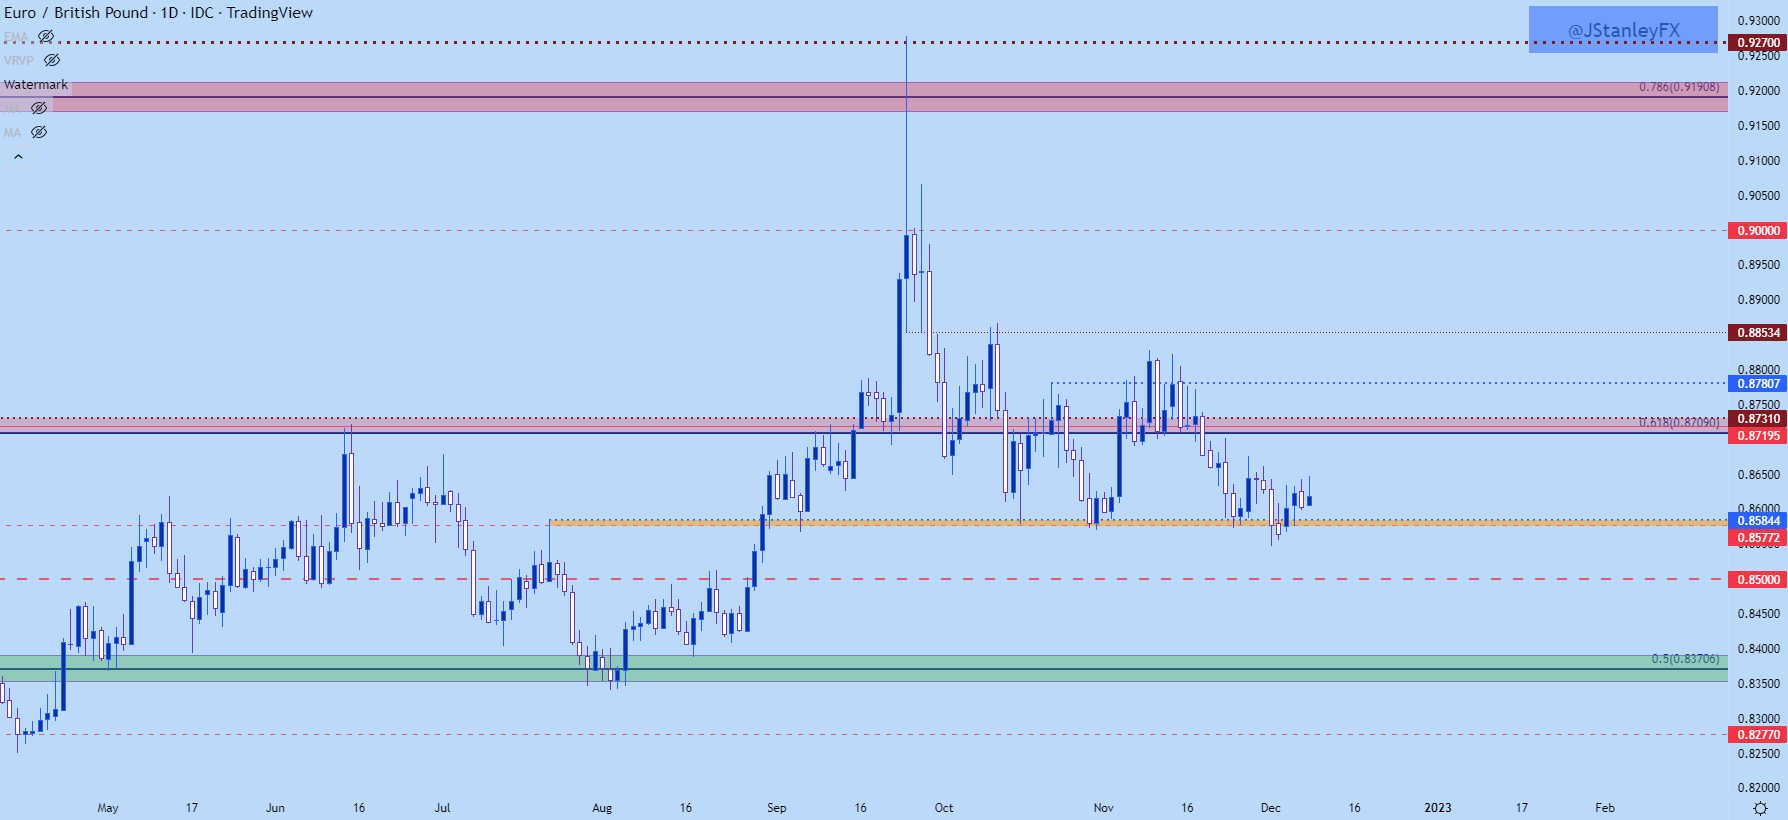
I had looked into EUR/GBP early last month, highlighting a bout of range resistance that had just come into the picture. Price took about a week but, continued to hold in that area without breaching the next resistance level on the chart at .8853. Then GBP strength started to show up and EUR/GBP began to trickle lower, eventually crossing the .8700 handle and then, as of last week, visiting range support around .8577.
So far this week a bounce has developed off of this support, but sellers have been standing at the ready, as highlighted by the upper wicks sitting atop the past three daily candles (four, if including today’s unfinished bar).
EUR/GBP Daily Chart
EUR/GBP Shorter-Term
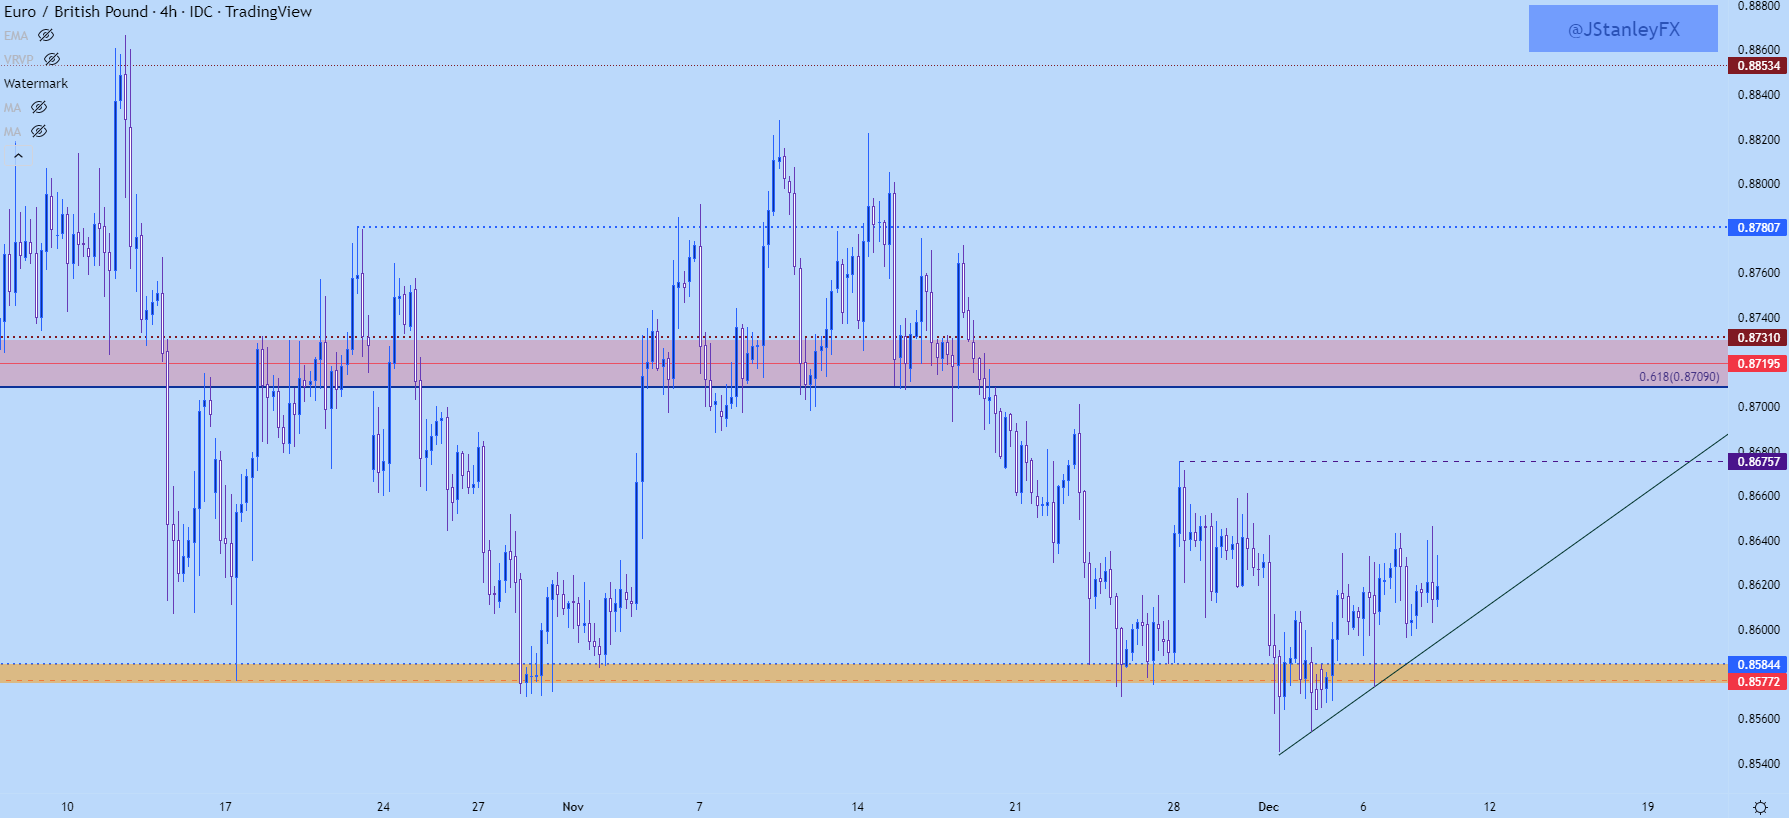
Going down to the four hour chart, we can see an attempt at recovery. It’s still very early though, as price hasn’t yet been able to test through a prior lower-high around .8680. There has, however, been a string of recent higher-lows, and this can keep the door open for bounce scenarios in the pair until that string is broken. And for that, I’m tracking the Tuesday low at .8574. If bulls can hold the low above that level, the longer-term range scenario can stay alive with focus on revisits to .8676 after which the .8709-.8731 zone comes back into the picture.

Take part in a flagship affiliate contest for the partners from Nigeria, earn the highest partner’s commission, and win fantastic prizes!
It’s your chance to win one of the fabulous prizes worth a total of $145,000
Registration: https://bit.ly/3FAbENb
Our prizes
Hyundai Tucson as the main prize;
3 travel packages worth $5000 for you to visit the company’s main office;
7 MacBooks Pro;
240 extra money prizes will be raffled during the year.
How to win?
Score the most points and win the competition!

The main economic highlight in Thursday’s session was the (weekly) unemployment filings out of the US for the week ending 3 December.
According to the US Department of Labour, unemployment claims rose 230,000, 4,000 higher than the previous upwardly revised 226,000 reading; the release was largely in line with economists’ forecasts.
Trading Derivatives carries a high level of risk to your capital and you should only trade with money you can afford to lose. Trading Derivatives may not be suitable for all investors, so please ensure that you fully understand the risks involved, and seek independent advice if necessary. A Product Disclosure Statement (PDS) can be obtained either from this website or on request from our offices and should be considered before entering into a transaction with us. Raw Spread accounts offer spreads from 0.0 pips with a commission charge of USD $3.50 per 100k traded. Standard account offer spreads from 1 pips with no additional commission charges. Spreads on CFD indices start at 0.4 points. The information on this site is not directed at residents in any country or jurisdiction where such distribution or use would be contrary to local law or regulation.
The 4-week average also ended at 230,000, up 1,000 based on the previous week’s moving average value (revised). Continuing claims was higher at 1,671,000 from 1,609,000 the week prior. Overall, however, this data was largely ignored across the markets.
Technical View for Key Markets
It has been a somewhat muted week thus far for the EUR/USD currency pair. Kicking things off with the weekly scale, price remains comfortable north of its support level from $1.0298, a barrier that was breached in early November. Overhead has resistance in view at $1.0778: a Quasimodo support-turned resistance. For this reason, and given the upward movement since bottoming at $0.9536, further outperformance could be on the table for the unit, longer term.
Meanwhile on the daily timeframe, resistance forged from $1.0602 is nearby. This comes after price climbed north of the 200-day simple moving average ($1.0353) as well as resistance coming in at $1.0377 (now a marked support). Interestingly, should price overthrow $1.0602, prime resistance can be seen at $1.0954-1.0864. You will also acknowledge that the relative strength index (RSI) remains trawling the underside of the overbought space, and nearing channel support, taken from the low 25.68.
Against the backdrop of the bigger picture, the H1 timeframe has price on the verge of reaching for Quasimodo resistance at $1.0585, followed by a larger Quasimodo resistance coming in from $1.0607 (in between, of course, resides the $1.06 psychological figure).
All three timeframes, therefore, call for additional short-term buying, at least until reaching the $1.06ish region.

EUR/USD Weekly (Top left), daily (bottom left) and 1 hour (right) charts. Source: TradingView
The price of bitcoin against the US dollar (BTC/USD) has been entrenched within a notable downtrend since topping in late 2021. Long term, therefore, this has opened the door for sell-on-rally scenarios. Shorter term, nevertheless, price recently touched gloves with the underside of an AB=CD bearish pattern, consisting of a 100% projection at $17,321 and a 1.618% Fibonacci extension from $17,291. The test was also accompanied by the relative strength index (RSI) forging negative (bearish) divergence.
As you can see, the AB=CD (harmonic) resistance has since enticed selling. Common downside targets derived from the AB=CD formation (legs A-D) are fixed at the 38.2% and 61.8% Fibonacci retracements from $16,630 and $16,194, respectively. Consequently, the noted support targets will likely be closely monitored going forward, with a breach perhaps unearthing additional selling.

The DAX 40—Germany’s major stock market index covering the performance of 40 blue-chip companies—is offering interesting price action. The one-sided advance on 10 November formed what is known as inefficient price action (the market favours efficient price action and generally fills inefficient price moves [think of these as similar to gaps as you would see in individual stocks]).
14,077-14,141 demand is a key watch for the index, following a to-the-point reaction from Quasimodo resistance at 14,605. Below current resistance at 14,322, we can see that the area under (yellow oval) the aforementioned demand is inefficient action, meaning price may be drawn to fill this void and test support from 13,969.
Therefore, based on the above analysis, sellers may remain in the driving seat under resistance at 14,322, with short-term breakout selling perhaps unfolding south of demand at 14,077-14,141 towards support at 13,969.


Gold prices were little changed on Thursday amid divergent performance between the US Dollar and Treasury yields. The anti-fiat yellow metal often finds itself the most sensitive to the latter two instruments moving in the same direction. This means that when the Greenback and bond yields go their own separate ways, that could mute XAU/USD’s performance.
A rally on Wall Street helped propel Dow Jones and S&P 500 futures by about 0.53% and 0.74%, respectively. The rosy session cooled demand for safety, placing the anti-risk US Dollar on the defensive. The DXY Index closed at its lowest since the beginning of this week. Demand for Treasuries likely faded, pushing down prices as yields climbed.
When the latter two move in different directions, the net effect on gold can be neutralized. This is leaving XAU/USD facing US PPI and University of Michigan consumer sentiment data due over the remaining 24 hours. These will be some of the last key data Fed officials will see before next week’s interest rate decision. Rosy data could continue reinvigorating hawkish policy bets, leaving gold at risk.
On the daily chart, gold appears to be trading within the boundaries of a bearish Rising Wedge chart formation. A breakout lower could open the door to resuming the dominant downtrend from earlier this year. That would place the focus on the 50-day Simple Moving Average, which may reinstate the near-term upside bias. Immediate resistance seems to be at 1810.
Trade Smarter – Sign up for the DailyFX Newsletter
Receive timely and compelling market commentary from the DailyFX team
Subscribe to Newsletter
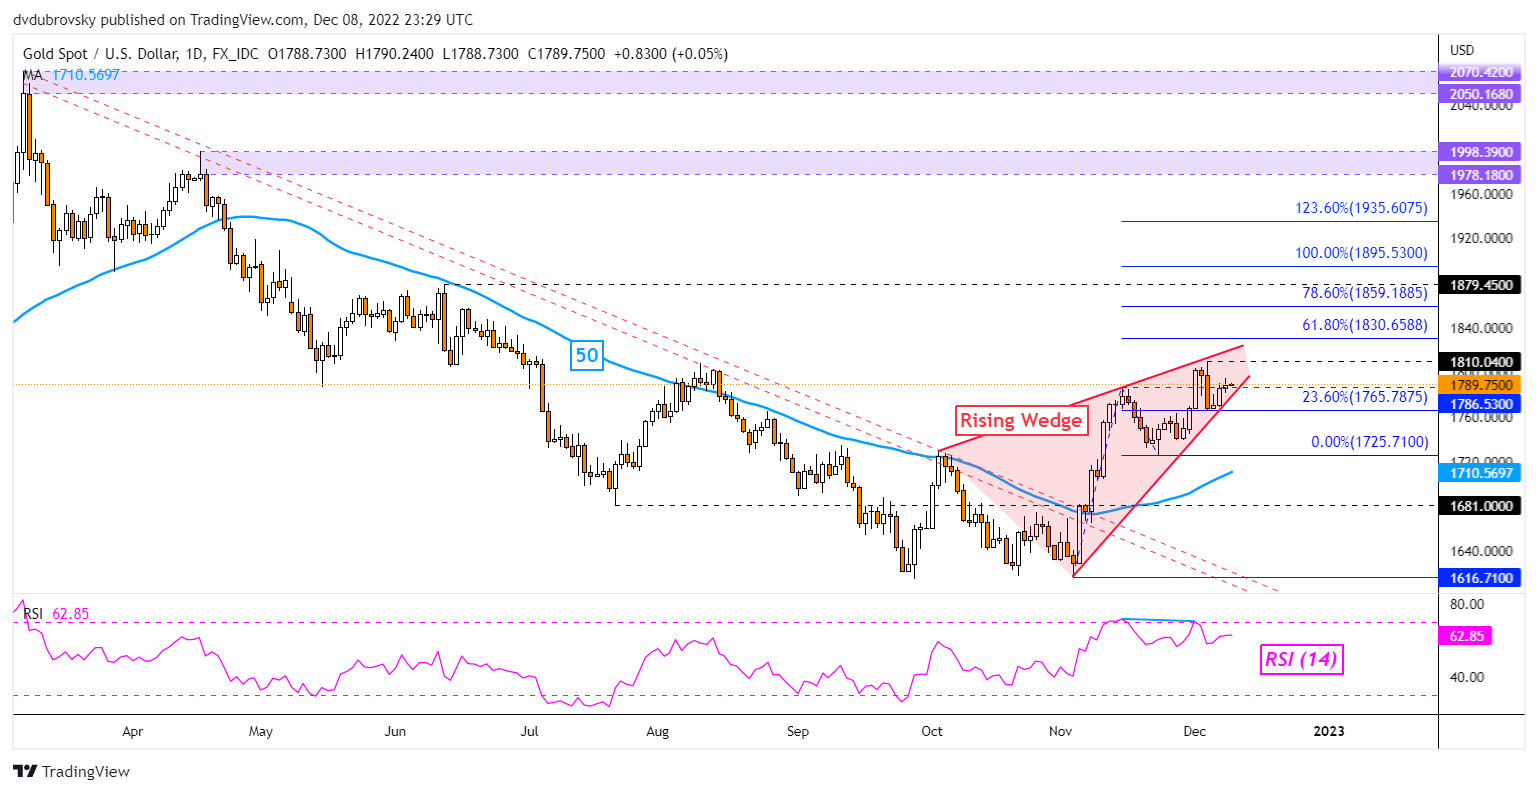
Chart Created Using TradingView
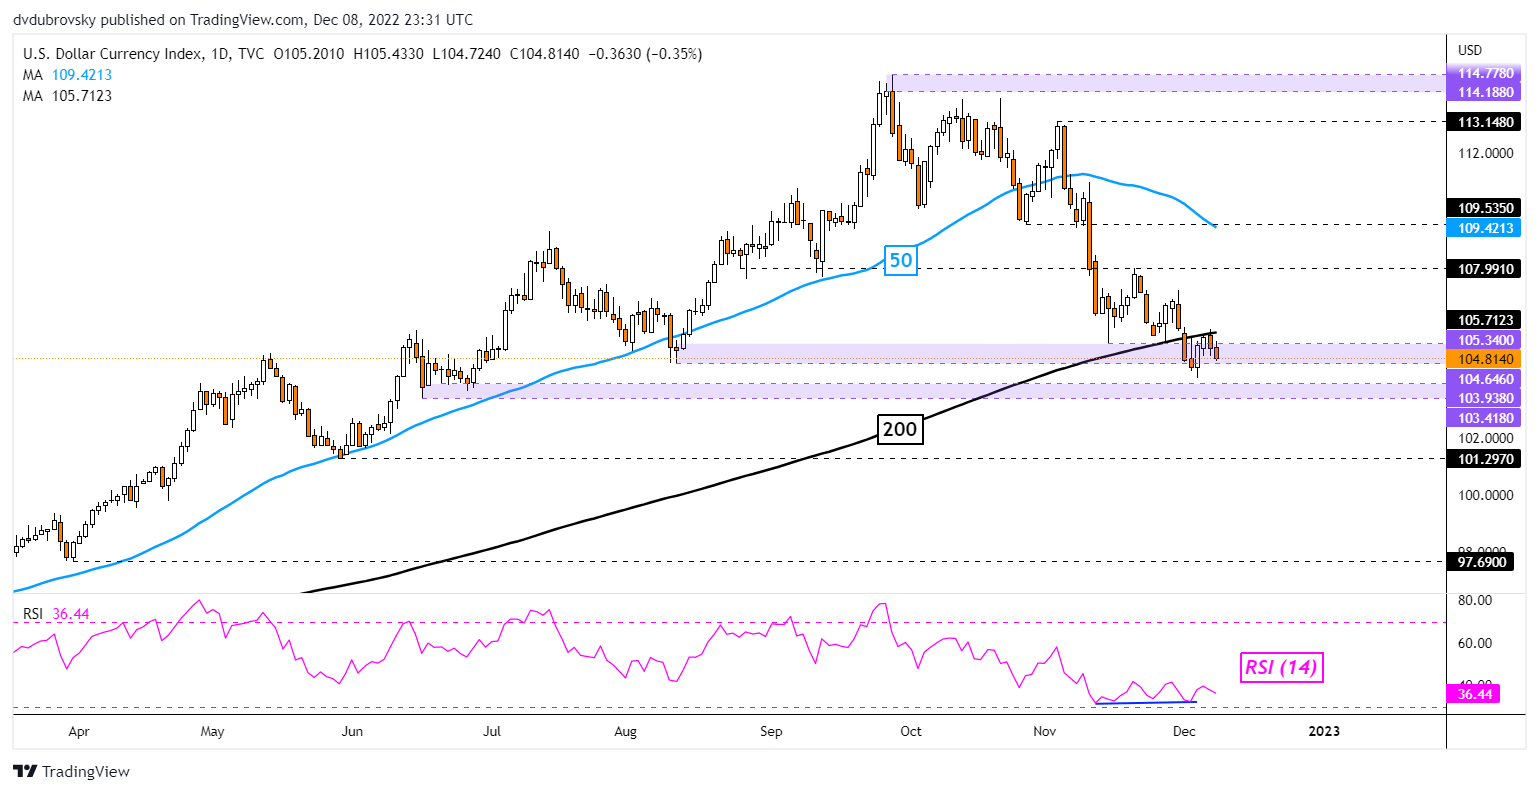
As for the DXY Dollar Index, the currency continues to consolidate around the 105.34 – 104.64 inflection zone. Prices are also trying to confirm a breakout under the key 200-day SMA. That could open the door to a broader shift in USD’s direction, exposing the 103.41 – 103.93 support zone from June. In the event of a turn higher, keep a close eye on the 50-day SMA< which could reinstate the near-term downside bias.

The biggest US banks are bracing for a worsening economy next year as inflation threatens consumer demand.
JPMorgan Chase Chief Executive Jamie Dimon told CNBC that consumers and companies are in good shape, but said that may not last much longer as the economy slows down and inflation erodes consumer spending power.
“Those things might very well derail the economy and cause this mild to hard recession that people are worried about,” he said.
US consumers have $1.5 trillion in excess savings from pandemic stimulus programs, but it may run out some time in mid-2023, Dimon said. He also said the Federal Reserve may pause interest rate rises for 3-6 months after lifting them to 5%, but that this may “not be sufficient” to curb high inflation.
The US central bank last month raised rates by 75 basis points for the fourth consecutive time, taking them to 3.75-4%, but also signalled hopes to shift to smaller hikes as soon as its next meeting.

Inflation is impacting consumers’ savings, while US banks brace for recession. Image: Statista.
Stock markets around the world have fallen this week amid concerns about economic stagnation next year.
European shares have been dragged down by weakness in healthcare and rate-sensitive tech stocks, with investors concerned about a global economic slowdown in the run-up to a raft of major central bank decisions.
The Europe-wide STOXX 600 index fell as optimism around China easing its COVID-19 restrictions was overshadowed by worries around interest rates and the likelihood of recession.
The European Central Bank, US Federal Reserve and Bank of England all meet next week to discuss monetary policy. The Reserve Bank of Australia offered a glimpse of decisions to come after raising rates to a 10-year high and sticking with its projection that more hikes are needed to cool inflation.
“We are again seeing global recession fears rise,” Equiti Capital’s Head Macro Economist Stuart Cole told Reuters. “With equities, specifically, there’s also a realization that a lot of corporations were far too optimistic and the cost of living crisis is really going to curtail aggregate consumption going forward.”

The COVID-19 pandemic led governments to spend massively in emergency support, forcing them to run big deficits that have resulted in historically and rising high debt. The debt to GDP ratio by country, particularly seen in Europe, Japan and other large, global economies, has surged. This debt constitutes a significant risk as central banks start to raise interest rates, making new debt more expensive and existing bonds worth less. Central banks are also halting asset purchases, removing an important price support for government bonds.
Source: Visual Capitalist
Brookings Institution economists have calculated that overall global debt rose by 30 percentage points in 2020, to 263% of GDP. Government debt rose 13 points to 97% of GDP, with advanced economies rising 16 points to 120%.
Governments threw debt caution to the winds as central bank purchases of bonds effectively monetized the debt, allowing politicians to spend and borrow freely. Ultra-low interest rates, in some cases negative, reduced the cost of borrowing.
Modern monetary theory had already paved the way for this change in attitude by hypothesizing that countries with fiat currencies, such as USD or JPY, could issue debt more or less without limits. However, mainstream economists argue that high levels of debt stifle growth and are not sustainable. They cite problems like higher taxes, lower future incomes, and growing inequity between generations.
The ratio of government debt to GDP soared especially in the big advanced economies. In the US, that ratio reached 137.2% in 2021, according to estimates by the administration. That’s up from 128.1% in 2020, and 106.8% in 2019.
Before interest rates fell, a 60% ratio was considered the maximum sustainable and 100% seemed outrageously high. The European Union enshrined the 60% ratio in its so-called Stability Pact limiting debt to 60% and deficits to 3% of GDP for those using the joint euro currency. The EU, which observed these limits only fitfully in the past, has now bowed to reality and suspended them through 2023.
The league champion in debt to GDP has been Japan, where government debt rose to 266% of GDP by the end of 2020. Japan has defied conventional debt rules for years due to the public’s high propensity to save and to channel these savings into domestic bonds. But the 2020 figure was up significantly from 238% in the previous year.
Greece is a distant second with 193% in 2021, but the Greek economy is No. 53 in the world while Japan is No. 3 and has a much bigger impact.
China, the world’s second-largest economy, registered a 2020 debt ratio of 66.8%, but the reliability of data from the notoriously opaque economy is an open question. The UK, which ranks fifth among world economies, came in at 94% in 2020, up from 82.7% the previous year.
Debt amounts and debt to GDP ratios for any country can vary considerably depending on which figures are used.
President Joe Biden boasts that the US government will reduce this year’s deficit by $1.5 trillion as government support for businesses and individuals fades out. But a lower deficit will slow the build-up of debt but by itself won’t reduce the debt to GDP ratio.
The optimistic plan for reducing the elevated debt to GDP ratio in the US and other advanced economies rests on strong economic growth (increasing the GDP denominator) that outpaces the growth in debt, which should be constrained by fiscal discipline.
This is easier said than done. Another scenario would see surging inflation reducing the relative amount debt, while at the same time allowing growth in the nominal GDP. Fitch Ratings, for one, has forecast that inflation in 2022 can bring a reduction in the global debt to GDP ratio by 2.0 percentage points.
Inflation has its own costs, however, and poses a political problem. A central bank-induced recession to tame inflation would lower GDP and likely increase the deficit by reducing tax revenue. There is, in short, no easy way out.

Nobody likes to be a loser, but taking losses well is required in order to be a winner. Just ask some of the most prolific hedge fund managers of all time. George Soros once said (I’m paraphrasing), it isn’t about being right, it’s about how much you make when you are right versus how much you lose when you are wrong.
Soros’ extremely successful disciple, Stanley Druckenmiller, once said in an interview that he estimates he is right about 60% of the time. This means he is wrong 40% of the time. Paul Tudor Jones, another billionaire macro legend, once said he is wrong about as often as he is right, but he also echoed Soros by saying that what matters the most is how much he makes on his winners when right versus how big the losses are when wrong.
That means that some of the most successful hedge fund managers in the world are wrong, a lot. And they don’t care because it is part of the game and not what really matters most. What they care about is managing the risk on their ideas and seeking asymmetry between their winning and losing ideas.
Accepting losing is of course easier said than done given it is human nature to dislike losing, so for many taking losses frequently can be a jagged pill to swallow. But you should embrace it, actually, because it is just part of the game and what will keep you in the game in the long run. Furthermore, the faster an idea hits its stop the faster you can move onto the next potential winner.
Not all losses are created equally. What should raise red flags is when you are constantly taking losses, or taking outsized losses relative to your wins. A loss could be a function of market conditions not conducive to your trading style/strategy, or it could be something deeper that implies you are not consistently following your trading rules.
When suffering a losing period (drawdown) take a close look at what you are doing. Examine your trade log, go through your journal, see if you are following your trading plan or deviating. If deviating, then you need to figure out what you need to do to get back on track. This is when losing isn’t acceptable, because it is self-inflicted.
However, if you are following your plan it could be a function of a market not conducive to your strategy, and while you should be flexible to adapting to market conditions, a solid time-proven strategy over multiple cycles should still come out ahead. The key here is to be consistent and seeing the strategy through the ups and downs.
Summary:
Resources for Forex Traders
Whether you are a new or experienced trader, we have several resources available to help you; indicator for tracking trader sentiment, quarterly trading forecasts, analytical and educational webinars held daily, trading guides to help you improve trading performance, and one specifically for those who are new to forex.

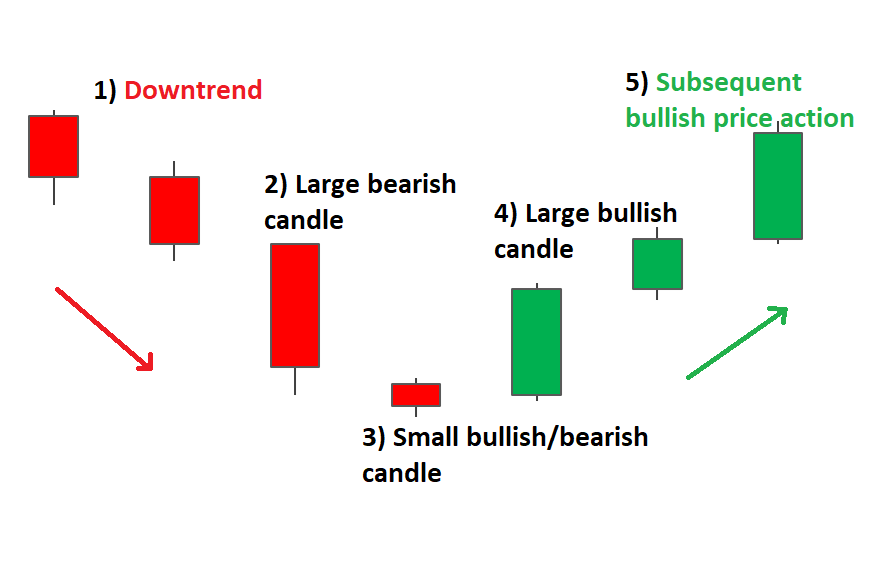
The Morning Star pattern is a three-candle, bullish reversal candlestick pattern that appears at the bottom of a downtrend. It reveals a slowing down of downward momentum before a large bullish move lays the foundation for a new uptrend.
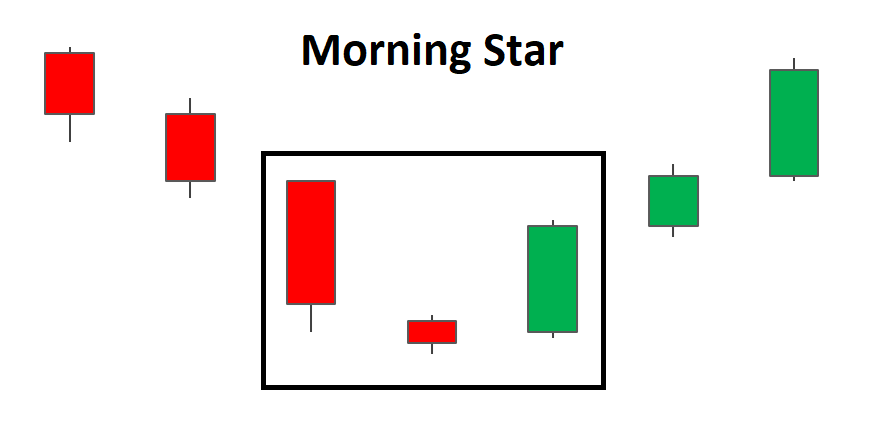
Morning Star Doji
Traders will often look for signs of indecision in the market where selling pressure subsides and leaves the market somewhat flat. This is where Doji candles can be observed as the market opens and closes at the same level or very close to the same level. This indecision paves the way for a bullish move as bulls see value at this level and prevent further selling. The appearance of the bullish candle after the Doji provides this bullish confirmation.

The bearish version of the Morning Star is the evening star and it signifies a potential turning point in a rising market ( bearish reversal pattern). The same analysis applied to the Morning Star can be implemented with the evening star however, it will be the opposite direction.
Identifying the Morning Star on forex charts involves more than simply identifying the three main candles. What is required, is an understanding of previous price action and where the pattern appears within the existing trend.
The Morning Star pattern can be observed in the EUR/GBP chart below, where there is an established downtrend leading up to the formation of the reversal pattern.
Looking at the chart, once the formation has completed, traders can look to enter at the open of the very next candle. More conservative traders could delay their entry and wait to see if price action moves higher. However, the drawback of this is that the trader could enter at a much worse level, especially in fast moving markets.
Targets can be placed at previous levels of resistance or previous area of consolidation. Stops can be placed below the recent swing low, as a break of this level would invalidate the reversal. Since there are no guarantees in the forex market, traders should always adopt sound risk management while maintaining a positive risk to reward ratio.

When trading the Morning Star on forex markets, the price will very rarely gap like they do with stocks and so the three-candle pattern usually opens very close to the previous closing level.
The Morning Star, like most candlestick patterns, should be assessed in line with the current trend and whether there is supporting evidence in favour of the trade, when looking at an indicator. Below are the advantages and limitations of the Morning Star pattern:
 Chat now!