Natural Gas Price Downtrend Slows, 4-Hour Chart Reveals Reversal Warnings

Natural Gas Price Downtrend Slows, 4-Hour Chart Reveals Reversal Warnings

Daily Chart – 20-Day Simple Moving Average Catching Up

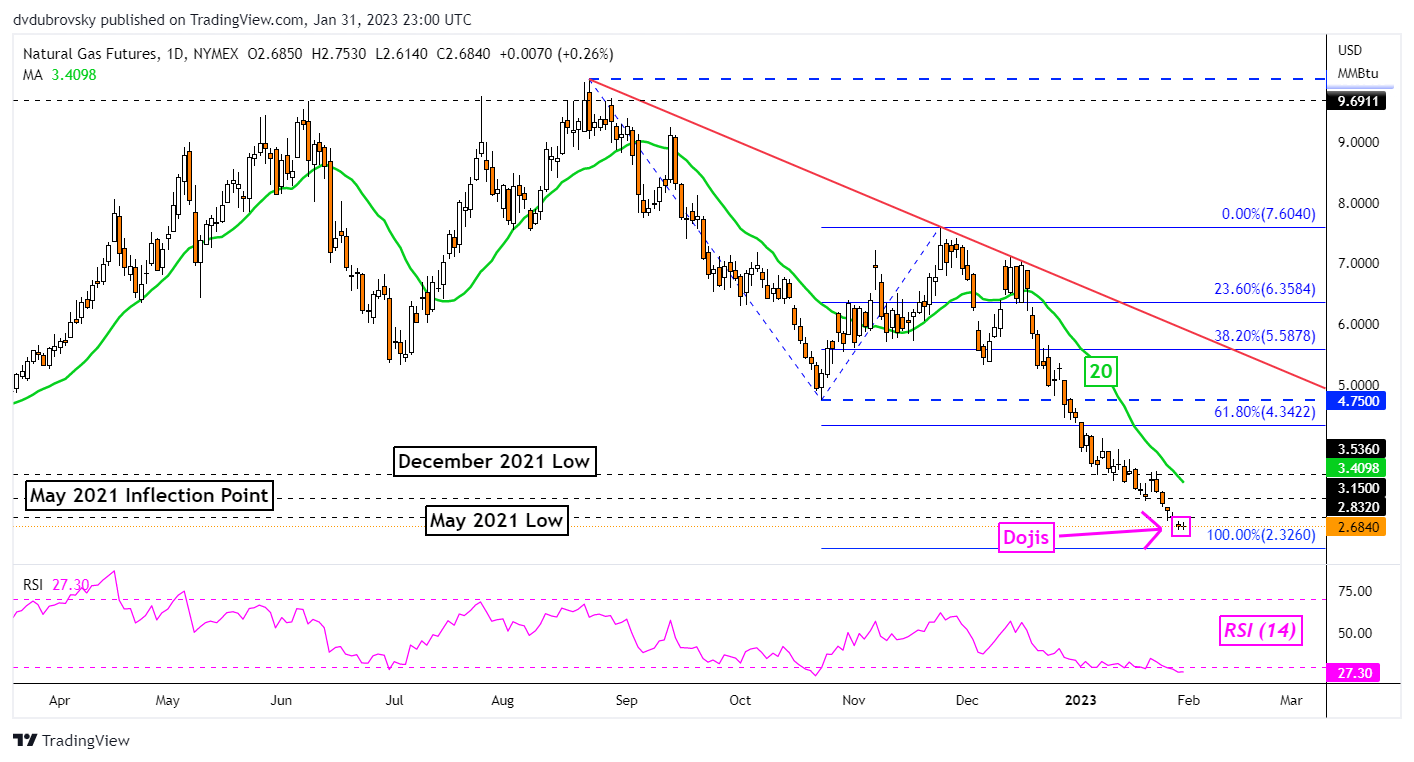
Natural gas prices finished little changed on Tuesday, although prices remain lower for this week so far. Another Doji candlestick pattern emerged over the past 24 hours after an identical one formed on Monday. The Doji itself is not necessarily a sign of an imminent reversal. Rather, it paints indecision, especially when it occurs within trending markets.

Follow-through remains important to watch over the remaining 24 hours. Downside momentum is slowing as of late. This is bringing the 20-day Simple Moving Average (SMA) closer into focus. The latter may hold as resistance in the event of a turn higher, maintaining the downside focus. Otherwise, extending losses place the focus on the 100% Fibonacci extension level at 2.326.
Daily Chart – 20-Day Simple Moving Average Catching Up

4-Hour Chart – Bullish Engulfing in Focus

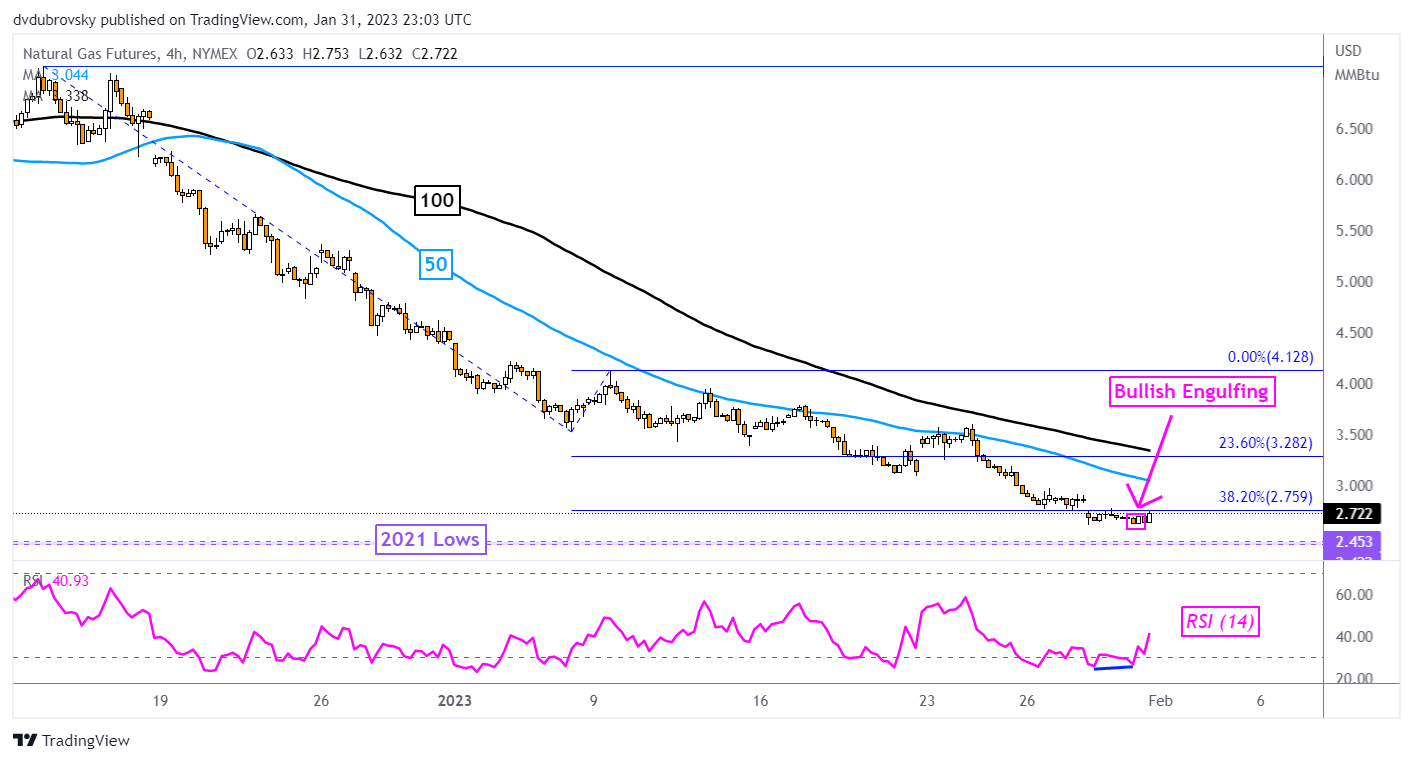
Zooming in on the 4-hour chart reveals increasingly emerging reversal cues. Positive RSI divergence is now present, showing that downside momentum is fading. Furthermore, a Bullish Engulfing emerged within the past 24 hours. Prices subsequently pushed slightly higher. Albeit further upside confirmation is likely needed to argue the case for a material directional shift.

Immediate resistance is the 38.2% Fibonacci extension level at 2.759. Natural gas also remains below the 50- and 100-period SMAs in this timeframe. The latter two could maintain the downside focus. If not, prices may push higher toward the current 2023 high at 4.128. Otherwise, extending losses would open the door to facing 2021 lows (2.422 -2.453).
4-Hour Chart – Bullish Engulfing in Focus


Swiss Franc Jumps but Faces Hurdles Ahead. Where to for EUR/CHF and USD/CHF?

Swiss Franc Jumps but Faces Hurdles Ahead. Where to for EUR/CHF and USD/CHF?

EUR/CHF TECHNICAL ANALYSIS

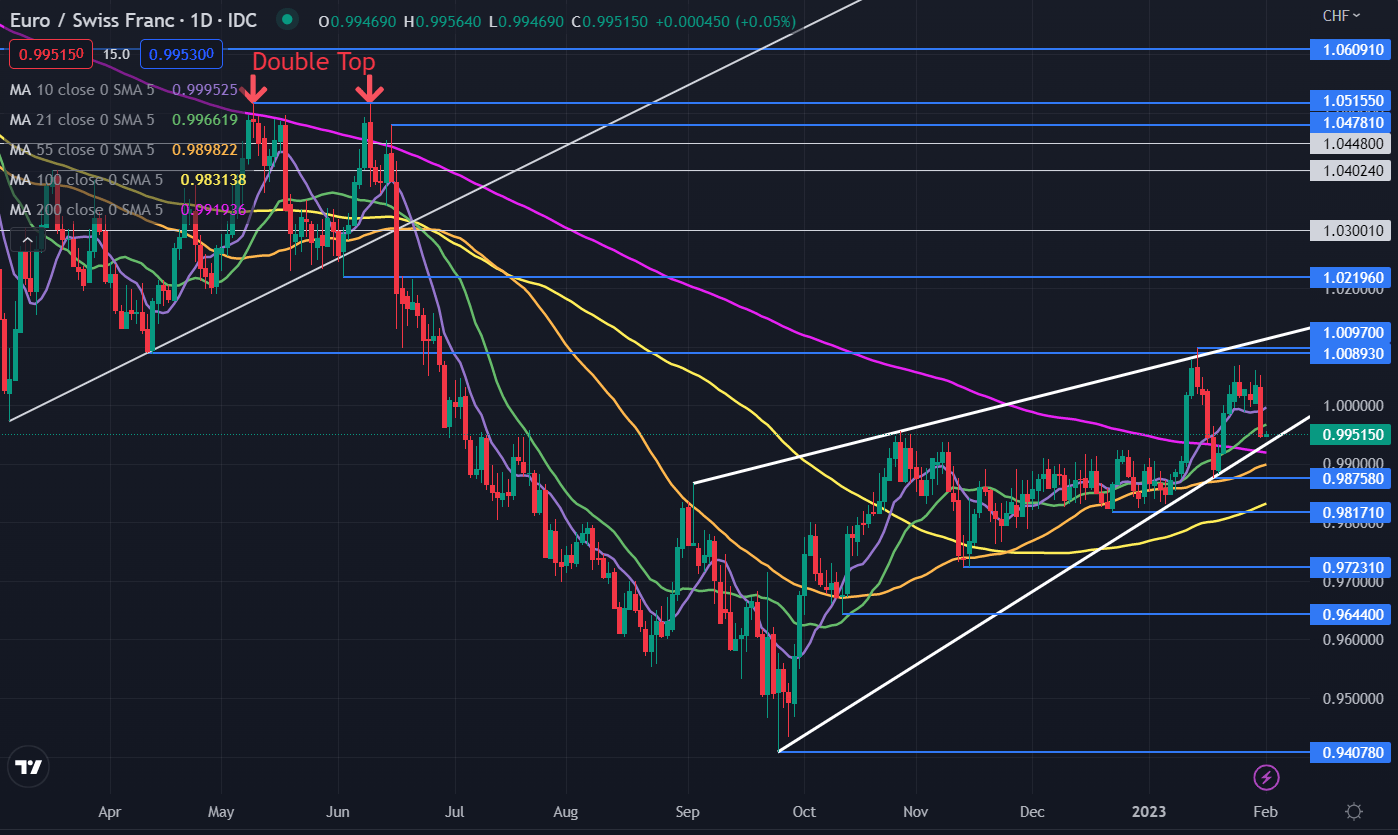
The Swiss Franc saw its largest gain against the Euro since early November on Wednesday after failing to overcome breakpoint resistance last month.

EUR/CHF made a high of 1.0097 in January which was just above a breakpoint resistance level at 1.0089. These levels may continue to offer resistance.

That move also briefly went above an ascending trend line but was unable to sustain the rally. This might signal a false break which could indicate a longer-term reversal.

After making an all-time low at 0.9407, the price action has created a rising wedge formation, also known as an ascending wedge. This can be observed by noting ascending trend lines above and below the price that are converging.

A break below the lower trend line may signal that bearish momentum might unfold.

Prior to EUR/CHF breaking lower yesterday, it was above all short, medium and long-term Simple Moving Averages (SMA).

The move lower beached below the 10- and 21-day SMAs which could signal that short-term bullish momentum has faded.

If EUR/CHF breaks out of the rising wedge on the downside and continues down through the 55-, 100- and 200-day SMAs, this could signal that bearish momentum is evolving.

Support may lie at the previous lows of 0.9876, 0.9817, 0.9723, 0.9644 and 0.9407.

image1.png

USD/CHF TECHNICAL ANALYSIS

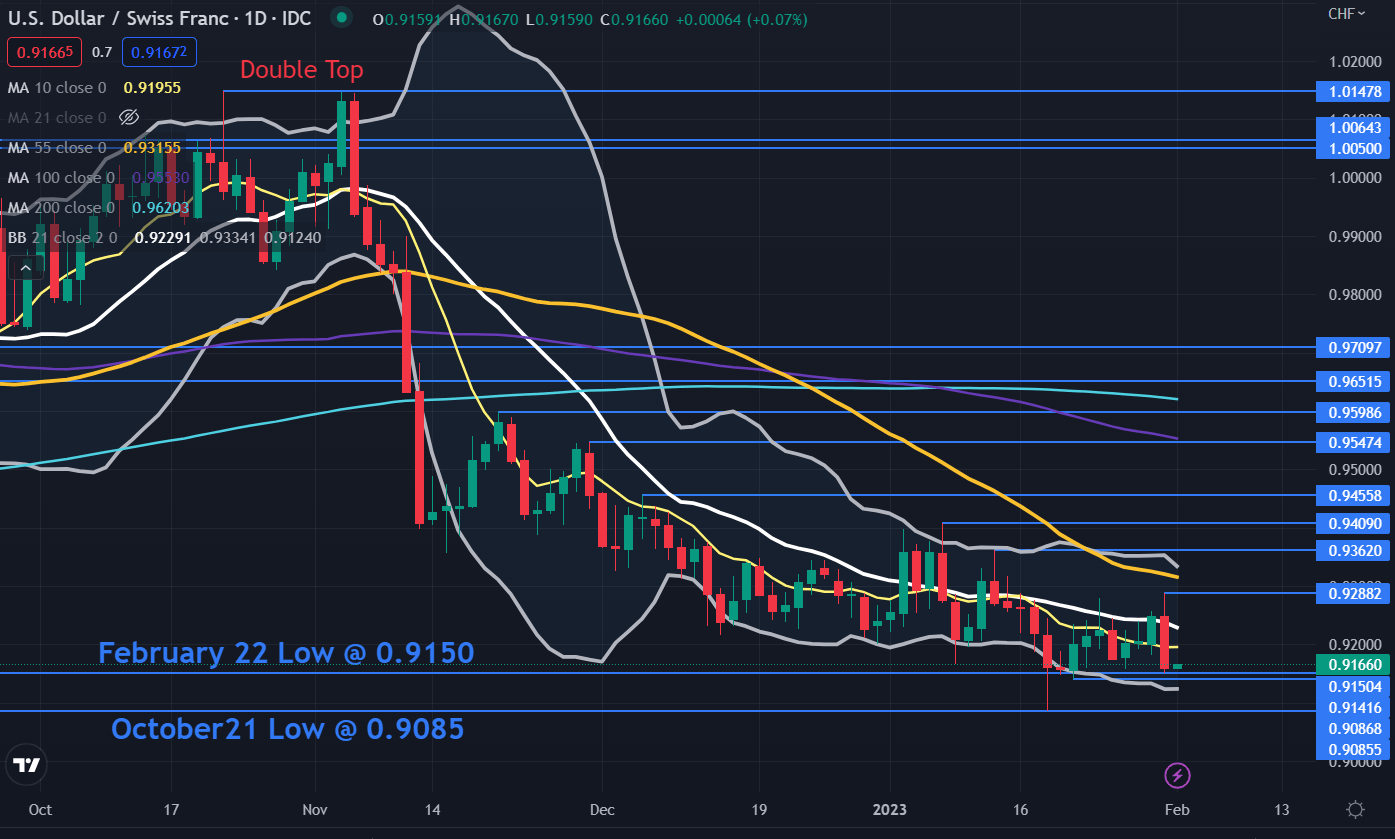
USD/CHF collapsed on Wednesday but paused at the breakpoint support level that was created from the February 2022 low of 0.9150.

It may continue to provide support ahead of the October 2022 low of 0.9087 that was tested and held last month.

USD/CHF has been in a 0.9085 – 0.9409 range for two months with volatility decreasing, as illustrated by the narrowing of the 21-day Simple Moving Average (SMA) based Bollinger Bands.

On the topside, resistance might be offered at the previous highs of 0.9288, 0.9362, 0.9409, 0.9456, 0.9547 and 0.9591.

Although USD/CHF has been range-bound, it is once again below all short, medium and long-term SMAs. It has been in this state several times recently without gaining directional momentum. A breakout of the range might see momentum unfold in that direction.

image2.png


Singapore dollar Technical Outlook: Imminent Pause in USD/SGD’s Slide?

Singapore dollar Technical Outlook: Imminent Pause in USD/SGD’s Slide?

USD/SGD TECHNICAL FORECAST – BEARISH

The Singapore dollar’s rally against the US dollar could slow or even pause as it approaches a major resistance area.

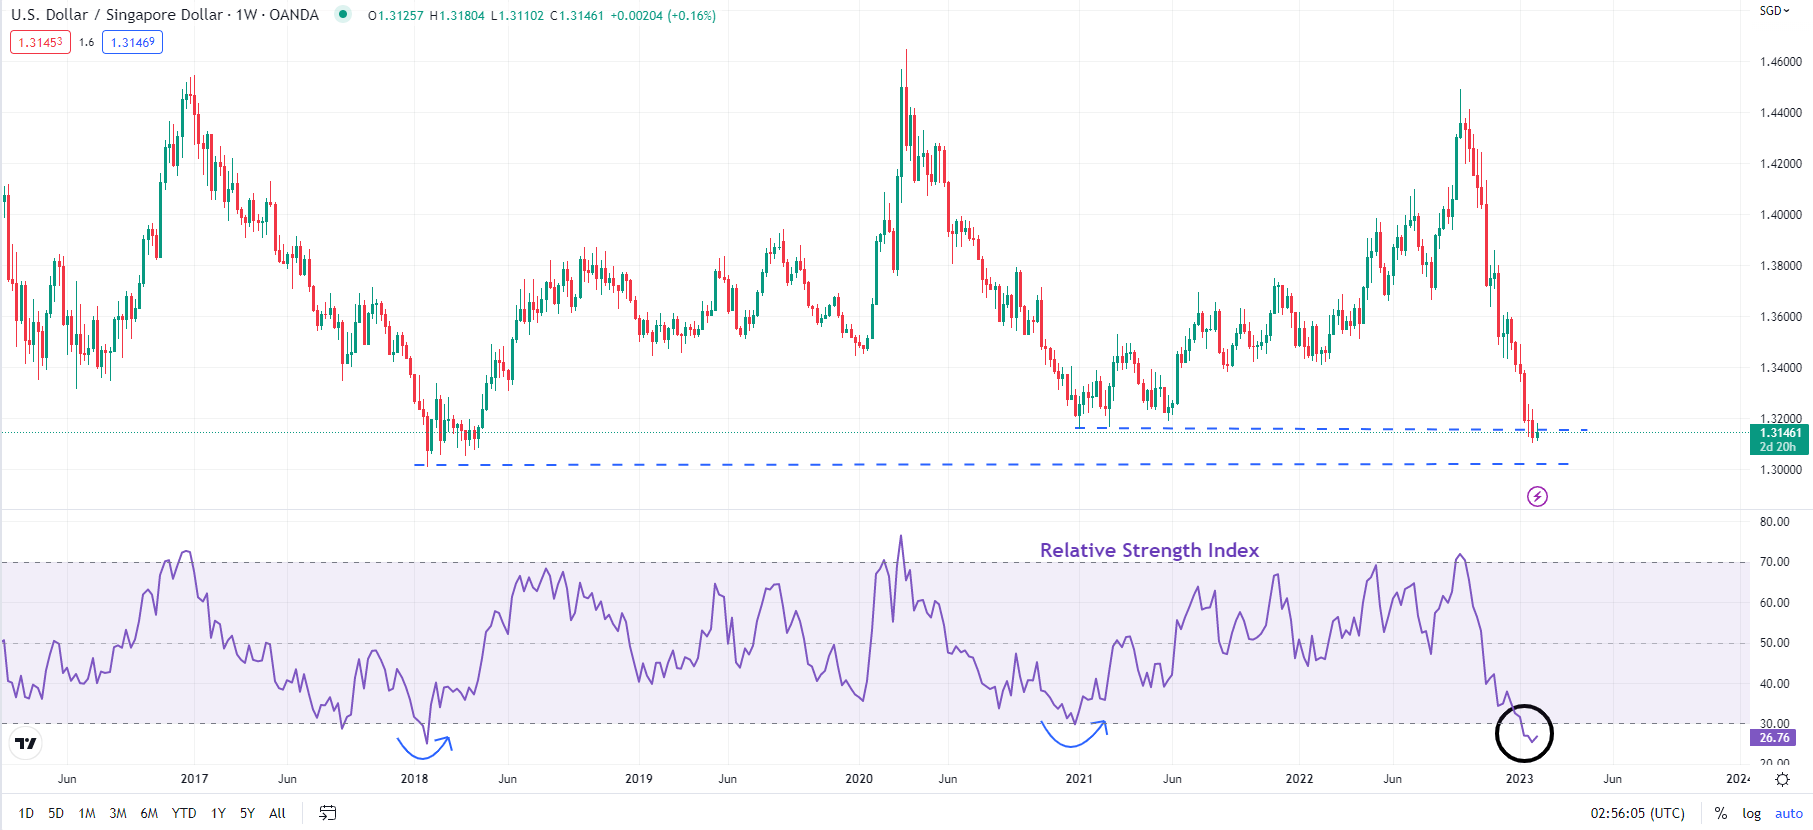
USD/SGD is deeply oversold as it tests key support on the lower edge of the channel is a horizontal trendline from 2015 (at about 1.3150), slightly above the 2018 low of 1.3000. A positive momentum divergence (lower lows in price associated with a stalling in the 14-day Relative Strength Index) suggests that the four-month slide is losing steam given the pair is down close to 10% since it made a 2.5-year high in September.

USD/SGD Weekly Chart

image1.png

Some short-term consolidation/ a minor pause in the USD/SGD’s slide can’t be ruled out, especially given the US Federal Reserve interest rate decision later today. The market widely expects the Fed to hike rates by 25 basis points to 4.5%-4.75%, and the accompanying statement will be closely watched. A ‘hawkish hike’ could lead to a temporary bounce in global USD. The futures market currently expects rates to top around 4.9% on the growing conviction that US inflation could be peaking.

USD/SGD Daily Chart

image2.png

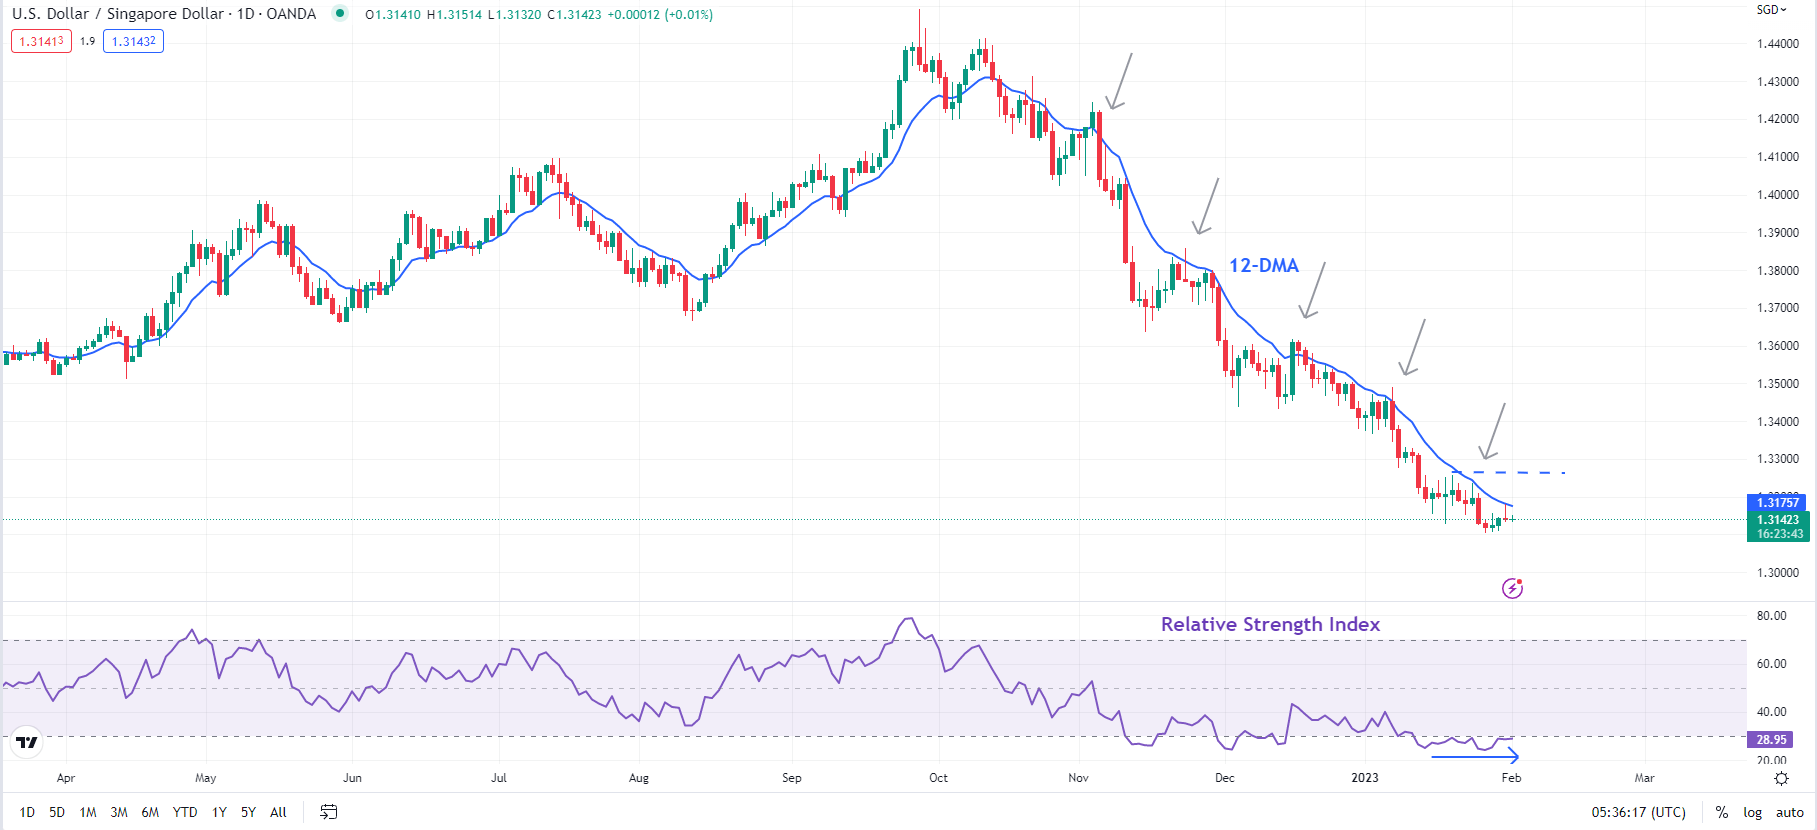
A key signpost to watch would be the immediate ceiling on the 12-day moving average – the pair hasn’t breached the average decisively since the end of 2022 has been capped by the shorter moving average (see daily chart). Subsequent resistance is at the January 19 high of 1.3250. However, beyond any short-term pause, the bias for USD/SGD remains down from a multi-month perspective, ashighlighted in mid-November that the worst could be over for the Singapore dollarand apotential move toward 1.3150 in December. Any break below the converged support at 1.3000-1.3150 would trigger a breakout from the multi-year sideways channel, opening the door toward the 2011 low of 1.1985.

GBP/USD Technical Outlook: Short-term Range Intact

GBP/USD Technical Outlook: Short-term Range Intact

GBP/USD SHORT-TERM TECHNICAL FORECAST – NEUTRAL

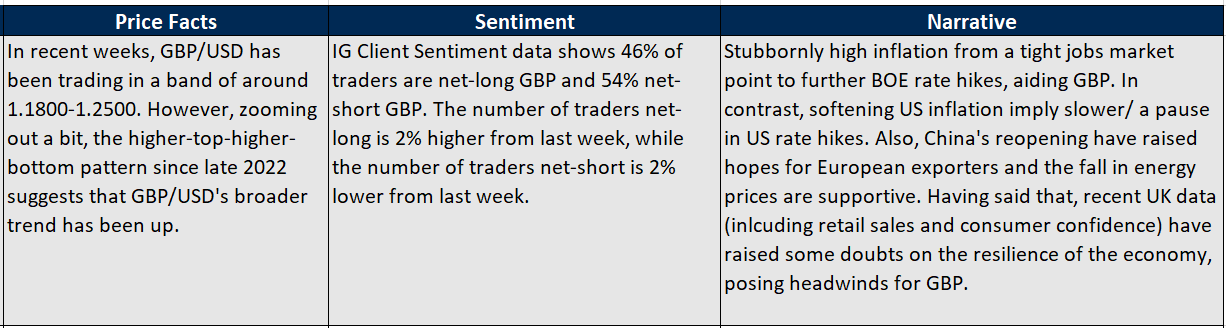
GBP/USD’s short-term range prospects haven’t changed as we enter the final countdown to key interest rate decisions, beginning with the US Federal Reserve today, and the Bank of England (BOE) and the European Central Bank (ECB) tomorrow.

The Fed is widely expected to hike rates by 25 basis points to 4.5%-4.75% on Wednesday. The key focus will be the accompanying statement, especially any guidance on the path of interest rates. The ECB and the BOE are widely expected to raise interest rates by 50 bps. A ‘hawkish hike’ by the BOE could support GBP from a medium-term perspective.

Price Facts, Sentiment, Narrative

image1.png

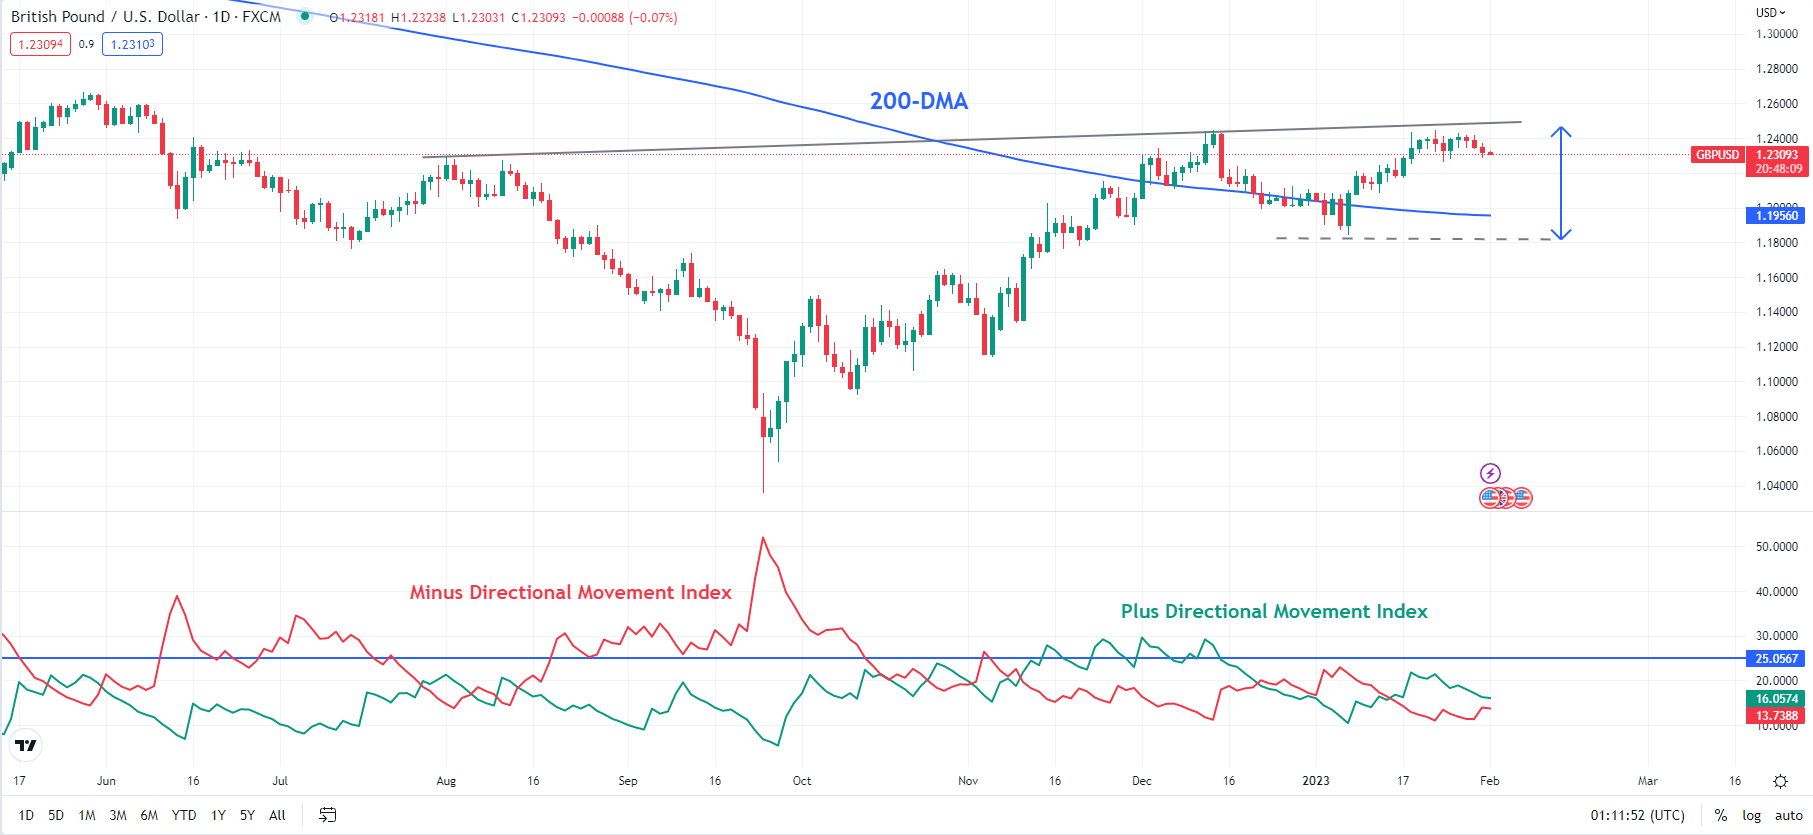
On technical charts, there is a case for medium-term strength in GBP/USD, firsthighlighted in Octoberand subsequentlyin mid-November. The price action in recent months bolsters the chances of a significant upside in the pair. Asthe January 20 update highlighted, a decisive break above key converged resistance: a slightly upward-sloping trendline from August (now at about 1.2490), roughly coinciding with the December high of 1.2445 would trigger a major reverse head & shoulders pattern (the left shoulder at the July low, the head at the September low, and the right shoulder at the January low), pointing to a potential rise toward the 2021 high of 1.4250.

GBP/USD Daily Chart

image2.png

In the immediate term, prospects for GBP/USD haven’t changed much from the previous updates (seeend of November update hereandmid-January here). The pair continues to be in the 1.1840-1.2490 band. As the daily chart shows, Plus Directional Movement Index (DMI) and Minus DMI continue to be below 25, pointing to range conditions in the short term.

GBP/USD 240-Minutes Chart

image3.png

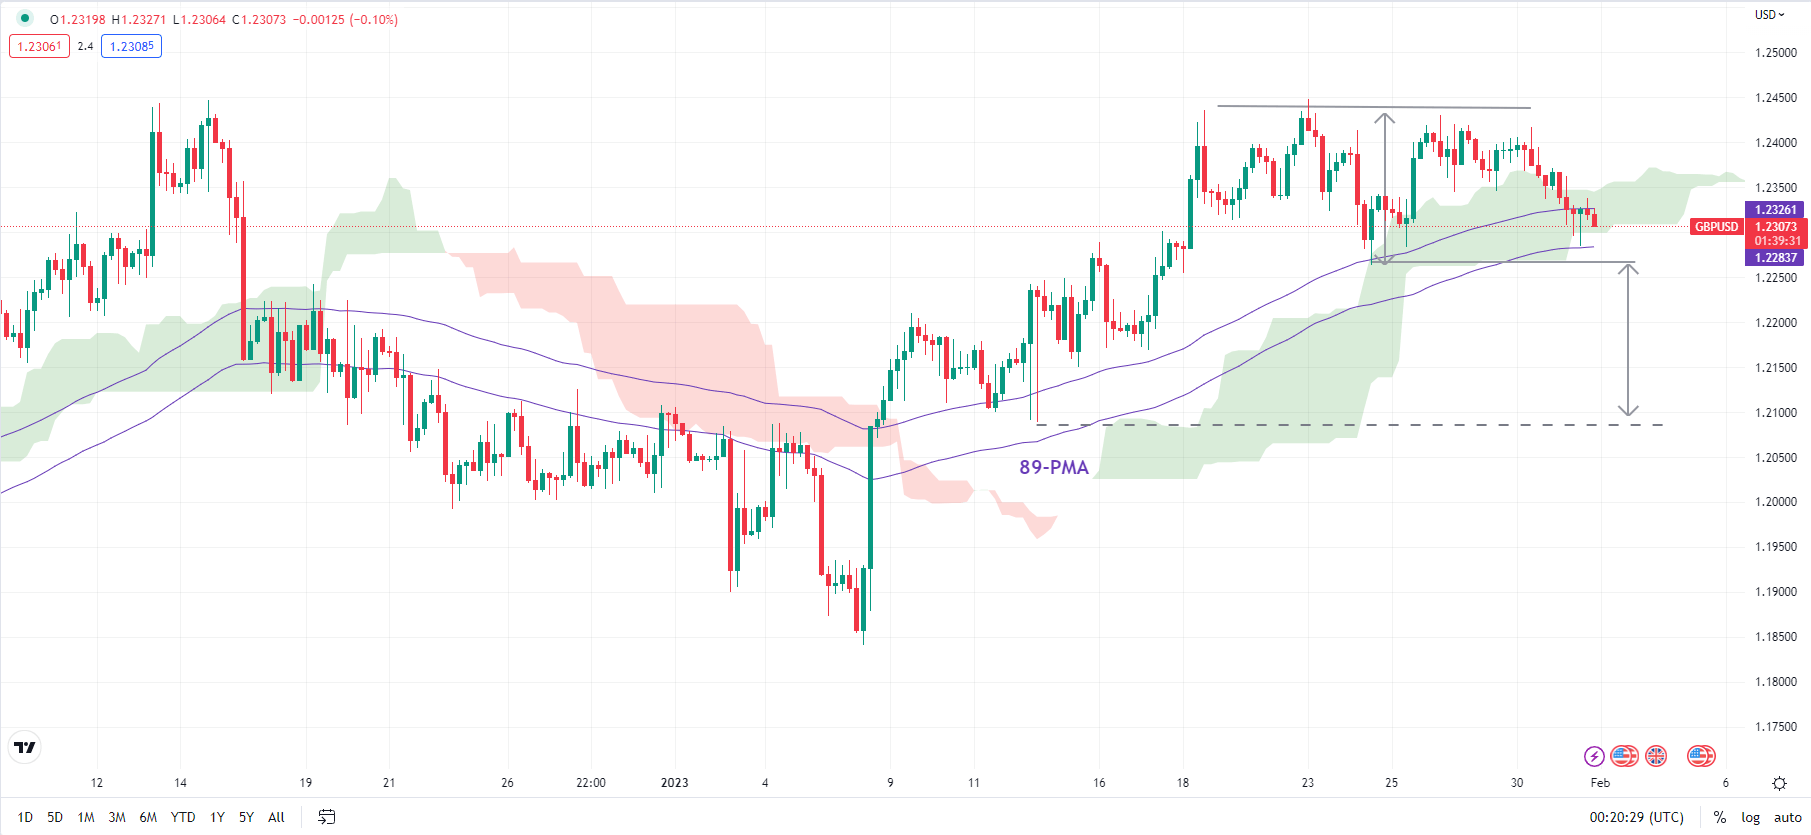
Zooming in on intraday charts, last week’s low of 1.2260 is initial support. Any break below could trigger a minor double top (last week’s highs), raising the odds of a drop toward 1.2100. However, there is quite strong support at the lower end of the range at 1.1840.

Gold Treads Water Ahead of a Cascade of Central Bank Hikes. Where to for XAU/USD?

Gold Treads Water Ahead of a Cascade of Central Bank Hikes. Where to for XAU/USD?

Gold had a look lower at the US$ 1,900 handle in the US session but quickly recovered back above US$ 1,925. At the same time, the DXY Index, a benchmark measure of the US Dollar, moved to higher ground before collapsing into the New York close.

Wall Street had a stellar session on hopes that the Fed Chair Jerome Powell might soften the hawkish stance at today’s Federal Open Market Committee (FOMC) meeting.

Prior to the media blackout, several committee members had been sprouting the message that 25 basis points seemed like the appropriate dosage for tightening and that rates will need to remain high for ‘a long period’.

Interest rate markets have a 25 bp lift baked in. It is the post-meeting commentary that has the potential to set off market moves.

In addition, the European Central Bank (ECB) and the Bank of England (BoE) will be meeting tomorrow, and the market expects both banks to tighten by 50 bp.

Treasury yields slipped a few bps overnight but have done very little through the Asian session today.

The Nasdaq posted a 1.67% gain in its cash session, but futures are indicating a soft start to their day trading.

APAC equities have had a quiet day, although most indices are slightly positive. Likewise, currency markets are lying in wait to see what comes of the Fed meeting, although the Swiss Franc posted solid gains yesterday.

After testing lower levels yesterday, crude oil has held onto the consequent recovery. The WTI futures contract is above US$ 79 bbl while the Brent contract is around US$ 85.80 bbl at the time of going to print.

After the European CPI number, the US will see figures on mortgage applications, employment and the ISM survey. The Fed remains the focus late in the day.

GOLD TECHNICAL ANALYSIS

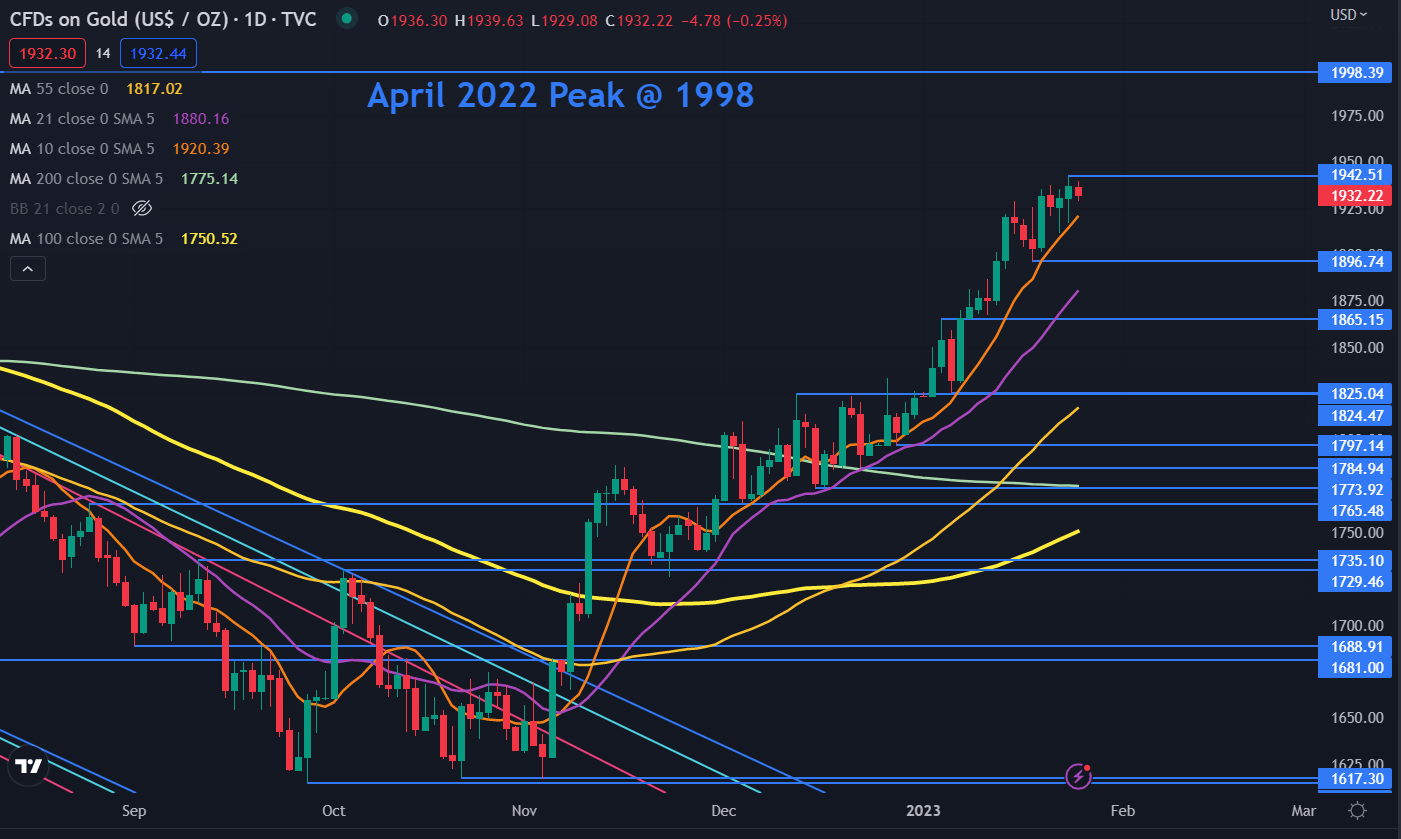
Gold has dipped below the 10-day simple moving averages (SMA), but remains above all other short, medium and long-term daily SMAs.

This may suggest a pause in short-term bullish momentum, but that underlying medium and long-term bullish momentum remains intact for now. The price remains in an ascending trend channel.

Resistance might be at the recent peak of 1949 or the April 2022 high of 1998.

On the downside, support may lie at the lows of 1900 and 1897 or the breakpoints of 1865 and 1825.

image1.png


Australian Dollar Price Action Setups: AUD/USD, AUD/JPY, GBP/AUD, AUD/NZD

Australian Dollar Price Action Setups: AUD/USD, AUD/JPY, GBP/AUD, AUD/NZD

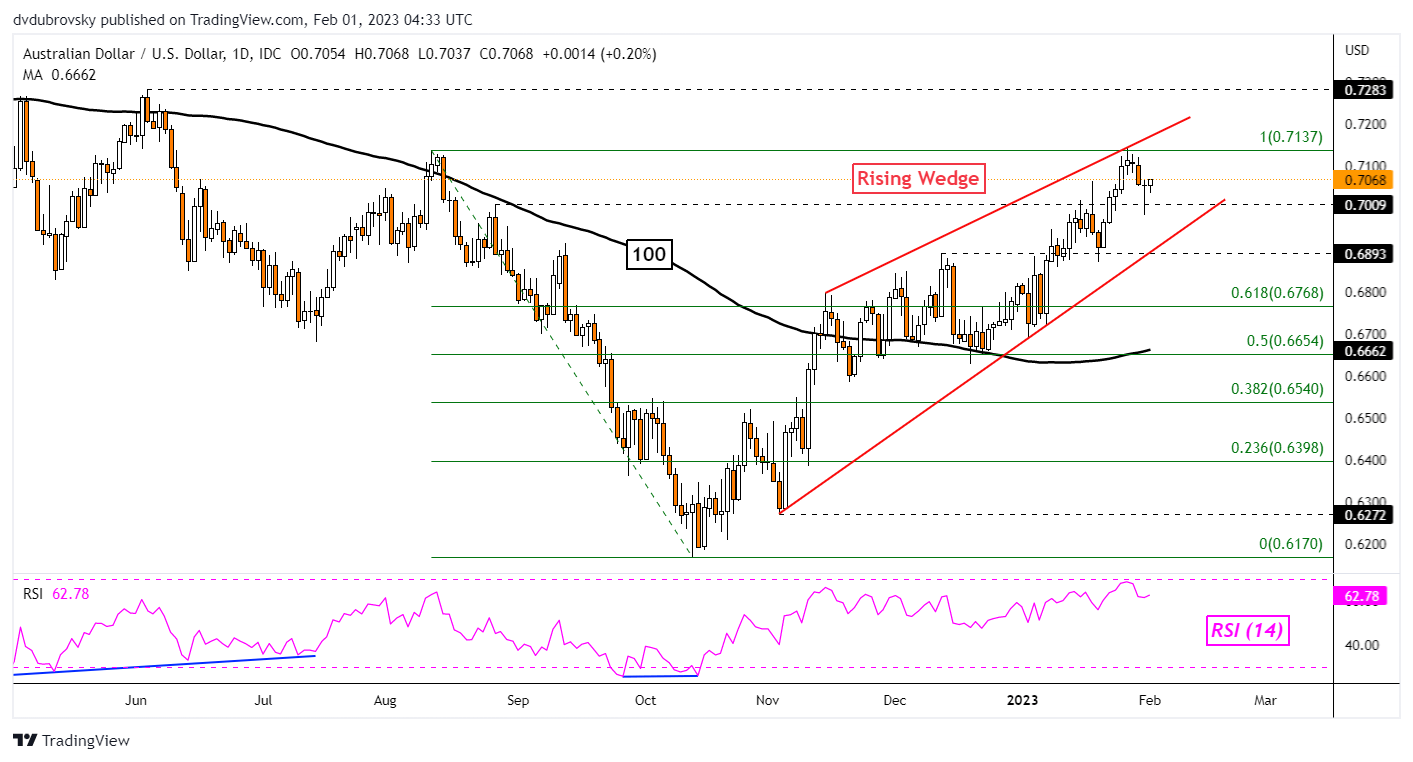
AUD/USD Daily Chart – Rising Wedge Eyed

The Australian Dollar remains pointed higher against the US Dollar with prices continuing to trade within a bearish Rising Wedge. Over the past 24 hours, AUD/USD was unable to hold a drop through the 0.7009 inflection point, leaving behind a fairly long lower wick. This is placing the focus on the August 2022 high at 0.7137. A breakout above this price could open the door to uptrend resumption. Otherwise, another attempt to clear 0.7009 places the focus on the rising floor of the wedge.

AUD/USD Daily Chart – Rising Wedge Eyed

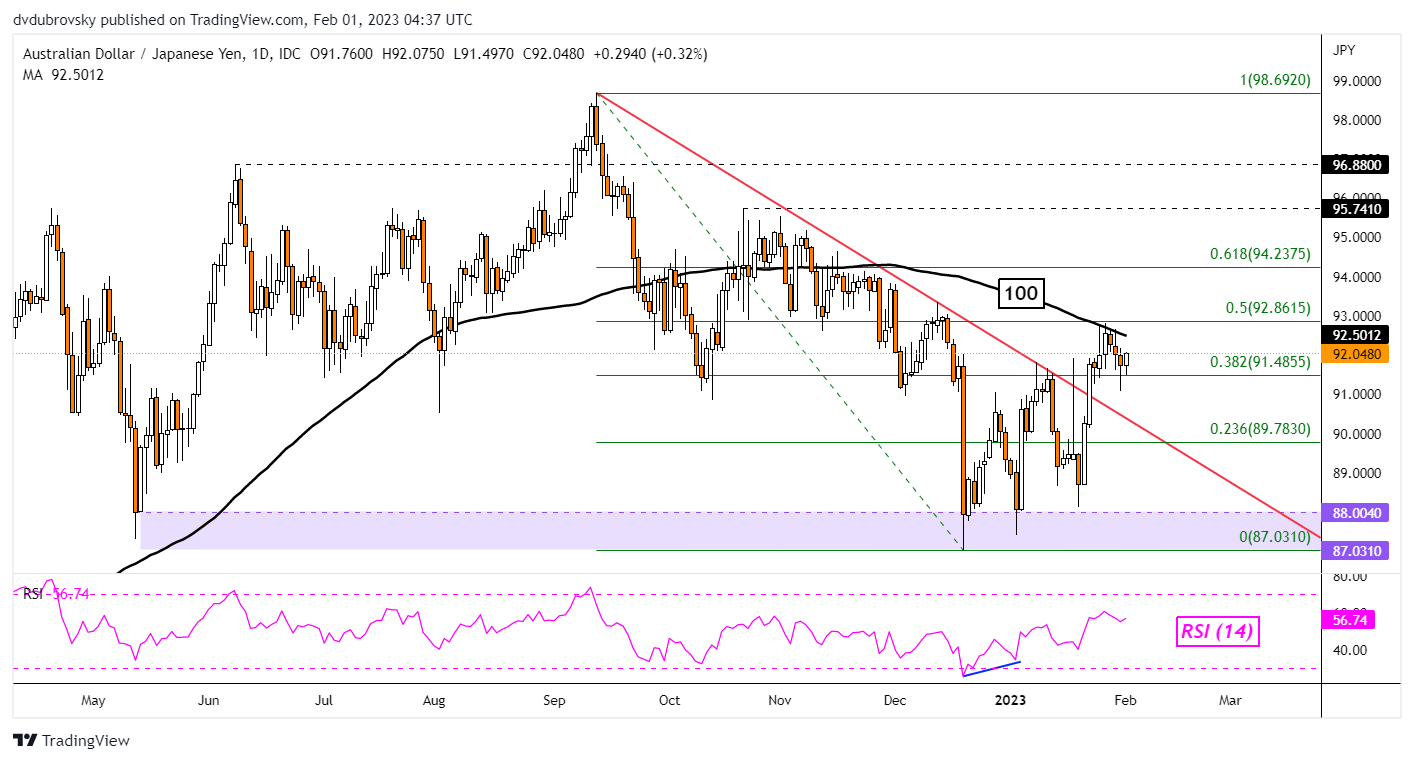
AUD/JPY Daily Chart – 100-Day SMA in Focus

The Australian Dollar has been struggling to hold a bullish breakout against the Japanese Yen. Earlier in January, AUD/JPY confirmed a push above the falling trendline from September. That opened the door to reversing the downtrend seen towards the latter half of 2022. Now, the 100-day Simple Moving Average (SMA) is holding as resistance, maintaining the downside focus. Clearing support, which is the 38.2% Fibonacci retracement level at 91.485, exposes lows from December. Otherwise, climbing above the SMA exposes the October high at 95.741.

AUD/JPY Daily Chart – 100-Day SMA in Focus

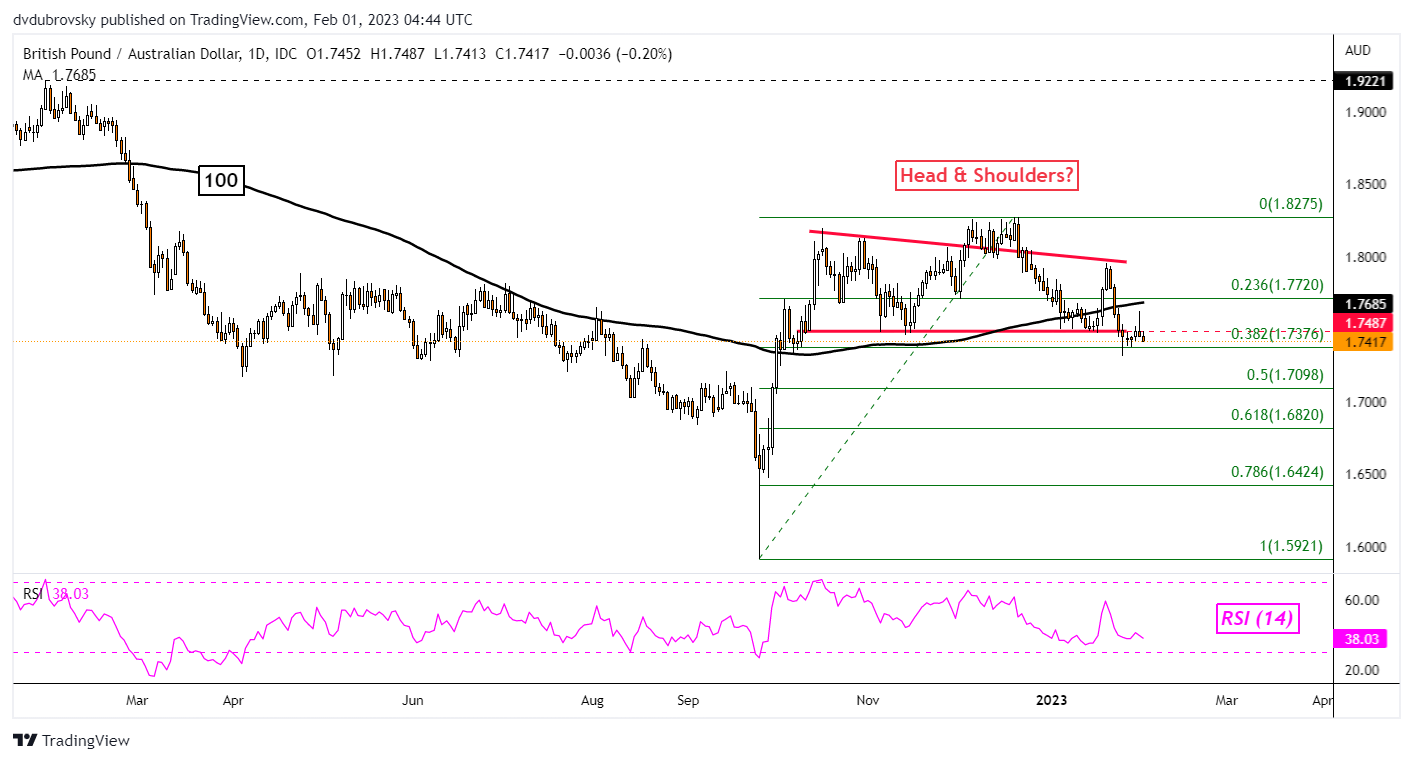
GBP/AUD Daily Chart – Head & Shoulders?

The Australian Dollar appears to be setting the stage for gains against the British Pound. GBP/AUD seems to have been carving out a bearish Head & Shoulders chart formation since September. Prices are attempting to clear the neckline around 1.7487. Confirming a breakout lower could open the door to extending losses toward the 61.8% Fibonacci retracement level at 1.682. Otherwise, the right shoulder of the chart pattern could play out as key resistance around 1.8.

GBP/AUD Daily Chart – Head & Shoulders?

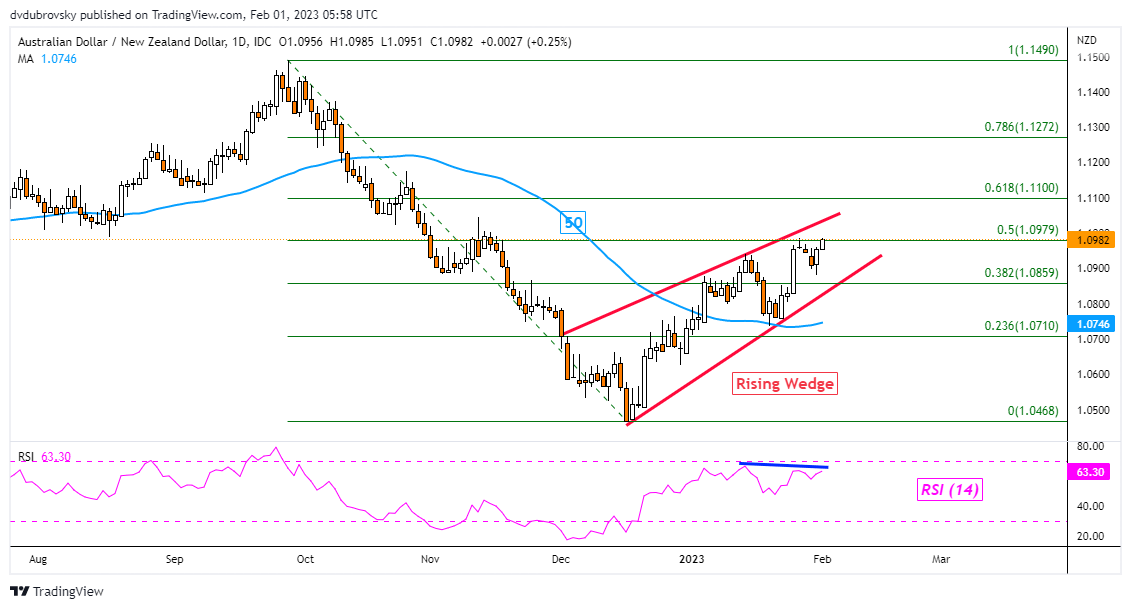
AUD/NZD Daily Chart – Eyes on Rising Edge

The Australian Dollar may continue trading higher against the New Zealand Dollar. That is because AUD/NZD is trading within the boundaries of a Rising Wedge chart pattern. While the formation itself can carry bearish implications, that comes into play if prices confirm a breakout under the wedge. Such an outcome opens the door to resuming the dominant downtrend from the end of last year. Clearing immediate resistance at 1.0979 exposes the 61.8% Fibonacci retracement level at 1.11.

AUD/NZD Daily Chart – Eyes on Rising Edge