Preliminary US GDP Q1 Report: The US Dollar may benefit from indications of a recession.

Preliminary US GDP Q1 Report: The US Dollar may benefit from indications of a recession.

The Gross Domestic Product (GDP) report for the first quarter of 2023, as released by the US Bureau of Economic Analysis (BEA) on April 27th, is expected to show an expansion of the US economy at an annualized rate of 2.0%, after the 2.6% growth recorded in the GDP report for the fourth quarter of 2022.

The US Dollar (USD) has been weakening against its major rivals since early March after the collapse of the Silicon Valley Bank reminded markets of the negative impact of the Federal Reserve’s (Fed) tight monetary policy on the financing conditions. The GDP report will provide fresh clues regarding the state of the United States economy in early 2023 and drive the US Dollar’s action by influencing the market pricing of the Fed’s policy outlook.

US Gross Domestic Product forecast: What numbers could tell us

Thursday’s US economic docket highlights the release of the preliminary GDP print for the first quarter, scheduled at 12:30 GMT. The first estimate is expected to show that the world’s largest economy expanded by 2.0% at an annualized pace during the January-March period.

Yohay Elam, FXStreet Senior Analyst, thinks markets will pay close attention to the severity of the slowdown in the first quarter’s economic activity.

“There is no doubt that the US economy is slowing, but the pace matters. A deceleration to 2% would be the sweet spot for markets – ongoing expansion without fears of an imminent recession,” Elam explains. “It would represent a return to the “new normal” GDP growth figures that characterized the post-financial crisis era. Conversely, a faster clip would stoke fears of further rate hikes by the Fed, while slower growth would raise recession angst. The middle 2% would be Goldilocks for markets and adverse for the US Dollar.”

When is GDP report released and how can it affect EUR/USD?

The GDP report is scheduled for release at 12:30 GMT on Thursday. The US Dollar stays dangerously close to multi-month lows against the Euro ahead of this data amid diverging policy outlooks between the European Central Bank (ECB) and the Fed.

Although the backward-looking data might do little to influence market expectations about the Fed’s next policy move, it could revive fears over the US economy tipping into recession later in the year. In that scenario, the Fed “policy pivot” narrative could gain traction and force the USD to stay on the back foot. That said, an upward surprise of the US GDP print could revive expectations about the Fed staying focused on battling inflation and help the Greenback stage a rebound, at least with the initial reaction.

According to the CME Group FedWatch Tool, markets are nearly fully pricing in one more 25 basis points (bps) Fed rate hike at the May 2-3 policy meeting but seeing a more than 80% probability that there will be an at least one 25 bps rate cut by September policy meeting.

Eren Sengezer, Senior Analyst at FXStreet, shares his technical outlook for EUR/USD: “The Relative Strength Index (RSI) indicator on the daily chart stays near 60, suggesting that EUR/USD has more room on the upside before turning technically overbought. Additionally, the gap between 20-day Simple Moving Average (SMA) and the 50-day SMA continues to widen following the bullish cross seen in early April, supporting the bullish view.”

Eren also points out the key technical levels for the pair: “1.1100 (psychological level) aligns as next resistance for the pair ahead of 1.1160 (static level from March 2022). With a daily close above the latter, the pair could face interim resistance at 1.1200 (psychological level, static level) before targeting 1.1300 (psychological level, static level). On the downside, 1.1000 (20-day SMA, psychological level) forms first support ahead of 1.0900 (static level) and 1.780/1.0760 area (50-day SMA, 100-day SMA).

Raw petroleum Sinks as Opinion Waivers Despite Strong Information. Lower WTI?

Raw petroleum Sinks as Opinion Waivers Despite Strong Information. Lower WTI?

Crude oil slipped lower overnight, filling in the price gap created when OPEC+ announced a cut to production earlier this month.

The inability to hold the gains post the squeeze could be suggestive that demand for energy may not be as strong as anticipated going into the Northern Hemisphere summer.

The structure of the WTI futures market might be leaning toward further weakness if the relationship with RBOB crack spread is maintained. This is the gauge of gasoline prices relative to crude oil prices and reflects the profit margin of refiners.

RBOB stands for reformulated blendstock for oxygenate blending. It is a tradable grade of gasoline. If profitability decreases for refiners, it may lead to less demand for crude.

The OVX index measure volatility in the WTI futures contract in a similar fashion to the way the VIX index is an indicator of volatility on the S&P 500 index.

The move lower in the WTI futures contract saw volatility tic up but it remains relatively subdued. This may suggest that the market is non-plussed about this pullback.

In terms of the demand and supply dynamics, the market appears to be somewhere near equilibrium looking at the front two futures contracts. The price difference between them is only slightly in backwardation, possibly reiterating the market’s comfort level of the current pricing for oil.

Data released by the US Energy Information Agency (EIA) overnight should have been supportive of black gold. The stats revealed that inventories fell by 5.054 million barrels in the week ended 21st April rather than a dip of 1.486 million barrels as anticipated.

The fact that crude fell despite the slide in inventories may highlight the underlying issues that OPEC+ might have identified that led to their production cut. The price is now back to where it was before the announcement.

With the gap filled, oil could be in a range trading type of environment for the time being.

WTI CRUDE OIL, CRACK SPREAD, BACKWARDATION/CONTANGO, VOLATILITY (OVX)

image1.png


The Price of the Australian Dollar: AUD/USD, EUR/AUD, AUD/JPY, GBP/AUD

The Price of the Australian Dollar: AUD/USD, EUR/AUD, AUD/JPY, GBP/AUD

As the dust from the CPI data settles, the Australian dollar is beginning to look oversold as it approaches crucial support against some of its peers. While this wouldn’t necessarily imply a reversal of the downtrend, it could be enough to trigger at least a short-term pause.

AUD suffered losses across the board on Wednesday after Australian inflation eased in the first quarter. The reaction to the CPI data suggests the market is choosing to focus on the inflationtrend, rather than thepaceof the cool-down. For more discussion see “Australian Dollar Off Lows After CPI: What’s Next for AUD/USD?”, published April 26.

Australia’s CPI rose to 7% on-year in the January-March quarter, Vs 6.9% expected from 7.8% in the previous quarter. However, inflation eased last month to 6.3% on-year Vs 6.5% expected, down from 6.8% in February. While inflation is still running above the central bank’s target band of 2%-3%, there is evidence that the rise is slowing. Whether the cool-down in inflation would be enough to prompt a pause at RBA’s May meeting is a close call.

The Australian central bank left interest rates unchanged at its meeting in early April saying it wanted additional time to assess the spillover of previous rate hikes on the broader economy but left the door open for additional tightening. “It was important to be clear that monetary policy may need to be tightened at subsequent meetings”, said the minutes of the RBA April 4 meeting. The market is pricing in the RBA Cash Rate at 3.64% by August (Vs 3.6% now), up from 3.72% just before Wednesday’s CPI data.

Meanwhile, AUD’s slide is beginning to look stretched in the near term, according to technical charts.

EUR/AUD Weekly Chart

image1.png

Chart Created Using TradingView

EUR/AUD – Roadblock ahead

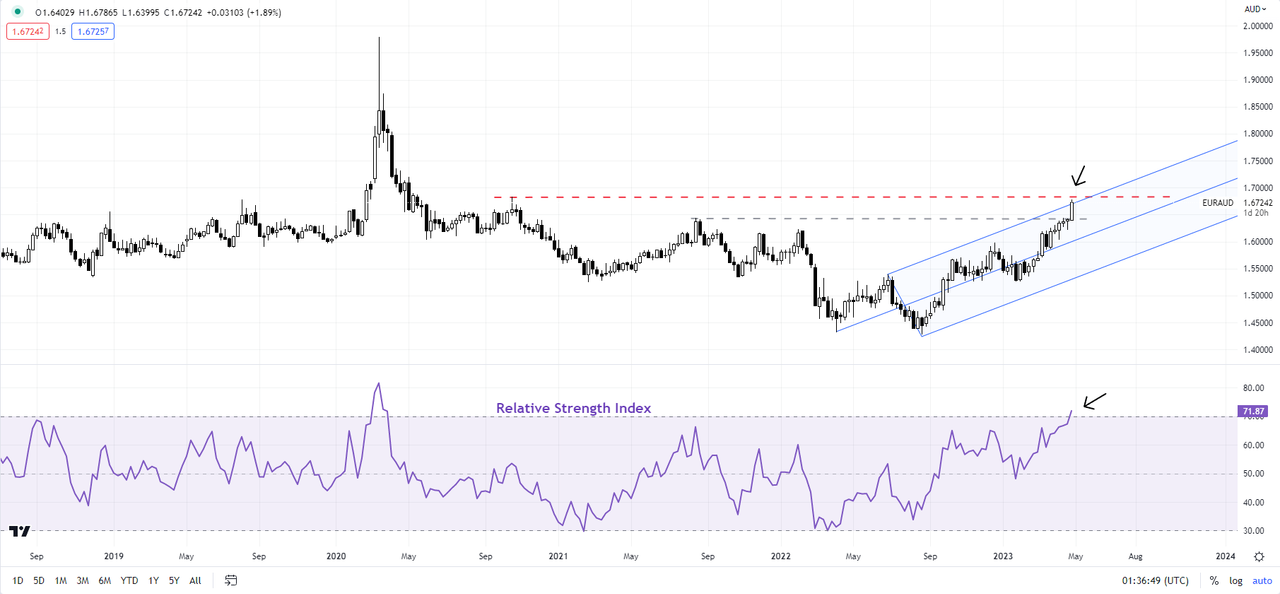
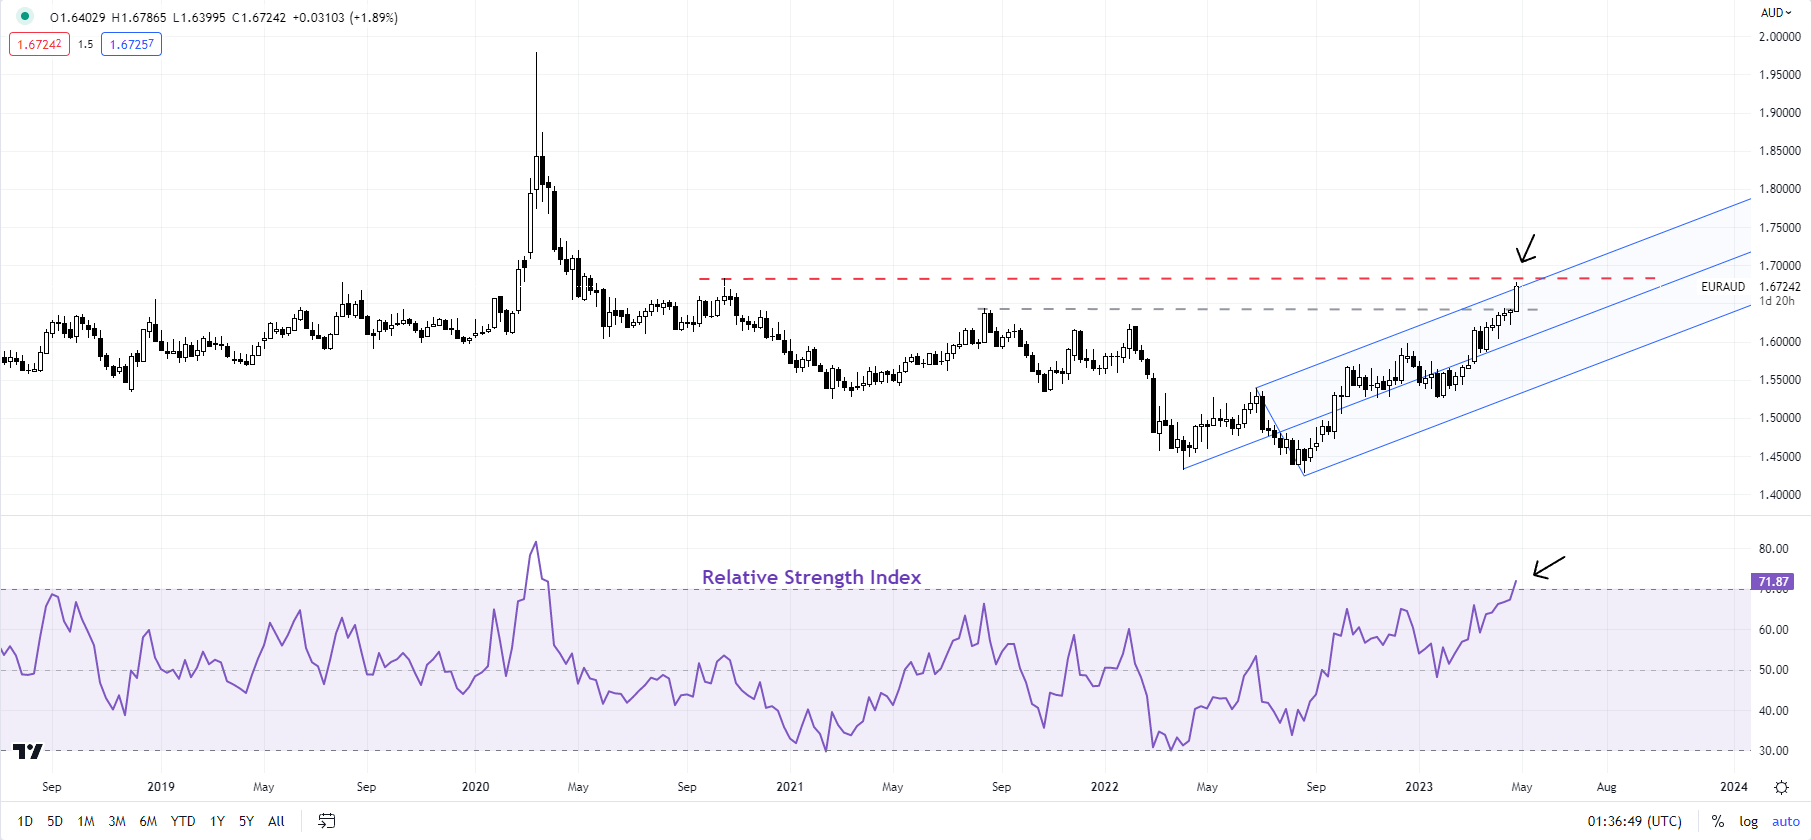
EUR/AUD is approaching quite a stiff barrier at the October 2020 high of 1.6825, roughly coinciding with the upper edge of a rising channel from mid-2022. The 14-week Relative Strength Index (RSI) is now in overbought territory, raising the chances of at least some consolidation given the pace and the extent of the rise since the start of 2023.

GBP/AUD Weekly Chart

image2.png

Chart Created Using TradingView

GBP/AUD: Overbought conditions emerging

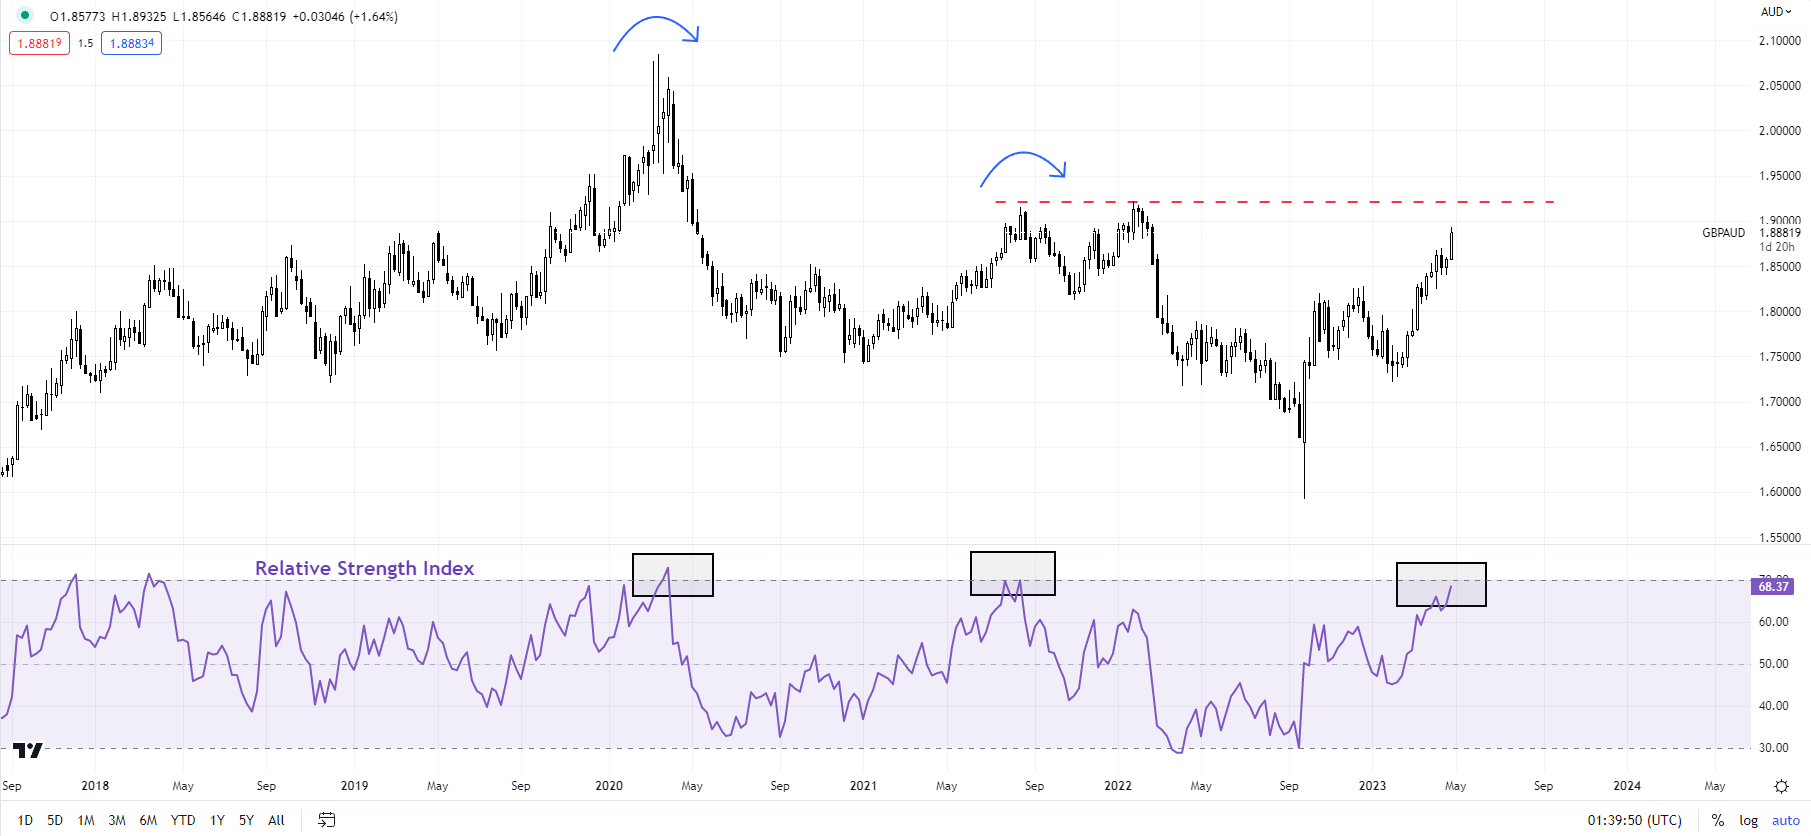
GBP/AUD is looking equally overbought – the 14-week RSI is nearing the key 70-mark. Previous instances of RSI around 70 have been associated with a turnaround in GBP/AUD. This is especially important now as the cross is nearing a tough hurdle on a horizontal trendline from 2021, at about 1.9150.

AUD/JPY Weekly Chart

image3.png

Chart Created Using TradingView

AUD/JPY: Downward momentum is slowing

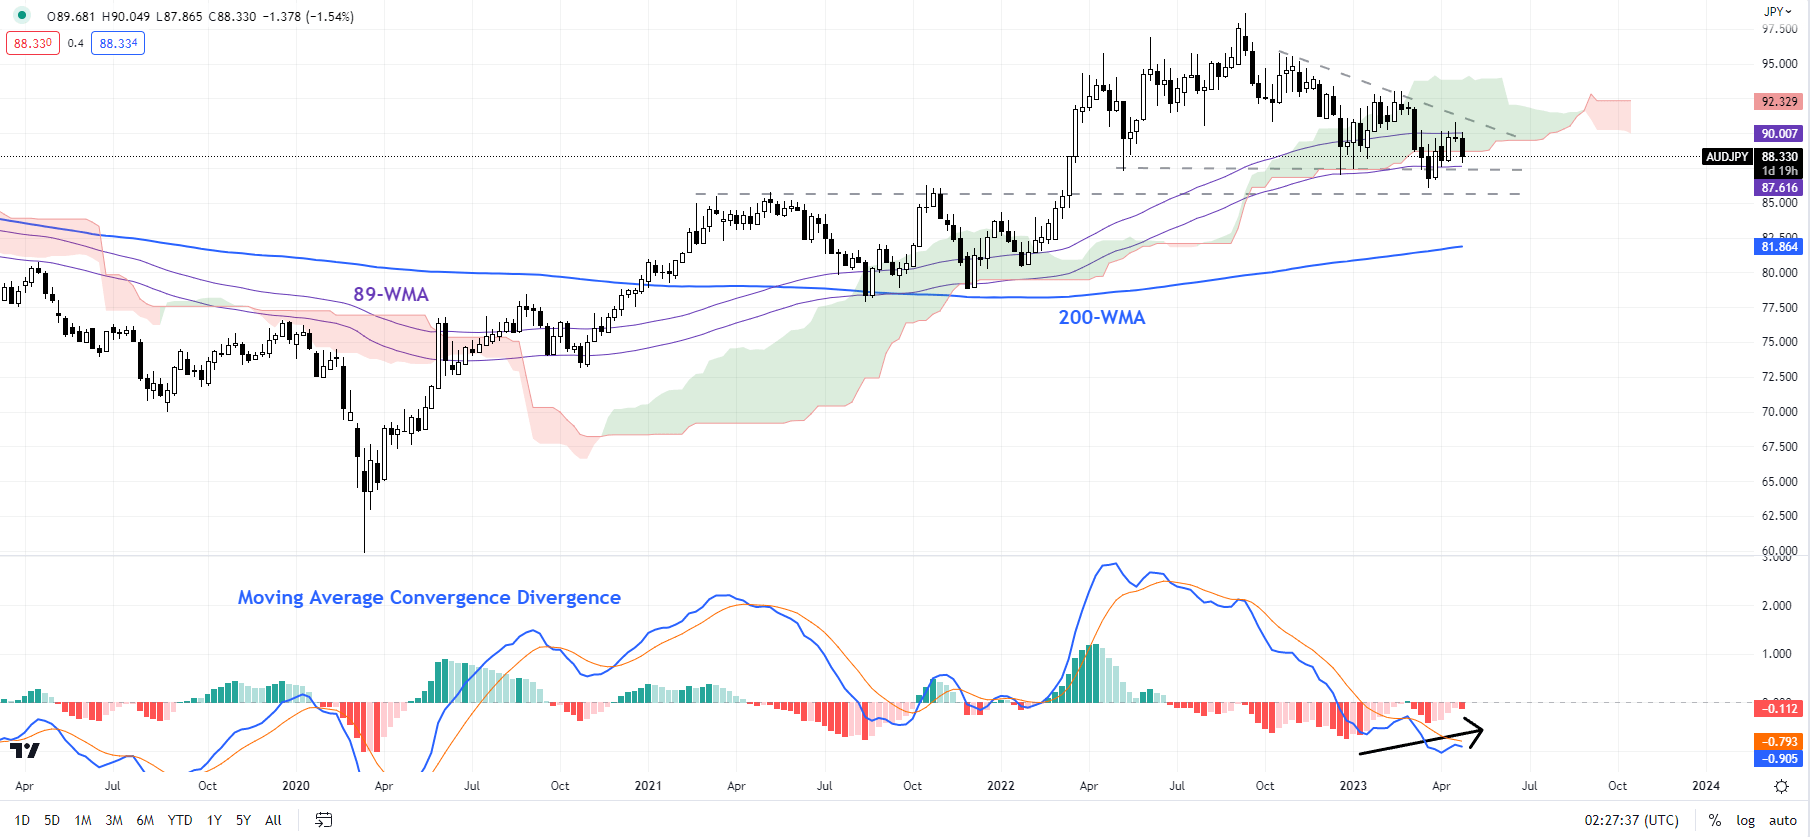
AUD/JPY remains in a bearish mode since last year, but the downtrend is losing steam. Momentum is clearly slowing as AUD/JPY has made new lows – see the weekly chart with the Moving Average Convergence Divergence indicator. However, AUD/JPY has quite a strong converged cushion which could be tough to crack at least in the first attempt. This includes the lower edge of the Ichimoku cloud on the weekly chart, the 89-week moving average, and a horizontal trendline from 2021 at about 85.75.

AUD/USD Daily Chart

image4.png

Chart Created Using TradingView

AUD/USD: No respite yet

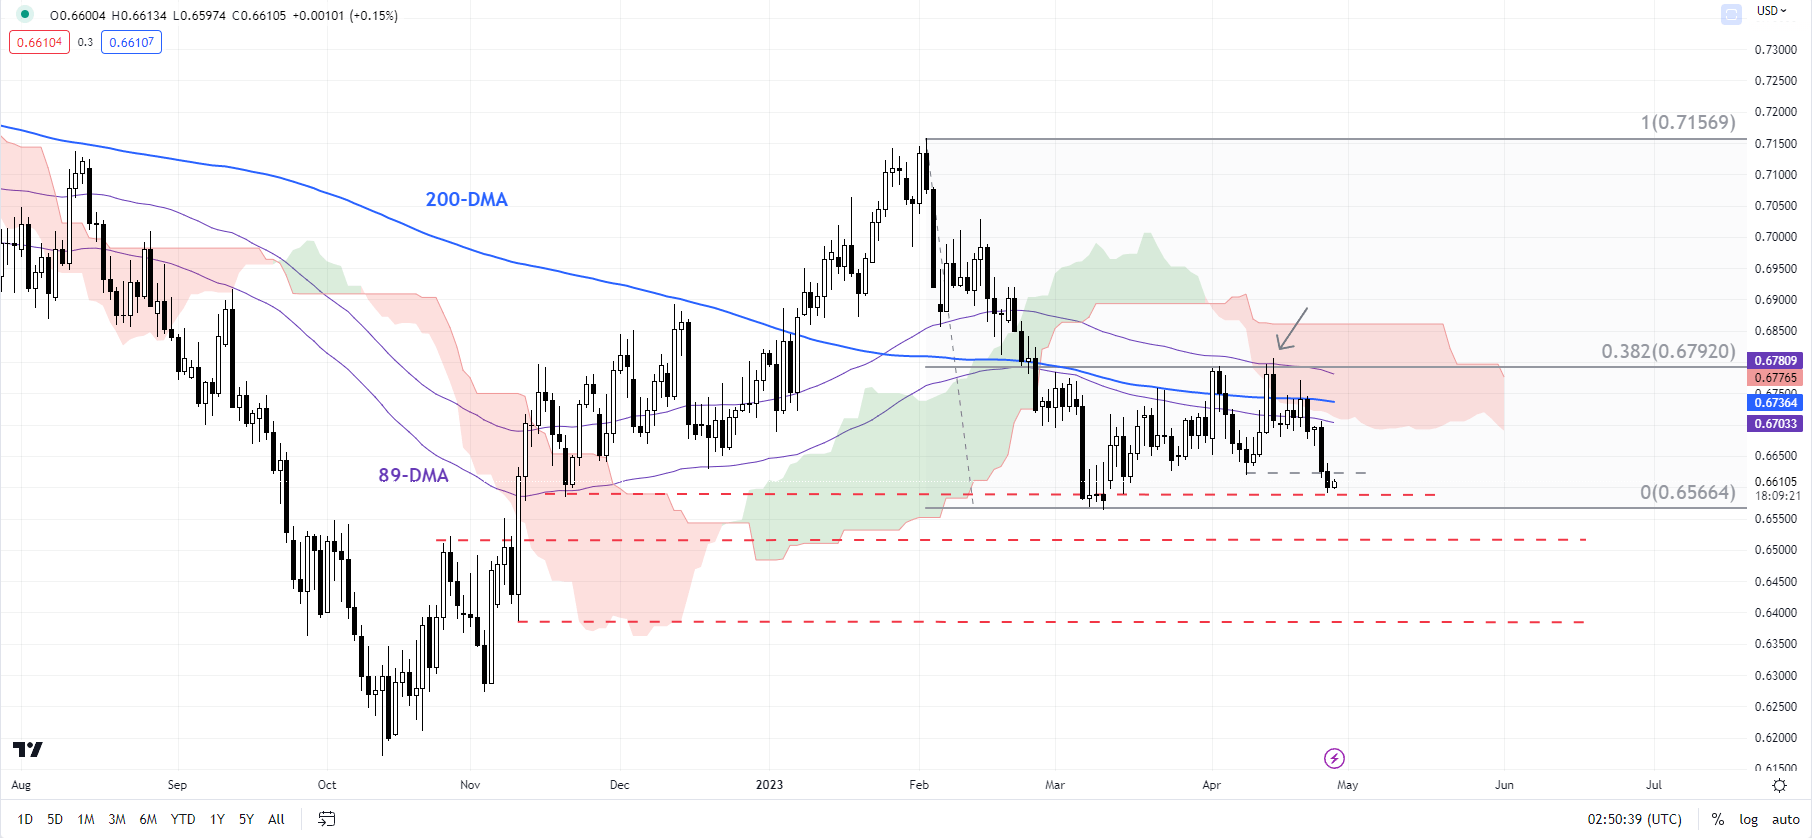
Perhaps of the above, AUD/USD looks the weakest. The rebound in March/April was feeble, eventually stalling at the 38.2% retracement of the February-March decline. AUD/USD is now testing a crucial floor on a horizontal trendline from the end of 2022 at about 0.6575. Any break below could pave the way toward 0.6520 followed by 0.6385, roughly the target of the minor double-top pattern (the April highs).

Gold prices fall as the US dollar relaxes ahead of important data. Where can I buy XAU/USD?

Gold prices fall as the US dollar relaxes ahead of important data. Where can I buy XAU/USD?

Gold price volatility remains somewhat moribund with the precious metal bouncing around either side US$ 2,000 an ounce so far today. Markets appear poised ahead of US GDP and Core PCE data due out later with the US Dollar steady so far today

Treasury yields have also steadied after sliding lower earlier in the week. The benchmark 10-year bond remains below 3.50%.

Real yields continue to languish with the same part of the curve near 1.20%, notably below the peak 1.36% seen last week.

G-10 currencies have had a subdued start to Thursday although the Kiwi Dollar managed to climb a touch higher, reclaiming territory above 0.6140.

After the North American close, Meta revised their revenue outlook for the second quarter to USD 32 billion, above the forecasts of 29.48 billion. Futures are pointing toward a modestly positive start for Wall Street later today.

APAC equities have also had a quiet session today. Deutsche Bank announced that they missed estimates for the first quarter. They have reported that revenue was € 2.36 for the period against € 2.53 billion anticipated.

The WTI futures contract is near US$ 77.50 bbl while the Brent contract is a touch below US$ 78 bbl at the time of going to print.

GOLD TECHNICAL ANALYSIS

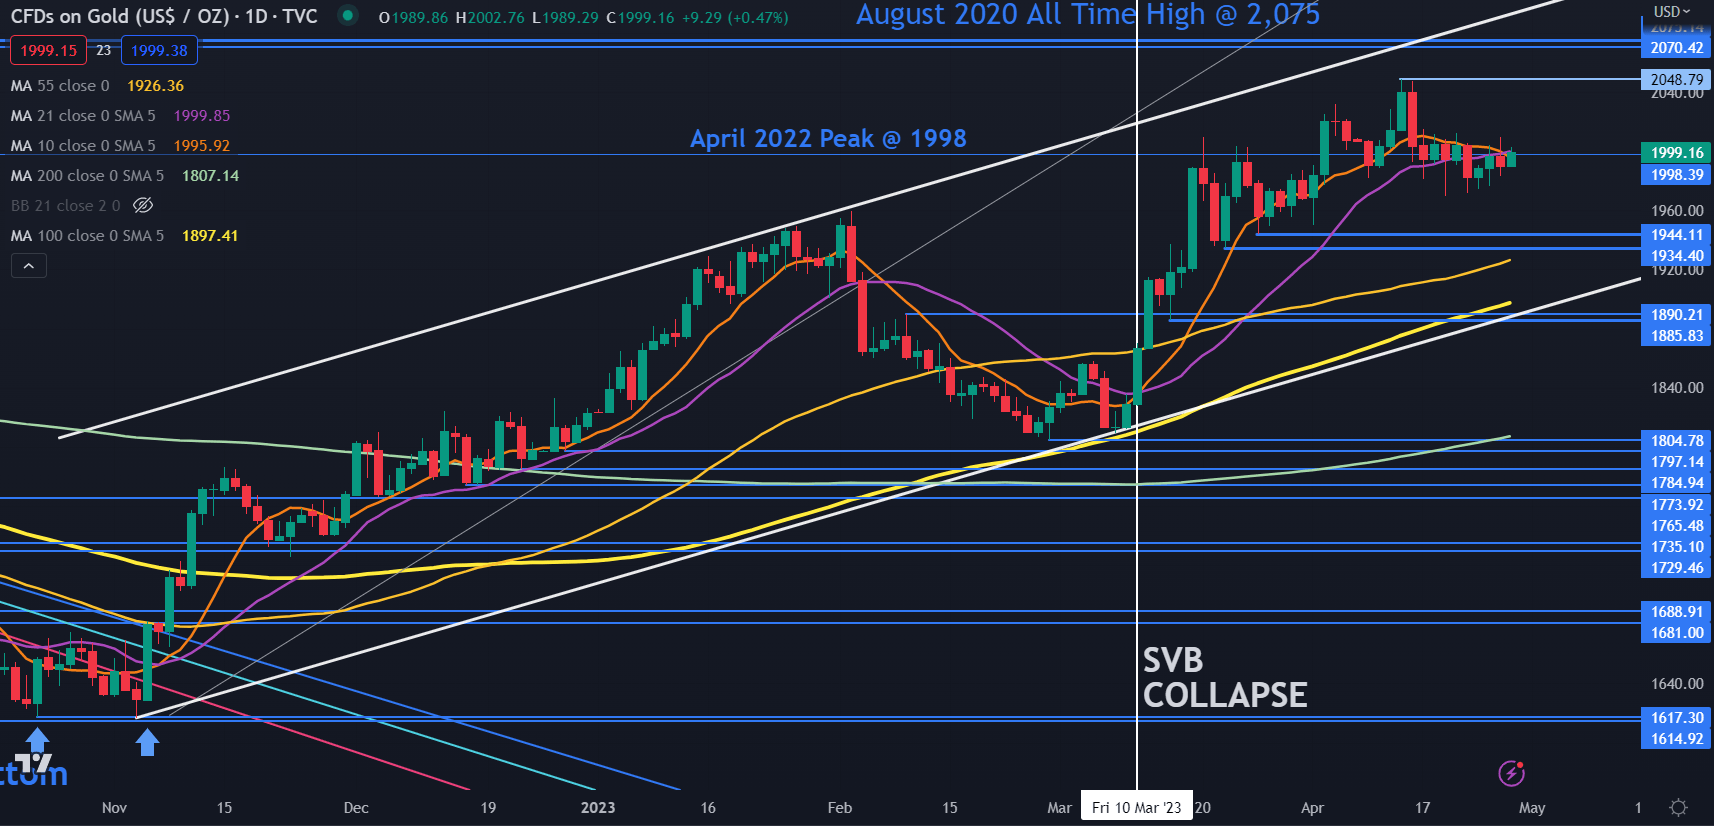
Gold has been caught in a 1934 – 2049 range for around six weeks and it remains within an ascending trend channel.

The lack of short-term direction is characterised by the price clustering near the 10- and 21-day Simple Moving Averages (SMA).

A breakout of the range might see momentum build for that direction but notable support and resistance levels lie on both sides.

To the topside, there is a Double Top created by the all-time high of 2075 in April 2020 and the failed attempt to break above it in March 2022 when a peak of 2070 was made.

On the downside, the 1885 – 1895 area appears to be a key support zone. Within it lies the 100-day SMA, a previos low, a breakpoint and an ascending tend line.

image1.png


EUR/USD stays above 1.1050 ahead of important US data.

EUR/USD stays above 1.1050 ahead of important US data.

EUR/USD is holding gains above 1.1050, consolidating the pullback from 13-month highs of 1.1095 on Thursday. The pair is underpinned by a broadly subdued US Dollar and cautious optimism. All eyes remain on the US advance Q1 GDP release.

Concerns about banking contagion risks in the United States (USD) resurfaced after the First Republic Bank reported more than $100 billion in customer withdrawals during the first quarter. This, along with the debt ceiling standoff and fears that the US economy is heading towards recession, revive speculations about an imminent rate cut by the Federal Reserve (Fed) later this year. This, in turn, weighed heavily on the Greenback and remained supportive of the pair’s overnight strong move up.

The shared currency, on the other hand, drew support from improving consumer sentiment in Germany – the Eurozone’s largest economy. In fact, the German Gfk Consumer Confidence improved from -29.3 to -25.7 in May. This marked the seventh increase in a row and indicated that consumer sentiment is gathering momentum. Adding to this, income Expectations rose from -24.3 to -10.7 and returned to the level before the start of the war in Ukraine for the first time. Apart from this, expectations for more rate hikes by the European Central Bank (ECB) in the coming months provided an additional boost and pushed the EUR/USD pair closer to the 1.1100 mark.

The USD bulls, meanwhile, failed to gain any respite from the upbeat release of US Durable Goods Orders, which surpassed even the most optimistic estimates and rose 3.2% in March. Excluding transportation, new orders increased by 0.3% during the reported month as against market expectations for a 0.2% fall and the 0.3% decline registered in February. The US Treasury bond yields, however, moved higher in reaction to the better-than-expected US macro data. This, along with the risk-off impulse, extended some support to the safe-haven Greenback, which, in turn, kept a lid on any further gains for the EUR/USD pair and led to a late pullback of over 50 pips.

Spot prices, however, attract fresh buying on Thursday and holds steady around mid-1.1000s during the Asian session as traders now await the release of the Advance Q1 GDP report from the US. The growth in the world’s largest economy is expected to have slowed to a 2.0% annualized pace during the January-March period from 2.6% in the previous quarter. Even a slight disappointment will be enough to prompt fresh selling around the USD and allow the EUR/USD pair to capitalize on its recent upward trajectory witnessed since mid-March. The focus will then shift to the flash German CPI and the US Core PCE Price Index – the Fed’s preferred inflation gauge – on Friday.

Concerns about banking contagion risks in the United States (USD) resurfaced after the First Republic Bank reported more than $100 billion in customer withdrawals during the first quarter. This, along with the debt ceiling standoff and fears that the US economy is heading towards recession, revive speculations about an imminent rate cut by the Federal Reserve (Fed) later this year. This, in turn, weighed heavily on the Greenback and remained supportive of the pair’s overnight strong move up.

The shared currency, on the other hand, drew support from improving consumer sentiment in Germany – the Eurozone’s largest economy. In fact, the German Gfk Consumer Confidence improved from -29.3 to -25.7 in May. This marked the seventh increase in a row and indicated that consumer sentiment is gathering momentum. Adding to this, income Expectations rose from -24.3 to -10.7 and returned to the level before the start of the war in Ukraine for the first time. Apart from this, expectations for more rate hikes by the European Central Bank (ECB) in the coming months provided an additional boost and pushed the EUR/USD pair closer to the 1.1100 mark.

The USD bulls, meanwhile, failed to gain any respite from the upbeat release of US Durable Goods Orders, which surpassed even the most optimistic estimates and rose 3.2% in March. Excluding transportation, new orders increased by 0.3% during the reported month as against market expectations for a 0.2% fall and the 0.3% decline registered in February. The US Treasury bond yields, however, moved higher in reaction to the better-than-expected US macro data. This, along with the risk-off impulse, extended some support to the safe-haven Greenback, which, in turn, kept a lid on any further gains for the EUR/USD pair and led to a late pullback of over 50 pips.

Spot prices, however, attract fresh buying on Thursday and holds steady around mid-1.1000s during the Asian session as traders now await the release of the Advance Q1 GDP report from the US. The growth in the world’s largest economy is expected to have slowed to a 2.0% annualized pace during the January-March period from 2.6% in the previous quarter. Even a slight disappointment will be enough to prompt fresh selling around the USD and allow the EUR/USD pair to capitalize on its recent upward trajectory witnessed since mid-March. The focus will then shift to the flash German CPI and the US Core PCE Price Index – the Fed’s preferred inflation gauge – on Friday.

Latest Euro: EUR/USD Holding Pattern Until Significant Data Releases

Latest Euro: EUR/USD Holding Pattern Until Significant Data Releases

The economic calendar is a trader’s best friend for the rest of the week as heavyweight data rolls out of the US and the Euro Area. Today we get the first look at US Q1 GDP at 12:30 GMT before a range of growth, inflation and jobs data hits the screens on Friday. Each one of these releases has the ability to move market sentiment and direction ahead of the weekend.

image1.pngimage2.png

The Euro continues to find strength from ongoing hawkish central bank chatter with next week’s ECB rate decision finely balanced. Some members see a 25 basis point as suitable while others are calling for 50 basis point hike. The ECB has already raised interest rates by 350 basis points since August 2022, at the fastest rate in the single block’s history, as the ECB tries to tackle stubbornly high inflation. Euro Area annual inflation is seen at 6.9% in March, down from 8.5% in February, but significantly higher than the central bank’s mandate of 2%.

EUR/USD trades on either side of 1.1050 ahead of today’s US GDP release with support seen around 1.0960 and resistance at 1.1096, Wednesday’s multi-month high. All three simple moving averages are in order and remain supportive, while a multi-week series of higher highs and higher lows remains in place.

EUR/USD Daily Price Chart – April 27, 2023

image3.png


Hong Kong Dollar Stake Will Endure Harsh Test by Uncontrolled Greenback

Hong Kong Dollar Stake Will Endure Harsh Test by Uncontrolled Greenback

The Hong Kong Dollar is among many currencies falling hard to its US rival as mounting global crises have burnished the Greenback’s popularity. With the US Federal Reserve in the midst of its most forceful program of interest-rate rises for a generation – far ahead of anyone else’s – it’s not hard to see why its currency is winning the popular vote.

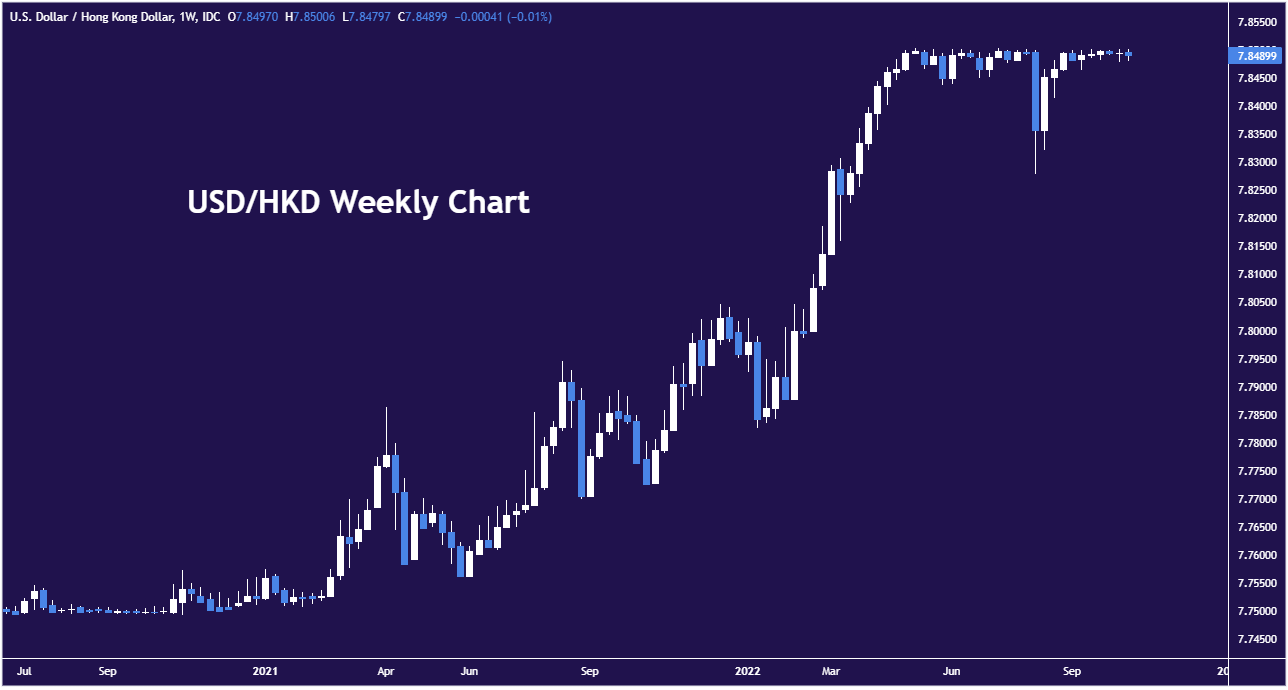
After an admittedly shaky start, the Fed appears willing and able to act more forcibly against resurgent inflation than any other major central bank. The US also enjoys mastery of its own commodity and energy supply chains to an extent unmatched by competitors. As Europe rues its reliance on Russian oil and gas and looks miserably to a chill winter, this US trump card further boosts the Dollar’s appeal. However, the Hong Kong Dollar is of course pegged to the US unit, adding a fascinating twist to this currency pair. We take a look at the peg, its history and future in light of this year’s trading action.

image1.png

Chart created with TradingView

What is the USD/HKD Peg?

The peg was originally a device for restoring confidence in the Hong Kong Dollar after a period of depreciation way back in 1983. The Hong Kong Monetary Authority (HKMA) had seen its currency slide to the point where a US Dollar bought more than nine of its Hong Kong counterparts, from around six at the start of the year. Faced with shaky confidence in local banks, and indeed public unrest, USD/HKD was pegged at 7.80, with the pair then permitted to trade between 7.75 and 7.85 since 2005.

Via a ‘linked-exchange system’, if USD/HKD rises to 7.86, the HKMA will buy Hong Kong Dollars from local bank reserves. This in turn causes a reduction in onshore banking liquidity and a rise in interest rates which attracts capital back to Hong Kong, boosting USD/HKD.

Conversely, if the US Dollar weakens, the HKMA sells Hong Kong Dollars to local banks. Liquidity then rises, interest rates fall and the local unit’s allure fades.

The design of the peg means that this is the major instrument of exchange rate control. The HKMA changes local interest rates in step with the US Federal Reserve, effectively abandoning its discretion to adjust monetary policy in response to changing economic conditions.

Foundational Trading Knowledge

Macro Fundamentals

Recommended by David Cottle

Start Course

Lack of Independence is the Problem Now

What the current peg defense means is that local interest rates are rising at a time when, all else being equal, the economy would cry out for the stimulation of lower borrowing costs.

Hong Kong has been hit hard by both China’s “zero Covid” quarantine policies and by Beijing’s clampdown on the freedoms supposedly guaranteed to Hong Kong after it was returned to Chinese rule in 1997.

The city has long been a tourist magnet but the prospect of long, rigidly enforced Covid quarantine and the reality of a visibly more oppressive local regime has understandably seen visitor numbers collapse.

Indeed, the Hong Kong Tourist Board reported a 97.4% drop in visitors last year, with little improvement expected in 2022 despite some relaxation of quarantine rules.

With numbers like these it’s not surprising that overall economic growth should sputter. The economy contracted by an annualized 1.3% in the second quarter of 2022, after sliding by 3.9% in the first.

These are not obviously conditions under which lending rates ought to be going up. However, under the territory’s currency rules, rise they must.

There’s some modest relief for borrowers in that local retail banks have so far not increased their own rates by much, but it seems all-but certain that they will, should base rates continue to rise. And this will be a problem. As Hong Kong’s Financial Secretary Paul Chan reportedly said back in July, “continuous rate hikes are disadvantageous for economic recovery.”

Still, Hong Kong Will Have to Bear It

Disadvantageous they certainly are, but there may be very little to be done about them now. Hong Kong is hardly the only jurisdiction in which unwelcome interest rate rises have been imposed. Global inflation’s surge has put more-or-less every major economy in a similar position.

The Hong Kong Dollar’s peg is the basis of financial stability in the territory. A stable currency is vital for an open economy like Hong Kong where international trade and maritime logistics are key business drivers. The currency appeals as safe and convertible (indeed it’s usually in the top ten of globally traded units) and is the bedrock of Hong Kong’s status as a financial center.

These concerns are likely to win out over short-term economic pain as they have for the peg’s entire 40-year history.

The Peg is Still Highly Credible

The peg enjoys enormous credibility within the foreign exchange market. Chan said back in July that the city’s “huge” foreign exchange reserves would be enough to defend it. They amount to around $440 billion dollars, with, presumably, Beijing’s multi-trillion-dollar reserves standing behind them.

Which brings us to China’s attitude, which is probably all-important.

Beijing seems content to let Hong Kong keep its place as China’s “window” onto international capital markets. That means keeping the Hong Kong Dollar’s link with the US Dollar. The latter is freely convertible in a way that the Yuan still isn’t. As a result, it plays a role in global trade that the Chinese currency’s proponents can still only dream about. The Greenback is also the pre-eminent global reserve currency and set to remain so. China is simply not about to concede enough control over its own currency to the whims of the global market.

That means Hong Kong will be better off with the US Dollar on the other side of its currency regime. For as long as Beijing agrees, the peg will endure.

Step by step on how to set up STOP loss on Copy trading

Step by step on how to set up STOP loss on Copy trading

kindly check the manual on how to set up STOP loss on copy trading

if you set it like 50 USD = it will be turned to zero
in case if the client placed 50 USD – it goes to zero immediately for the reason – that SL works only when the floating price is above the indicated in SL price
however it can not be +50 when you place it

when you edit it in the process of copying , so not only on the beginning – and your trades are already running in profits of 50 USD
then you may change it to 30 USD with + to limit your losses
but when you just joined – you have to indicate minus 50 (-50) on stop loss field

GBP/USD Technical Forecast: 1.2350 Support Key for Bullish Continuation

GBP/USD Technical Forecast: 1.2350 Support Key for Bullish Continuation

GBP/USD FUNDAMENTAL BACKDROP

GBPUSD is having an intriguing week thus far and largely at the mercy of overall market sentiment and the DXY. There has been a lack of concrete data on the economic docket to give GBP any sort of impetus as market sentiment and its effects on the dollar dominate.

This theme has continued this morning as GBPUSD has rallied higher and almost recovered the entire Tuesday selloff which touched a low of 1.2387. Sentiment improved overnight as markets appear satisfied that the news out of First Republic Bank in the United States would have no lasting impact on sentiment or trigger a fresh selloff in bank stocks. US earnings released after the US close yesterday also provided a further boost with the US dollar facing renewed selling as a result. US Tech giants Microsoft and Alphabet (Google) reported upbeat Q1 earnings.

Given that the theme of the week has been overall market sentiment and its effects on the US dollar I don’t expect that to change. A light day on the economic docket with US Durable Goods data the only notable release. I see potential for a retest of the recent highs by GBPUSD should market sentiment remain upbeat for the rest of the week. This coupled with a hawkish narrative surrounding the Bank of England (BoE) in light of last week’s UK inflation data should keep GBP supported ahead of the FOMC meeting next week.

image1.png

For all market-moving economic releases and events, see the DailyFX Calendar

TECHNICAL OUTLOOK AND FINAL THOUGHTS

On the daily timeframe GBPUSD has recovered the majority of yesterday’s selloff following an excellent start to the European session, trading at 1.2475. The technical picture for GBPUSD is rather murky with a lot of indecision of late as market sentiment has been the key driver.

Yesterday saw a bearish engulfing daily candle close which was also the worst day for the pair in just over a week. Instead of following through today however we have seen a complete reversal with the pair on the verge of a retest of the 1.2500 level once more. What’s even more baffling is that there was early signs of a head and shoulder pattern forming on the daily timeframe (See chart below) as well as a death cross on the H4 timeframe as the 50-day MA crossed below the 100-day MA.

Recent moves on GBPUSD have largely been driven by overall market sentiment with the range between 1.2350 and 1.2550 providing potential range bound opportunities (Click Here to learn more about range trading). A daily candle close above or below the range top or bottom is key for bullish continuation or a deeper correction to the downside.

Key Levels to Keep an Eye Out For

Resistance levels:

  • 1.2500
  • 1.2550
  • 1.2757

Key support levels:

  • 1.2400
  • 1.2350
  • 1.2200

GBP/USD FUNDAMENTAL BACKDROP

GBPUSD is having an intriguing week thus far and largely at the mercy of overall market sentiment and the DXY. There has been a lack of concrete data on the economic docket to give GBP any sort of impetus as market sentiment and its effects on the dollar dominate.

This theme has continued this morning as GBPUSD has rallied higher and almost recovered the entire Tuesday selloff which touched a low of 1.2387. Sentiment improved overnight as markets appear satisfied that the news out of First Republic Bank in the United States would have no lasting impact on sentiment or trigger a fresh selloff in bank stocks. US earnings released after the US close yesterday also provided a further boost with the US dollar facing renewed selling as a result. US Tech giants Microsoft and Alphabet (Google) reported upbeat Q1 earnings.

Trade Smarter – Sign up for the DailyFX Newsletter

Receive timely and compelling market commentary from the DailyFX team

Subscribe to Newsletter

Given that the theme of the week has been overall market sentiment and its effects on the US dollar I don’t expect that to change. A light day on the economic docket with US Durable Goods data the only notable release. I see potential for a retest of the recent highs by GBPUSD should market sentiment remain upbeat for the rest of the week. This coupled with a hawkish narrative surrounding the Bank of England (BoE) in light of last week’s UK inflation data should keep GBP supported ahead of the FOMC meeting next week.

image1.png

For all market-moving economic releases and events, see the DailyFX Calendar

TECHNICAL OUTLOOK AND FINAL THOUGHTS

On the daily timeframe GBPUSD has recovered the majority of yesterday’s selloff following an excellent start to the European session, trading at 1.2475. The technical picture for GBPUSD is rather murky with a lot of indecision of late as market sentiment has been the key driver.

Yesterday saw a bearish engulfing daily candle close which was also the worst day for the pair in just over a week. Instead of following through today however we have seen a complete reversal with the pair on the verge of a retest of the 1.2500 level once more. What’s even more baffling is that there was early signs of a head and shoulder pattern forming on the daily timeframe (See chart below) as well as a death cross on the H4 timeframe as the 50-day MA crossed below the 100-day MA.

Recent moves on GBPUSD have largely been driven by overall market sentiment with the range between 1.2350 and 1.2550 providing potential range bound opportunities (Click Here to learn more about range trading). A daily candle close above or below the range top or bottom is key for bullish continuation or a deeper correction to the downside.

Key Levels to Keep an Eye Out For

Resistance levels:

  • 1.2500
  • 1.2550
  • 1.2757

Key support levels:

  • 1.2400
  • 1.2350
  • 1.2200

GBP/USD Daily Chart – April 26, 2023

image2.png

Source: TradingView

Microsoft and Alphabet Deliver Strong Results; Tech Earnings Buoy S&P 500 Futures

Microsoft and Alphabet Deliver Strong Results; Tech Earnings Buoy S&P 500 Futures

U.S. equity futures rose in extended trading after two of the world’s largest technology companies posted better-than-forecast financial results for the previous quarter, with S&P 500 contracts rebounding and erasing some of their regular-session losses.

Microsoft (MSFT) reported earnings per share of $2.45 on revenue of $52.9 billion for its fiscal third quarter ended March 31, up 10% for the former and 7% for the latter compared to the same period last year. Both metrics topped consensus estimates by a decent margin.

In terms of drivers, the intelligent cloud division was the most important source of business growth, notching a 16% y-o-y gain, slightly below the previous quarter’s 18%. Meanwhile, the personal computing unit continued to perform poorly, declining 9% in the face of weaker demand for PCs and related software.

Elsewhere, Alphabet (GOOG) announced EPS of $1.17 on sales of $69.79 billion for the first three months of 2023, with top- and bottom-lines also surprising to the upside as advertising sales began to stabilize following recent weakness. Google’s parent company also announced a $70 billion share buyback.

image1.png

MARKET REACTION

Alphabet shares (GOOGL) rallied sharply after hours, jumping as much as 4.5%, bolstered by better-than-forecast quarterly numbers. Microsoft’s stock prices also spiked higher, up 4.3% in extended trading in response to the company’s encouraging financial performance during the first three months of the year.

With two of the largest mega-cap firms posting favorable results, investor sentiment could improve in the near term, supporting the tech sector and the broader market. Against this backdrop, the S&P 500 may have fewer obstacles to resuming its rebound in the coming days and weeks.

S&P 500 FUTURES, GOOG AND MSFT 5-MINUTE CHART

A screenshot of a computer  Description automatically generated with medium confidence